Development of a Generic Domestic Water Security Index, and Its Application in Addis Ababa, Ethiopia


Abstract
1. Introduction
2. Development of a Domestic Water Security Framework
2.1. Definition of Domestic Water Security
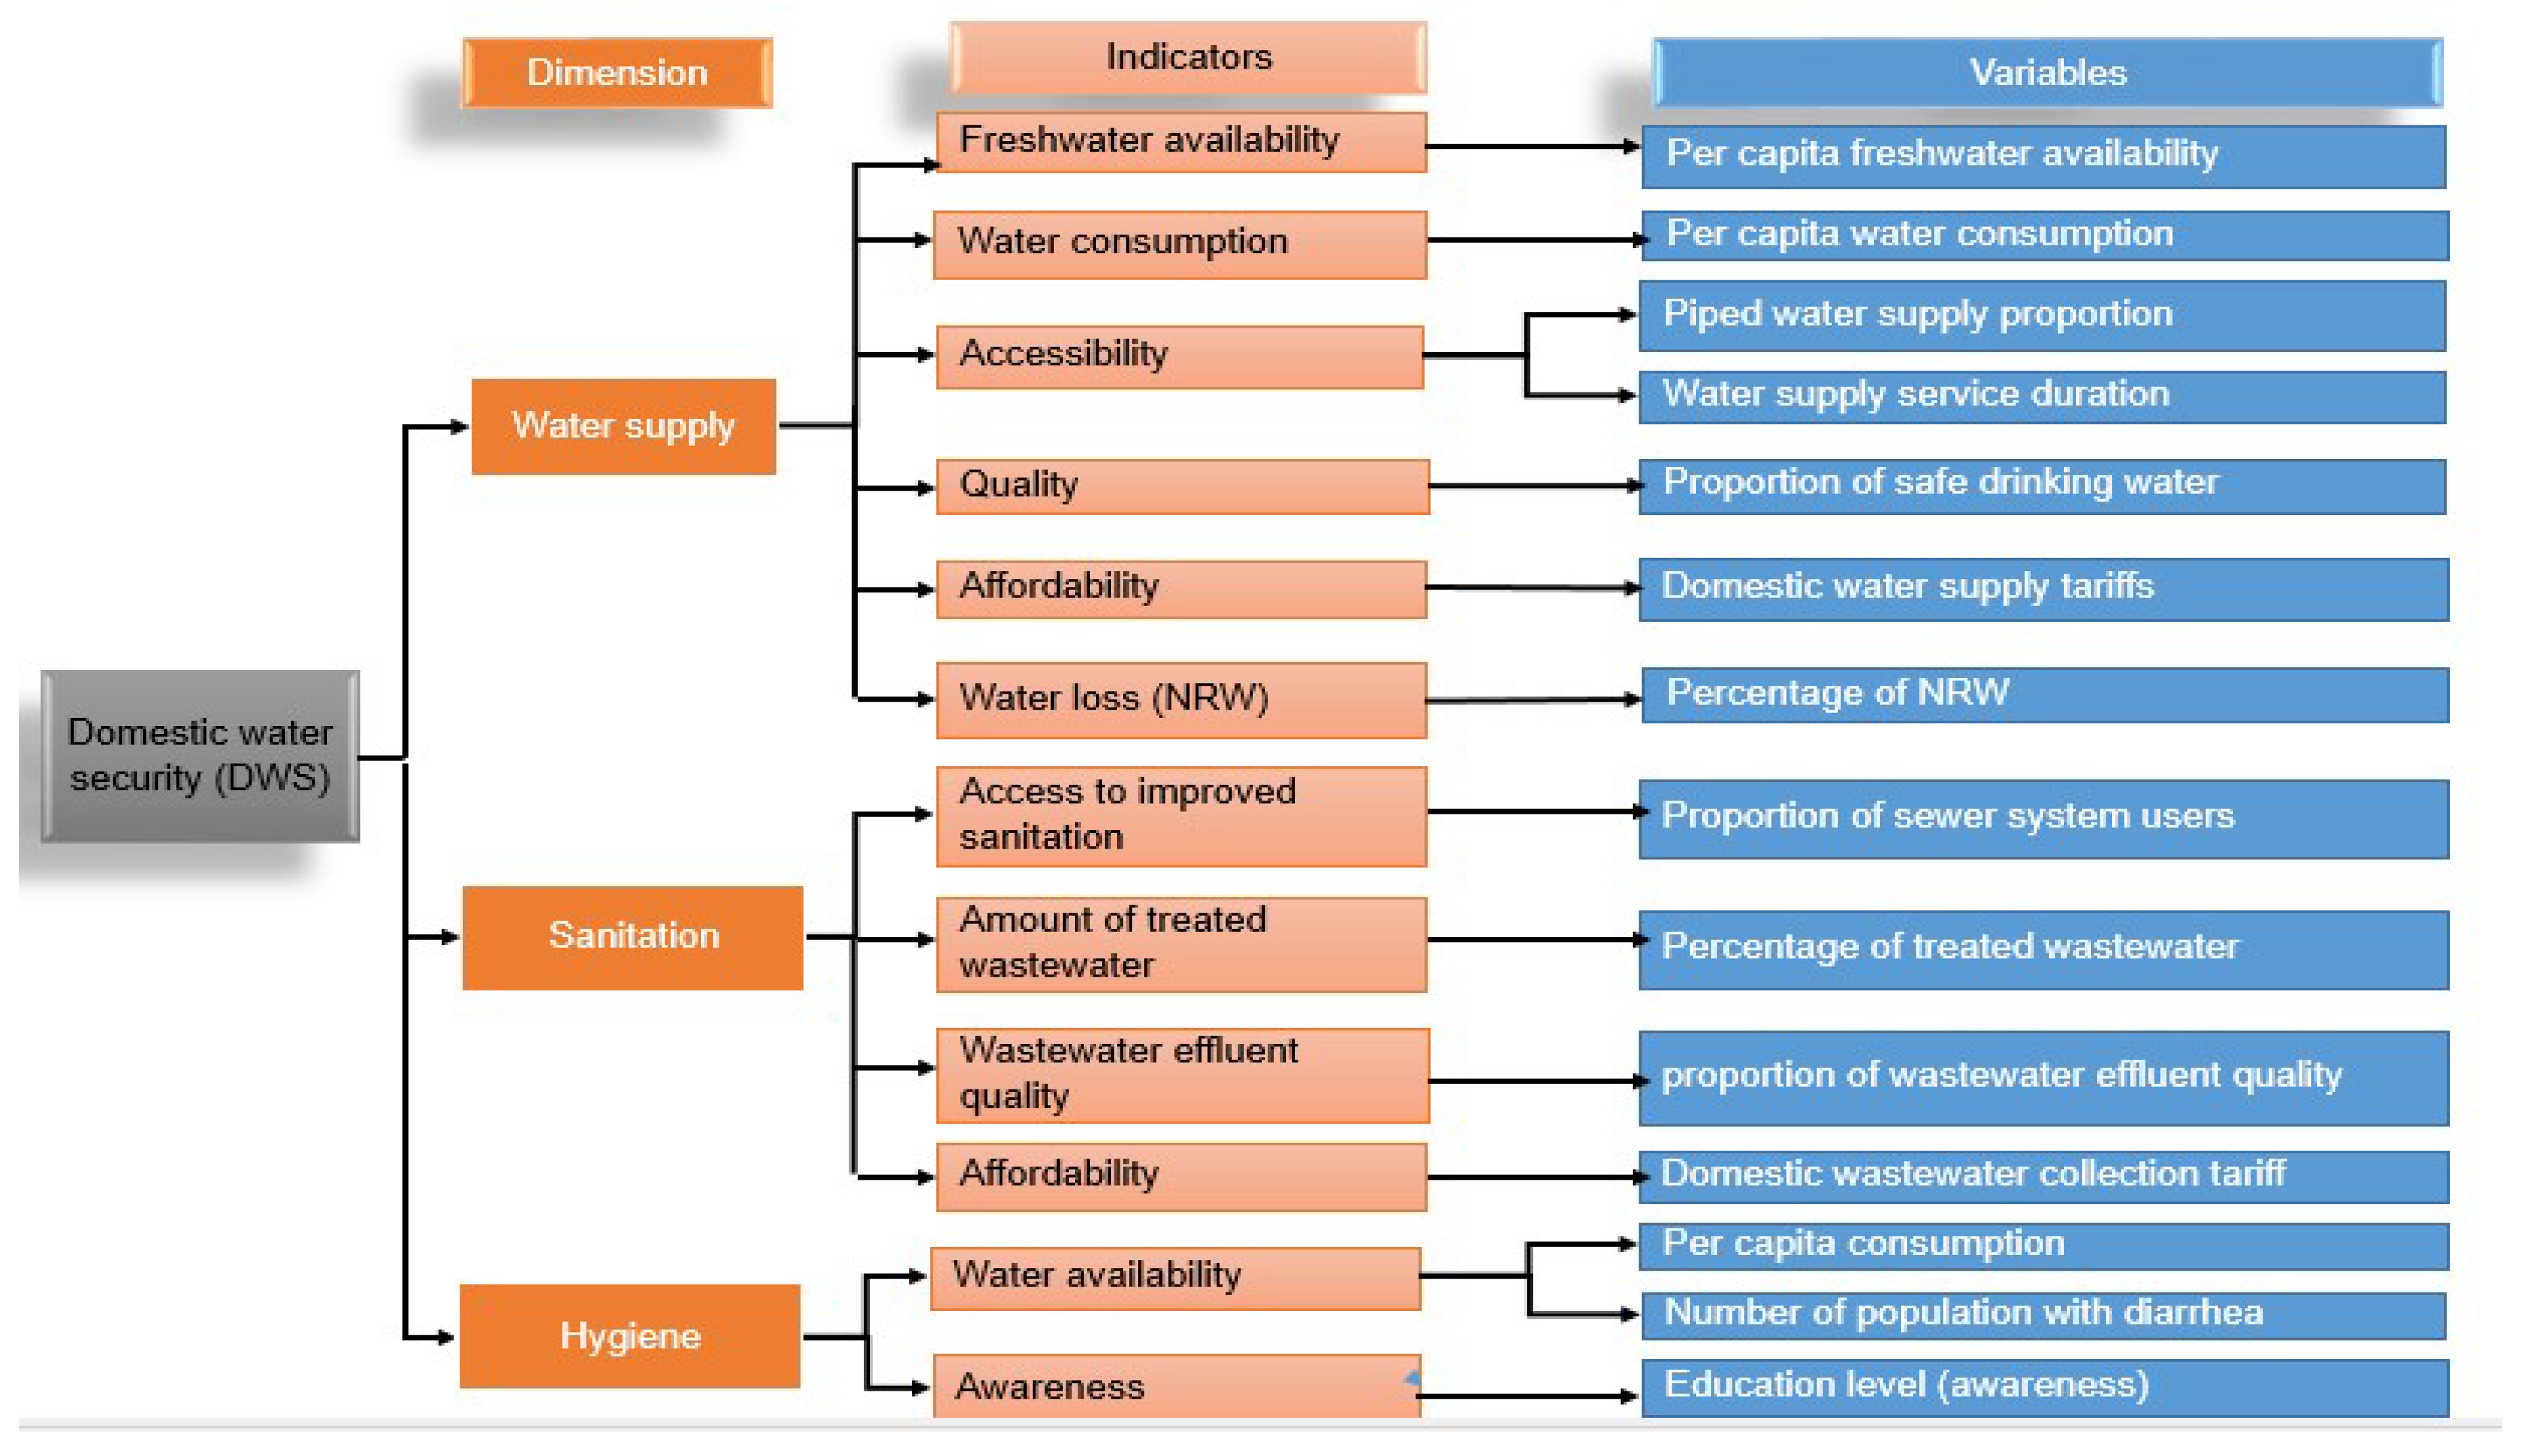
2.2. Structure of the Framework
2.3. Water Supply Dimension
2.3.1. Per Capita Freshwater Availability
2.3.2. Per Capita Water Consumption
2.3.3. The Proportion of Piped-Water Supply Users with Respect to the Total Population
2.3.4. Water Supply Service Duration per Day
2.3.5. The Proportion of Safe Drinking Water Supply Based on Drinking Water Quality Standards
2.3.6. Affordability of Domestic Water Supply Tariff
2.3.7. Percentage of Non-Revenue Water (NRW)
2.4. Sanitation Dimension
2.4.1. The Proportion of Customers Connected to the Sewer System
2.4.2. Percentage of Treated Wastewater
2.4.3. Proportion of Wastewater Effluent Quality Based on Wastewater Discharge Quality Standards
2.4.4. Affordability of Domestic Wastewater Collection Tariff
2.5. Hygiene Dimension
2.5.1. Water Availability for Hygiene (per Capita Water Consumption)
2.5.2. Percentage of Population with Diarrhea
2.5.3. Education Level
2.6. Data
- Capacity of the water supply sources;
- Number of registered customers who use the piped water supply;
- The water supply service duration of each branch (hours/day);
- Bill data of each branch to determine the amount of water actually consumed;
- Water quality report of treatment plants;
- Tariff for domestic water supply;
- Capacity of wastewater treatment plants;
- Number of sewer system users.
2.7. Representation and Interpretation of the Domestic Water Security Index
2.8. Measuring Domestic Water Security
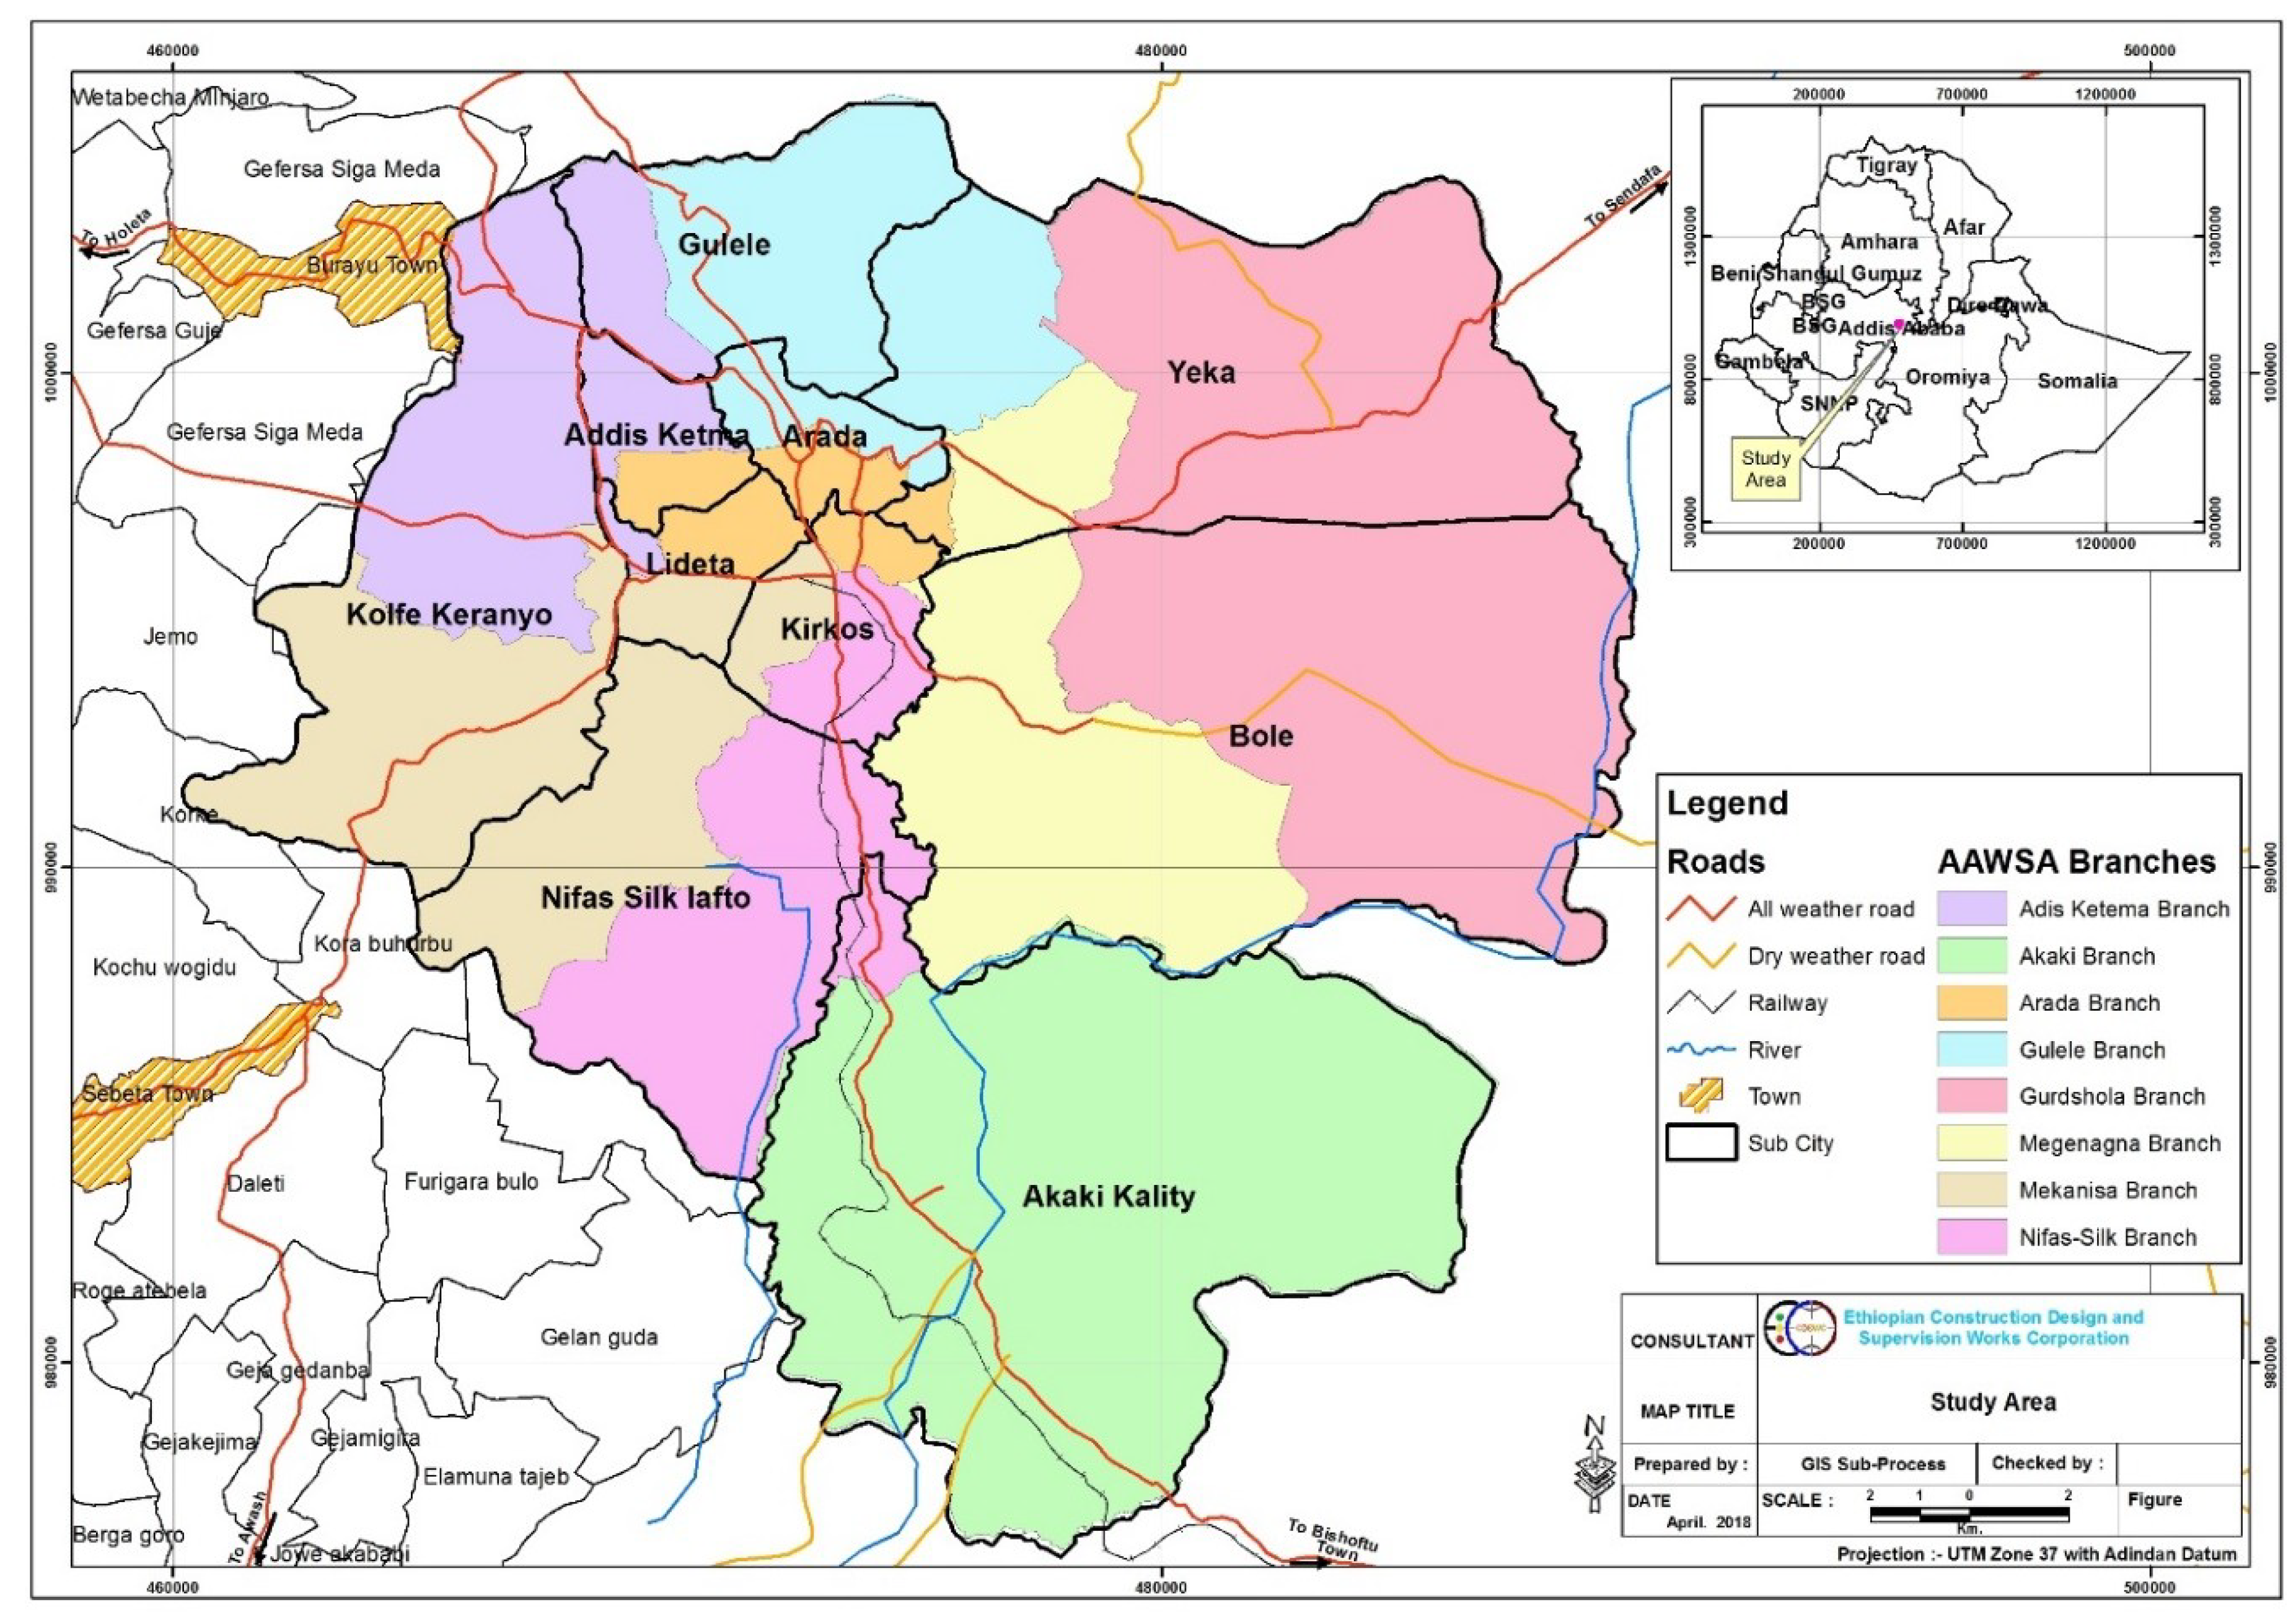
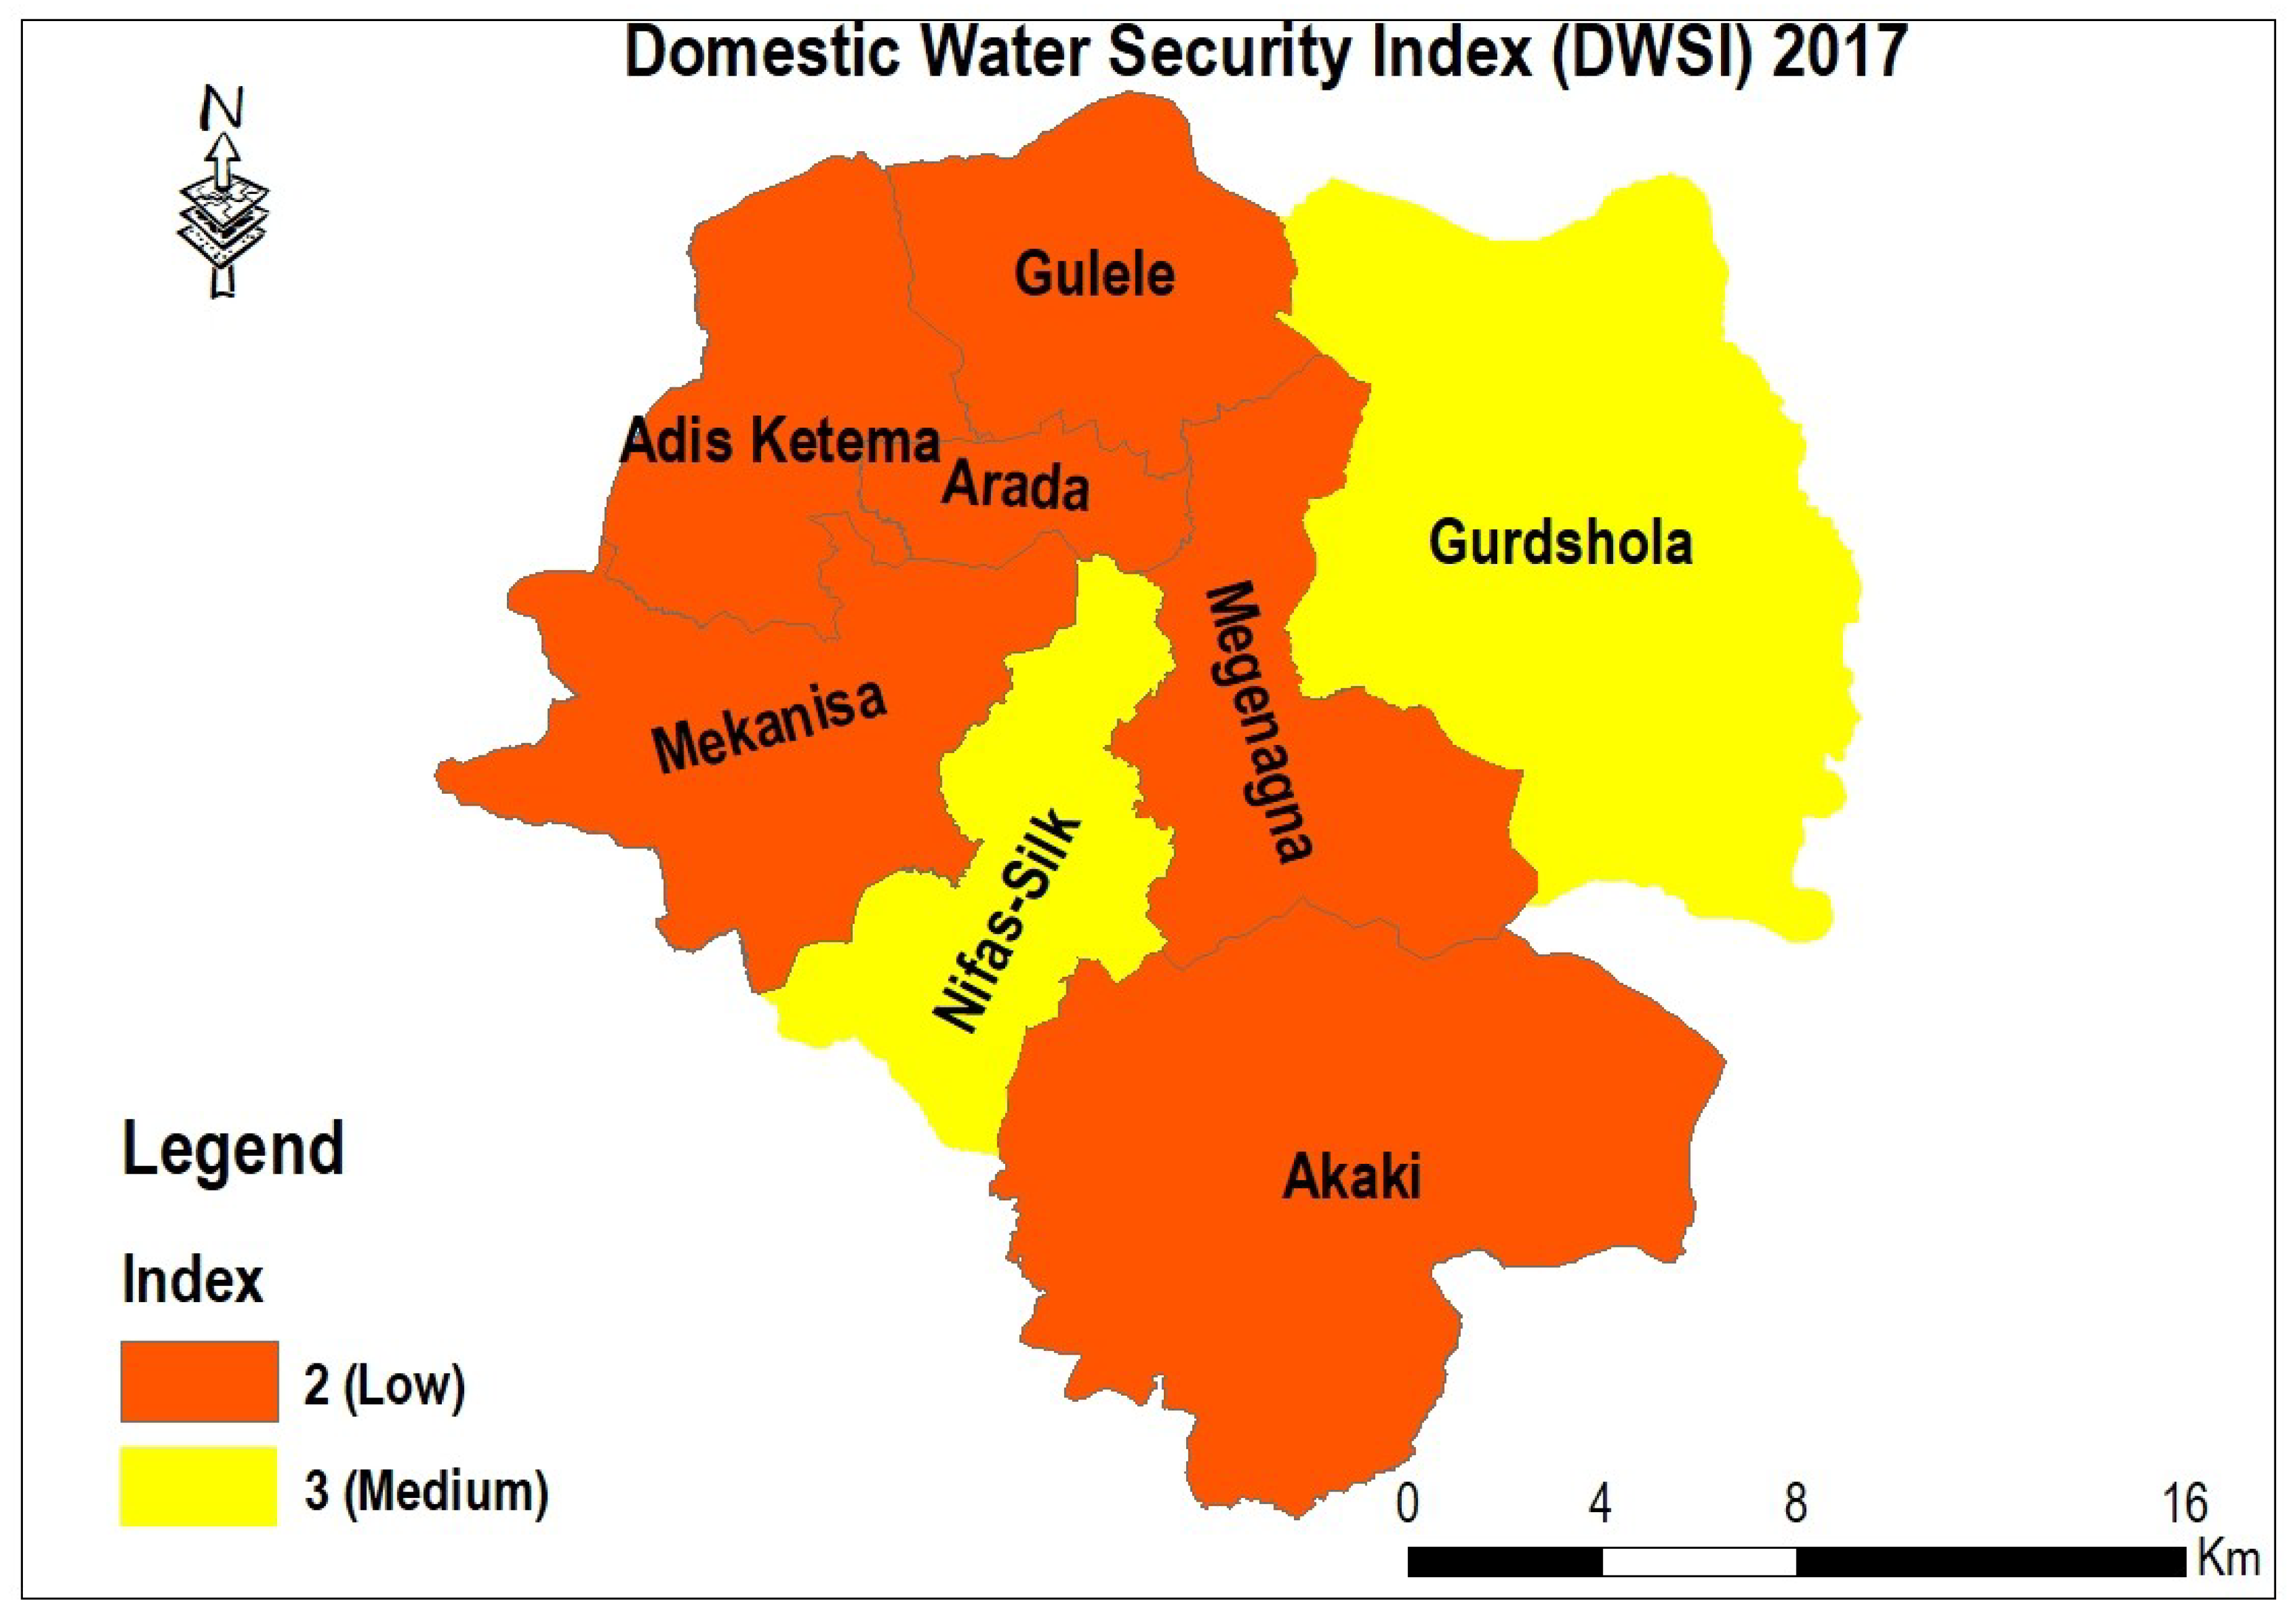
3. Application of the Domestic Water Security Index
4. Application and Results
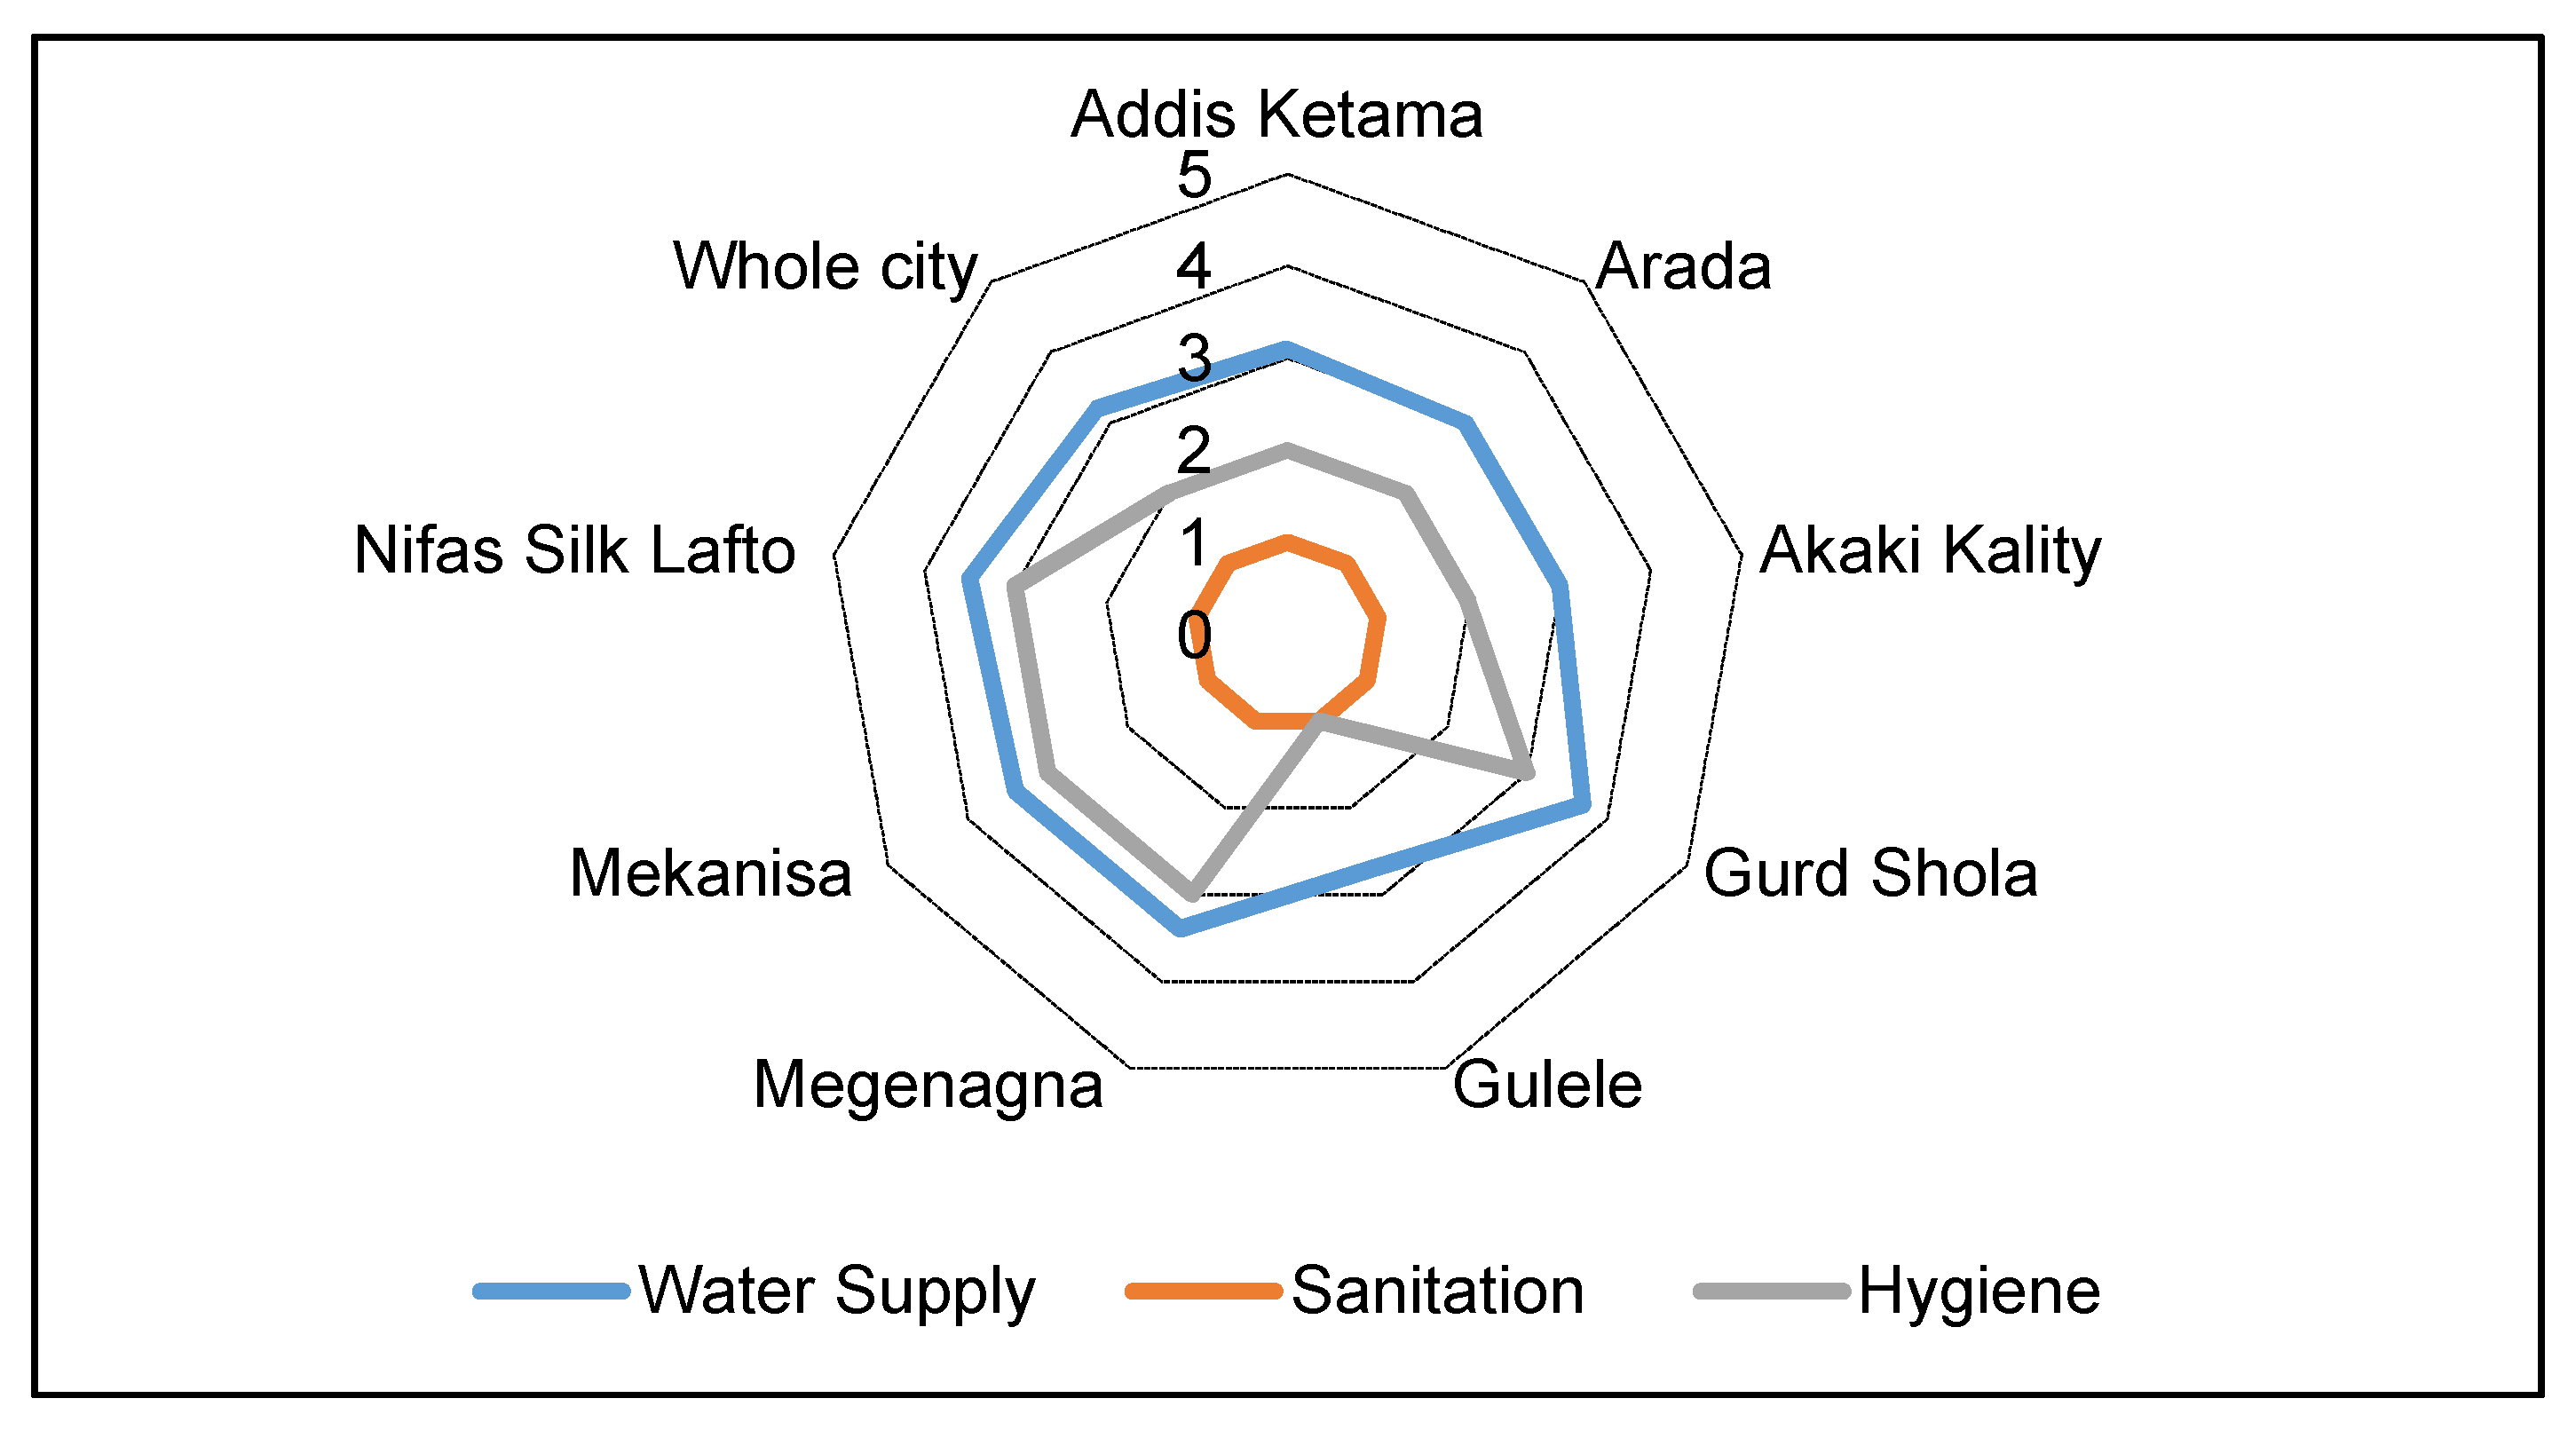
4.1. Water Supply Dimension
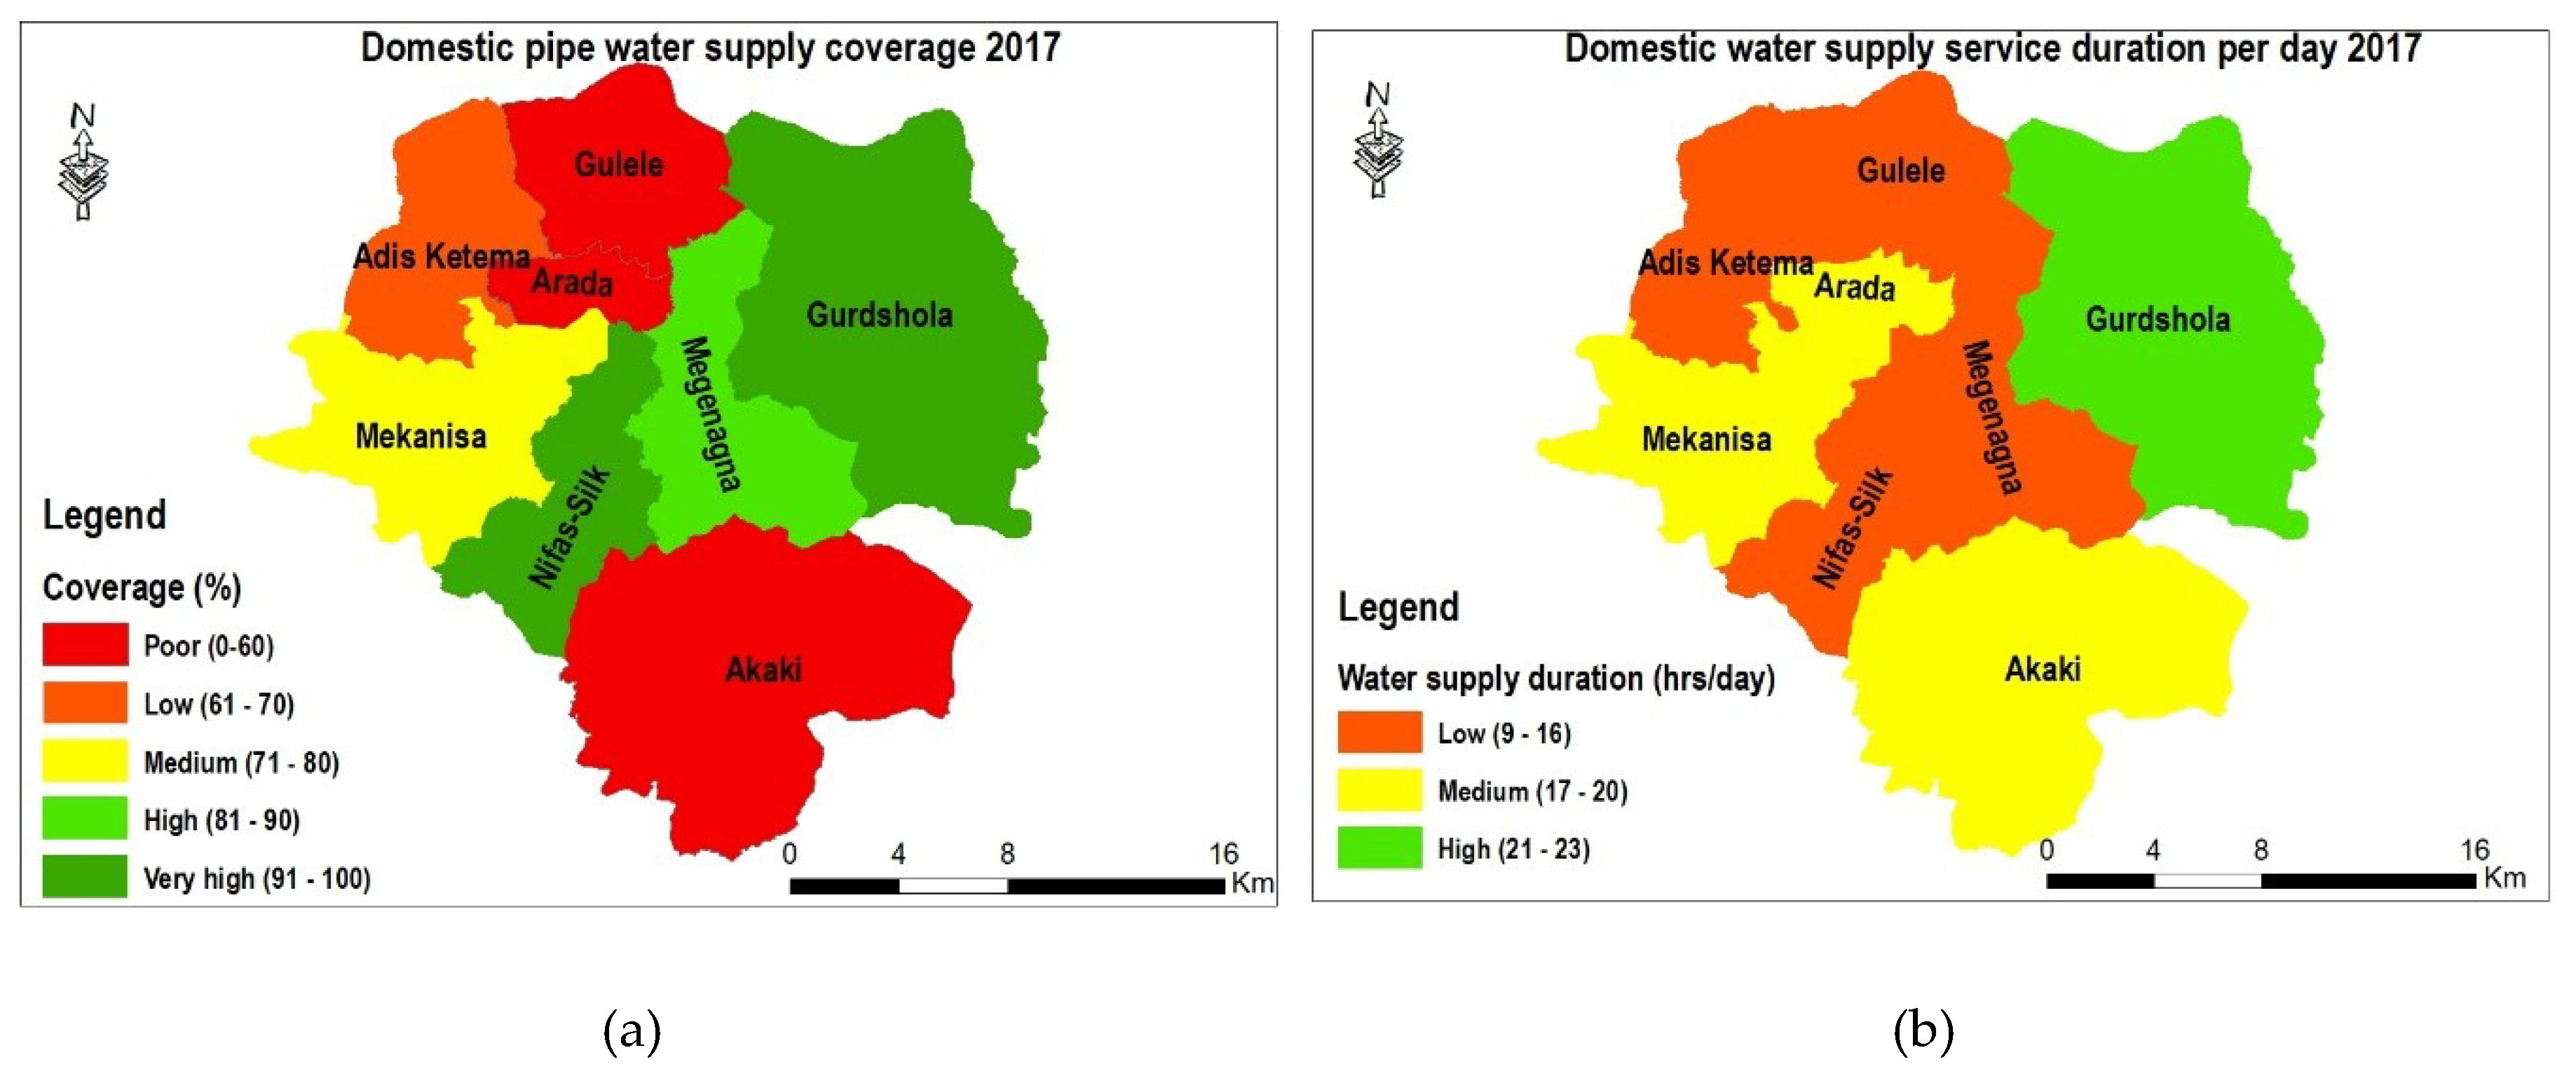
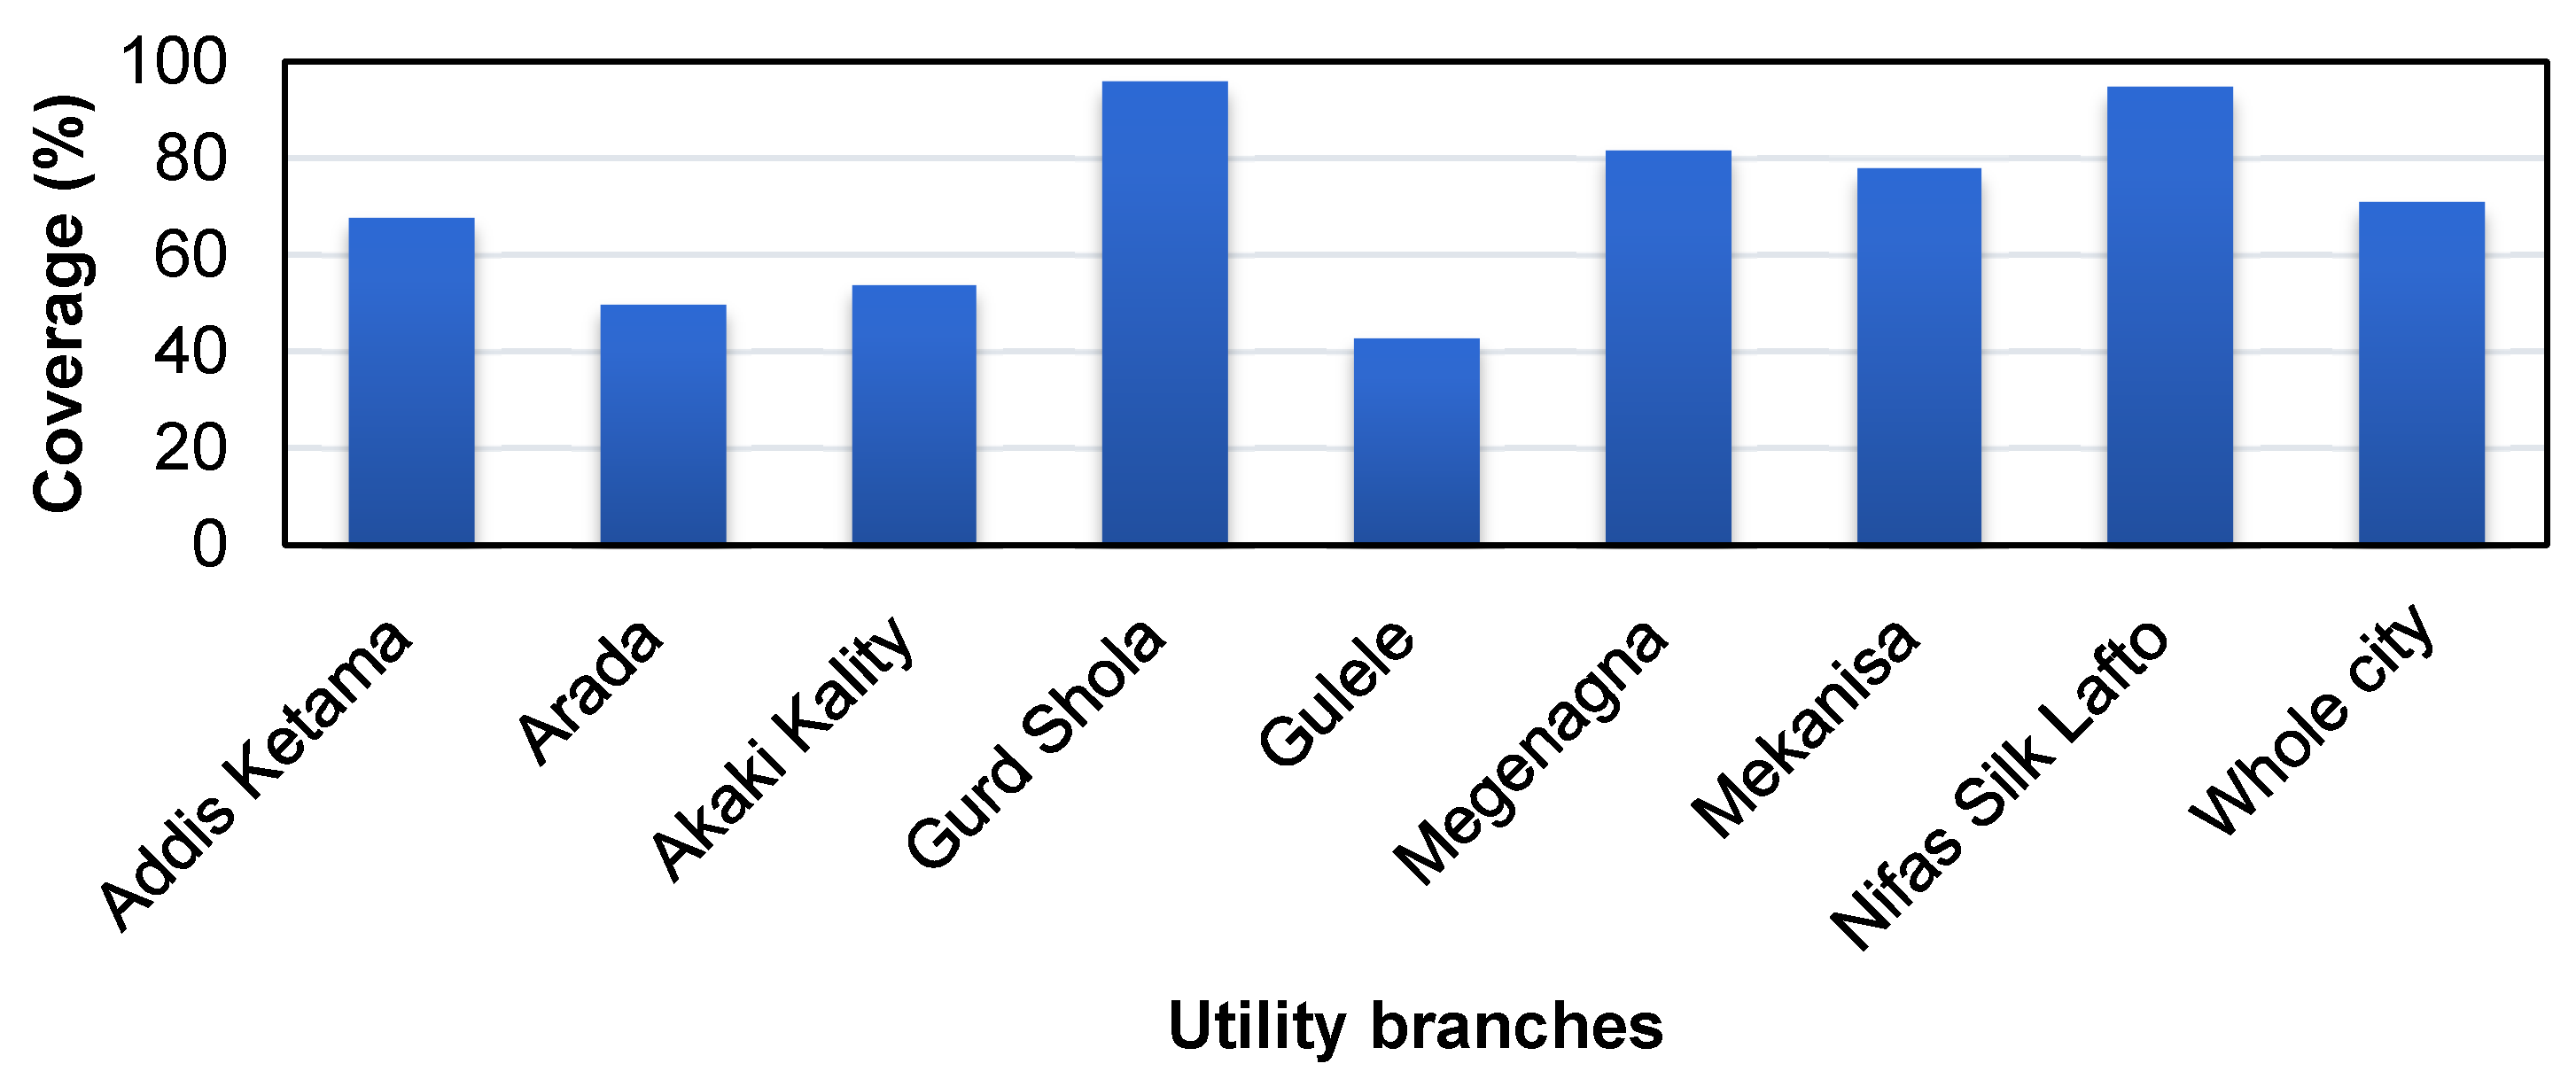
4.1.1. The Proportion of Piped Water Supply Users to the Total Population
4.1.2. Water Supply Service Duration per Day
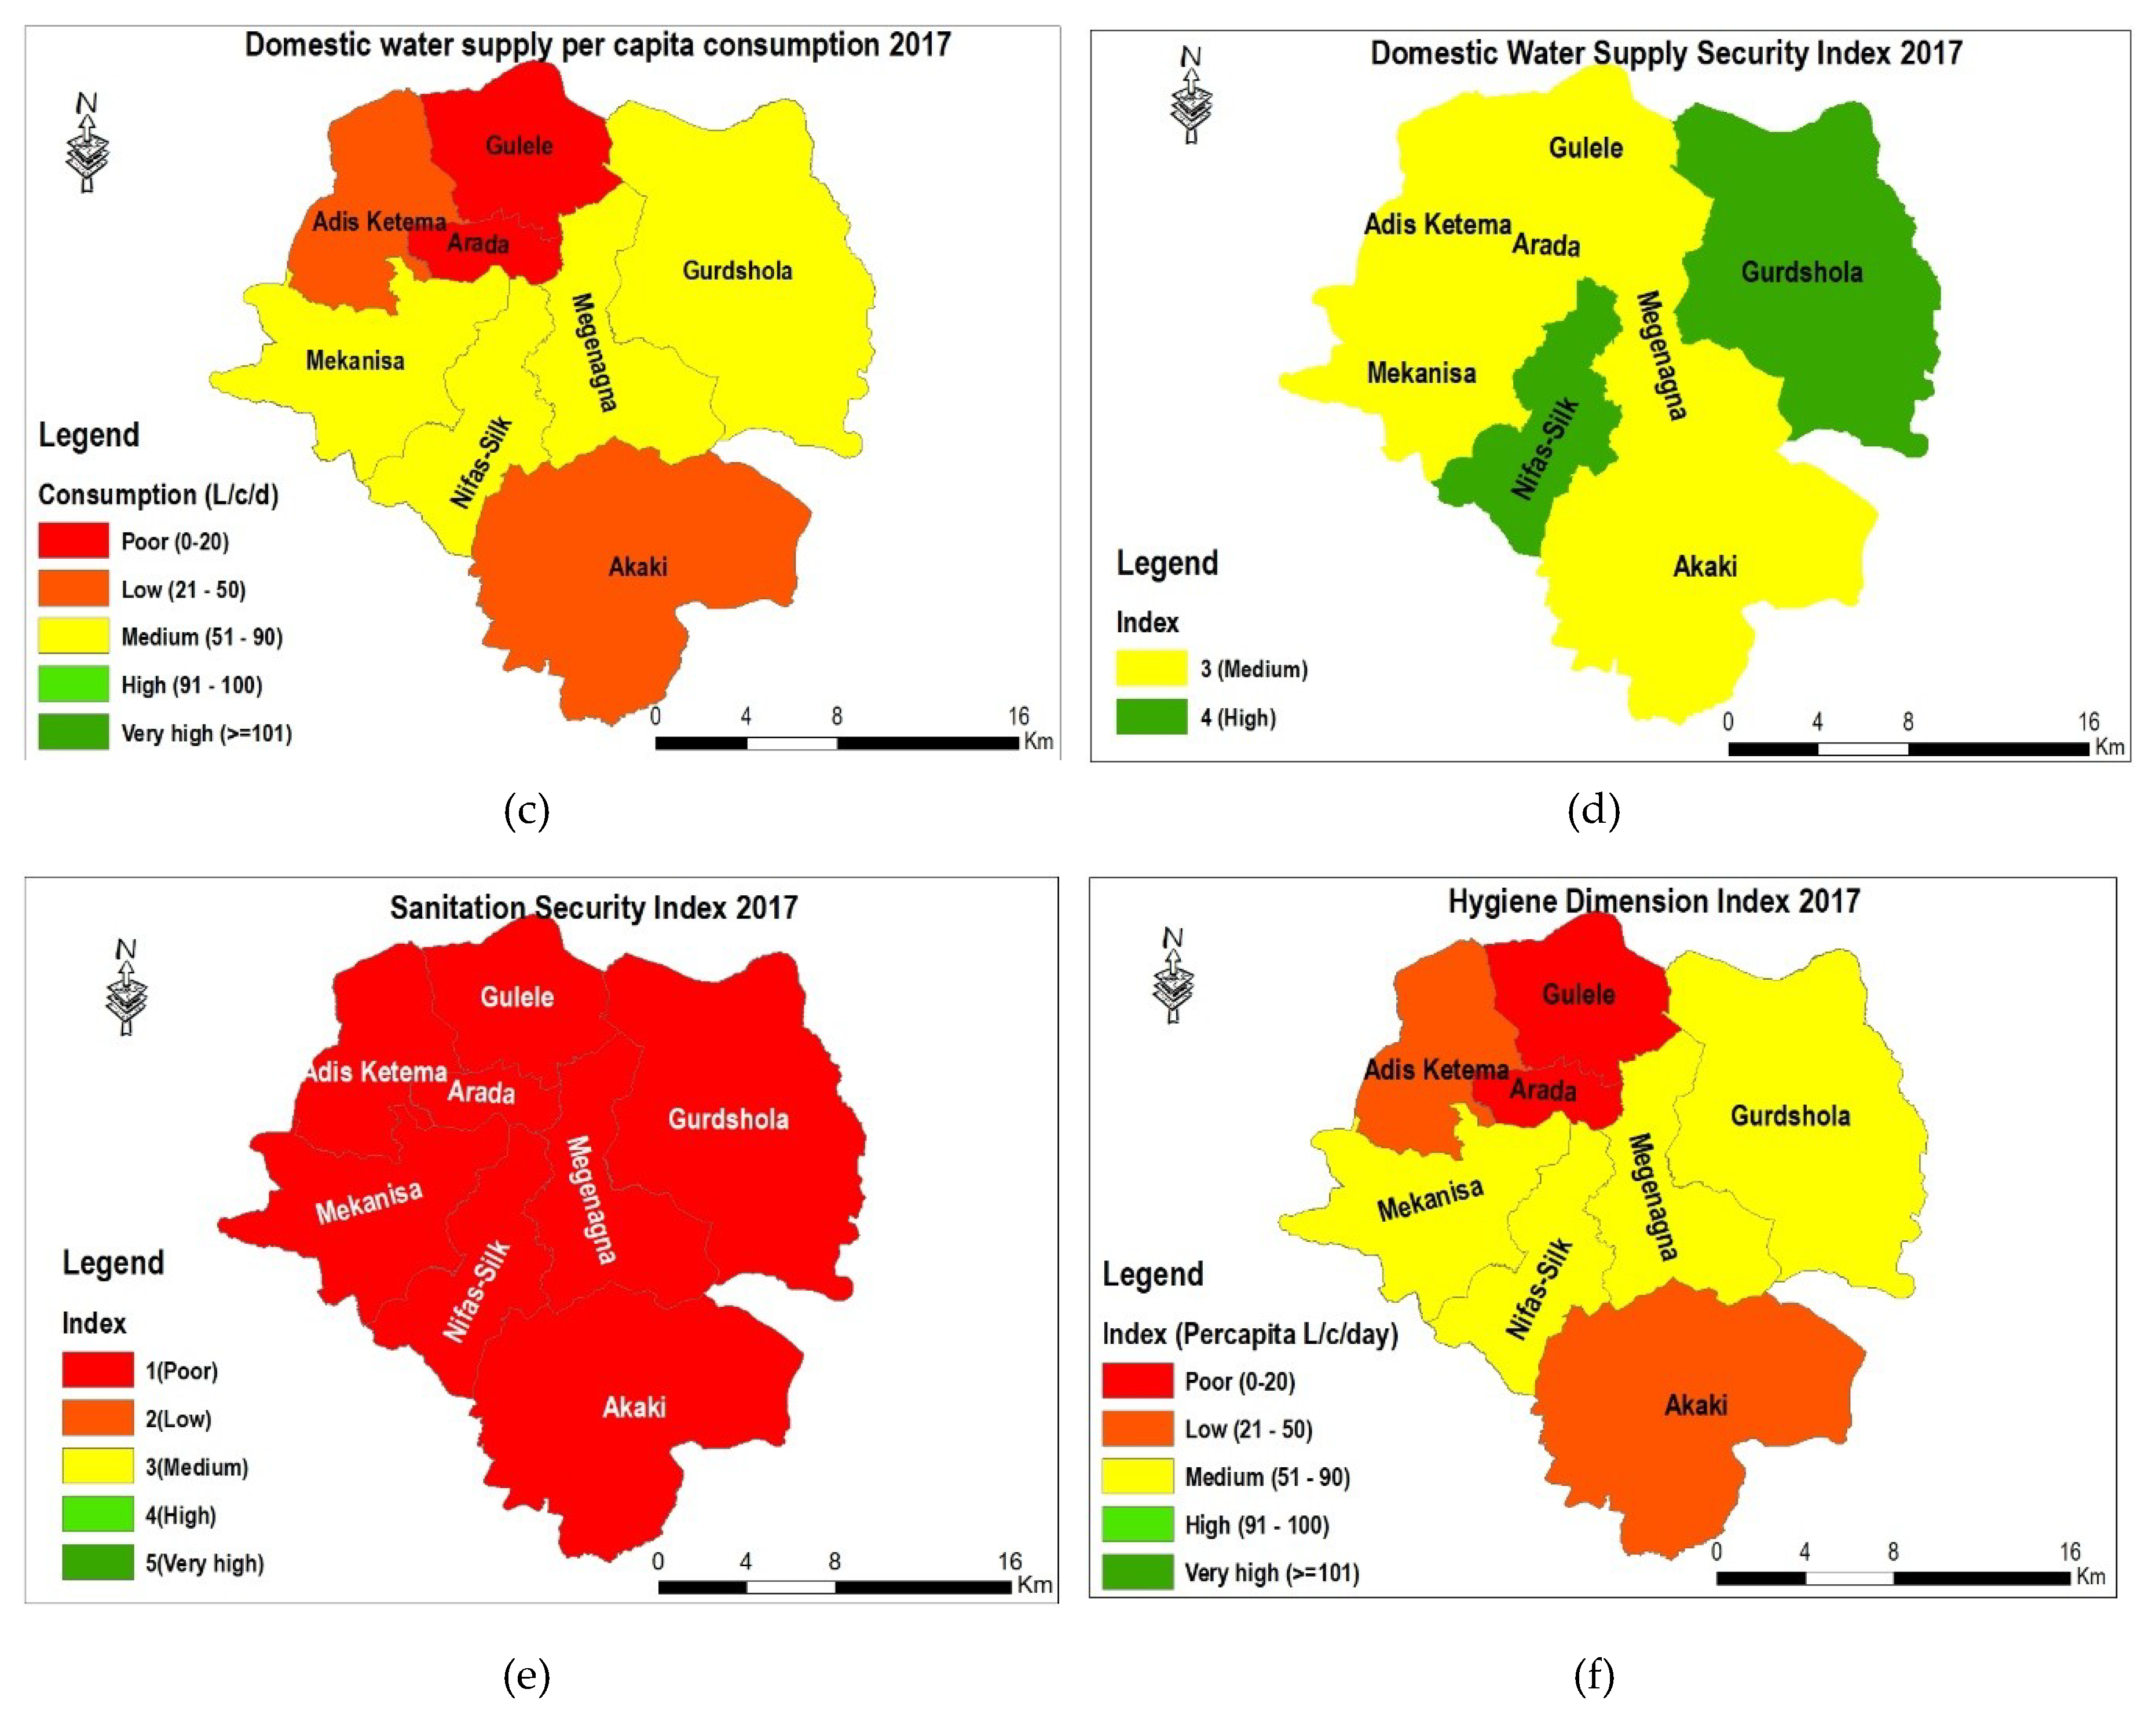
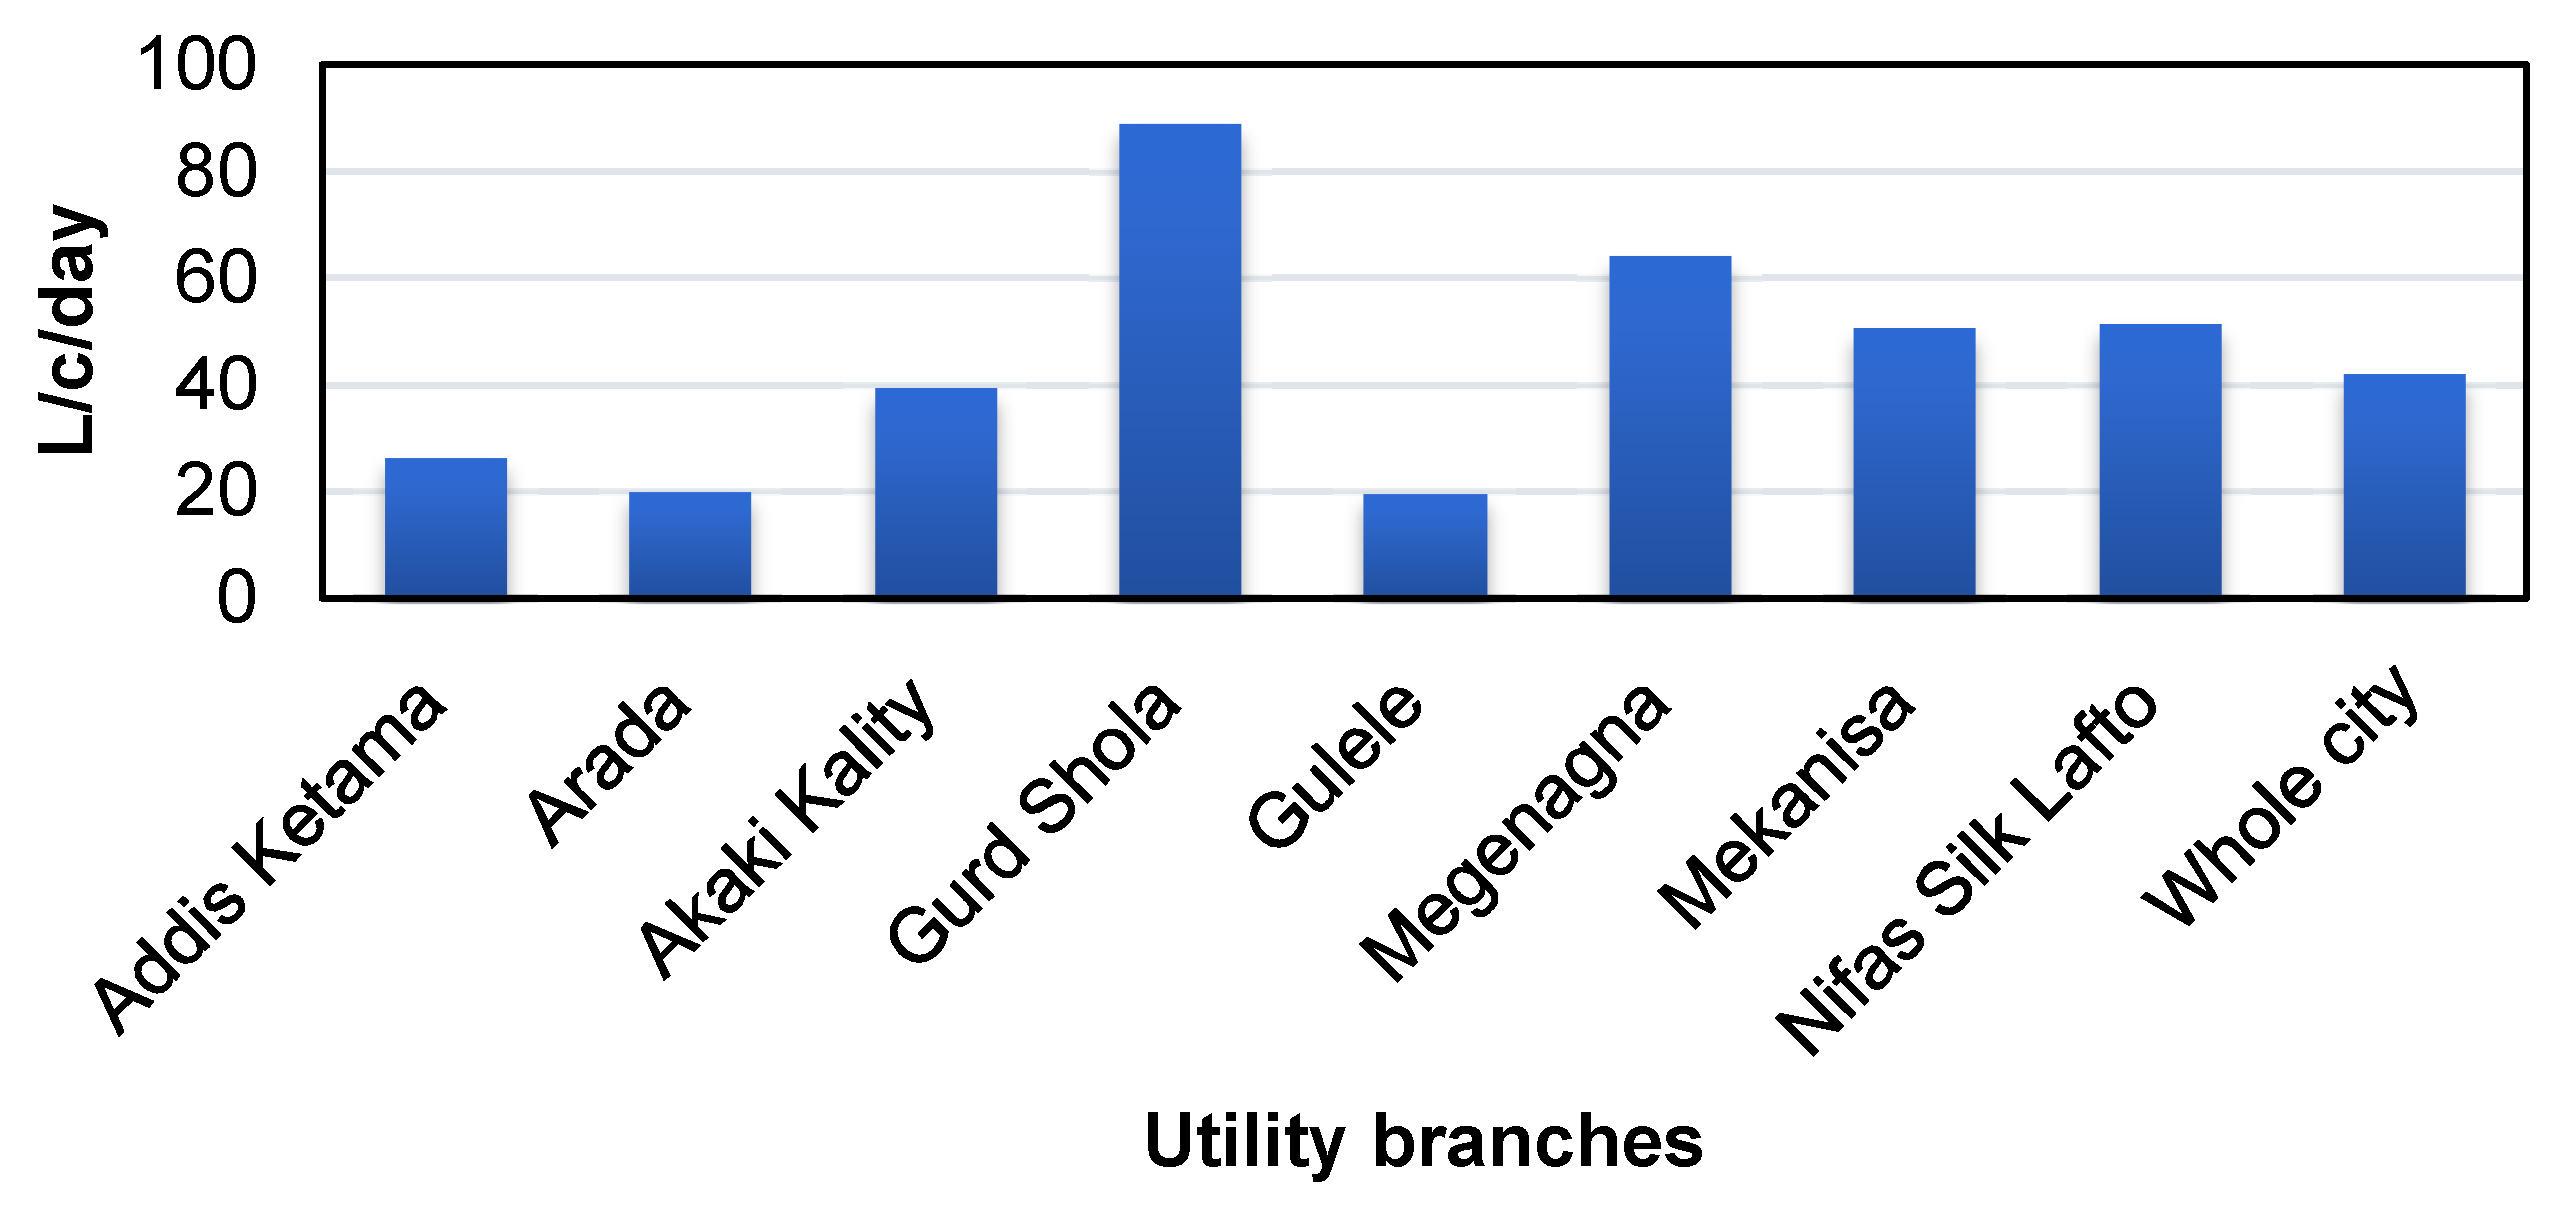
4.1.3. Per Capita Water Consumption
4.1.4. Percentage of Water Loss (NRW)
4.1.5. Conforming to Water Quality Standards
4.1.6. Affordability of Domestic Water Supply Tariff
4.1.7. Domestic Water Security Sub-Index for the Water Supply Dimension
4.2. Sanitation Dimension
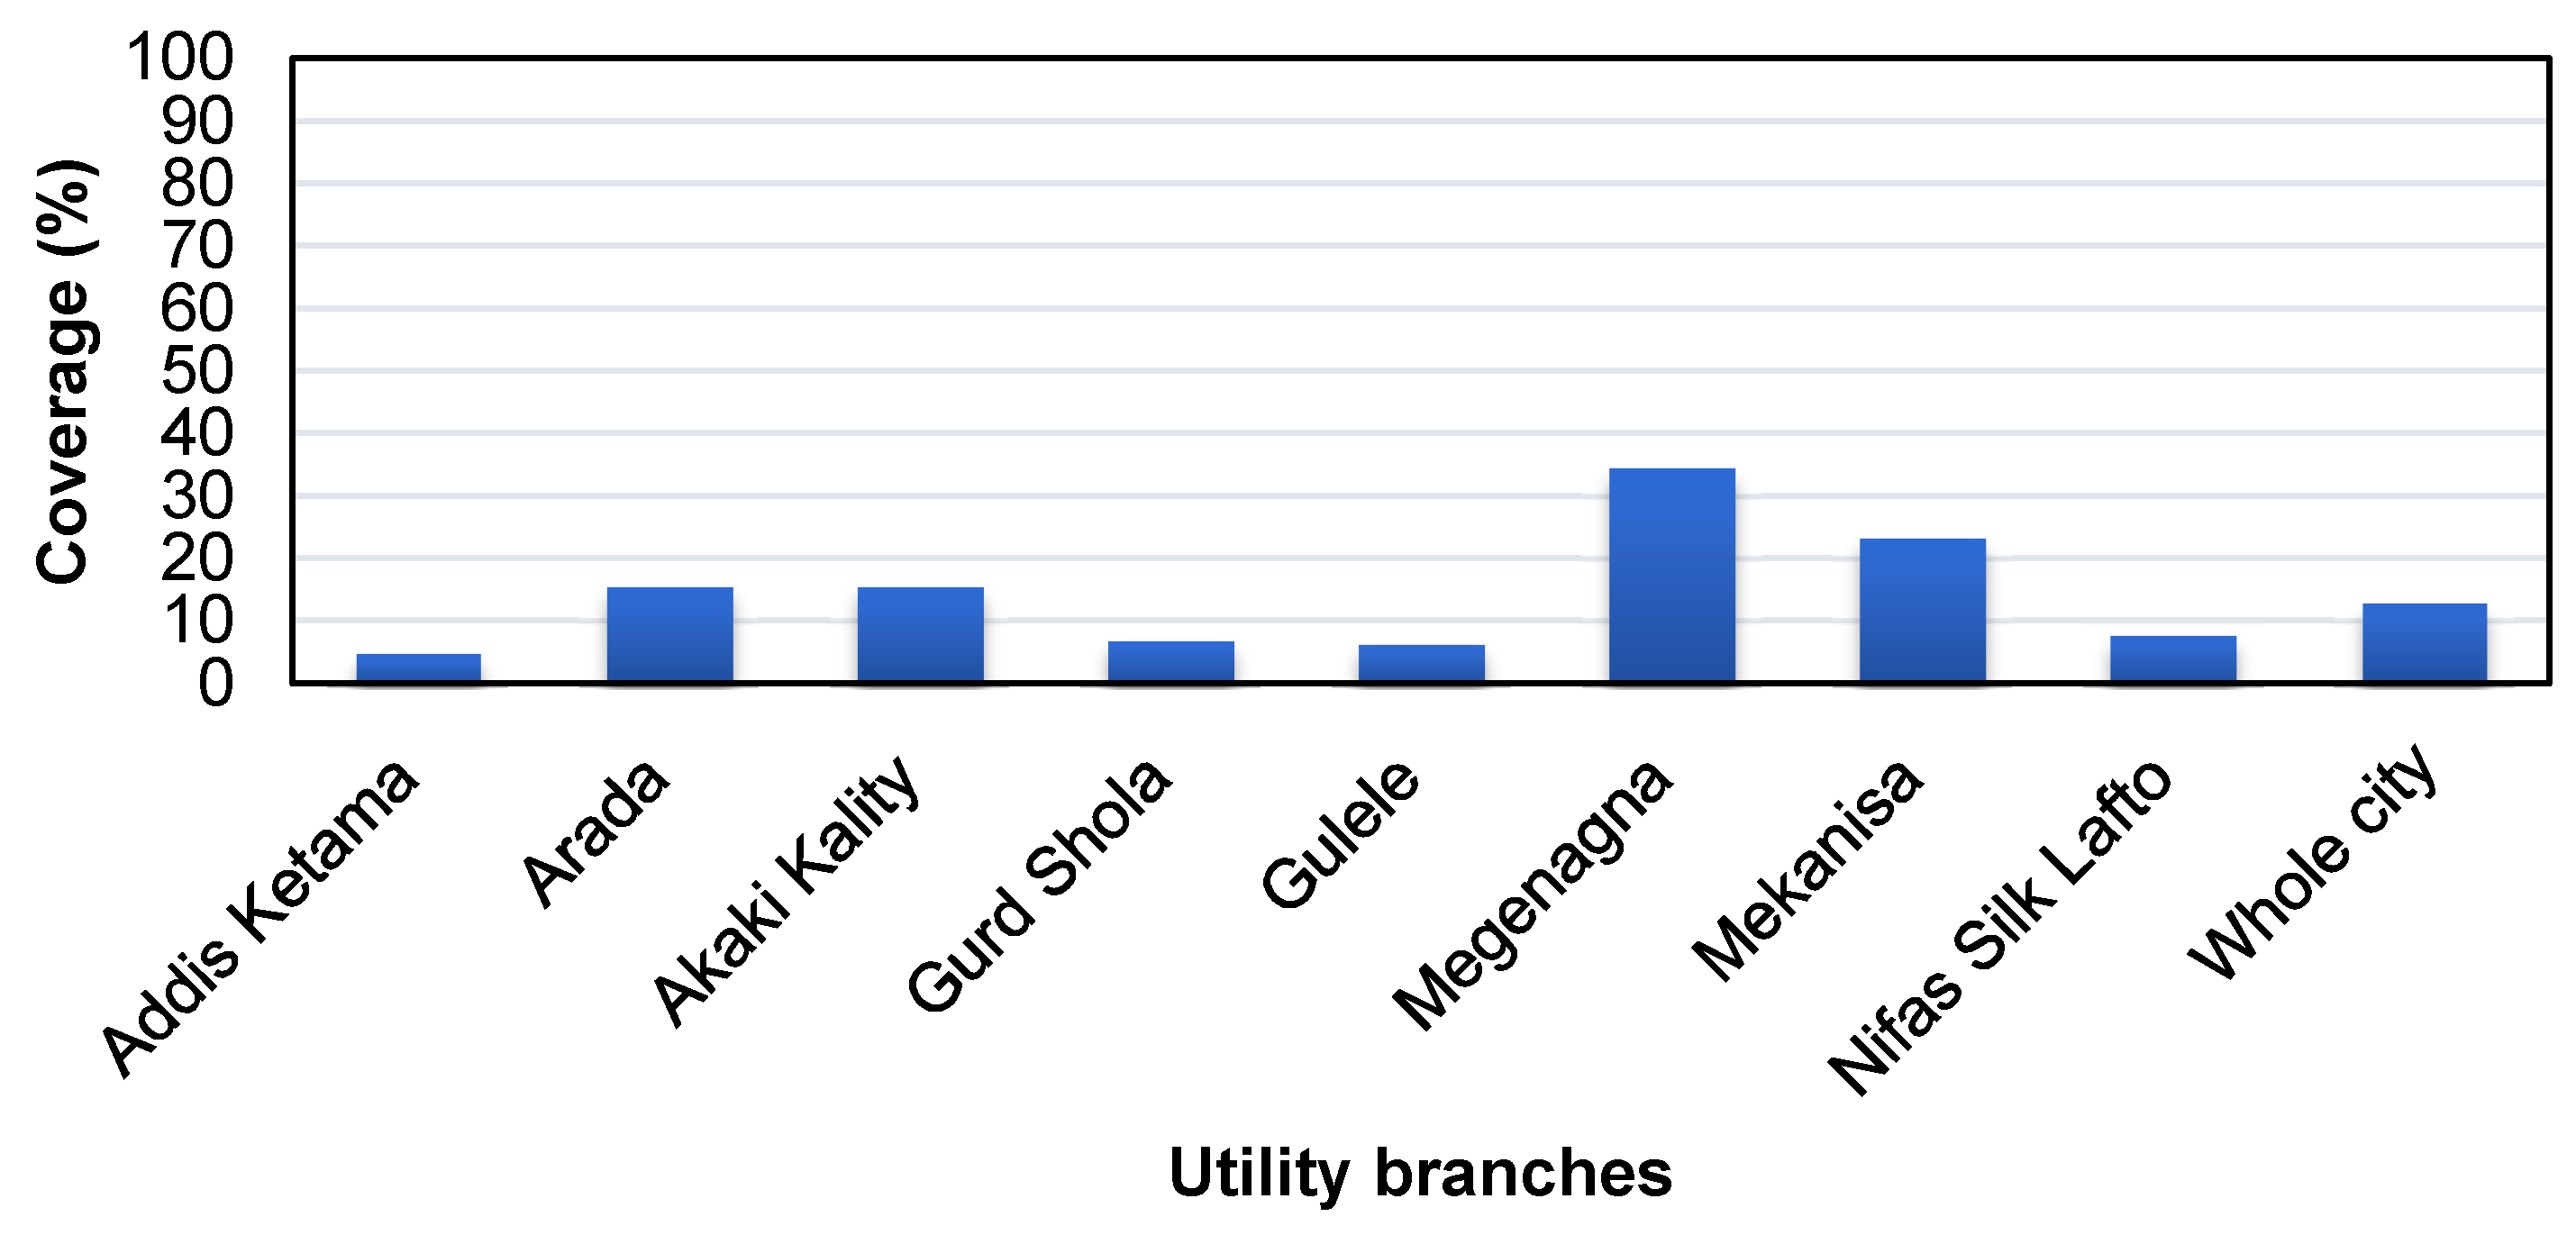
4.2.1. The Proportion of Customers Connected to Sewer System
4.2.2. The Percentage of Treated Wastewater
4.2.3. The Overall Sanitation Index
4.3. Hygiene Dimension
The Available Water for Hygiene
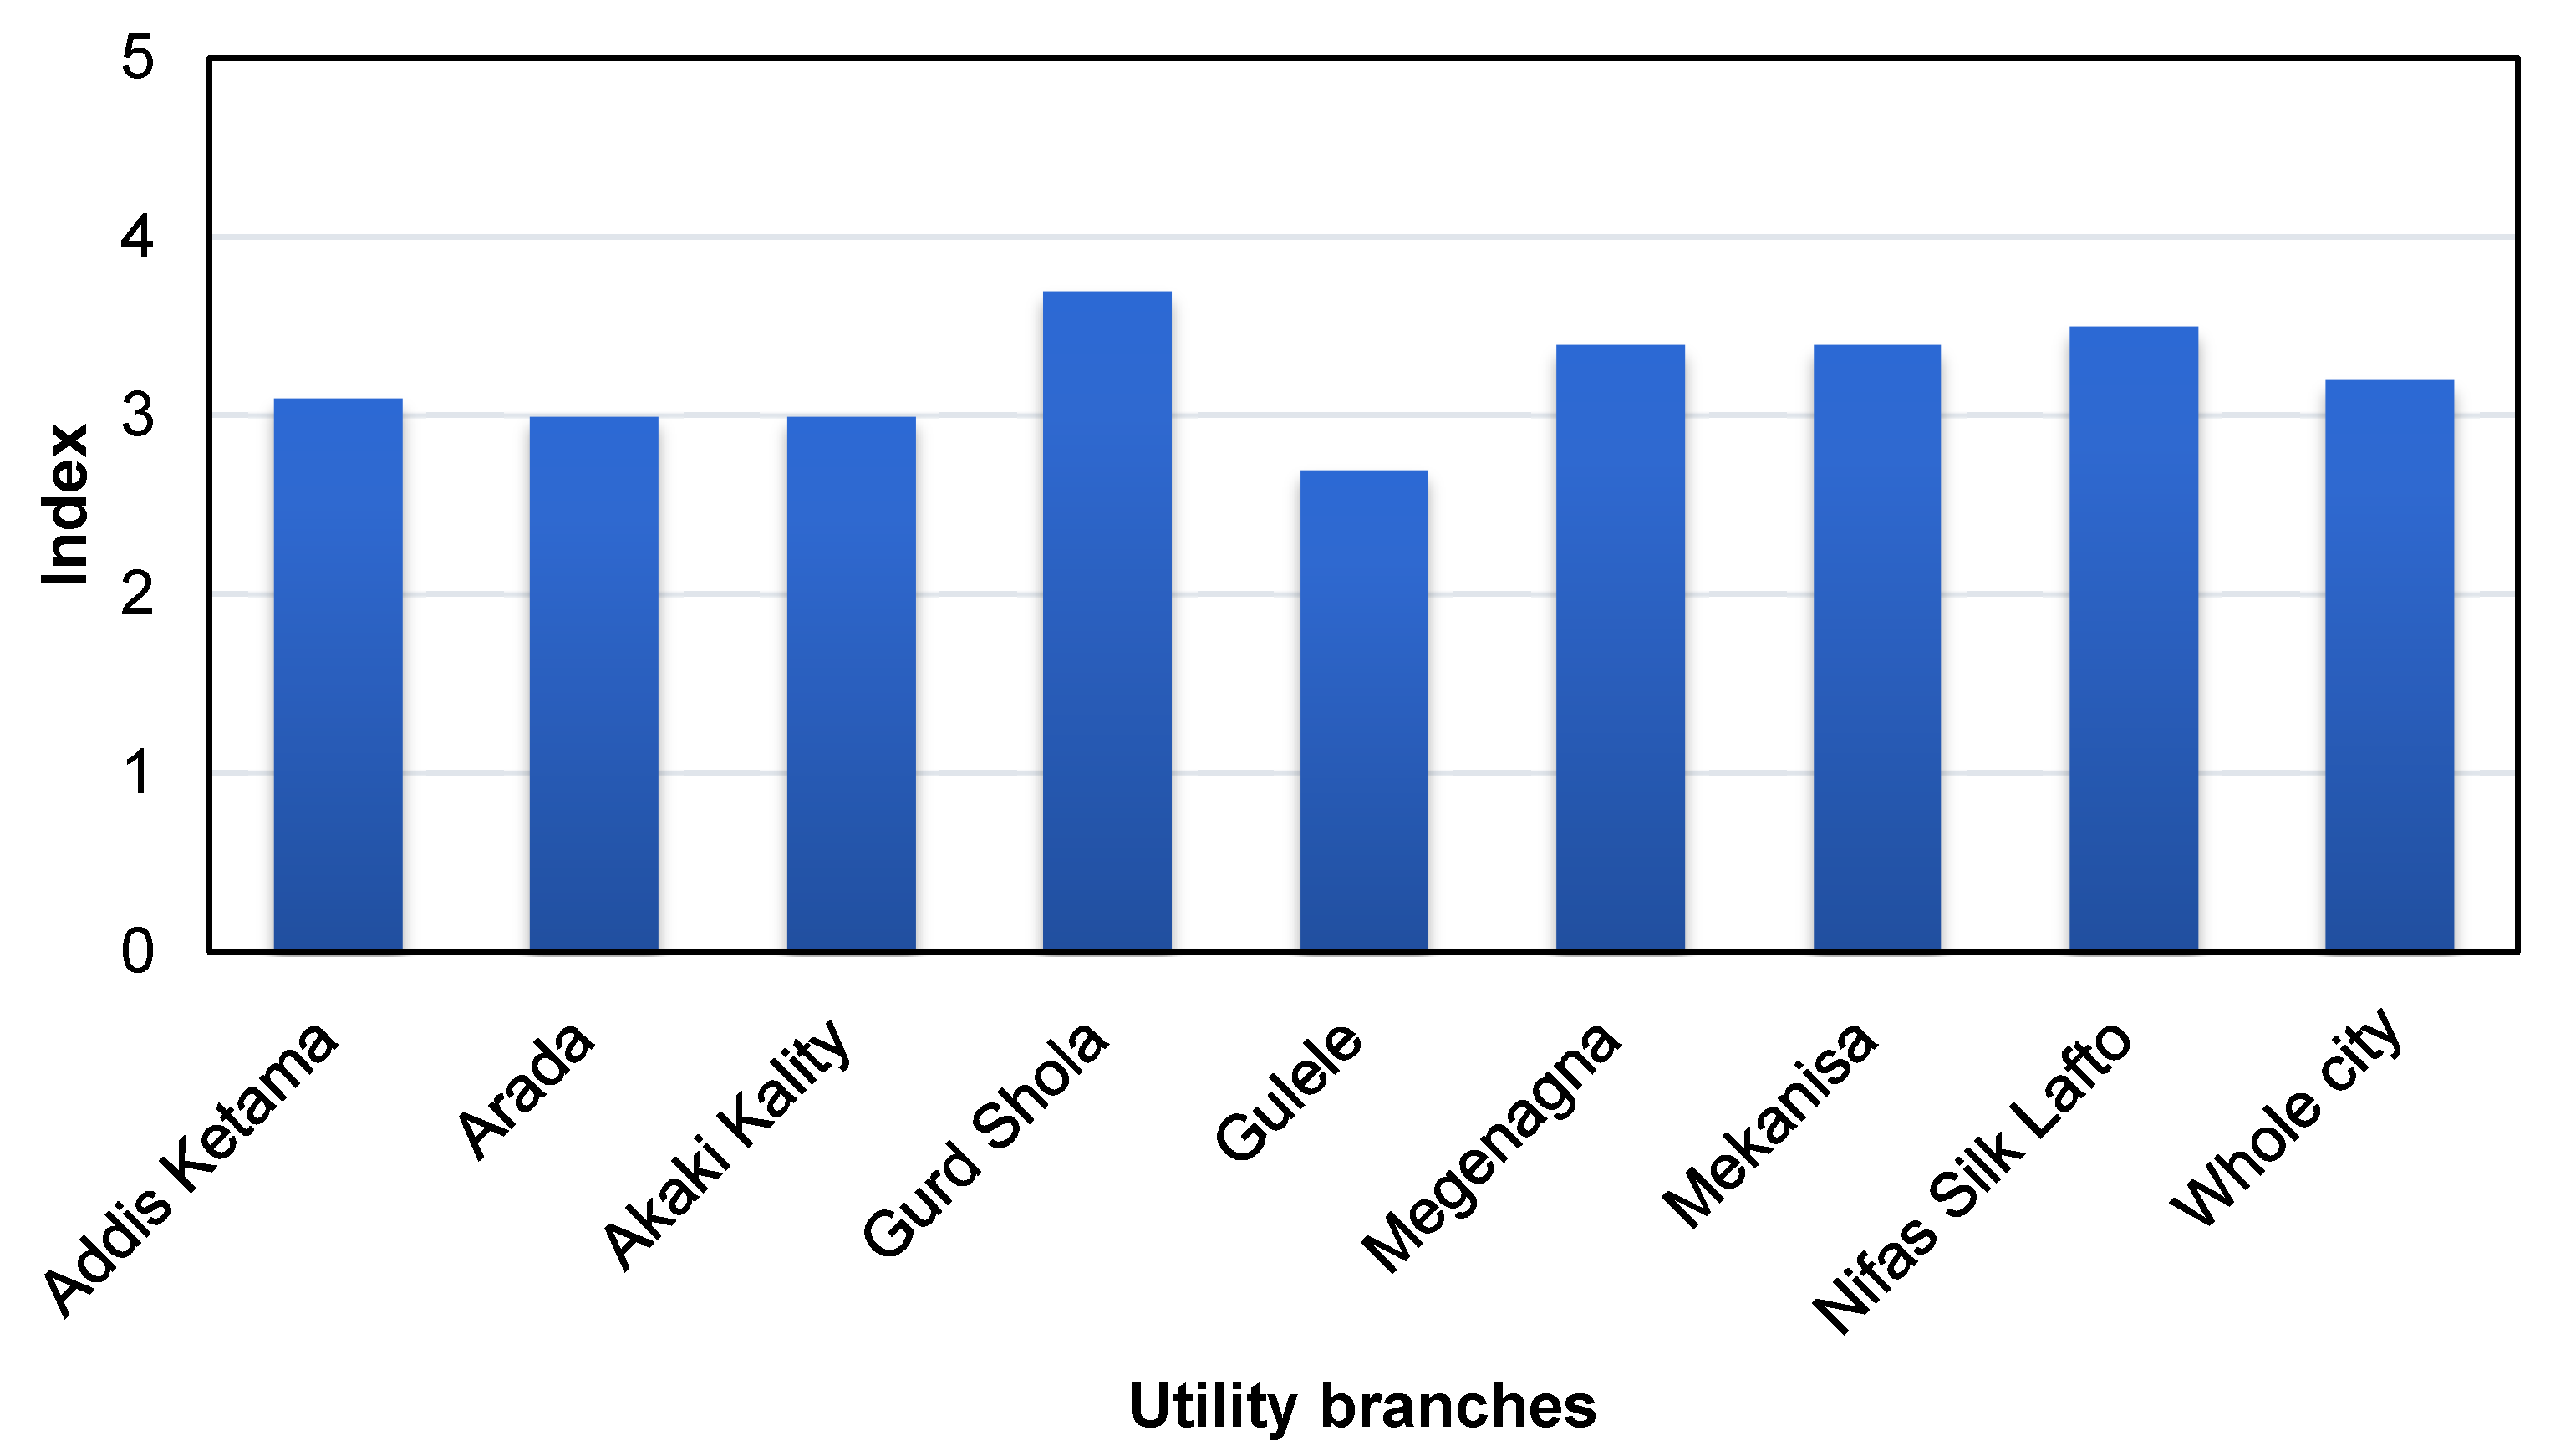
4.4. Overall Domestic Water Security Assessment
5. Discussion
6. Conclusions
Author Contributions
Funding
Acknowledgments
Conflicts of Interest
References
- UN Water. Water Security and the Global Water Agenda. A UN Water Analytical Brief; UNU-INWEH: Halimton, Canada, 2013; Available online: http://www.unwater.org/publications/water-security-global-water-agenda/ (accessed on 20 August 2017).
- Hardy, D.; Cubillo, F.; Han, M.; Li, H. Alternative Water Resources: A Review of Concepts, Solutions and Experiences. 2015. Available online: http://www.iwa-network.org/publications/alternative-water-resources-a-review-of-concepts-solutions-and-experiences/ (accessed on 20 August 2017).
- The Organisation for Economic Co-operation and Developmen (OECD). OECD Environmental Outlook to 2050: The consequences of Inaction; OECD Publishing: Paris, France, 2012. [Google Scholar]
- DeNicola, E.A.; Aburizaiza, O.S.; Siddique, A.; Khwaja, H.; Carpenter, D.O. Climate change and water scarcity: The case of Saudi Arabia. Ann. Glob. Health 2015, 81, 342–353. [Google Scholar] [CrossRef] [PubMed]
- Ndaruzaniye, V. Water Security in Ethiopia: Risks and Vulnerabilities’ Assessment; Global Water Institute for Africa Climate Change, Environment and Security: Brussels, Belgium, 2011; Available online: https://gwiwater.org (accessed on 24 June 2017).
- World-Bank. Addis Ababa—Enhancing Urban Resilience: City Strength Resilient Cities Program (English); World Bank Group: Washington, DC, USA, 2015. [Google Scholar]
- Bayrau, A. Building a Resilient City to Water Mediated Climate Change: Policy and Institutional Options; Ethiopian Development Research Institute (EDRI): Addis Ababa, Ethiopia, 2014; Available online: https://www.edri.org.et/Resources/Research_Reports/Research_Report_019.pdf (accessed on 24 June 2017).
- Arsiso, B.K.; Tsidu, G.M.; Stoffberg, G.H.; Tadesse, T. Climate Change and Population Growth Impacts on Surface Water Supply and Demand of Addis Ababa, Ethiopia. Climate Risk Manag. 2017, 18, 21–33. [Google Scholar] [CrossRef]
- Srinivasan, V.; Konar, M.; Sivalapan, M. A dynamic framework for water security. Water Secur. 2017, 1, 12–20. [Google Scholar] [CrossRef]
- Veettil, A.V.; Mishra, A.K. Potential influence of climate and anthropogenic variables on water security using blue and green water scarcity, Falkenmark index, and freshwater provision indicator. J. Environ. Manag. 2018, 228, 346–362. [Google Scholar] [CrossRef] [PubMed]
- Vörösmarty, C.J.; McIntyre, P.B.; Gessner, M.O.; Dudgeon, D.; Prusevich, A.; Green, P.; Liermann, C.R. Global threats to human water security and river biodiversity. Nature 2010, 467, 555–561. [Google Scholar] [CrossRef] [PubMed]
- Asian Development Bank. Asian Water Development Outlook 2016: Strengthening Water Security in Asia and the Pacific; Asian Development Bank: Mandaluyong City, Philippines, 2016. [Google Scholar]
- Karadirek, I.E. A case study on evaluation of household water security in MENA countries. In Proceedings of the Regional Workshop: Solutions to Water Challenges in MENA Region; Abou-Elnaga, Z.S., Aydin, M.E., Eds.; Cuvillier Verlag: Göttingen, Germany, 2017; pp. 72–82. [Google Scholar]
- Babel, M.S.; Onsomkri, A.; Shinde, V.R. Framework for Water Security Assessment at City Scale. In Proceedings of the 7th International Conference on Water Resources and Environmental Research, Kyoto, Japan, 5–9 June 2016. [Google Scholar]
- Jensen, O.; Wu, H. Urban water security indicators: Development and pilot. Environ. Sci. Policy 2018, 83, 33–45. [Google Scholar] [CrossRef]
- Bradley, D.J.; Bartram, J.K. Domestic water and sanitation as water security: Monitoring, concepts and strategy. Philos. Trans. R. Soc. A 2013, 371, doi. [Google Scholar] [CrossRef]
- GWP. Proceedings from the GWP Workshop: Assessing Water Security with Appropriate Indicators; Global Water Partnership: Stockholm, Sweden, 2014. [Google Scholar]
- Falkenmark, M.; Lundqvist, J.; Widstrand, C. Macro-scale water scarcity requires micro-scale approaches. Nat. Resour. Forum 1989, 13, 258–267. [Google Scholar] [CrossRef] [PubMed]
- Howard, G.; Bartram, J. Domestic Water Quantity, Service Level and Health; World Health Organization: Geneva, Switzerland, 2003. [Google Scholar]
- Hsu, A.; Emerson, J.; Levy, M.; de Sherbinin, A.; Johnson, L.; Malik, O.; Schwartz, J.; Jaiteh, M. The 2014 Environmental Performance Index; Yale Center for Environmental Law and Policy: New Haven, CT, USA, 2014. [Google Scholar]
- WHO (World Health Organization). Guidelines for Drinking-Water Quality; World Health Organization: Geneva, Switzerland. 2011. [Google Scholar]
- Banerjee, S.G.; Morella, E. Africa’s Water and Sanitation Infrastructure: Access, Affordability, and Alternatives; The World Bank Publications: Washington, DC, USA, 2011. [Google Scholar]
- Sharma, S. Performance Indicators of Water Losses in Distribution System; UNESCO-IHE Institute for Water Education: Delft, The Netherlands, 2008. [Google Scholar]
- Onsomkrit, A. Development of a Water Security Index at City Scale: A Case Study of Bangkok. Master of Engineering Thesis, Asian Institute of Technology, Pathum Thani, Thailand, May 2015. [Google Scholar]
- Manandhar, S.; Pandey, V.P.; Kazama, F. Application of water poverty index (WPI) in Nepalese context: A case study of Kali Gandaki River Basin (KGRB). Water Resour. Manag. 2012, 26, 89–107. [Google Scholar] [CrossRef]
- Spaliviero, M.; Cheru, F. The State of Addis Ababa 2017: The Addis Ababa We Want; UN-Habitat: Nairobi, Kenya, 2017. [Google Scholar]
- Adane, M.; Mengistie, B.; Kloos, H.; Medhin, G.; Mulat, W. Sanitation facilities, hygienic conditions, and prevalence of acute diarrhea among under-five children in slums of Addis Ababa, Ethiopia: Baseline survey of a longitudinal study. PLoS ONE 2017. [Google Scholar] [CrossRef] [PubMed]
- Z&A Consulting Engineers. Consultancy Services for NRW Reduction, Hydraulic Modeling and GIS Development for Addis Ababa Water and Sewerage Authority; Draft Project Report, 2014. Available online: https://www.z-a.gr/index.php/en/projects/fetaured-projects/7?path[0]=1&path[1]=7 (accessed on 24 December 2018).


| Dimension, i | Indicator, j | Variable, k | What Is Assessed? | Measurement Unit |
|---|---|---|---|---|
| Water Supply | Availability | The available volume of water resource for drinking purpose | Is the available water sufficient to fulfill the required water demand for the household purpose? | m3 cap−1 year−1 |
| Accessibility | Improved water supply (treated and piped water supply) Water supply service duration | Is the accessibility of water supply service good enough in terms of access to piped water supply and service duration? | % people with access to network Hours of service | |
| Quantity | Adequate water for domestic consumption (per capita consumption) | Is the supplied water adequate enough to satisfy the required water consumption? | L cap−1 day−1 | |
| Quality | Acceptable water quality for human health | How well is the supplied water quality for the health of human beings? | pH, mg L−1, NTU | |
| Affordability | Water tariff | Is the cost of water affordable to all types of community? | US$ m−3 | |
| Water management efficiency | Water loss (NRW) | Is the distributed water reaches efficiently to the consumers? | % NRW in the network | |
| Sanitation | Accessibility | Improved sanitation system in terms of customers who use sewerage system | Is the sanitation service good enough in terms of access to improved sanitation coverage? | % people with access to network |
| Quantity | The amount of wastewater generated | Are the available treatment plants adequate enough to treat the produced wastewater? | m3, m3 cap−1 year−1 | |
| Quality | Quality of the effluent | Are the effluent water quality parameters fulfilling the required standards? | pH, mg l−1, NTU | |
| Affordability | Affordability of domestic wastewater collection (tariff) | Is the cost for wastewater transportation affordable to all the communities? | US$ m−3 | |
| Hygiene | Adequacy of water for hygiene | Water availability for hygiene | Is the supplied water adequate to fulfil the required amount for hygiene? | m3 cap−1 year−1 |
| Awareness | Is there diarrheal problem due to lack of water and poor toilet facilities (lack of hygienic toilet)? | Toilets per number of people | ||
| Is the population aware of about hygiene? | Questionnaire responses |
| Dimension | No. | Variable | Unit | Representations (Normalization) | Reference | ||||
|---|---|---|---|---|---|---|---|---|---|
| 1 | 2 | 3 | 4 | 5 | |||||
| Water Supply | 1 | Per capita fresh water availability | m3 cap−1 year−1 | <500 | 500–800 | 800–1000 | 1000–1700 | >1700 | [18] |
| 2 | Per capita water consumption | L cap−1 day−1 | ≤20 | 21–50 | 51–90 | 91–100 | ≥101 | [19] | |
| 3 | The proportion of piped water supply users to the total population | % | 0-60 | 61–70 | 71–80 | 81–90 | 91–100 | [12] | |
| 4 | Water supply service duration per day | h | <8 | 8–16 | 17–20 | 21–23 | 24 | This study* | |
| 5 | The proportion of safe drinking water supply based on drinking water quality standards | % | 0-60 | 61–70 | 71–80 | 81–90 | 91–100 | [21] | |
| 6 | Affordability of domestic water supply tariff | US$ m-3 | >1 | 1 | 0.75 | 0.5 | <0.4 | [22] | |
| 7 | Percentage of NRW | % | ≥25 | 25–20 | 20–15 | 15–10 | 10–0 | [23] | |
| Sanitation | 8 | The proportion of customers who uses sewer line system | % | 0-60 | 61–70 | 71–80 | 81–90 | 91–100 | [12] |
| 9 | Percentage of treated wastewater | % | 0-60 | 61–70 | 71–80 | 81–90 | 91–100 | Assumed to be the same as sewer system coverage | |
| Hygiene | 10 | The proportion of wastewater effluent quality based on wastewater discharge quality standards | % | 0-60 | 61–70 | 71–80 | 81–90 | 91–100 | [21] |
| 11 | Affordability of domestic wastewater collection tariff | - | - | - | - | - | - | Assumed to be checked by questionnaire | |
| 12 | Water availability for hygiene (per capita consumption) | l cap−1 day−1 | ≤20 | 21–50 | 51–90 | 91–100 | ≥101 | [19] | |
| 13 | Number of population with diarrhea | DALYs | ≥1000 | 800–500 | 500–100 | 100–30 | ≤30 | Or Household survey and health centers [13] | |
| 14 | Percentage of educated people (awareness) | % | - | - | - | - | - | Assumed to be checked by questionnaire | |
| Index | Level of Water Security | Interpretation |
|---|---|---|
| (<1.5) | Poor | The city is incapable of meeting the basic water requirements for its citizens. Water is used indiscriminately without proper planning and management that is a serious point of concern for all dimensions of water security. |
| (1.5–2.5) | Fair | The actions required to ensure water security are evident. However, there are still major gaps and serious concerns in regards to almost all dimensions of water security. |
| (2.5–3.5) | Good | The city has a fairly satisfactory system and environment for facilitating water security. However, some dimensions of water security are still a cause of concern. |
| (3.5–4.5) | Very good | The city is well-placed with most of the dimensions of water security. Their security against the dimensions may not be at par with the others, but the overall situation is still nonetheless very goodly satisfactory. |
| (>4.5) | Excellent | The city is an ideal example of a water-secure society. It shows exemplary levels of security against every dimension of water security. |
| Branch | Variable | Value | DWS Score | DWS Level | Major Challenges |
|---|---|---|---|---|---|
| Addis Ketama | Proportion of piped water supply coverage (%) | 68 | 2 | Fair | Financial and other institutional problems Problems with registration of number of customers |
| Water supply service duration (h day−1) | 16.30 | 3 | Good | Topography (Highly elevated area with elevation varying from 2270 to 2895 m above mean sea level) Power supply shortage (to pump the water) | |
| Per capita water consumption (L cap−1 day−1) | 26.43 | 2 | Fair | Population density is high in this area (more than 587,000). High water loss (NRW) | |
| The proportion of customers connected to the sewer system (%) | 4.78 | 1 | Poor | Maybe difficult to construct sewer system due to the existence of pre-constructed infrastructures in most of the areas. | |
| Arada | Proportion of piped water supply coverage (%) | 50 | 1 | Poor | Slum dwellers. Household size might be high in this area due to dense population (number of customers small but many consumers) Financial and other institutional problems Problem with registration of number of consumers |
| Water supply service duration (h day−1) | 18.90 | 3 | Good | Power supply shortage (to pump the water) | |
| Per capita water consumption (L cap−1 day−1) | 20.15 | 2 | Fair | Densely populated area (the population is high and the area is very small compared to other branches) High economic activity (commercial center of the city) The domestic and non-domestic consumption is almost equal High water loss (NRW) | |
| The proportion of customers connected to the sewer system (%) | 15.59 | 1 | Poor | Maybe difficult for sewer system construction due to the existence of pre-constructed infrastructures in most of the areas. | |
| Akaki Kaliti | Proportion of piped water supply coverage (%) | 54 | 1 | Poor | Financial and other institutional problems Problem with registration of number of costumers |
| Water supply service duration (h day−1) | 17.40 | 3 | Good | Power supply shortage (most of this area is supplied from groundwater) | |
| Per capita water consumption (L cap−1 day−1) | 39.40 | 2 | Fair | Urbanization is high in this area (construction boom) Water loss (NRW) | |
| The proportion of customers connected to the sewer system (%) | 15.62 | 1 | Poor | Maybe difficult for sewer system construction due to the existence of pre-constructed infrastructures in most of the areas. | |
| Gurdshola | Proportion of piped water supply coverage (%) | 100 | 5 | Excellent | The place near to the source (new ground water sources are constructed) and most of the areas are newly developed and construction of modern houses Maybe the branch performance is good |
| Water supply service duration (h day−1) | 22.80 | 4 | Very good | Most of the area is supplied through gravity system | |
| Per capita water consumption (L cap−1 day−1) | 89.25 | 3 | Good | The coverage and service duration is good so that people will have access at least for more than 20 h and will have a chance to consume more water. Water loss (NRW) | |
| The proportion of customers connected to the sewer system (%) | 6.94 | 1 | Poor | Maybe difficult for sewer system construction due to the existence of pre-constructed infrastructures in most of the areas. | |
| Gulele | Proportion of piped water supply coverage (%) | 43 | 1 | Poor | Financial and other institutional problems Problem with registration of number of customers |
| Water supply service duration (h day−1) | 13.90 | 2 | Fair | Topography (highly elevated area compared with other branches, with elevation variation of 2385–3015 meters AMSL) Power supply shortage (to pump the water) | |
| Per capita water consumption (L cap−1 day−1) | 19.82 | 1 | Poor | Inadequate supply due to topography Number of population is high in this area (more than 589,000). Water loss (NRW) | |
| The proportion of customers connected to the sewer system (%) | 6.35 | 1 | Poor | Maybe difficult for sewer system construction due to the existence of pre-constructed infrastructure in most of the areas. | |
| Megenagna | Proportion of piped water supply coverage (%) | 82 | 4 | Very good | Maybe the branch performance is good in terms of expansion of the coverage |
| Water supply service duration (h day−1) | 11.20 | 2 | Fair | Power supply shortage | |
| Per capita water consumption (L cap−1 day−1) | 64.33 | 3 | Good | High non-domestic consumption Water loss (NRW) | |
| The proportion of customers connected to the sewer system (%) | 34.46 | 1 | Poor | This area has better sewer system than some other branches (though it is very small) due to it maybe being one of the older places in the city with a sewer system. | |
| Mekanisa | Proportion of piped water supply coverage (%) | 78 | 3 | Good | Slum dwellers (some part of the area) Financial and other institutional problems |
| Water supply service duration (h day−1) | 17.02 | 3 | Good | Power supply shortage (to pump the water) | |
| Per capita water consumption (L cap−1 day−1) | 50.67 | 3 | Good | Inadequate water supply due to power supply shortage Water loss (NRW) | |
| The proportion of customers connected to the sewer system (%) | 23.35 | 1 | Poor | This area has a better sewer system than some other branches (though it is very small) due to it maybe being one of the older places in the city | |
| Nifas Silk Lafto | Proportion of piped water supply coverage (%) | 99 | 5 | Excellent | Slum dwellers (some part of the area) Household size might be high in this area due to dense population (number of customers small but many consumers) |
| Water supply service duration (h day−1) | 15.20 | 2 | Fair | Power supply shortage (to pump the water) | |
| Per capita water consumption (L cap−1 day−1) | 51.66 | 3 | Good | Inadequate water supply due to power supply shortage Water loss (NRW) | |
| The proportion of customers connected to the sewer system (%) | 7.66 | 1 | Poor | Maybe difficult for sewer system construction due to the existence of pre constructed infrastructures in most of the areas. |
© 2018 by the authors. Licensee MDPI, Basel, Switzerland. This article is an open access article distributed under the terms and conditions of the Creative Commons Attribution (CC BY) license (http://creativecommons.org/licenses/by/4.0/).
Share and Cite
Assefa, Y.T.; Babel, M.S.; Sušnik, J.; Shinde, V.R. Development of a Generic Domestic Water Security Index, and Its Application in Addis Ababa, Ethiopia. Water 2019, 11, 37. https://doi.org/10.3390/w11010037
Assefa YT, Babel MS, Sušnik J, Shinde VR. Development of a Generic Domestic Water Security Index, and Its Application in Addis Ababa, Ethiopia. Water. 2019; 11(1):37. https://doi.org/10.3390/w11010037
Chicago/Turabian StyleAssefa, Yonas T., Mukand S. Babel, Janez Sušnik, and Victor R. Shinde. 2019. "Development of a Generic Domestic Water Security Index, and Its Application in Addis Ababa, Ethiopia" Water 11, no. 1: 37. https://doi.org/10.3390/w11010037
APA StyleAssefa, Y. T., Babel, M. S., Sušnik, J., & Shinde, V. R. (2019). Development of a Generic Domestic Water Security Index, and Its Application in Addis Ababa, Ethiopia. Water, 11(1), 37. https://doi.org/10.3390/w11010037