Article

A Novel System for Water Disinfection with UV Radiation

Department of Civil & Environmental Engineering, University of California, Davis, CA 95616, USA
*
Author to whom correspondence should be addressed.
Water 2018, 10(9), 1275; https://doi.org/10.3390/w10091275
Submission received: 25 August 2018 / Revised: 13 September 2018 / Accepted: 13 September 2018 / Published: 18 September 2018
(This article belongs to the Section Wastewater Treatment and Reuse)

Abstract

:
We present a novel system for water disinfection with ultra-violet (UV) radiation. In this system, the UV lamps do not come into contact with the water and hence remain free of fouling. The system incorporates a diffusor and a nozzle, with stationary guide vanes built into each. Their combined purpose is to reduce the hydraulic losses while imparting a strong swirl component to the flow. The swirl significantly enhances turbulent mixing processes and provides a self-cleansing mechanism that renders the system tolerant to high levels of turbidity and scaling. The hydrodynamic performance of the system was optimized using Computational Fluid Dynamics, while the manufacture of its key components was accomplished using advanced mechanical design software and three-dimensional (3D) printing. Biodosimetry testing with the bacteriophage MS2 indicated the delivery of a UV dose of 215.6 mJ/cm2. This produced a 6.9 log10 reduction of E. coli and 7.12 log10 reduction of MS2. Assessment of the system with hard water containing high Ca, Mg, and Fe concentrations, and with water with turbidity of 18 NTU indicated that the log10 removal of E. coli remained above 5.

1. Introduction

Most commercial systems for water disinfection using UV radiation in use derive their basic structure from a patent dating back to 1934 [1]. In the original system, as in the existing ones, the UV lamps are placed inside protective quartz tubes and inserted in the water that is to be treated. Water flows along the quartz tubes, carrying the pathogens of concern. The pathogens receive a UV dose commensurate with their time of exposure to UV radiation of a given intensity [2]. The received dose, if greater than a pathogen-specific threshold, disrupts the pathogen’s DNA in such a way as to prevent their multiplication [3,4,5]. In applications where the water flow is pressurized, such as in a drinking-water supply and distribution network, the water flows in the gap between the quartz cylinders and an outer casing that serves to maintain the interior pressure at above atmospheric, and to prevent damage to the users. This method of irradiating water with UV radiation suffers from a number of drawbacks, of which three are relevant here. The first is that, with time, the quartz tubes become covered with mineral deposits and bio-film—the “lamp fouling” problem. Methods for keeping the tubes clear range from installing electrically-driven wipers that continually traverse the length of the quartz tube to scrape off the deposits that accumulate on it, to the more drastic action of taking the system out of service to scrub the quartz tubes clean, sometimes using acid solutions to loosen the deposits [6]. The second drawback of the conventional designs stems from the fact that obstructions placed in the path of a moving fluid lead to losses of kinetic energy [7,8,9]. These losses lead to higher operating costs due to the increase in the power required to deliver water at a given flow rate. The third drawback stems from the difficulty of achieving thorough mixing of the water being treated to ensure that all pathogens receive a UV dose sufficient for their activation [7,8,9]. In many systems, the poor mixing is compensated for by increasing the number of UV lamps, but that also leads to increased hydraulic losses. Alternative UV systems to the conventional commercial designs exist. Notable amongst them are the systems developed by, e.g., Reference [10], wherein the UV lamps are placed above the surface of water flowing through an open channel. In this configuration, the problems of “lamp fouling” and hydraulic losses do not occur. However, mixing is usually a limiting factor in these designs, such that the UV dose is delivered to only a thin surface layer. This significantly limits the flow rates that can be accommodated in these designs.
The purpose of this paper is to introduce and demonstrate the efficacy of a novel system that overcomes most of the drawbacks mentioned above. The objective of the research leading to it was to develop a UV system that is robust, reliable, inexpensive to install and operate, and sufficiently maintenance-free to be usable by the non-specialists. The intended end-users were to be private homeowners in under-served communities, but the system is scalable and can be of benefit in other applications. The technical details are presented in the next section. Design details are provided in the Supplementary Materials, from where they can be freely downloaded and replicated.

2. Materials and Methods

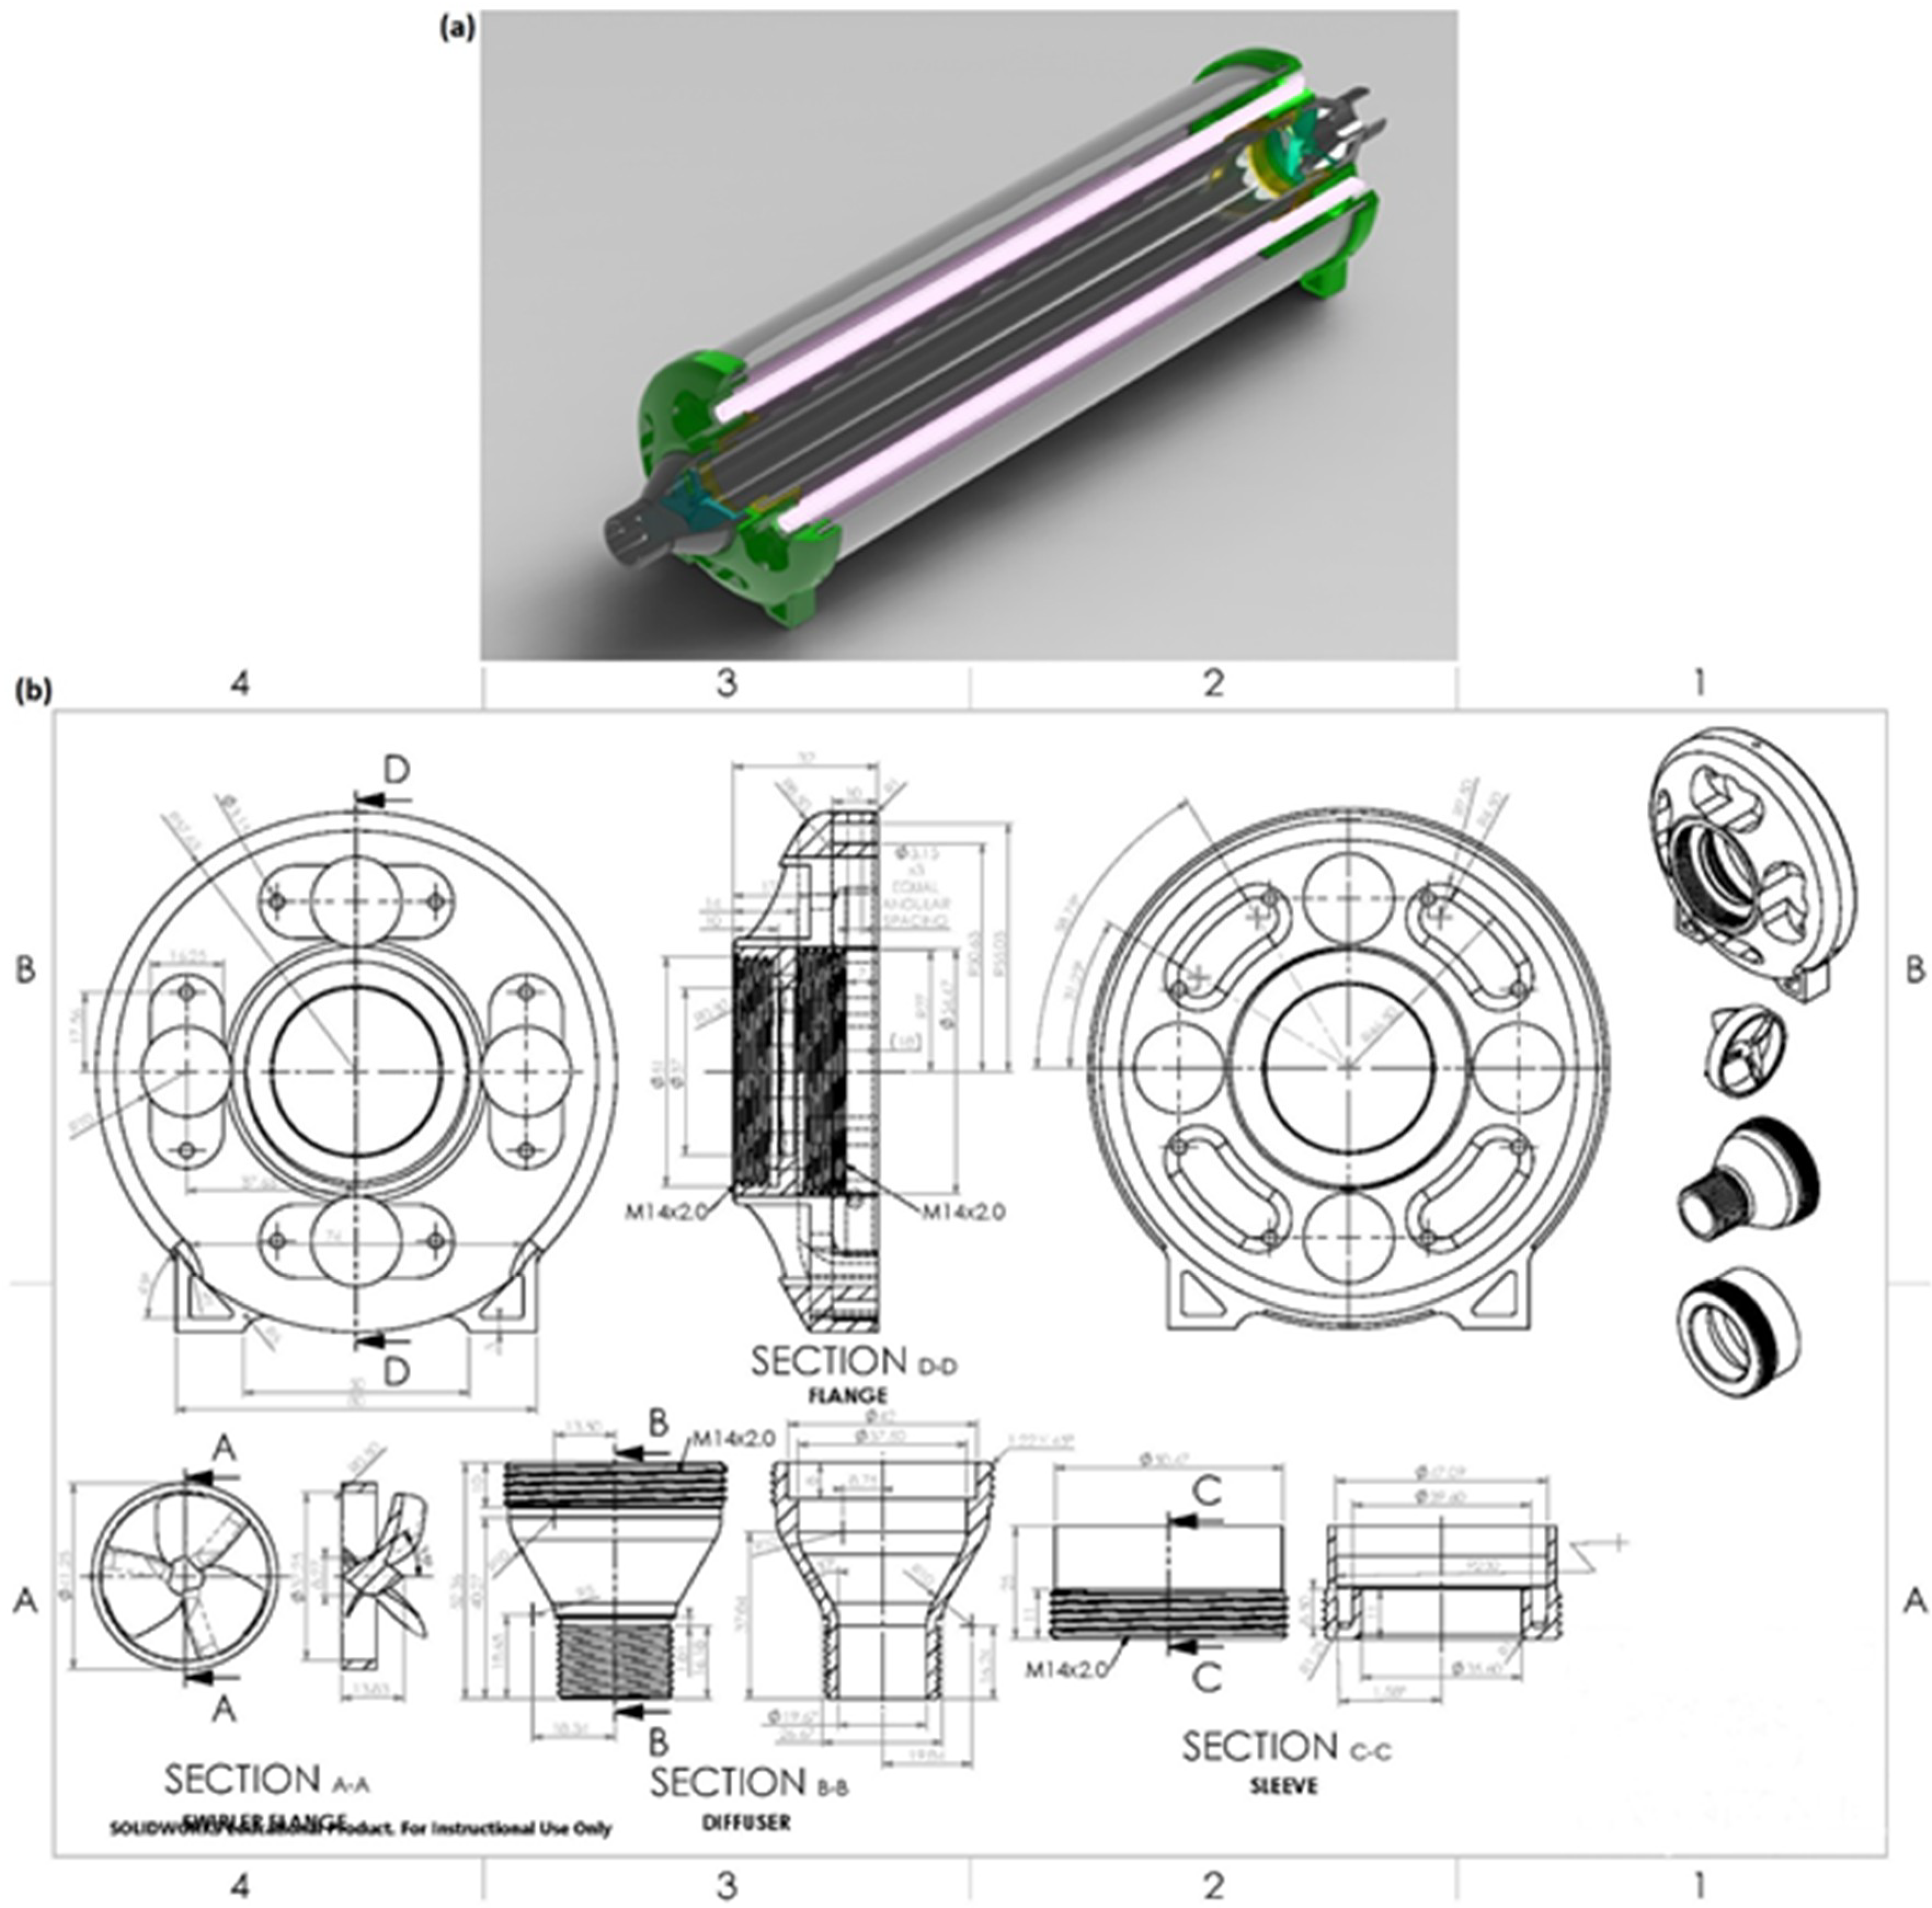
2.1. System Development

Details of the system developed in this work are presented in Figure 1. At its core, the system consists of a quartz tube through which flows the water to be treated. Quartz is one of few materials that allow UV radiation in the germicidally-effective C-band to pass through largely unattenuated. In this system, the quartz was supplied by Heraeus (Suprasil 130), whose UV transmission, at wave-length of 254 nm, is rated at 92% of the incident radiation. The UV lamps are now located outside of the quartz tube, seen colored in violet in Figure 1a. Their number is determined by several factors that include the intensity of the emitted UV radiation, the volume of the quartz tube, the rate at which water flows through it, and its UV transmissivity. In this paper, we report the performance of a system that was designed to accommodate a flow rate Q of up to 0.2 L/s. The quartz tube was of length L = 400 mm and inner diameter D = 70 mm, giving a total volume V = 1.54 L. The residence time was thus approximately 8 s. The tests were predominantly performed with two low-pressure UV lamps rated at 30 W each, producing a theoretical lamp intensity of 1.5 W/cm2. The actual radiation intensity at the axis of the quartz cylinder, where it is expected to be at its lowest value after being attenuated by the quartz walls and the water, was not measured. However, when dry, this was measured at 2.78 ± 0.127 mW/cm2. Thus, assuming uniform intensity throughout the quartz tube, the UV dose delivered by each lamp was estimated to be 187 mJ/cm2. Biodosimetry testing with the bacteriophage MS2 indicated the delivery of a UV dose of 215.6 mJ/cm2 when both lamps were operated simultaneously. The difference between the theoretical and actual dose is thus quite small.
An important feature of this system is the manner in which water flows into and out of the quartz tube. This is arranged through a diffusor at the inlet (top right of Figure 1a), and a nozzle at the outlet (bottom left of Figure 1a). These are identical in shape and dimensions. Their purpose is to connect the system to an existing water supply pipe in such a way as to minimize the kinetic energy losses that inevitably arise when a flow accelerates or decelerates due to a change in the cross-sectional area. Built into the diffusor and the nozzle are static guide vanes. Their function, in the diffusor, is to impart swirl to the inlet flow, and in the nozzle, is to maintain the swirl which would otherwise decay with distance from the inlet. Two benefits arise from imparting a strong swirling motion to the flow. The first is the amplification of turbulent mixing, which arises from the increased shearing of the flow. This has the effect of ensuring that the pathogens that enter the quartz tube close to its axis do not remain there to eventually leave the tube not having received a sufficient UV dose for complete inactivation but are, instead, well mixed with the flow and are thus brought close to the surface where the UV intensity is at maximum. The second benefit is that, as will be shown in the next section, the presence of swirl increases the magnitude of the shear stress at the quartz walls. This creates a mechanism for the operating system to be self-cleansing. In effect, the elevated shear stresses continually scrub the inner surface of the quartz tube to thus prevent the establishment of bio-film, or the accumulation of mineral residues.
The detailed design was performed digitally using SolidWorks, the engineering design software. The combined diffusor and the static guide vanes assembly was manufactured by three-dimensional (3D) printing. The printing was done using the Selective Laser Sintering (SLS) 3D technique. SLS is a type of 3D printing that is one of the most common rapid prototyping processes available commercially. It is significantly faster and more affordable than other alternative 3D printing methods, and can produce more complex geometries. The parts produced by this method are robust, of high strength, and resistant to UV radiation.
To complete the design of the inlet and outlet assemblies, each had a flange incorporated into it. Holes in these surfaces, also created by 3D printing, allowed for the UV lamps to be secured into position, parallel to the quartz tube, and at a set distance from its wall. Two circular grooves were created in the flanges: one that allowed the quartz tube to be held in place, and another that held the outer, protective shell in place.

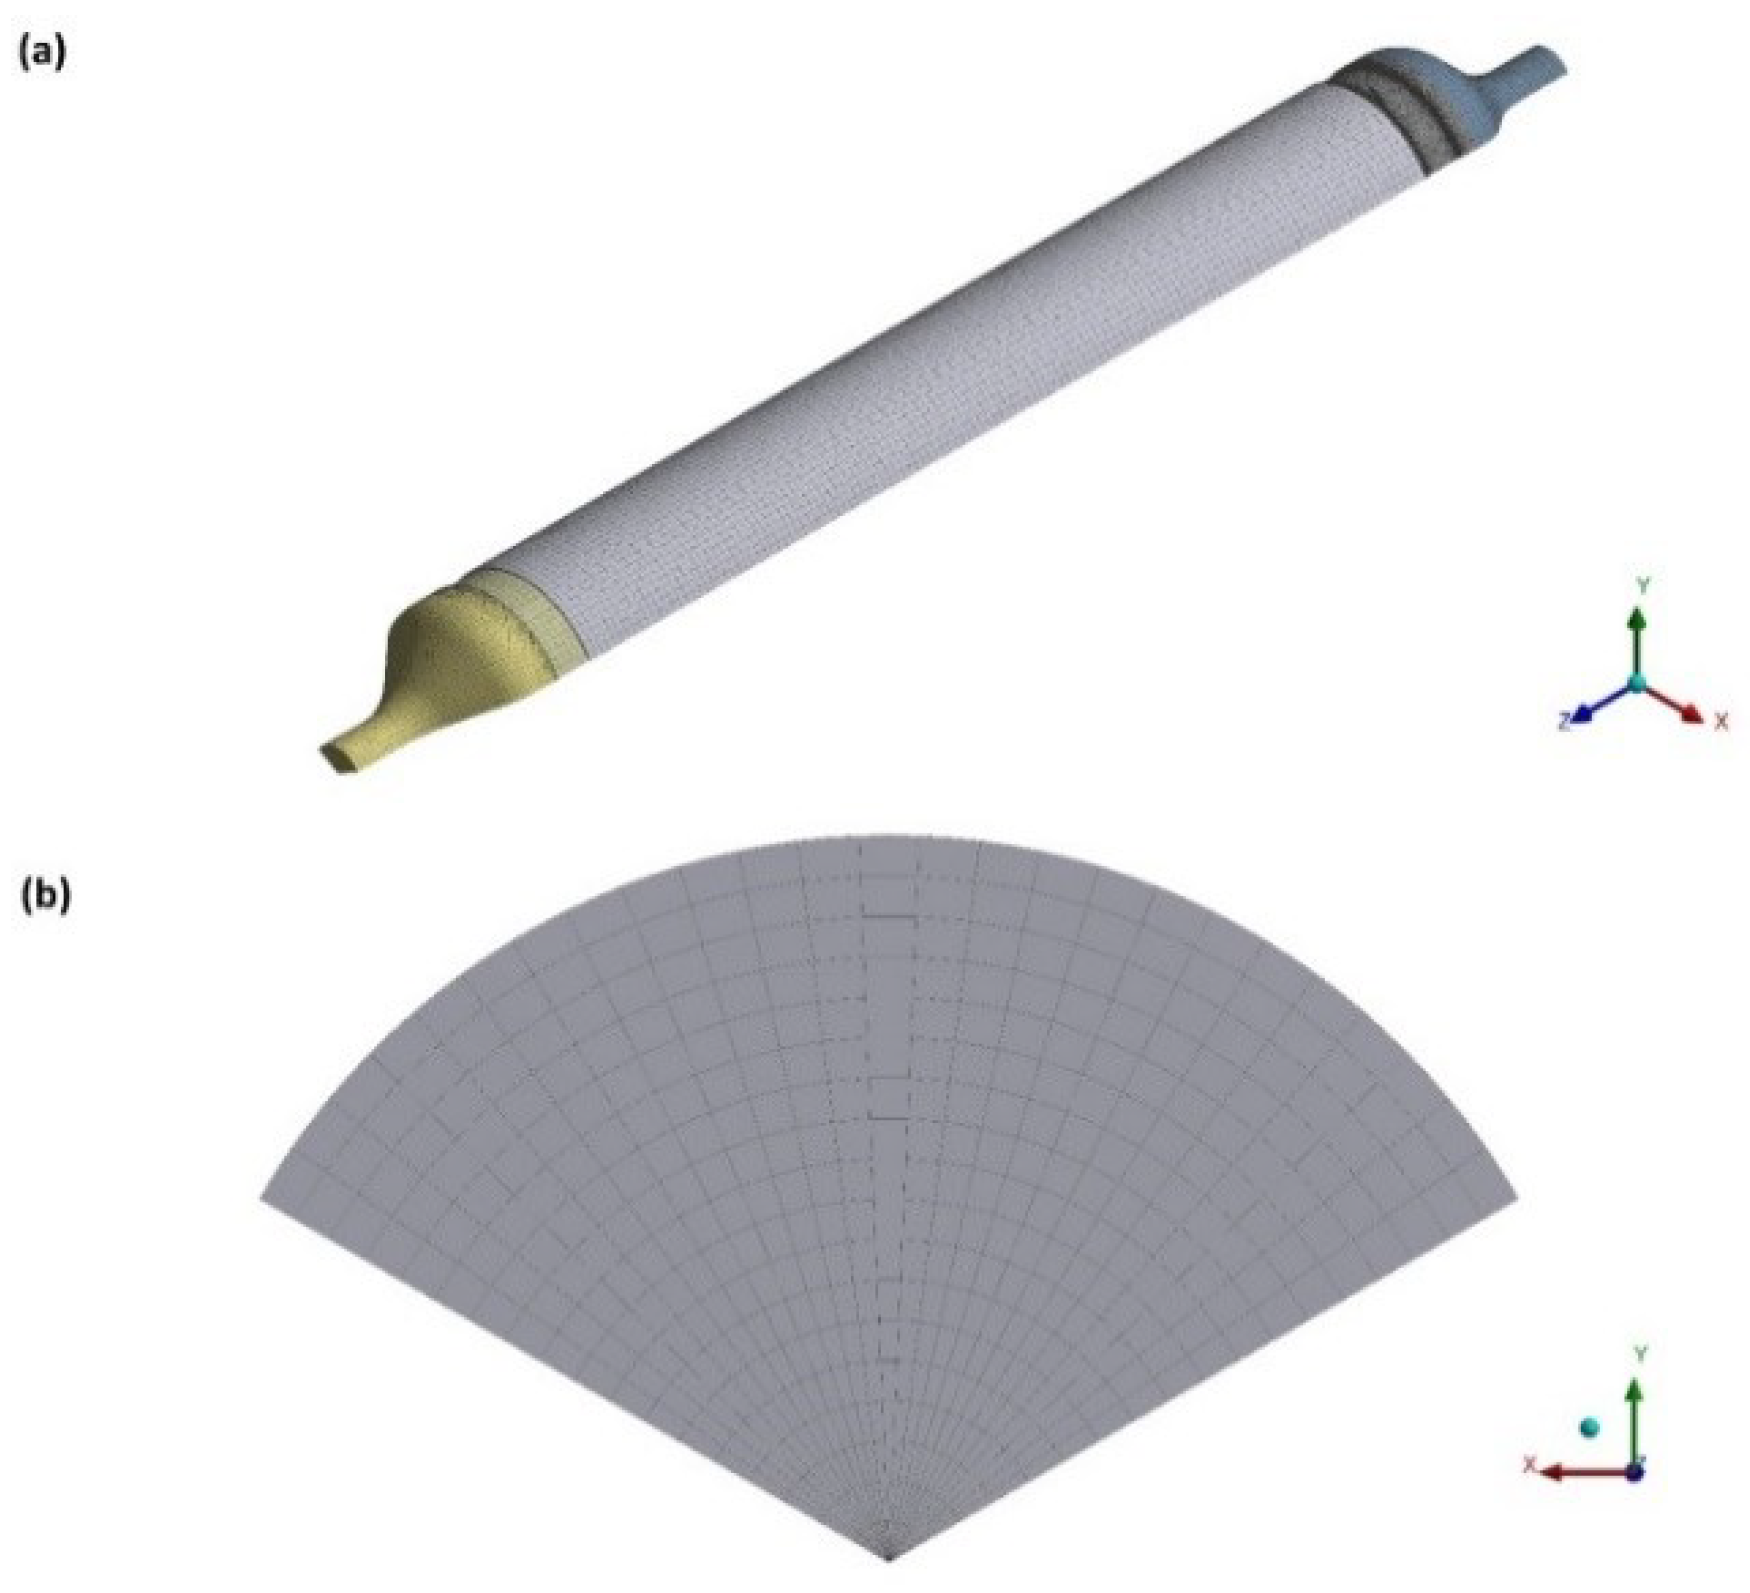
2.2. Computer Modeling

In developing the entry diffusor and exit nozzle, computer simulations utilizing the Fluent software for Computational Fluid Dynamics (CFD) were performed to investigate the patterns of mixing due to the induced swirl. This was done in part to check whether all influent flow was brought sufficiently close to the quartz tube surface where the intensity of the UV radiation was at a maximum. Another objective of the computer simulations was to provide guidance on how to minimize the hydraulic energy losses that occur across the entire system.
Figure 2 shows the computational grid used for the simulations, as well as the coordinates system used. It consisted of 504,544 nodes that were non-uniformly distributed across the domain to resolve the regions of flow where the streamlines are most strongly curved. Uniform flow conditions were assumed at the inlet while, at the outlet, the flow in the exit pipe was assumed to be fully developed and hence gradients of all dependent values were set equal to zero. The effects of turbulence were accounted for by using the two-equation realizable k-ε model of turbulence. The flow close to the wall was assumed to obey the universal logarithmic law of the wall and this provided the boundary conditions for k and ε there (the “wall function” approach). The solution procedure was iterative and the criterion for convergence was set to the sum of absolute residuals for all dependent variables fell to below 10−4, something that was achieved after about 1700 iterations. The simulations were performed using the finite volume methodology. Discretization of the equations governing the conservation of mass, momentum, and turbulence parameters was achieved by the second-order linear upwind scheme. The results of the computer simulations are presented in the next section.

2.3. UV System Setup

The system was run at 0.16 L/s with two low-pressure mercury UV-C lamps. The quartz tube was treated with a 10% solution of hydrochloric acid before installation to remove deposits on the surface. The UV system was run with water before testing to ensure that the quartz crystal cylinder was filled during operation. In addition, before any test dependent on UV light, the UV lights were first turned on for 5 min before the start of the test.
Initial water quality measurements were taken using a Myron L Company Ultrameter to determine the total dissolved solid (TDS), pH, oxidation reduction potential, and conductivity. UV absorbance (UVA) and UV transmittance (UVT) were assessed at a wavelength of 254 nm using a Cary Win UV-Vis spectrophotometer (Cary Win 1E, Varian Corp., Houston, TX, USA).

2.4. Microbial Propagation

The system was assessed in terms of the removal of E. coli and MS2 coliphage. The E. coli (ATCC #15597) was propagated with Luria Broth (LB) (Sigma-Aldrich) and a 0.4% inoculation. The solution was incubated at 37 °C for 12 h. The cells in the solution were then concentrated by centrifuging the samples for 20 min at 2500 rpm. The supernatant was then decanted and the pelleted cells were re-suspended in Milli-Q water at room temperature for use during testing so that the color of the LB media did not significantly alter the UVT of the sample water. E. coli concentration was determined using the membrane filtration (MF) technique according to standard methods (Method 9132) [11].
The MS2 coliphage (ATCC #15597-B1) was used to determine the UV dose supplied by the system, and its effectiveness at inactivating viral pathogens. A solution of the propagated virus and analysis of samples containing the virus were performed by Biovir Laboratories in Benicia, CA.

2.5. Germicidal Effectiveness

To assess the UV dose applied to the system, the system was spiked with MS2 and assessed at two different UVTs and flow rates. The source water for this testing was unchlorinated City of Davis groundwater at 20 ± 1.2 °C, pH 8.3 ± 0.15, and turbidity 3.8 NTU. The UVTs for this analysis were the original UVT of the groundwater at 95% and another adjusted to 70% using instant coffee (Pampa) per NWRI’s UV guidance manual [12]. The UVT was assessed at a wavelength of 254 nm using a Cary Win UV-Vis spectrophotometer (Cary Win 1E, Varian Corp., Houston, TX) and the flow rate was determined using an in-line flow meter (Omega, FL46300 Series). The initial concentrations of MS2 in the source water for the testing were 1.2 × 10⁸ pfu/mL and 3.0 × 10⁸ pfu/mL for UVTs at 95% and 70%, respectively.
For each of the four flow rate and UVT combinations, three samples were collected before and after exposure to the UV radiation for MS2 testing (the MS2 was detected by the host bacterium Escherichia coli ATCC 15797). Samples were stored at 4 °C for less than 24 h before being processed at the Biovir Laboratories in Benicia, CA using the double agar over-lay without RNase method for enumeration [13].

2.6. Hydraulic Tracer Test

A tracer study was conducted to determine the hydraulic performance of the reactor. A solution of methyl green (Sigma-Aldrich) and Milli-Q water was used as a conservative tracer using the absorbance at 615 nm as the tracer monitor. Approximately 25 mL at 150 mg/L was spiked into the inlet upstream of the pump, and was thereafter monitored as it passed through the system. The reactor was operated using unchlorinated City of Davis groundwater at 20 ± 1.2 °C and pH 8.3 ± 0.15. A 100-mL sample was collected every 2 s and the system was operated at 0.16 L/s. The absorbance at 615 nm was measured using a UV/Vis spectrophotometer (Cary Win 1E, Varian Corp., Houston, TX, USA).

2.7. Analysis of Scaling

To assess how scaling develops in the system, synthetic water types were continuously circulated through the system for 60 h under several conditions, including three irradiation conditions (two lamps on/one lamp on/both lamps off) and two types of synthetic water. The constituent concentrations for the synthetic waters are shown in Table 1. These solutions were made in 20-L batches with Milli-Q and operated at room temperature, 20 ± 1.4 °C. The pH of the first trial was 7.1 ± 0.17 and the pH of the second trial was 10.55 ± 0.13. Each trial was performed in triplicate.
All experiments were performed using continuous-flow and non-stop UV irradiation. For each trial, two 100-mL samples in amber glass bottles were collected. These samples were of the initial feed water and final water sample of treatment. Samples were stored at 4 °C for less than 48 h before being processed. Standard methods were followed after the samples were collected to assess the change in alkalinity [11].
A UV intensity meter was used to profile radiation intensity and temperature changes after the 60-hour treatments. Measurements of UV intensity were taken along the center, top, and bottom surface of the quartz cylinder. Visual inspection of the quartz was performed at 60-hour intervals to quantify changes of the inner surface with regards to color, fouling and scaling patterns, smoothness of surface, and session of irradiation with severe/medium/light fouling.
Analysis of how the fouling due to 60 h of operation with two lamps switched on has impacted the disinfection performance of the system was performed via introducing water spiked with E. coli to the system before and after the completion of the scaling test. The water for this test was Milli-Q operated at a pH of 7.1 ± 0.18 and a temperature of 20 ± 1.1 °C. Each trial was repeated in triplicate and samples were stored at 4 °C for less than 24 h before being processed.

2.8. Analysis of the Impact of Turbidity

To assess the impact of turbidity on the system, activated carbon at various concentrations was added to the system to generate the following levels of turbidity: 0.16 ± 0.05, 3.53 ± 0.85, 6.62 ± 1.51, 13.3 ± 1.67, and 17.83 ± 2.13 NTU. To ensure a small particle size, the activated carbon was first crushed, added to the Milli-Q water at a pH of 7 ± 0.16 and a temperature of 20 ± 1.4 ˚C, and then screened with a 20-µm cartridge filter before use. The solutions of activated carbon were also dosed with concentrated solutions of E. coli. The number of E. coli cells that were in the system before and after UV treatment were then assessed using the membrane filtration technique [12]. Each turbidity level was assessed three times and three samples were collected before and after the UV treatment for E. coli testing from each trial.

3. Results and Discussion

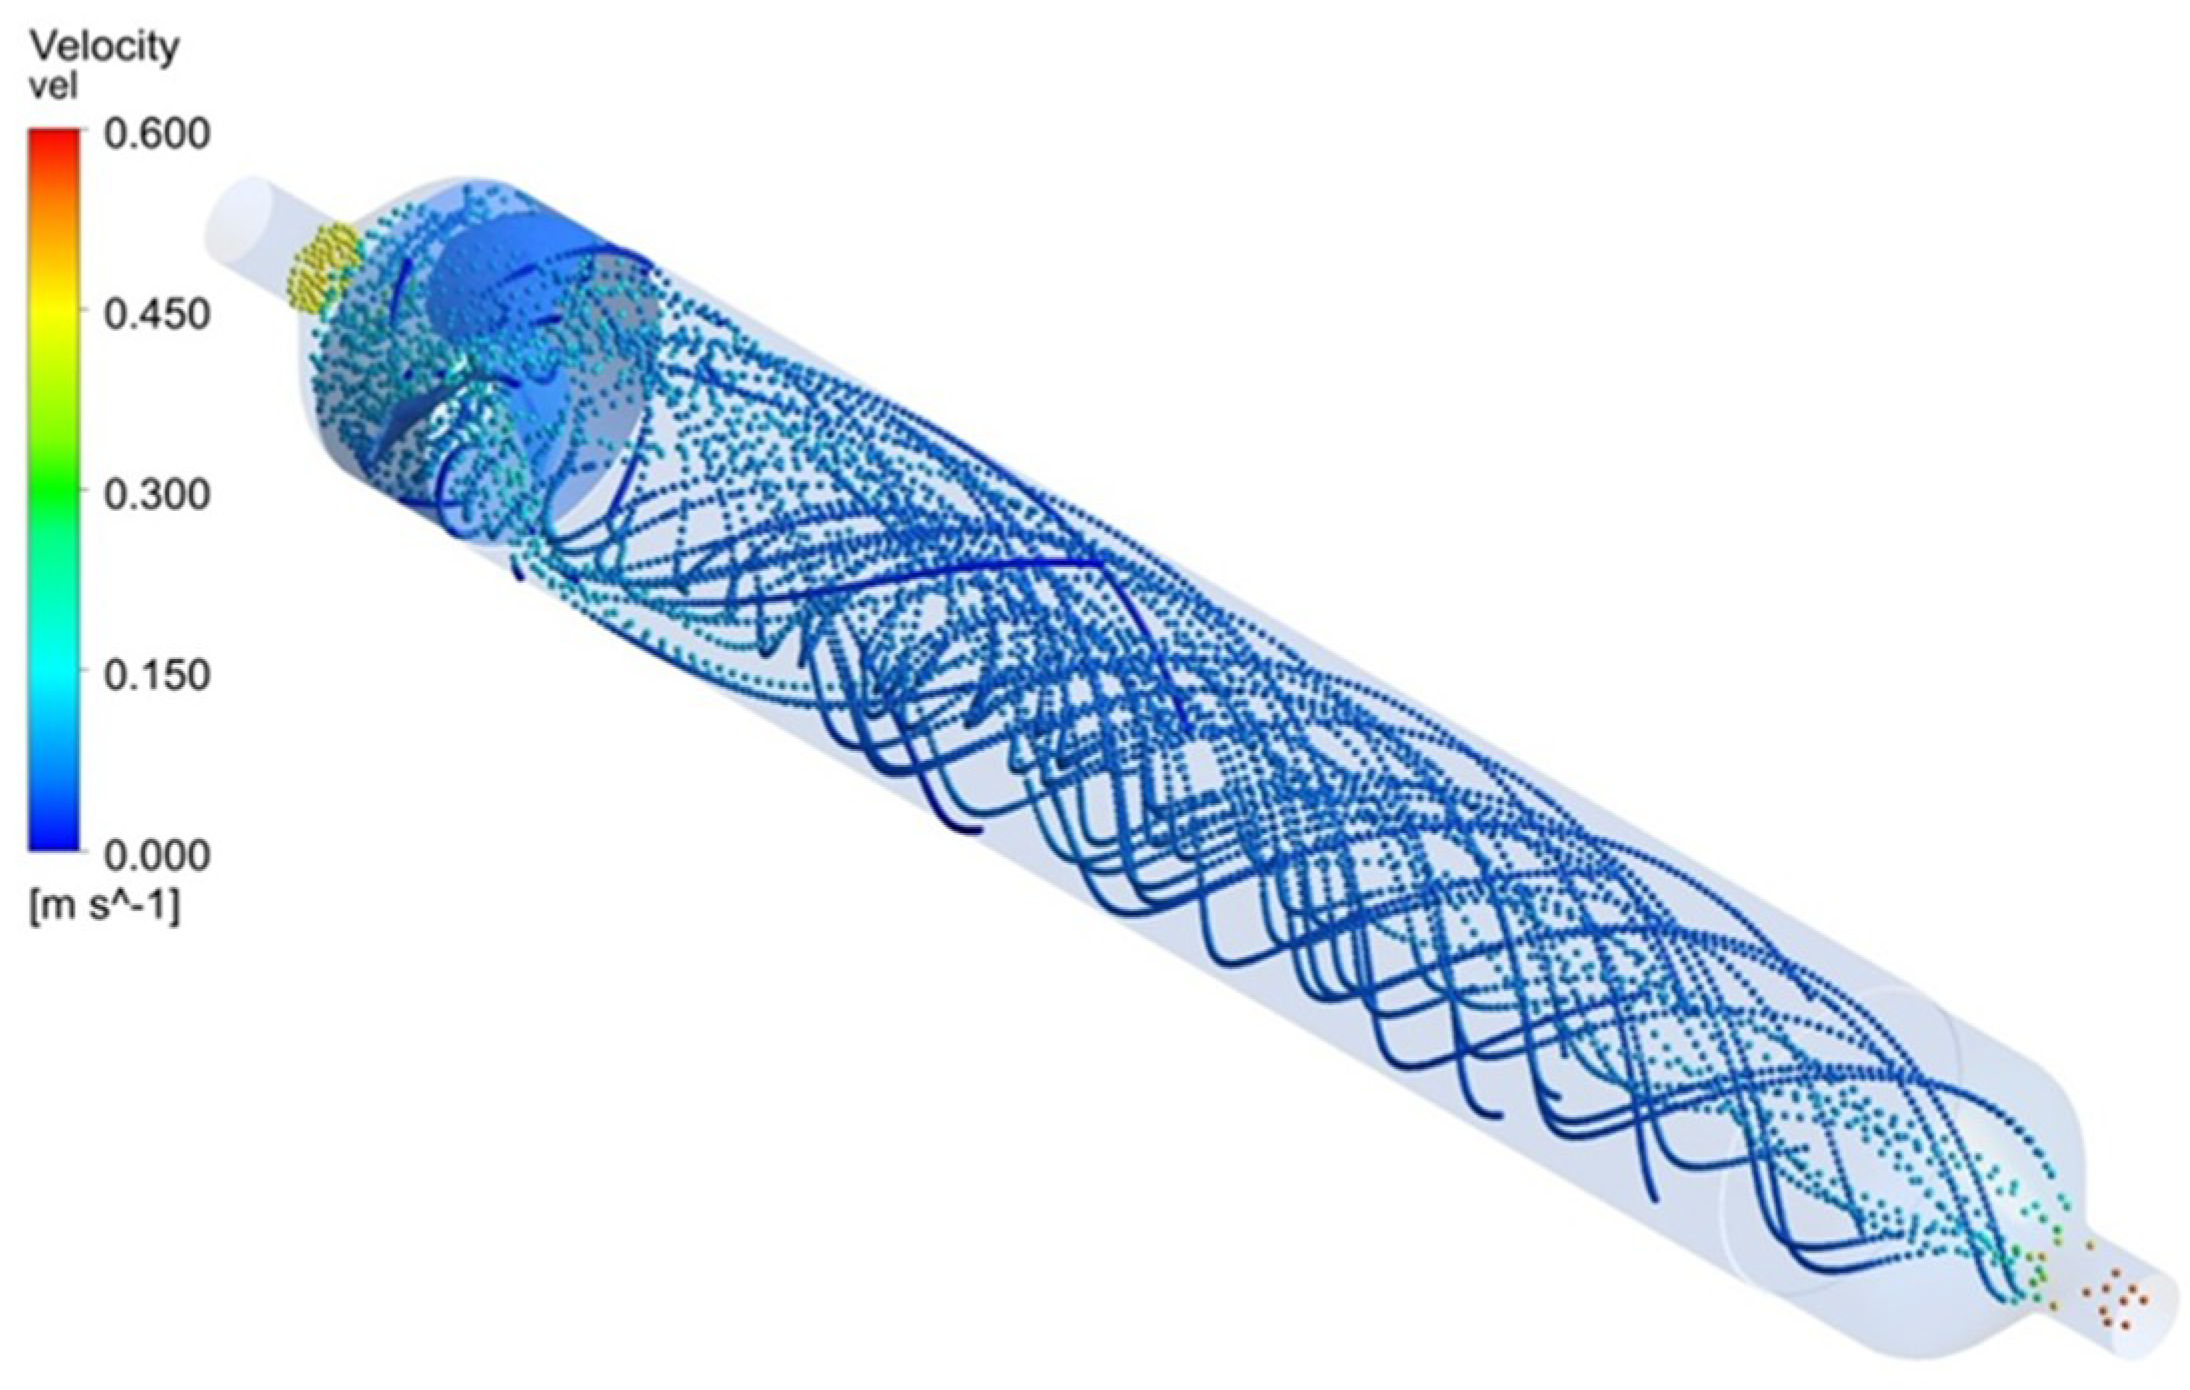
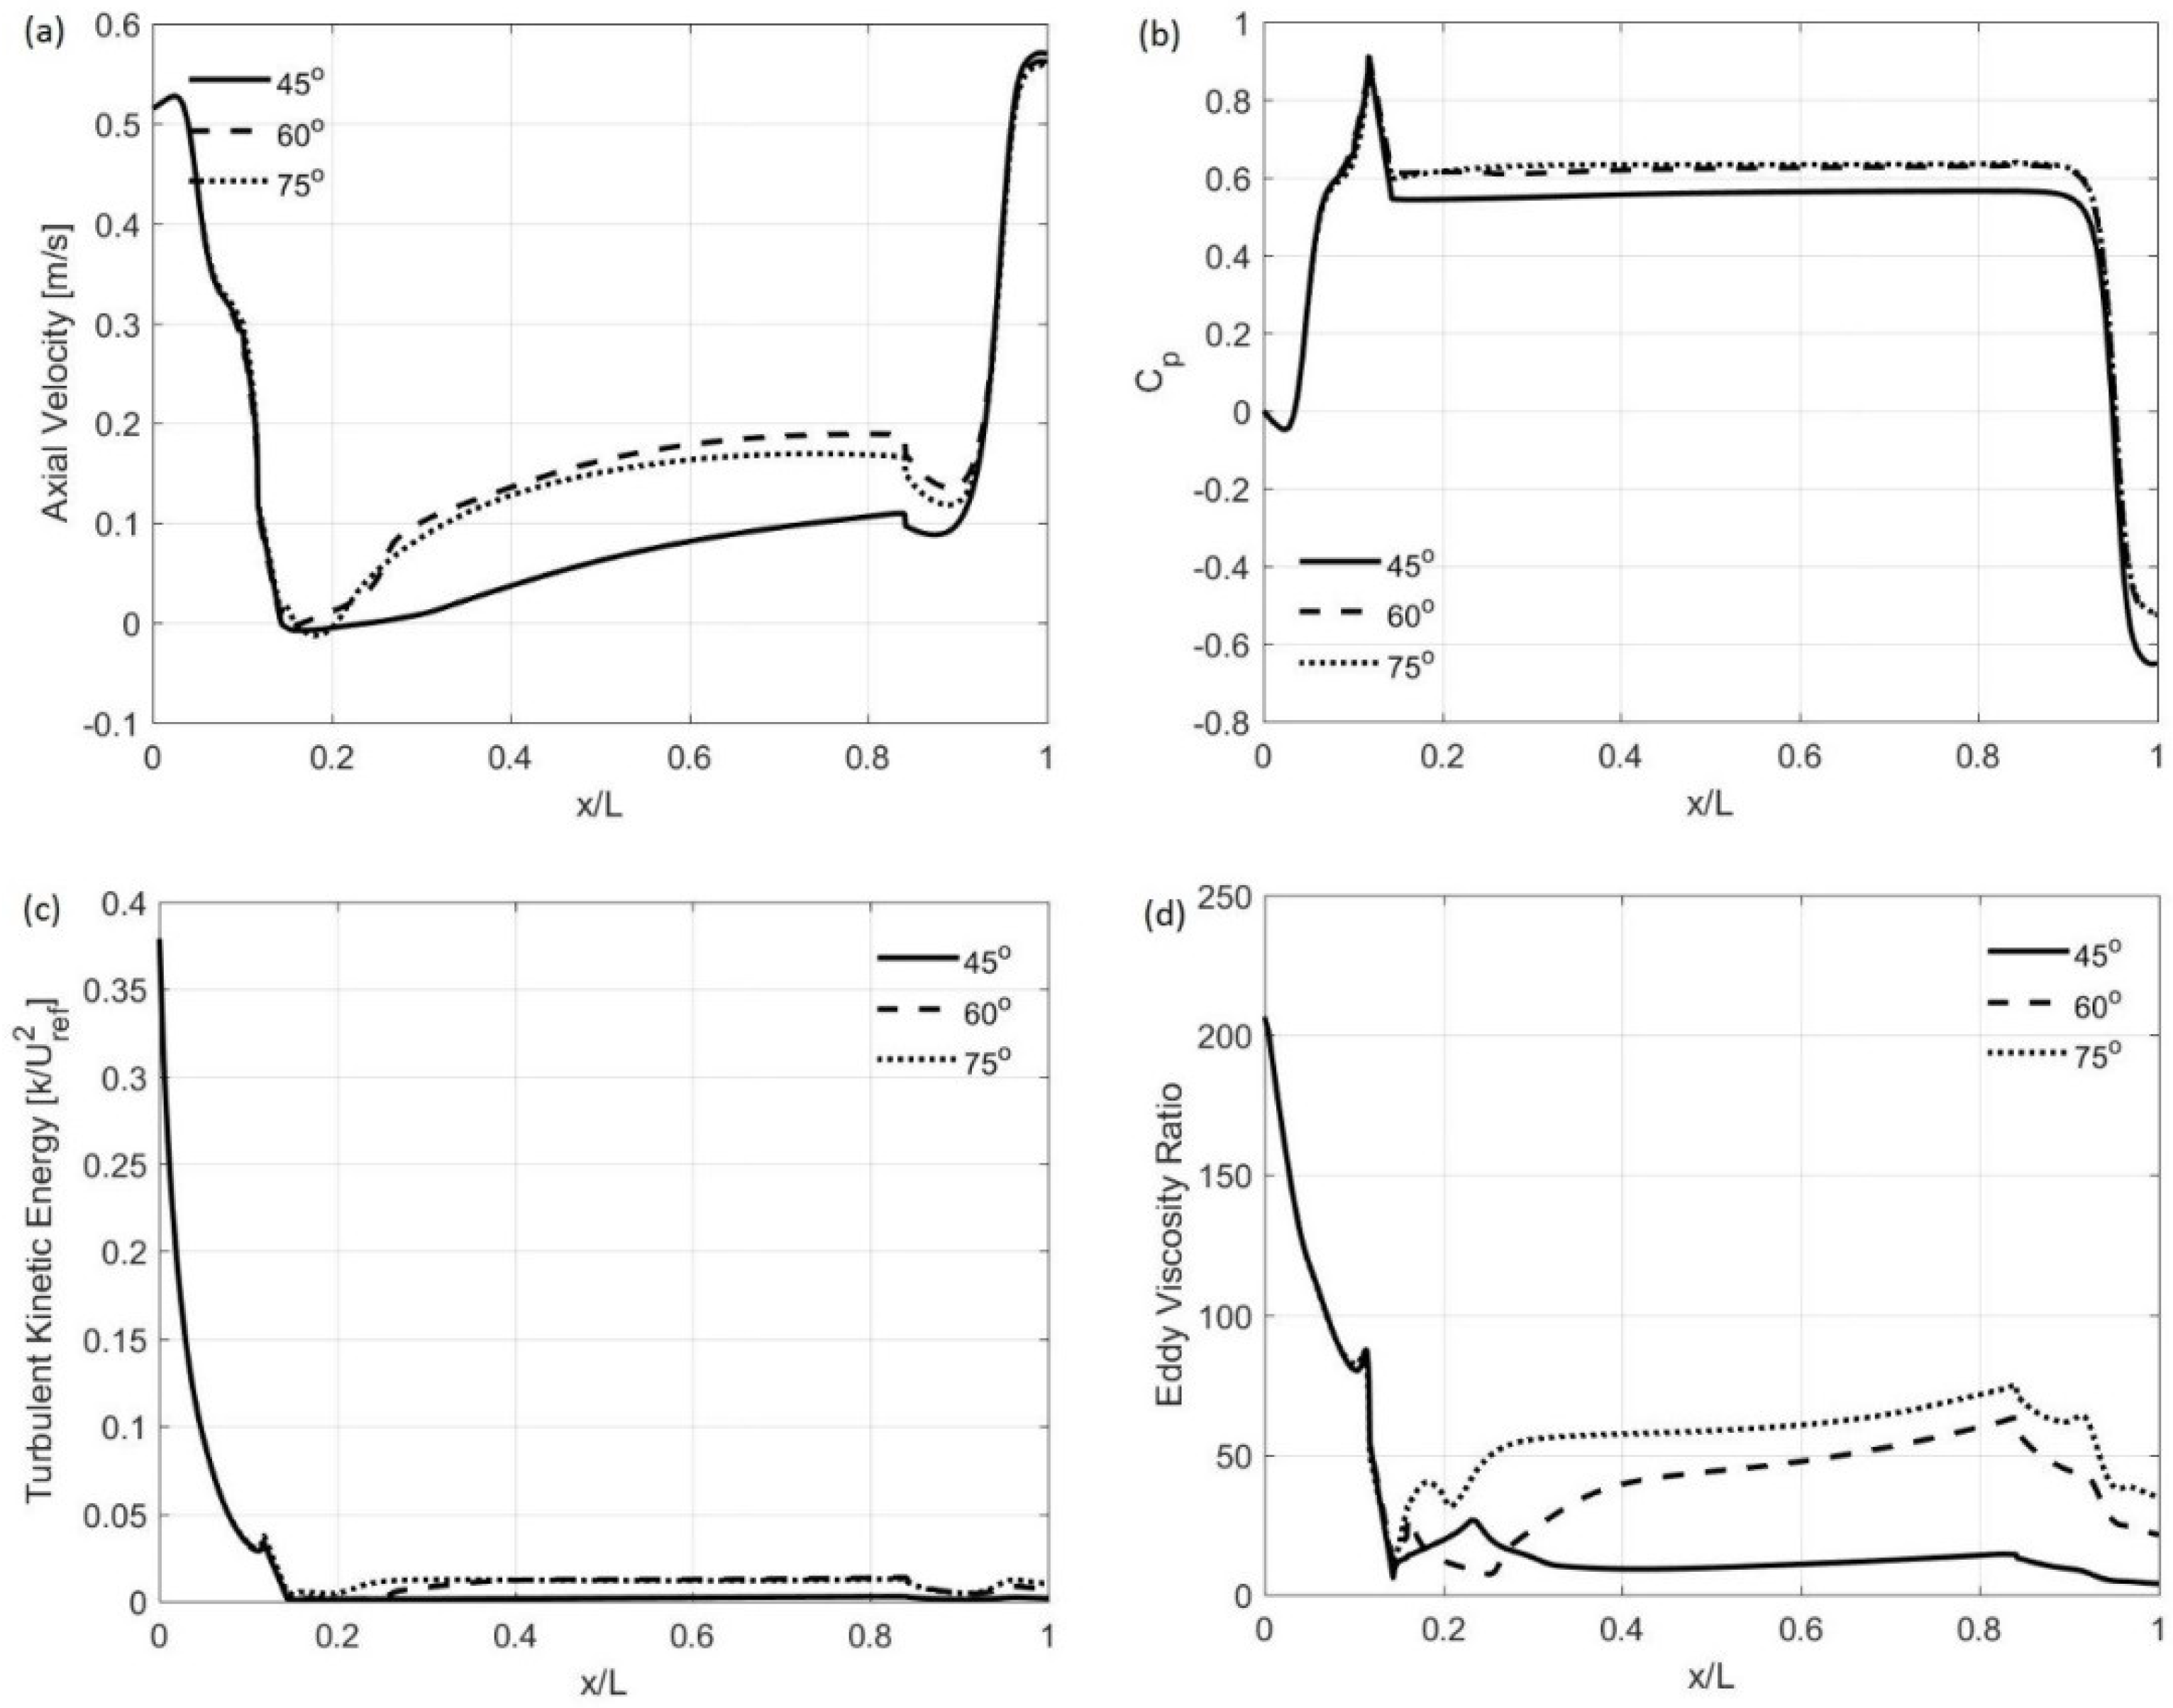
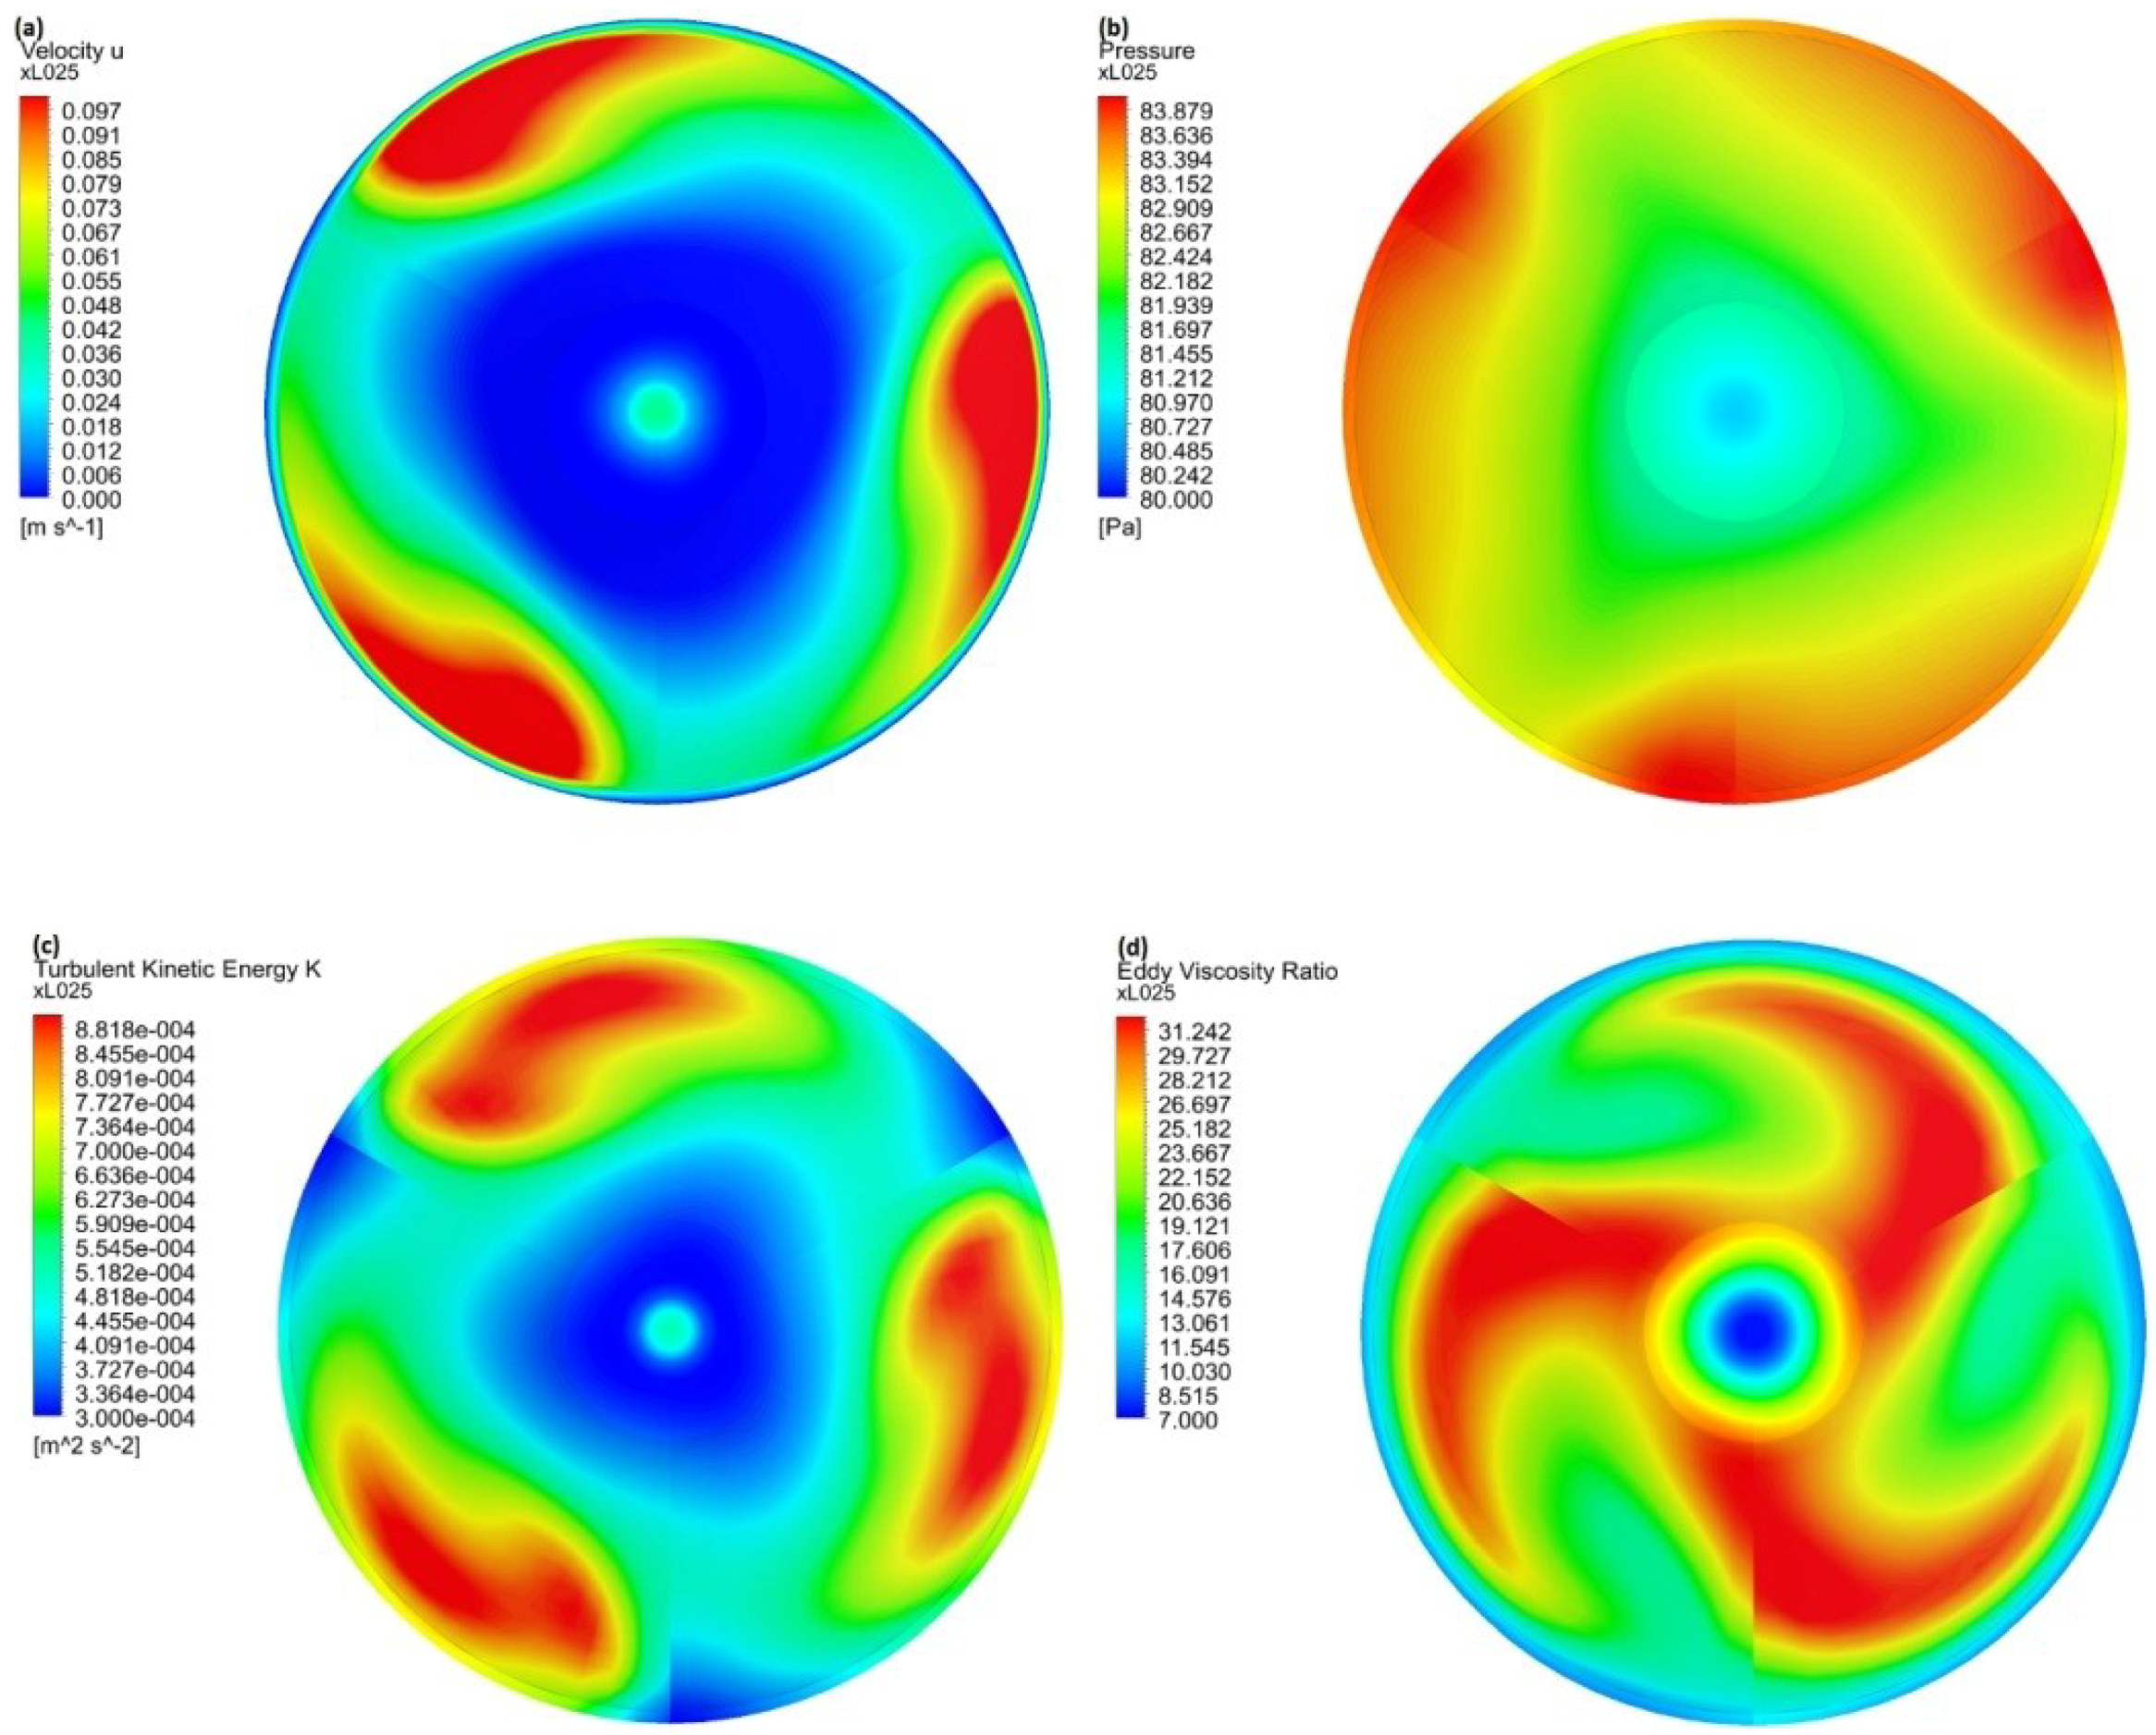
3.1. Computer Simulations

An overview of the flow generated within the system and, in particular, of the strong swirl generated by the guide vanes is presented in Figure 3. Shown there are the tracks of massless particles released at the inlet to the system (at top left) and then tracked as they were convected by the flow to the outlet (at bottom right). The particles follow a helical path under the combined effect of axial and tangential motions. The extent of swirl near the cylinder walls is quite pronounced, and hence acts as a self-cleansing mechanism preventing the fouling of the inner walls. The color scale gives the flow velocity in m/s.
Figure 4a–d show the variation, in the direction of flow, of the centerline values of axial velocity, the static pressure, the turbulence kinetic energy, and the ratio of turbulent (eddy) to molecular viscosity. Plotted there are results obtained for three different angles characterizing the skewness of the guide vanes with respect to the flow direction. The predicted axial velocity shows an initial rise indicating that the flow in the entry pipe develops from the assumed uniform inlet conditions. Once the diffusor section is encountered, the velocity drops in response to the increase in the cross-sectional area while the pressure rises, creating conditions for flow reversal due to adverse pressure gradients. Figure 4a indicates that a small region of recirculating flow was indeed generated for the case of the 75° guide vanes. Downstream of the diffusor, the flow recovers as it develops in the constant area tube, only to accelerate when the outlet nozzle is reached. There, the velocity increases fairly rapidly in response to the reducing area, while the pressure drops to a value below that at the inlet. The difference in pressure between the inlet and outlet represents the total pressure drop in the reactor—a measure of the hydraulic losses. Our aim in these studies was to minimize this quantity to the greatest extent possible while ensuring that turbulent mixing is enhanced. The ratio of turbulent to molecular viscosity is a good indicator of the extent of turbulent mixing in the flow. In our predictions, this ratio initially drops from the high value that was assumed at the inlet where the rate of turbulence generation was negligibly small due to the assumption of uniform flow, only to rise downstream of the guide vanes due to flow development and the imposition of swirl. At the outlet, turbulence mixing is reduced due to flow acceleration; this is manifested in a drop in the eddy viscosity ratio there.
The computed contours of axial velocity, static pressure, turbulence kinetic energy, and the eddy viscosity ratio are shown in Figure 5a–d. These contours, which are presented at a cross-section located at x/L = 0.25 from the inlet, show the effects of swirl on the main features of the flow. Of particular interest are the plots of the eddy viscosity ratio. Very close to the cylinder walls, this ratio is of the order of 10, signifying that the mixing due to turbulence is one order of magnitude greater than its laminar counterpart. Further from the walls, this ratio significantly increases due to the enhancing effects of swirl. Initially, this increase is confined to the regions behind the guide vanes where the swirling motion is at its most intense. Further downstream (not shown), the regions of high eddy viscosity ratio expand to fill the entire cross-section.

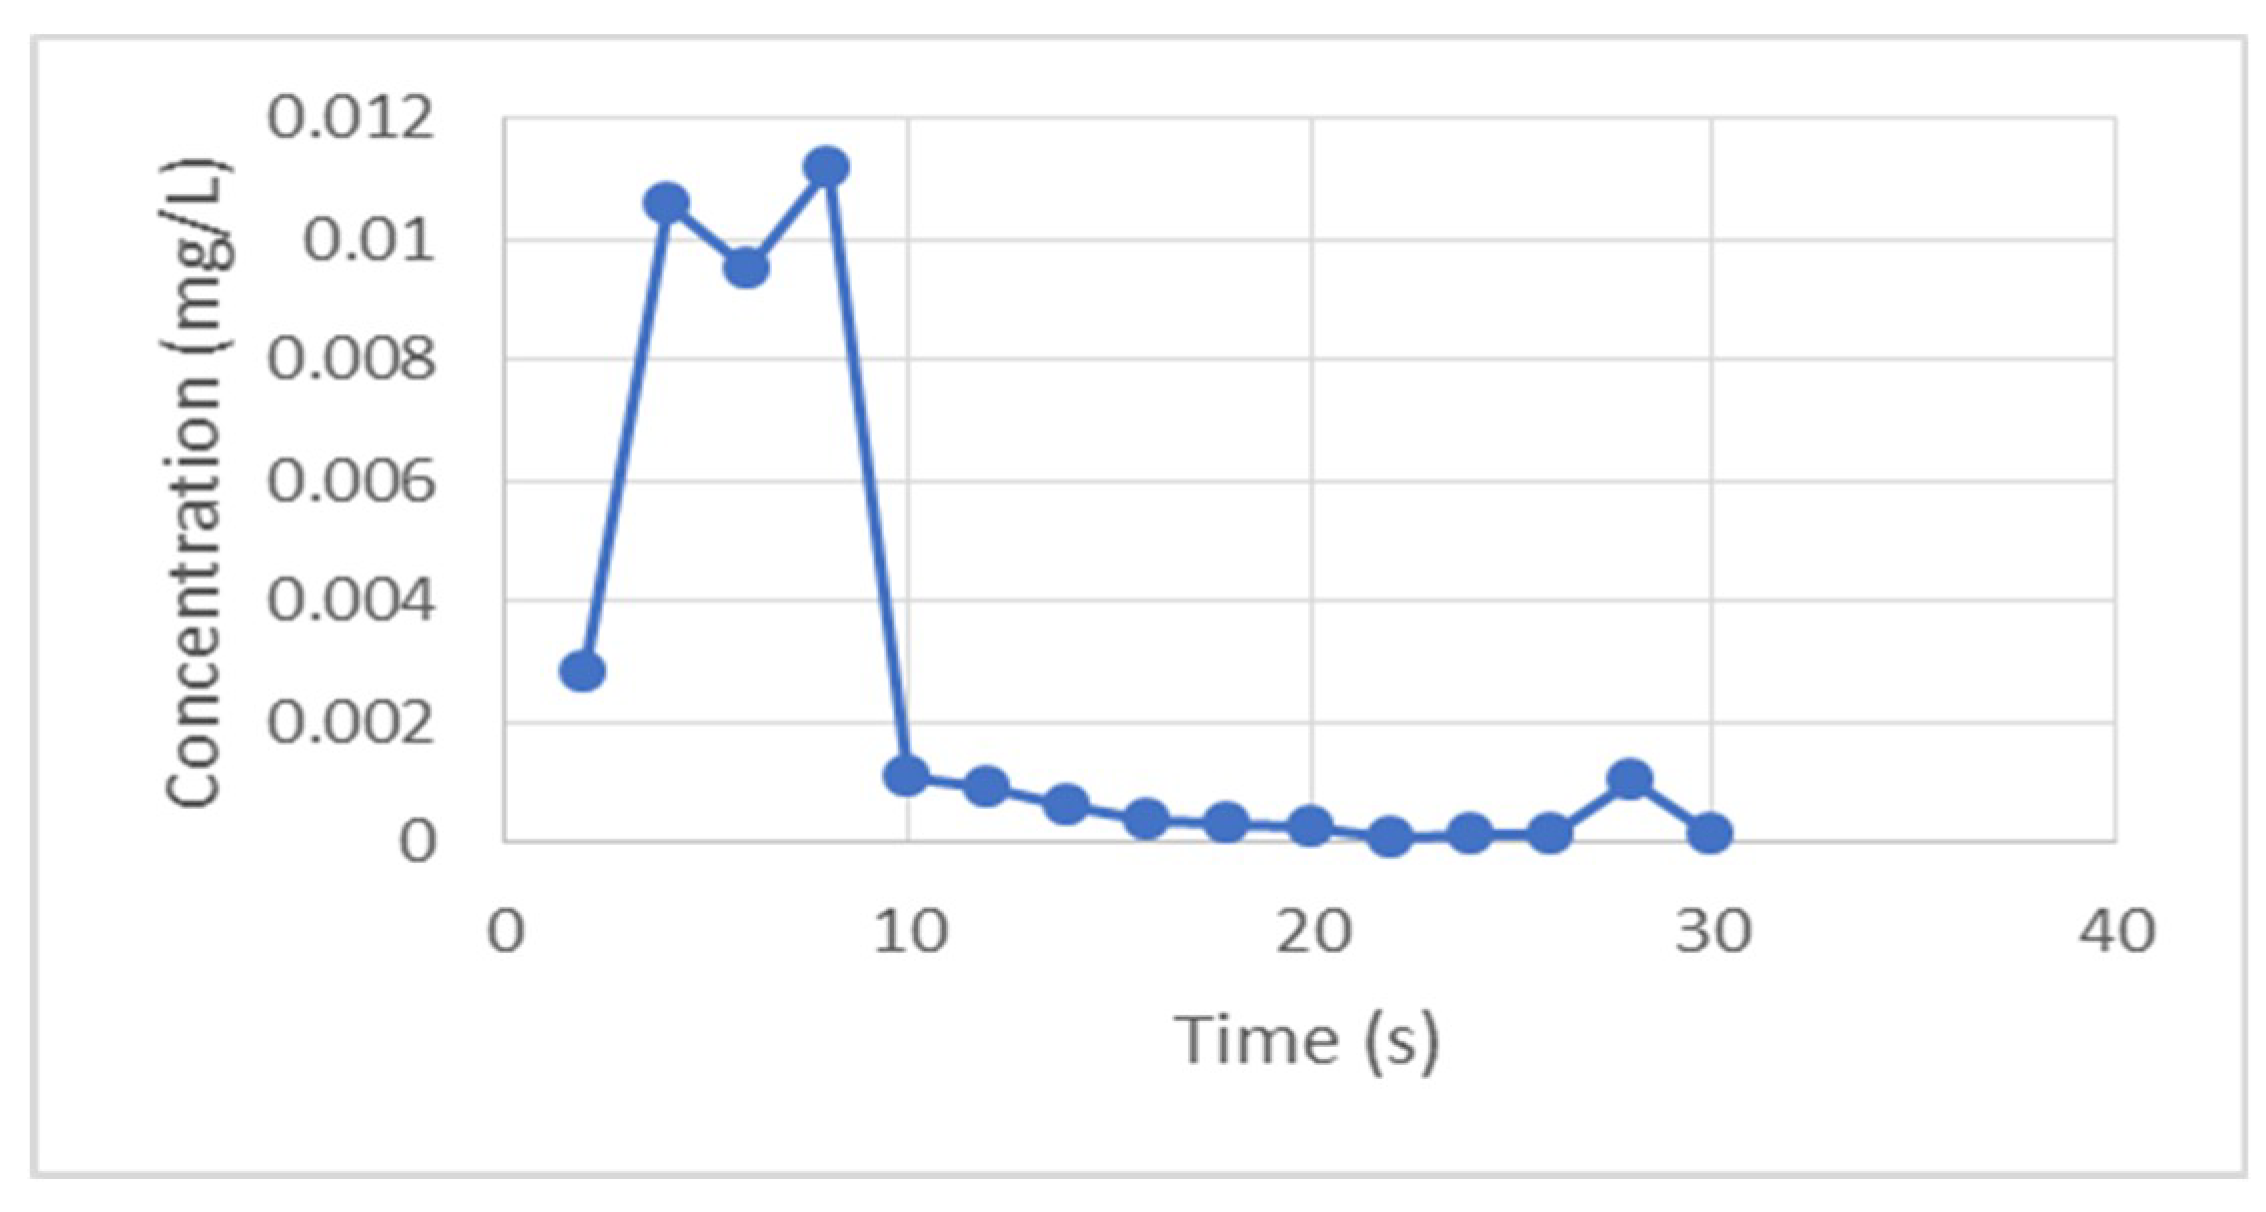
3.2. Hydraulic Tracer Results

A hydraulic tracer test was conducted to estimate the residence time in the system. Knowledge of this parameter yields a reasonable estimation of the overall hydraulic efficiency: too short a time would imply that an insufficient UV dose is being delivered, while too long a value would imply an oversized volume, or a low flow rate. In this test, a tracer, methyl green (with an initial concentration of 0.02 mg/L), was introduced at the inlet to the system and its concentration was measured at the exit. The outcome is shown in Figure 6. Using this data, the hydraulic residence time was calculated to be 1.6 s, which is slightly lower than expected [5]. By this method, the system efficiency was estimated to be 73% (see Table 2) which is quite encouraging considering that the actual velocity profile was significantly different from the plug-flow profile assumed in this analysis.

3.3. Germicidal Effectiveness

The UV dose delivered by a system (mJ/cm2) can be obtained as the sum of the product of the UV intensity and the exposure time. In practice, this is not easily done due to departure from plug-flow conditions and non-uniform intensity distributions. Instead, the UV dose is estimated using biodosimetry. Biodosimetry uses a known response pattern that an organism has to a specified level of radiation (typically generated using a collimated beam) and correlates it to the response pattern seen in the system. Thus, the dose assigned to a UV system after validation testing is really a “reduction equivalent dose” or the UV dose found in the collimated beam for the equivalent amount of microbial inactivation achieved in the system [12]. The dose-response curve was generated with the collimated beam, using UC Davis industrial water as the substrate and MS2 coliphage as the microbial organism. The analyses were performed by BioVir Laboratories Inc., who reported that the dose response data can be fitted by the straight line (R2 = 0.979):
L = 0.26 + 0.0297 D
where L is the MS2 log10 reduction and D is the UV dose (mJ/cm2).
By evaluating the actual log10 removal of MS2 from the measurement of its concentration in the influent and effluent streams, and by assuming that the dose response curve given by Equation (1) remains linear, it becomes possible to estimate the UV dose delivered by our system at various flow rates and UVT values. The results are shown in Table 3. The UV dose of 215.6 mJ/cm2 delivered at a flow rate of 0.16 L/s and a UVT of 95% is sufficient to inactivate most pathogenic bacteria, protozoa, fungi, and viruses of common concern. Moreover, given that the delivered UV dose exceeds twice the NSF standard, the system may be operated using only one of the two lamps.

3.4. Analysis of Scaling

Fouling of the inside of the system impairs the penetration of the UV radiation and reduces the UV dose applied to the water. Fouling can occur due to a number of mechanisms that include scaling, chemical reaction, corrosion, and bio-film fouling [14,15]. In this work, we focus on scaling due to its frequent occurrence in UV systems. Scaling (sometimes called precipitation or crystallization fouling) is the process by which inverse volubility salts in water, such as CaCO3, CaSO4, and Ca3(PO4)2, precipitate onto surfaces. The mechanisms by which UV radiation promotes scaling are not well understood but are thought to involve ferric hydroxide precipitation (Fe(OH)3) and calcium organic species releasing calcium followed by the precipitation of iron, magnesium, and calcium carbonate, all of which have been found to be the primary contributors to the scaling of UV systems [16]. The thermal output of the UV lamps can accelerate this process, while the hydrodynamics of the flow within the system can either aid or inhibit it. Thus, for example, the flow velocity influences scaling by modifying the diffusional and removal rates of constituents in the water, and by altering the quality of the scale formed. Scale formed at low velocities (<0.3 m/s) tends to be more porous and less tenacious than scale formed at higher velocities (>0.5 m/s) [17]. Moreover, the patterns of flow within the system influence the scaling process via the induced wall shear stresses. In the present system, these stresses are significantly magnified by the presence of the strong vortex generated by the guide vanes; hence, it is reasonable to expect that the formation of scale will be inhibited. The outcome of tests on scaling can be seen in Table 4. The results there are from continuous testing with hard water containing calcium, iron, and magnesium. They show the change in alkalinity and reduction in UV transmittance for the case when the system was filled with stationary water, and when water was pumped through at a rate of 0.16 L/s corresponding to a velocity of 2 cm/s. This velocity is lower than the 10 cm/s threshold suggested by Lin et al. [18,19] for the point above which thermal output of the UV lamps has a minimal impact on UV fouling. This suggests that the presence of swirl and consequent increase in wall shear stress has limited the thermal impact of the UV lamps, and of the sedimentation of suspended particulates.
To help isolate the impact of velocity on the system, a second test was performed with feed water containing just calcium and carbonate. This showed that while the finite velocity decreased scaling when the UV lamps were off, the reduction in transmittance went from 63% to 12%. However, with the lamps on, less scaling was formed when there was no flow than with a flow rate of 0.16. This indicates that for this scenario, temperature is not a main contributor to the formation of scale in the system and another mechanism, such as sedimentation, governs scaling in the system. Scaling was also dominated by precipitation on the bottom of the quartz rather than on the sides opposite the lamps, suggesting that particulate fouling, where the scaling salts are developed in solution and then attach onto the heat transfer surface, is the dominate form of scaling in the system. This is beneficial, since when scaling does not mainly form on the sides of the reactor, less UV radiation is inhibited, thereby preserving the UV dose applied to the system for a longer time period and lengthening the periods between which the system needs to be serviced.
Table 5 shows that the disinfection capability of the system is not significantly impacted by the accumulation of scale. The log10 removal of E. coli was not diminished after the system was run for 96 h with hard water, with both lamps on and at a flow rate of 0.16 L/s.

3.5. Impact of Turbidity

Turbidity is a measurement of the number of suspended particles in a water sample. It is an important parameter to quantify, because these particles can embed pathogenic microorganisms and act as a shield for free-floating microorganisms, thereby preventing these organisms from being exposed to the UV radiation [12]. Understanding how turbidity impacts the system informs the user on what type of upstream filtration is needed for the system and serves as a guide for suitable water types for the system to treat. As shown in Table 6, the disinfection capacity of the system was not significantly impacted when tested with water containing turbidity levels from 0 to 18 NTU, and the disinfection of E. coli in all scenarios remained above 5 log10 removal. The absence of an impact of turbidity suggests that this system would be suitable for operation with upstream filters that have a nominal opening of 20 µm, the size used to screen particles for this analysis. Similarly, the UV system would also be suitable to be operated with waters that contain higher turbidities, such as surface water, sandy groundwater wells, or recycled water.

4. Conclusions

Our aim in performing the research reported here was to develop a system for water disinfection with UV radiation that is not prone to the problem of lamp fouling while being effective for use in water with high turbidity levels and low UVT. The proposed design achieves these aims by locating the UV tubes outside the water-conveying quartz tube, and by imparting a strong swirling motion to the inlet flow that ensures uniform exposure to UV radiation and provides a self-cleansing mechanism that prevents the accumulation of bio-film and residues on the inside of the quartz. Future research will focus on the adaptation of the UV system for use in conjunction with an oxidant to form an Advanced Oxidation Process (AOP) [20]. The aim will be to reduce the chemical contaminants and the toxicity from highly-polluted waters conveyed at low to moderate flow rates. In particular, we plan to devise a method to collect the ozone which is naturally generated by the operation of the UV lamps in air, and inject that into the influent stream to provide the hydroxyl radicals needed for the AOP. We envision that introducing ozone into the influent stream can be done using a Venturi nozzle, wherein the water is accelerated to the extent that the resulting reduction in static pressure will be sufficient to draw in the ozone without the need for a complex mechanical apparatus.

Supplementary Materials

The following are available online at https://www.mdpi.com/2073-4441/10/9/1275/s1.

Author Contributions

Conceptualization, B.A.Y.; methodology, B.A.Y. and L.M.; software, N.P. and B.A.Y.; validation, B.A.Y., N.P., and L.M.; formal analysis, L.M. and B.A.Y.; investigation, B.A.Y. and L.M.; resources, B.A.Y.; data curation, L.M. and N.P.; writing—original draft preparation, B.A.Y. and L.M.; writing—review and editing, B.A.Y.; visualization, N.P.; supervision, B.A.Y.; project administration, B.A.Y.; funding acquisition, B.A.Y.

Funding

This research was funded by the Sustainability Training and Research Program (SRTP) at the University of California—Davis, and by Diamond Developers, The Sustainable City—Dubai.

Conflicts of Interest

The authors declare no conflict of interest. The funders had no role in the design of the study; in the collection, analyses, or interpretation of data; in the writing of the manuscript, or in the decision to publish the results.

References

  1. Berndt, E.C.; Creighton, H.M. Method for irradiating substances with active rays. US Patent 2072417A, 2 March 1934. [Google Scholar]
  2. Bolton, J.R.; Linden, K.G. Standardization of methods for fluence (UV dose) determination in bench-scale UV experiments. J. Environ. Eng. 2003, 129, 209–215. [Google Scholar] [CrossRef]
  3. Gates, F.L. A study of the bactericidal action of ultra violet light: III. The absorption of ultra violet light by bacteria. J. Gen. Physiol. 1930, 14, 31–42. [Google Scholar] [CrossRef] [PubMed]
  4. Linden, K.G.; Shin, G.; Sobsey, M.D. Comparative effectiveness of UV wavelengths for the inactivation of Cryptosporidium parvum oocysts in water. Water Sci. Technol. 2001, 43, 171–174. [Google Scholar] [CrossRef] [PubMed]
  5. Tchobanoglous, G.; Stensel, H.; Tsuchihashi, R.; Burton, F.; Abu-Orf, M.; Bowden, G.; Pfrang, W. Wastewater Engineering: Treatment and Resource Recovery, 5th ed.; Metcalf & Eddy I AECOM; McGraw-Hill Book Company: New York, NY, USA, 2014. [Google Scholar]
  6. Oliver, M. Validation of Cleaning Methods for UV Disinfection Systems. Proc. Water Environ. Federation 2002, 1, 564–579. [Google Scholar] [CrossRef]
  7. Sultan, T. Numerical study of the effects of lamp configuration and reactor wall roughness in an open channel water disinfection UV reactor. Chemosphere 2016, 155, 170–179. [Google Scholar] [CrossRef] [PubMed]
  8. Wols, B.A.; Hofman, J.A.M.H.; Beerendonk, E.F.; Uijttewaal, W.S.J.; Van Dijk, J.C. A systematic approach for the design of UV reactors using computational fluid dynamics. AIChE J. 2011, 57, 193–207. [Google Scholar] [CrossRef]
  9. Li, W.; Li, M.; Bolton, J.R.; Qiang, Z. Configuration optimization of UV reactors for water disinfection with computational fluid dynamics: Feasibility of using particle minimum UV dose as a performance indicator. Chem. Eng. J. 2016, 306, 1–8. [Google Scholar] [CrossRef] [Green Version]
  10. Brownell, S.A.; Chakrabarti, A.R.; Kaser, F.M.; Connelly, L.G.; Peletz, R.L.; Reygadas, F.; Lang, M.J.; Kammen, D.M.; Nelson, K.L. Assessment of a low-cost, point-of-use, ultraviolet water disinfection technology. J. Water Health 2008, 6, 53–65. [Google Scholar] [CrossRef] [PubMed]
  11. APHA. Standard Methods for the Examination of Water and Wastewater; Rice, E.W., Baird, R.B., Eaton, A.D., Clesceri, L.S., Eds.; American Public Health Association: Washington, DC, USA, 2012. [Google Scholar]
  12. NWRI. Ultraviolet Disinfection Guidelines for Drinking Water and Water Reuse, 3rd ed.; National Water Research Institute: Fountain Valley, CA, USA, 2012. [Google Scholar]
  13. Adams, M.H. Bacteriophages; Interscience Publishers: New York, NY, USA, 1959. [Google Scholar]
  14. Taborek, J.; Aoki, T.; Ritter, R.; Palen, J.; Knudsen, J. Fouling: the major unresolved problem in heat transfer. Chem. Eng. Prog. 1972, 68, 69–78. [Google Scholar]
  15. Hasson, D.; Bramson, D. Effectiveness of magnetic water treatment in suppressing calcium carbonate scale deposition. Ind. Eng. Chem. Process Design Dev. 1985, 24, 588–592. [Google Scholar] [CrossRef]
  16. Nessim, Y.; Gehr, R. Fouling Mechanisms in a Laboratory-Scale UV Disinfection System. Water Environ. Res. 2006, 78, 2311–2323. [Google Scholar] [CrossRef] [PubMed]
  17. Sheikholeslami, R.; Watkinson, A. Scaling of plain and externally finned heat exchanger tubes. J. Heat Trans. 1986, 108, 147–152. [Google Scholar] [CrossRef]
  18. Lin, L.-S.; Johnston, C.T.; Blatchley, E.R. Inorganic fouling at quartz: water interfaces in ultraviolet photoreactors: I. Chemical characterization. Water Res. 1999, 33, 3321–3329. [Google Scholar] [CrossRef]
  19. Lin, L.-S.; Johnston, C.T.; Blatchley, E.R. Inorganic fouling at quartz: water interfaces in ultraviolet photoreactors—II. Temporal and spatial distributions. Water Res. 1999, 33, 3330–3338. [Google Scholar] [CrossRef]
  20. Glaze, W.; Kang, J.-W.; Chapin, D.H. The Chemistry of water treatment processes involving ozone, hydrogen peroxide and ultraviolet radiation. Ozone Sci. Eng. 1987, 9, 335–352. [Google Scholar] [CrossRef]
Figure 1. A rendered representation of the UV reactor (a) and the design details and dimensions of the various components (b).
Water 10 01275 g001
Figure 2. The computational grid used for the computer simulations. View along the side of the system showing the overall arrangement (a), and a cross-sectional view of the grid distribution in a sector (b).
Water 10 01275 g002
Figure 3. Computed tracks of massless particles released at the inlet to the UV system. The strong swirling motion responsible for enhanced mixing and wall cleansing is evident.
Water 10 01275 g003
Figure 4. Predicted variation along the reactor centerline of the mean axial mean velocity (a), the pressure coefficient (b), the turbulence kinetic energy (c), and the eddy-viscosity ratio (d). Results are plotted for three different values of blade pitch.
Water 10 01275 g004
Figure 5. Predicted cross-sectional contours of the mean axial velocity (a), the static pressure (b), the turbulent kinetic energy (c), and the ratio of turbulent to molecular viscosity (d). The enhanced levels of turbulence kinetic energy and thus of turbulent mixing due to swirl are evident.
Water 10 01275 g005
Figure 6. Measured concentration of methyl green tracer at the outlet from the reactor used to determine the hydraulic residence time.
Water 10 01275 g006
Table 1. Initial concentration of constituents in feed water.
TypeConstituentConcentration (mg/L)
1Iron, as ferric chloride (Sigma-Aldrich)1.0
Magnesium, as magnesium chloride (Sigma-Aldrich)200
Calcium, as calcium chloride (Sigma-Aldrich)300
2Calcium, as calcium chloride (Sigma-Aldrich)300
Carbonate, as sodium carbonate (Sigma-Aldrich)100
Table 2. Hydraulic tracer test results.
ParameterValue
Hydraulic Residence Time (s)1.6
Variance (s2)0.86
Standard Deviation (s)0.93
t10 (s)2.3
t50 (s)7.3
t90 (s)13.6
Morrill Dispersion Index1.4
Volumetric Efficiency (%)73%
Table 3. UV dose for the system at various flow rates and UV transmittance (UVT) values.
Flow (L/s)UVT (%)Log10 Influent MS2 Conc.Log10 Effluent MS2 Conc.Log10 Removal of MS2UV Dose (mJ/cm2)
0.16958.18 ± 0.101.60 ± 0.127.12 ± 0.93215.6 *
0.16708.60 ± 0.055.59 ± 0.093.01 ± 0.0993.9
0.22958.18 ± 0.102.72 ± 0.085.46 ± 0.08173.3 *
0.22708.60 ± 0.056.38 ± 0.132.22 ± 0.1364.5
* Assuming the linearity of the dose response curve.
Table 4. Reduction in transmittance and change in alkalinity due to hard water over 96 h operating at an initial UV dose greater than 120 mJ/cm2 and a UVT of 98%.
Water TypeNumber of LampsFlow Rate (L/s)Transmittance Reduction (%)Change in Alkalinity (%)
Feed (Ca+Fe +Mg)102253
20.161067
Feed (CaCl2+Na2CO3)006349
00.161218
203430
20.1643%22%
Table 5. Change in log10 removal after 96 h, with two lamps on, a 0.16 L/s flow rate, and CaCl2 and Na2CO3 feed water.
SampleLog10 Influent
E. coli Conc.
Log10 Effluent
E. coli Conc.
Log10 Removal of
E. coli
Pre-fouling7.32 ± 0.040.35 ± 0.286.9 ± 0.50
Post-fouling6.97 ± 0.58−0.11 ± 0.346.9 ± 0.58
Table 6. Impact of turbidity on disinfection performance.
Turbidity
(NTU)
Log10 Influent
E. coli Conc.
Log10 Effluent
E. coli Conc.
Log10 Removal of
E. coli
0.16 ± 0.037.17 ± 0.121.45 ± 0.175.5 ± 0.3
3.53 ± 0.117.02 ± 0.161.55 ± 1.165.1 ± 1.0
6.62 ± 0.217.15 ± 0.121.24 ± 0.865.6 ± 1.0
13.30 ± 0.536.91 ± 0.420.35 ± 0.496.8 ± 0.9
17.83 ± 0.326.93 ± 0.061.80 ± 0.215.1 ± 0.2

