Land Use and Land Cover Changes and Their Effect on the Flow Regime in the Upstream Dong Nai River Basin, Vietnam
Abstract
1. Introduction
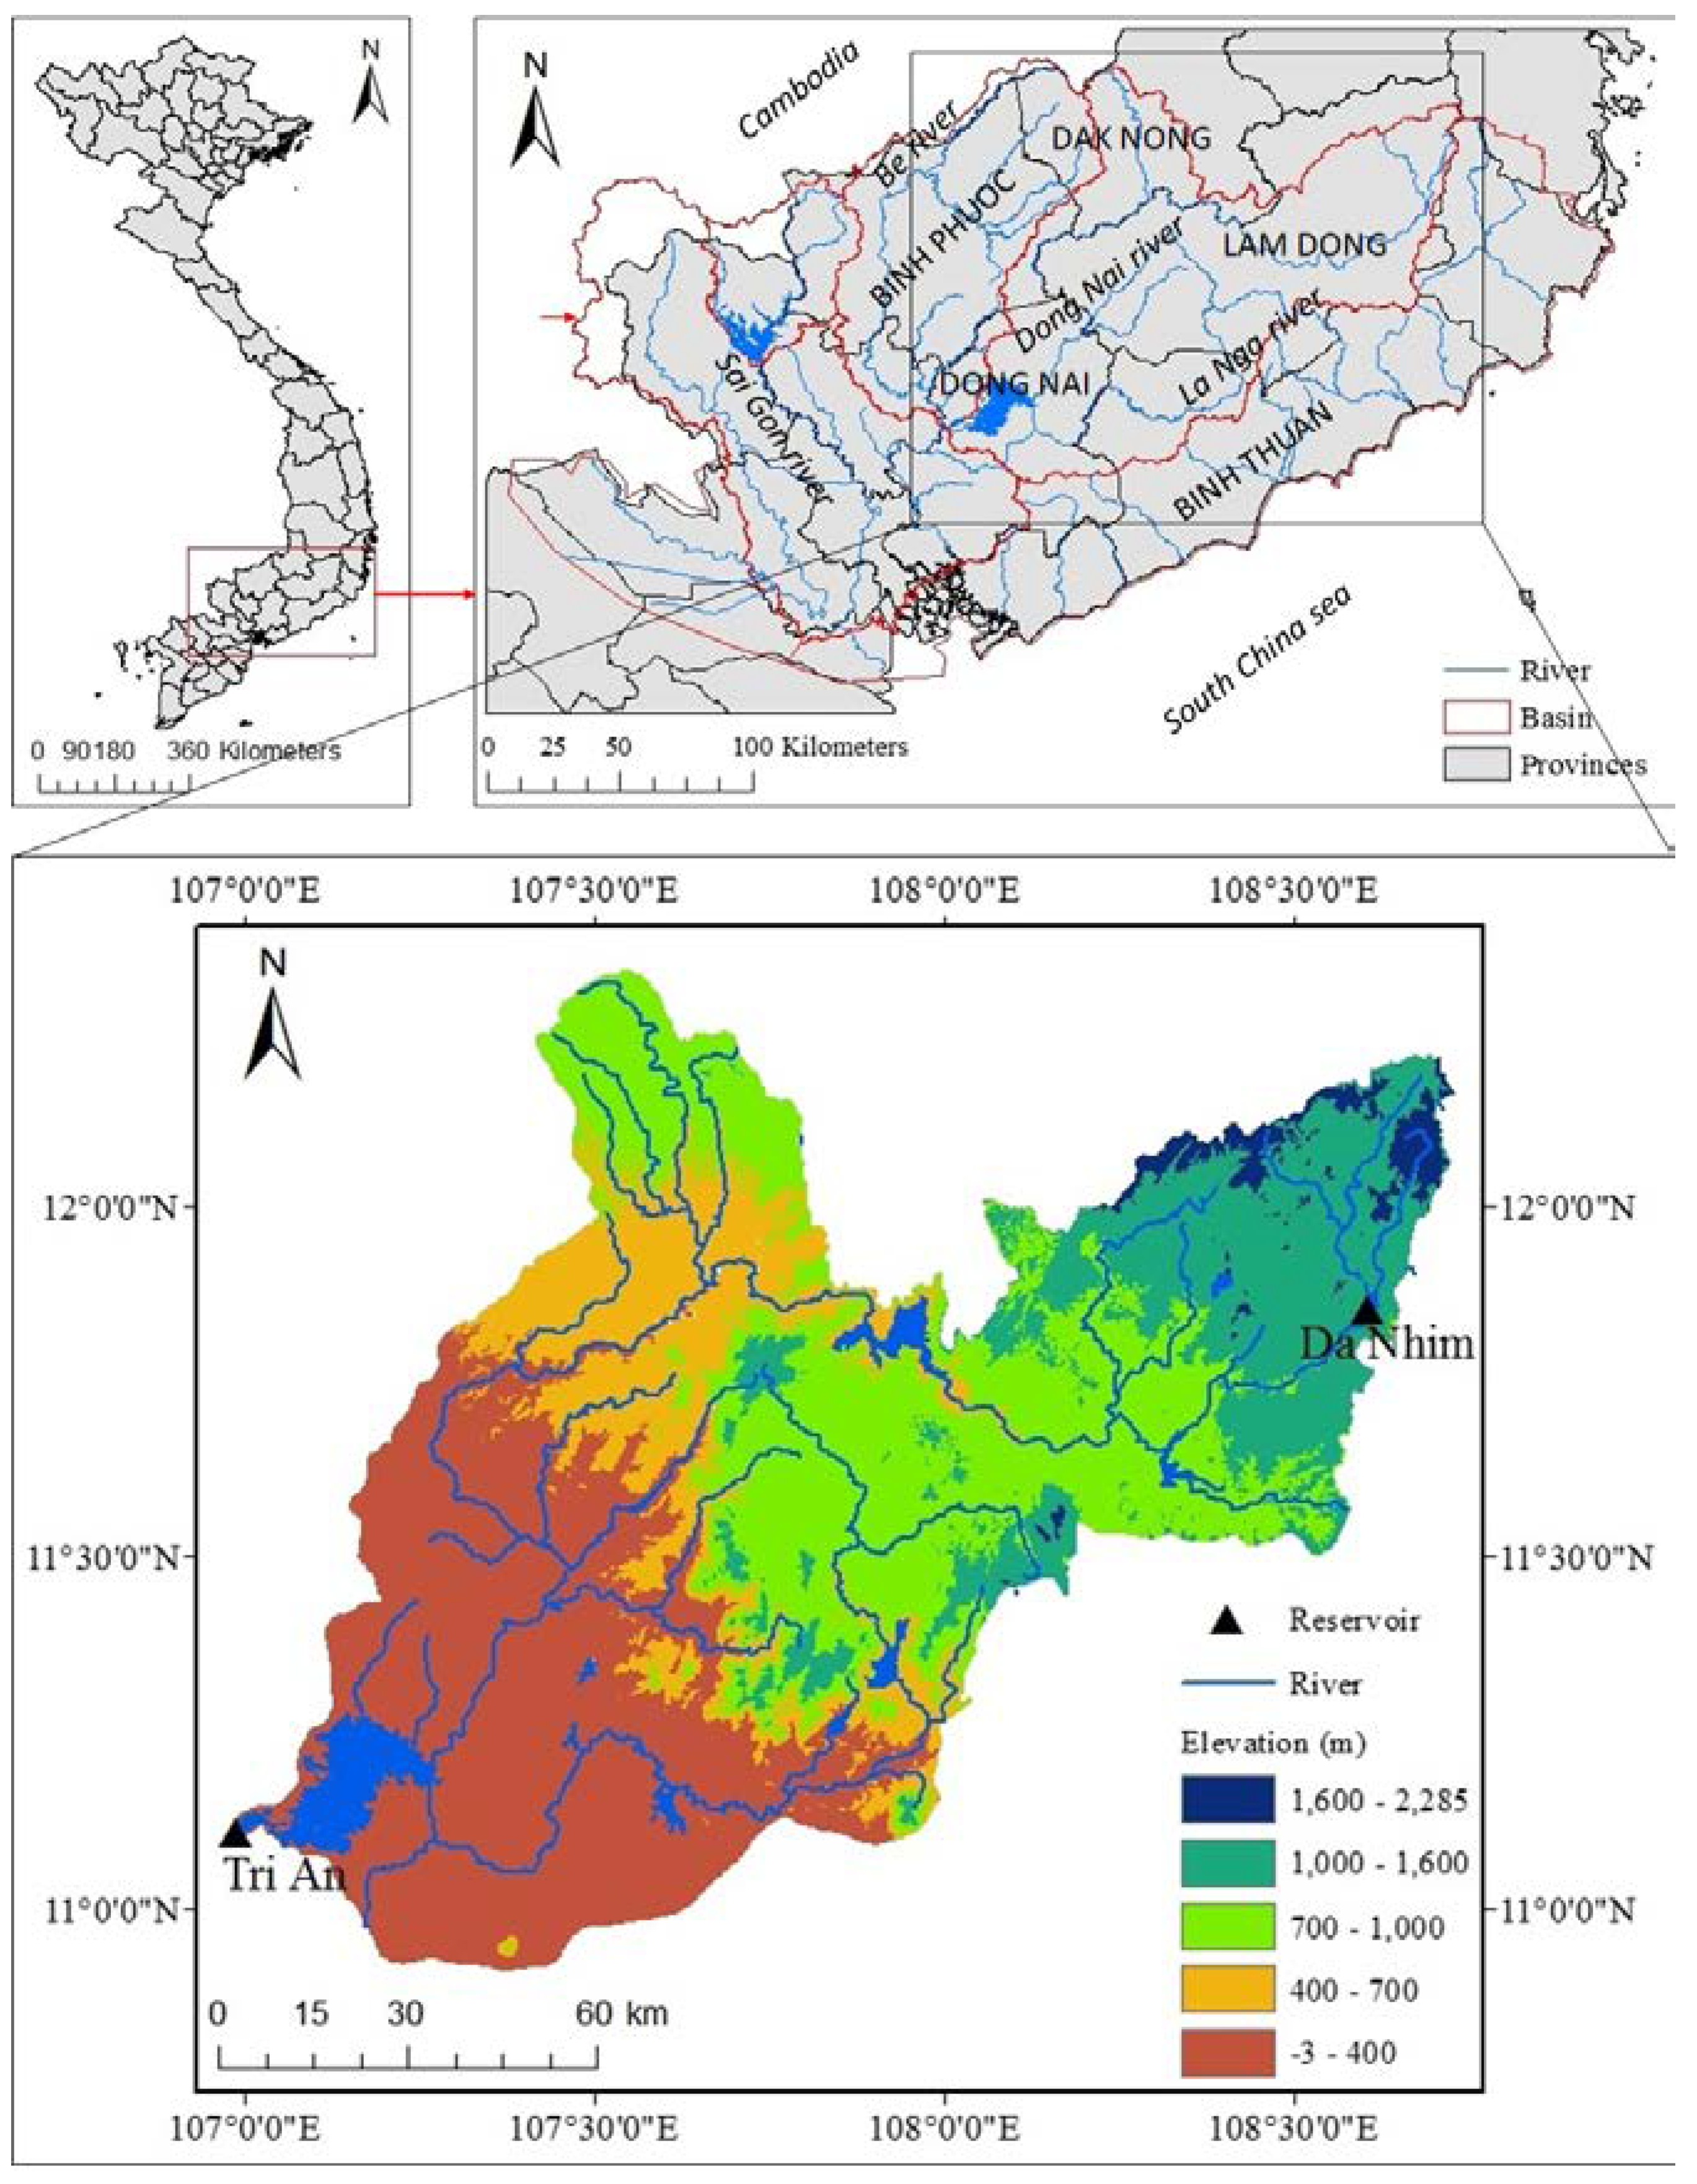
2. Study Area
3. Data and Methods
3.1. Data
3.2. Methods
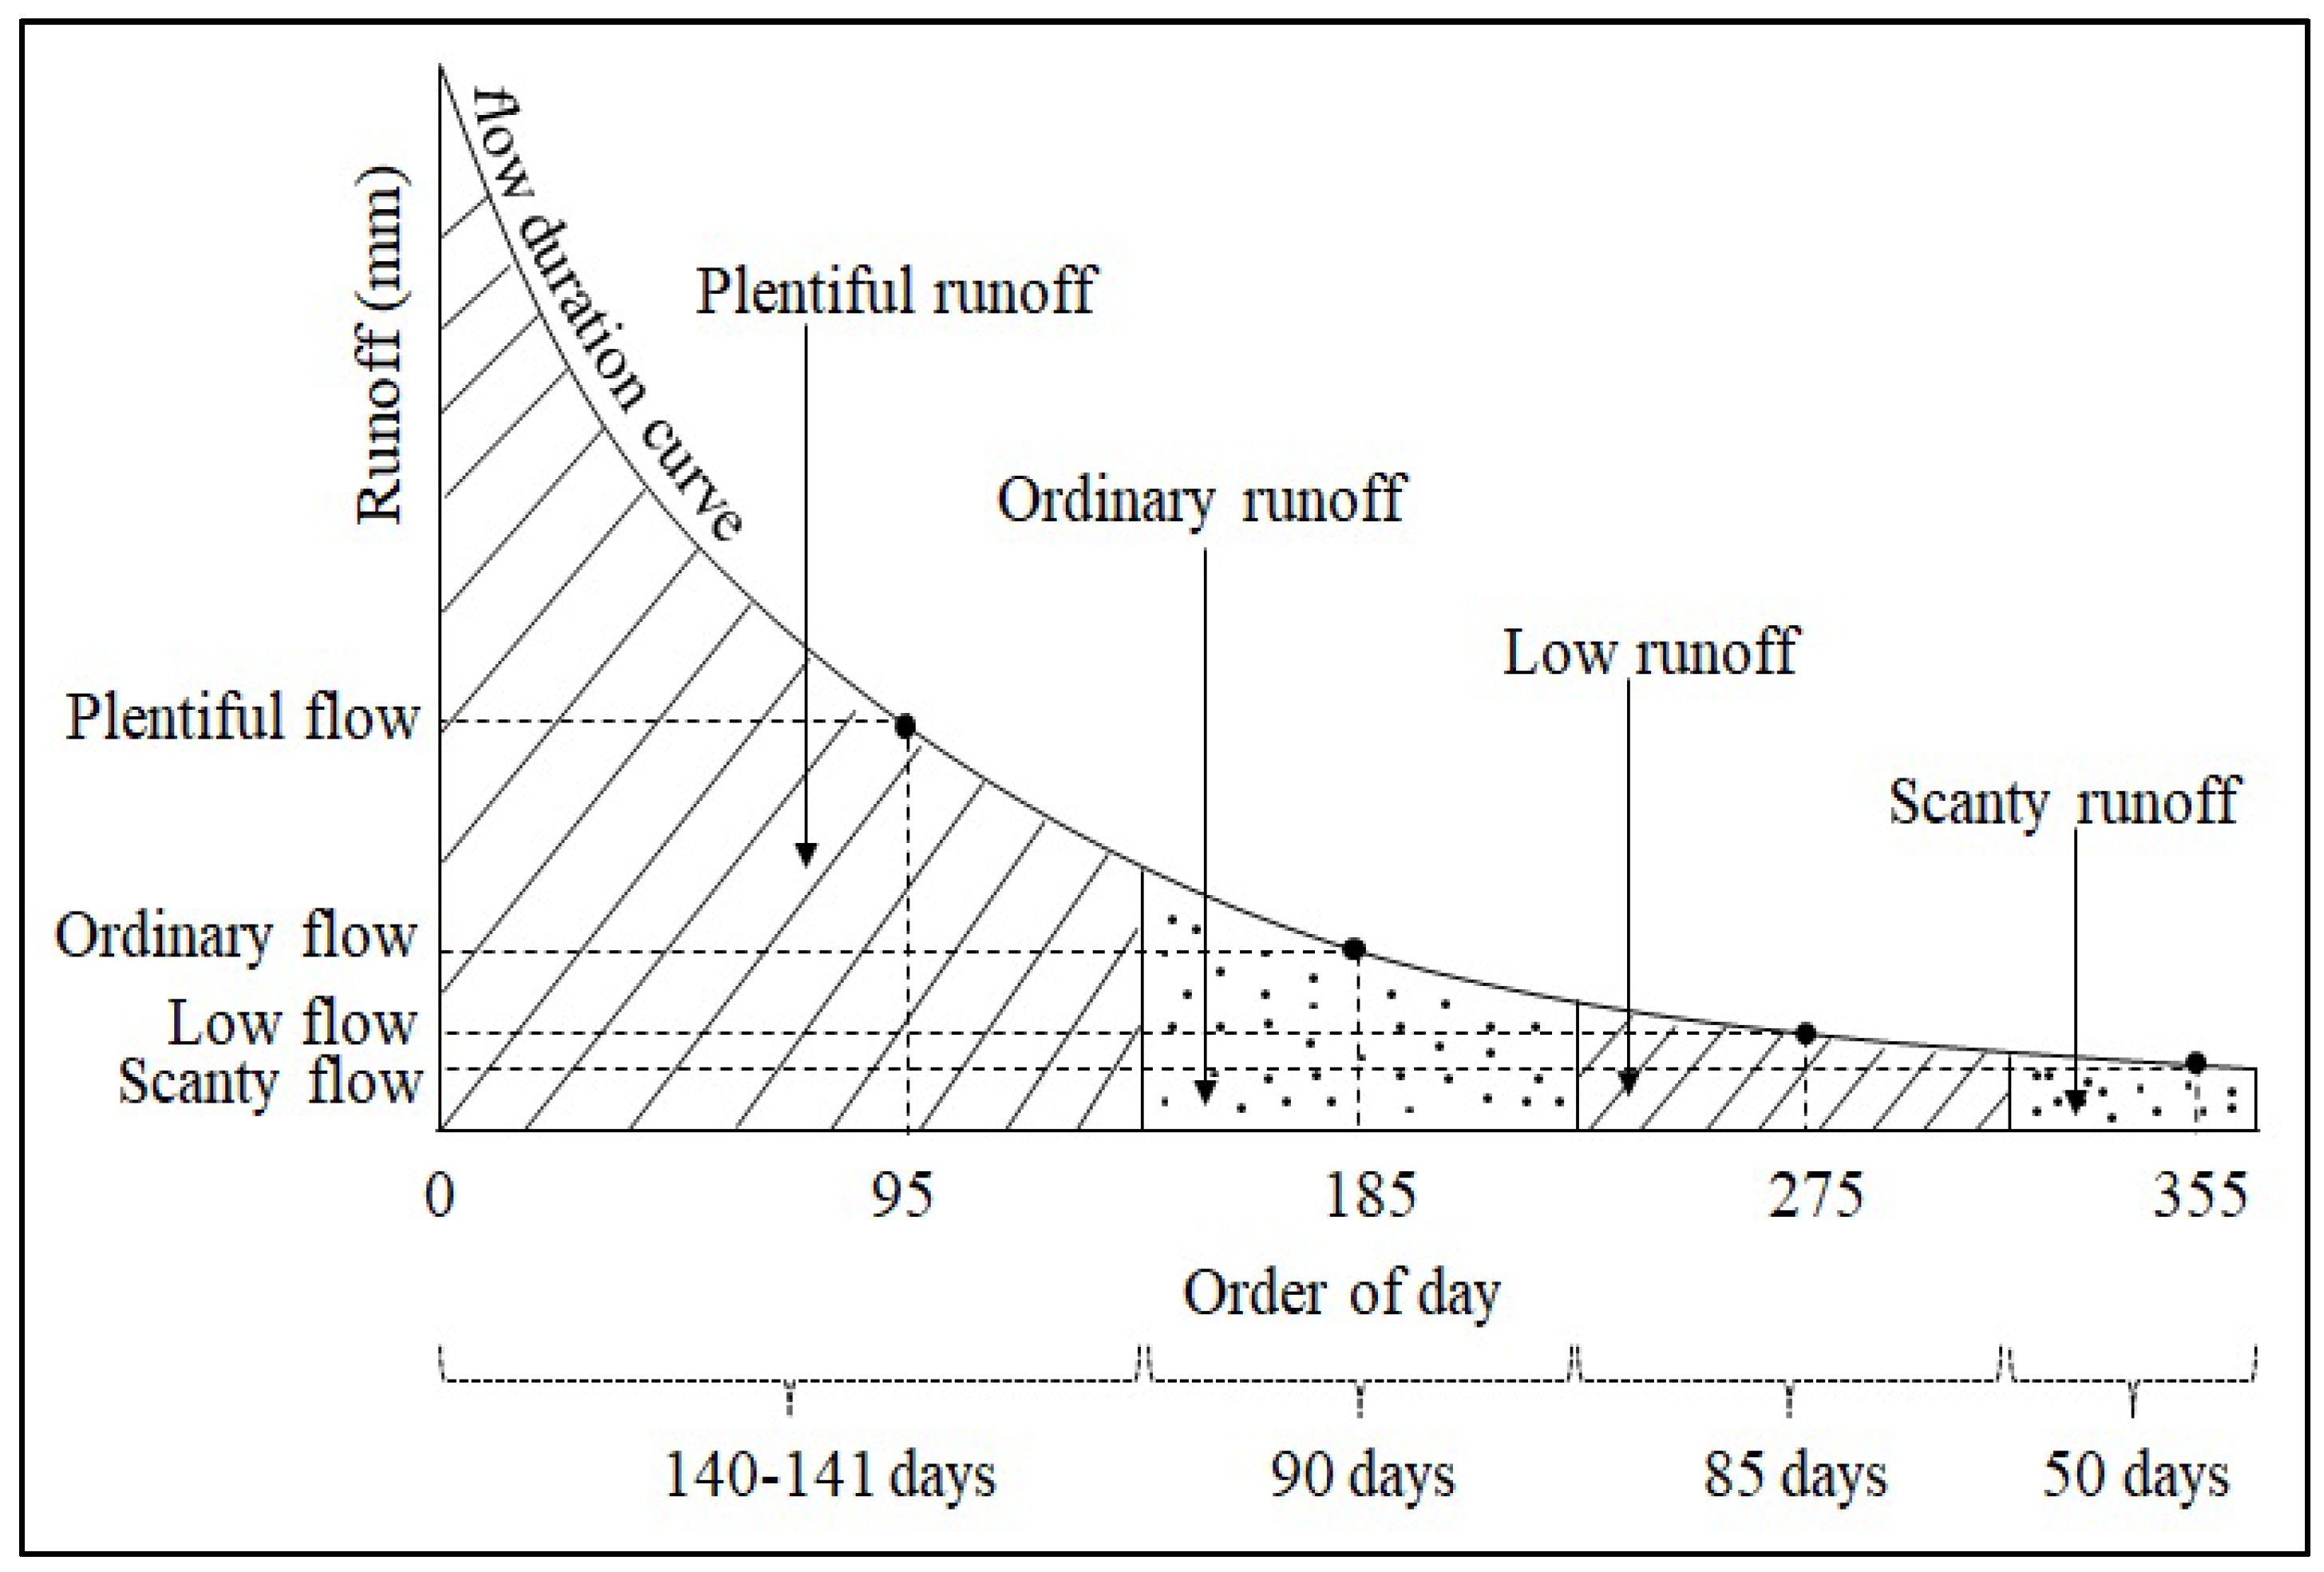
3.2.1. Flow–Duration Curve
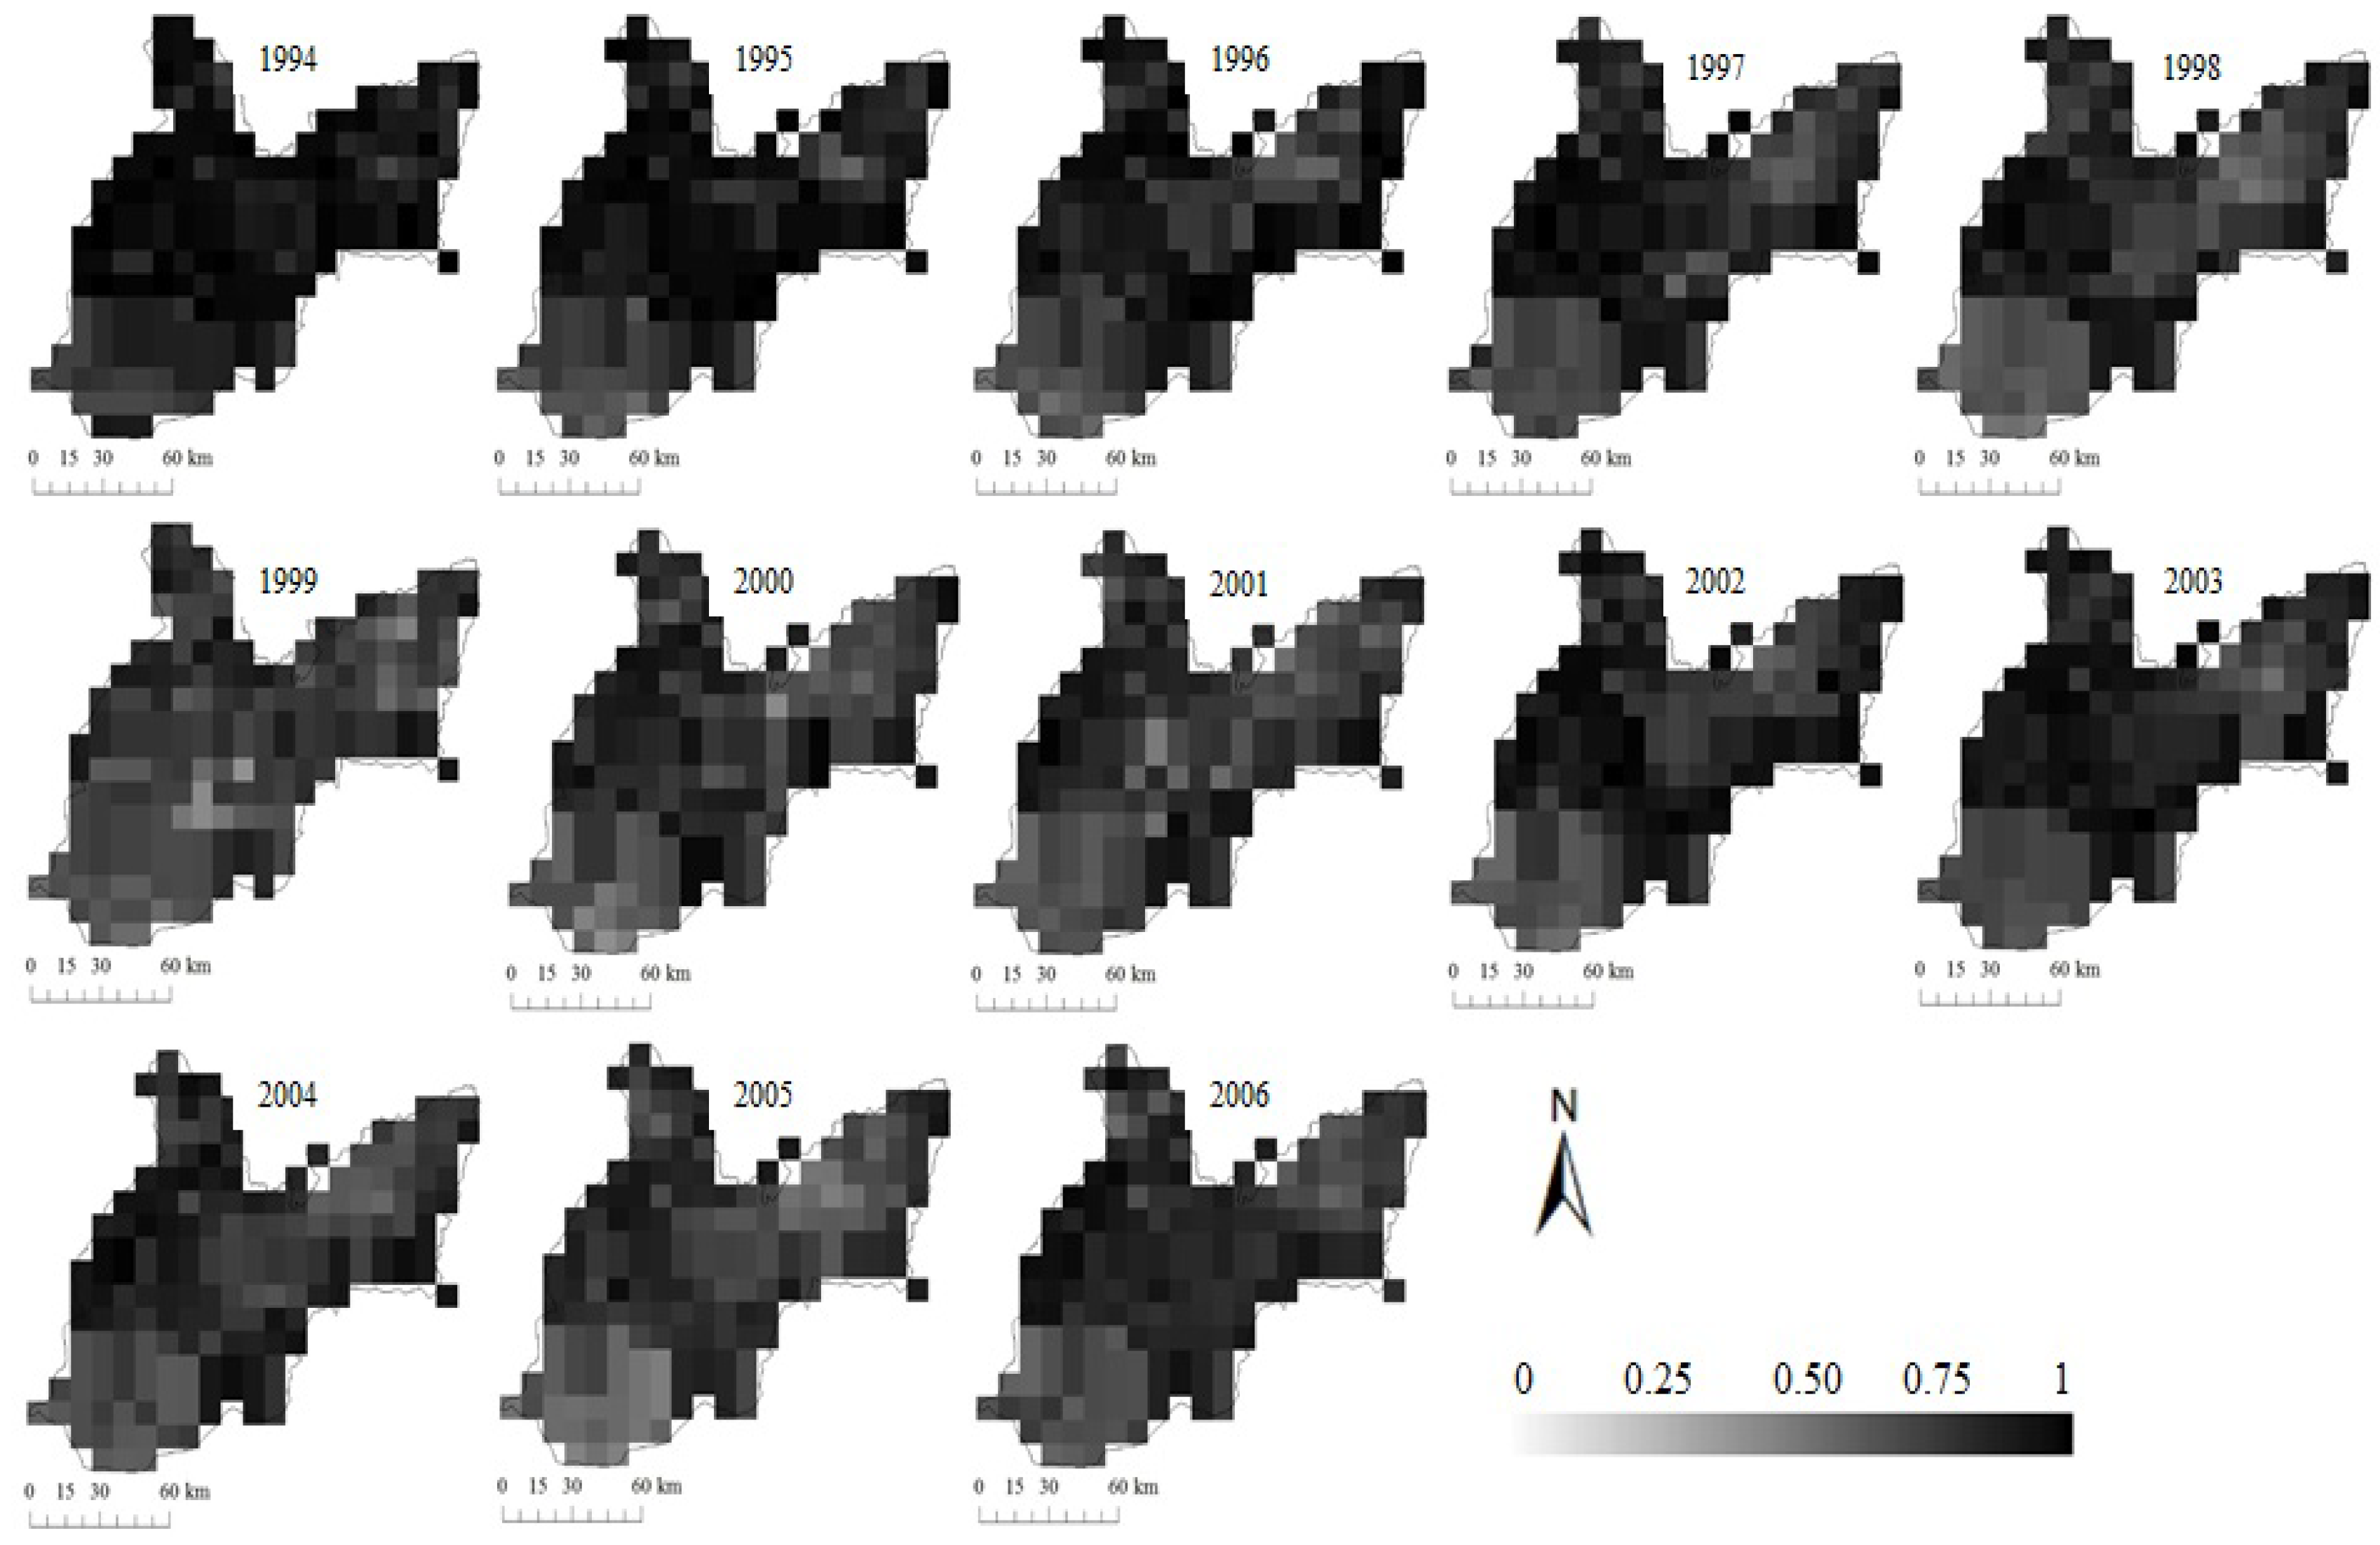
3.2.2. Land Cover Classification
4. Results and Discussion
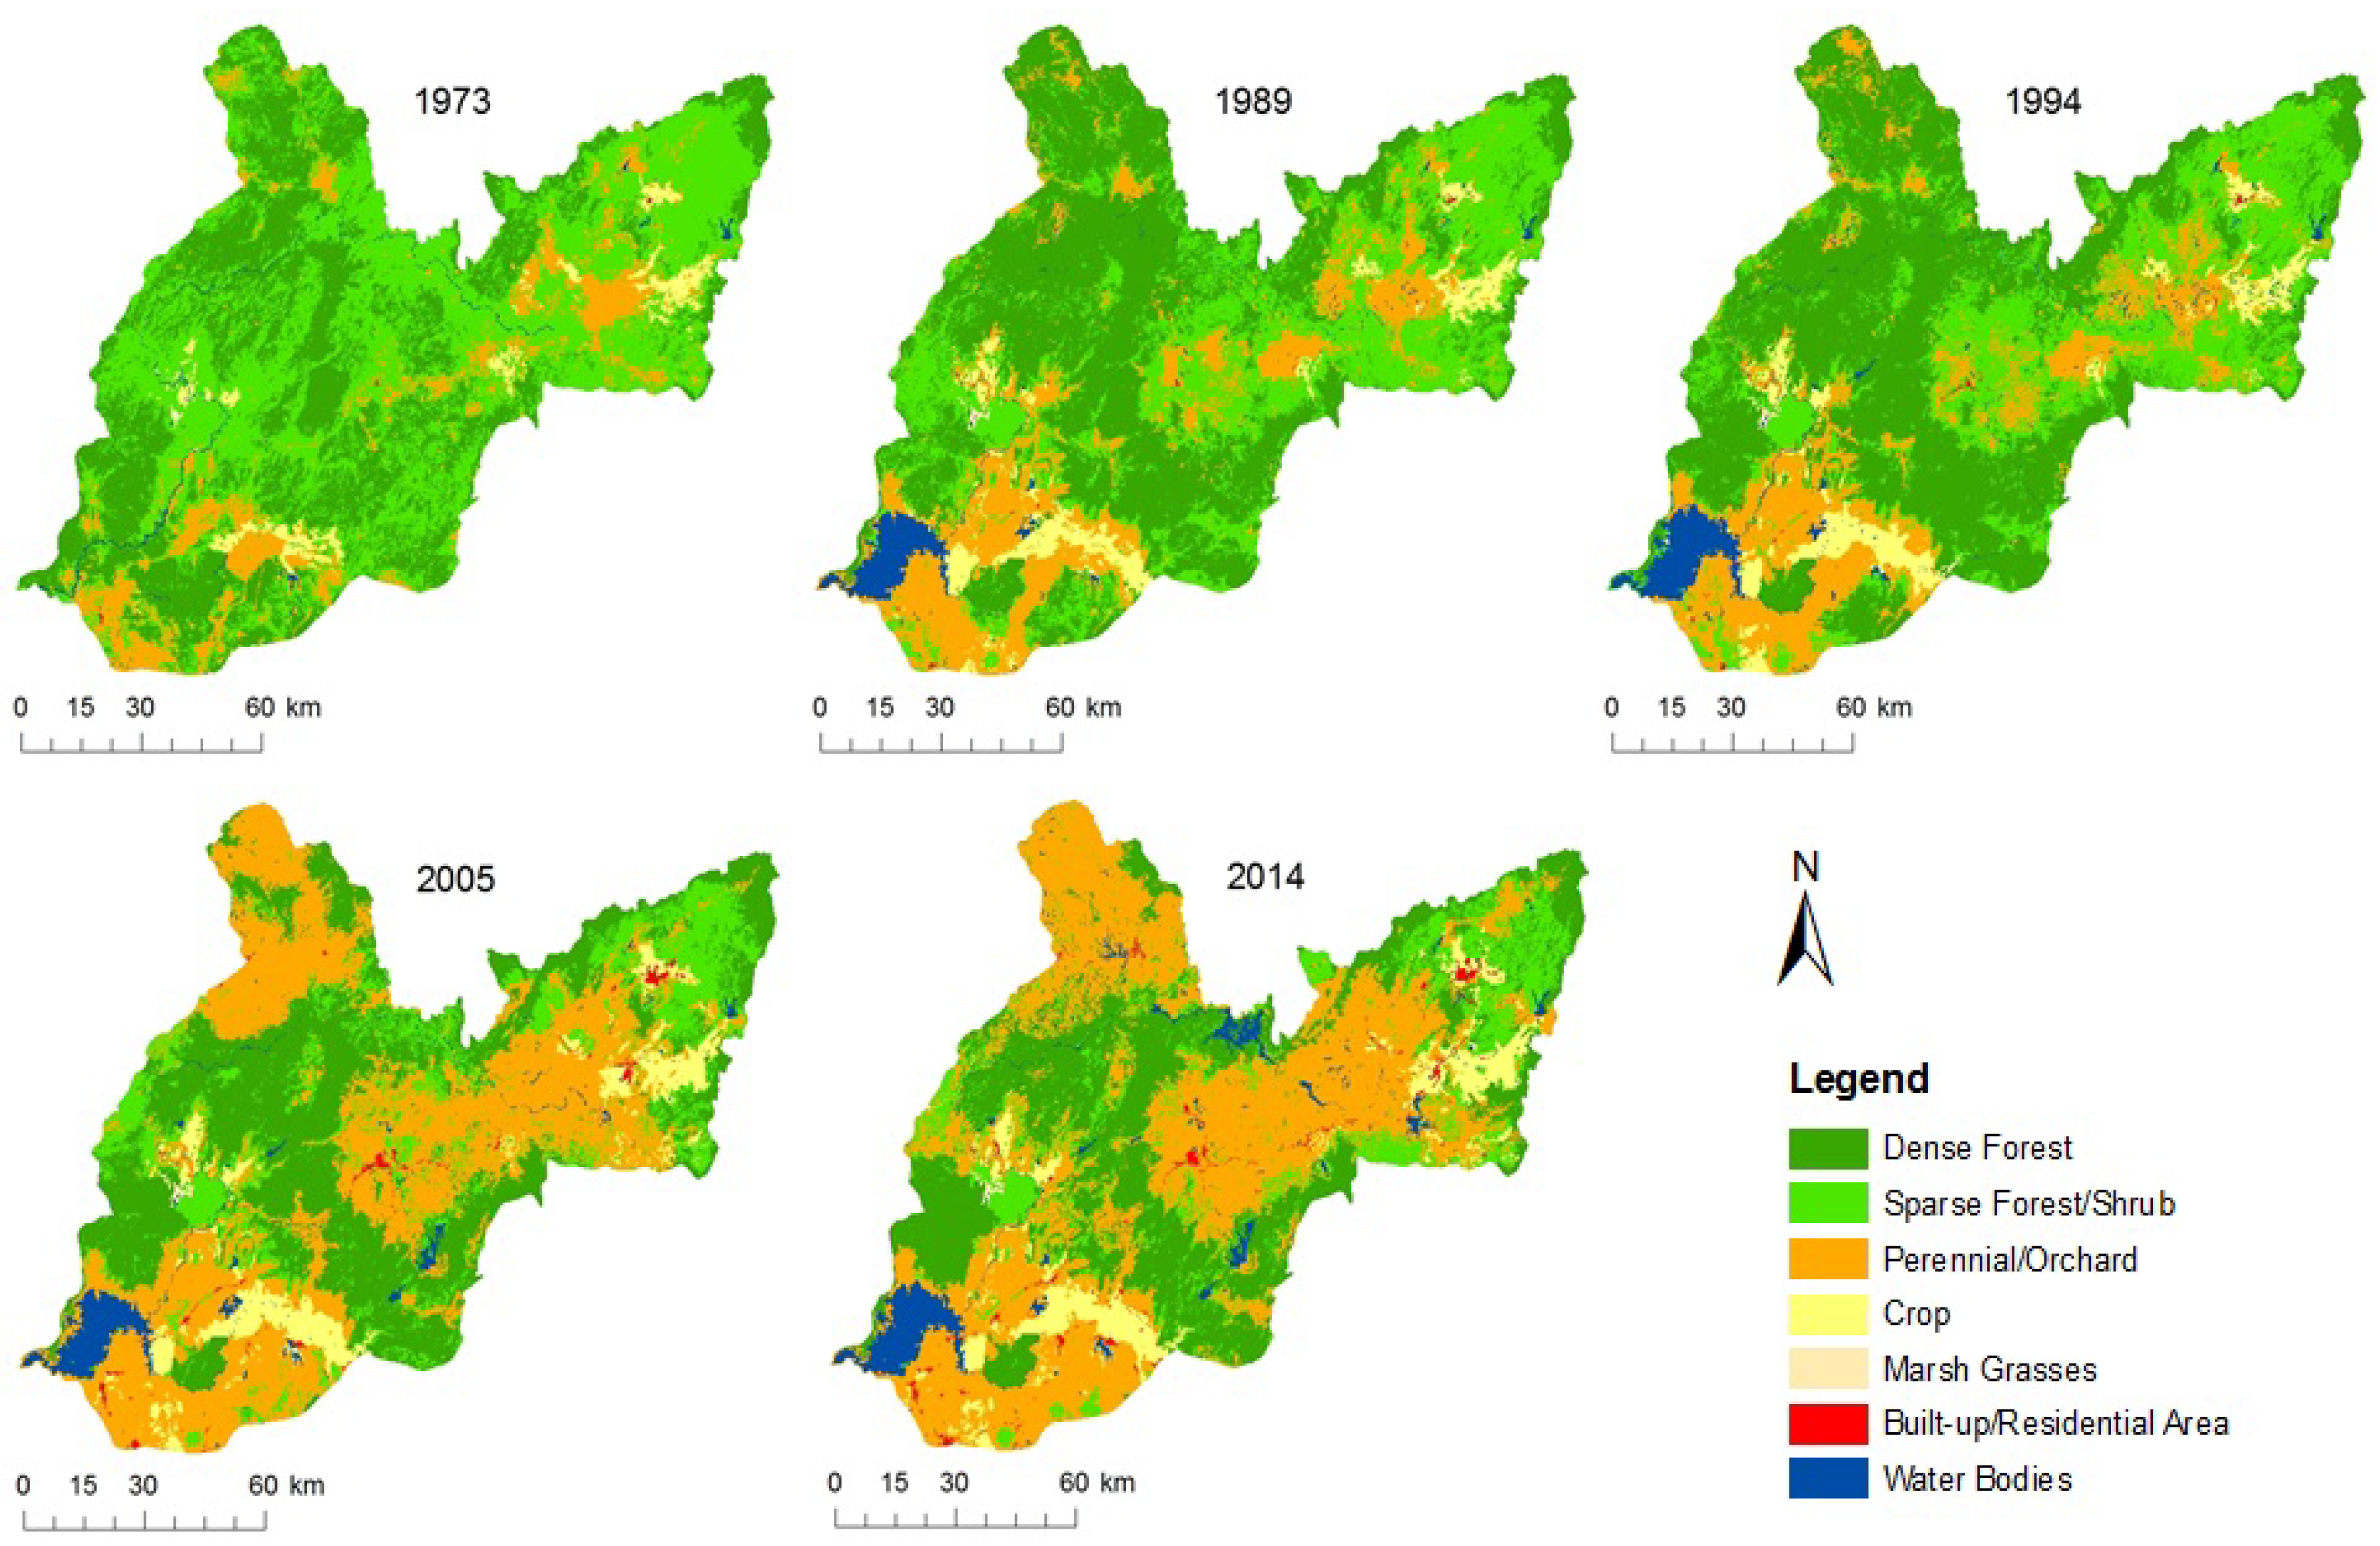
4.1. LULCC
4.2. LULCC Effect on the Flow Regime
5. Conclusions
Author Contributions
Funding
Acknowledgments
Conflicts of Interest
References
- Bewket, W.; Sterk, G. Dynamics in land cover and its effect on stream flow in the Chemoga watershed, Blue Nile basin, Ethiopia. Hydrol. Process. 2005, 19, 445–458. [Google Scholar] [CrossRef]
- Costa, M.H.; Aurélie, B.; Jeffrey, A.C. Effects of large-scale changes in land cover on the discharge of the Tocantins River, Southeastern Amazonia. J. Hydrol. 2003, 283, 206–217. [Google Scholar] [CrossRef]
- Kashaigili, J.J. Impacts of land-use and land-cover changes on flow regimes of the Usangu wetland and the Great Ruaha River, Tanzania. Phys. Chem. Earth 2008, 33, 640–647. [Google Scholar] [CrossRef]
- Kashaigili, J.J.; Majaliwa, A.M. Implications of land use and land cover changes on hydrological regimes of the Malagarasi river, Tanzania. J. Agric. Sci. Appl. 2013, 2, 45–50. [Google Scholar] [CrossRef]
- Khoi, D.N.; Suetsugi, T. Impact of climate and land-use changes on hydrological processes and sediment yield—A case study of the Be River catchment, Vietnam. Hydrol. Sci. J. 2014, 59, 1095–1108. [Google Scholar] [CrossRef]
- Li, Z.; Liu, W.; Zhang, X.; Zheng, F. Impacts of land use change and climate variability on hydrology in an agricultural catchment on the Loess Plateau of China. J. Hydrol. 2009, 377, 35–42. [Google Scholar] [CrossRef]
- Nie, W.; Yuan, Y.; Kepner, W.; Nash, M.S.; Jackson, M.; Erickson, C. Assessing impacts of Landuse and Landcover changes on hydrology for the upper San Pedro watershed. J. Hydrol. 2011, 407, 105–114. [Google Scholar] [CrossRef]
- Tan, M.L.; Ibrahim, A.L.; Yusop, Z.; Zheng, D.; Lloyd, L. Impacts of land-use and climate variability on hydrological components in the Johor River basin, Malaysia. Hydrol. Sci. J. 2015, 60, 873–889. [Google Scholar] [CrossRef]
- Bosch, J.M.; Hewlett, J.D. A review of catchment experiments to determine the effect of vegetation changes on water yield and evapotranspiration. J. Hydrol. 1982, 55, 3–23. [Google Scholar] [CrossRef]
- Chang, J.H. Hydrology in humid tropical Asia. In Hydrology and Water Management in the Humid Tropics; Bonell, M., Hufschmidt, M.M., Gladwell, J.S., Eds.; Cambridge University Press: Cambridge, UK, 1993; pp. 55–66. ISBN 0-521-02002-6. [Google Scholar]
- Lal, R. Challenges in agriculture and forest hydrology in the humid tropics. In Hydrology and Water Management in the Humid Tropics; Bonell, M., Hufschmidt, M.M., Gladwell, J.S., Eds.; Cambridge University Press: Cambridge, UK, 1993; pp. 395–404. ISBN 0-521-02002-6. [Google Scholar]
- Nakano, H. Effect on streamflow of forest cutting and change in regrowth on cut-over area. Bull. Gov. For. Exp. Stn. 1971, 240, 1–251, (In Japanese with English Abstract). [Google Scholar]
- Kuraji, K.; Green-Dam Function (Water Source Protection Function) of Forest and Its Enhancement. Japan Afforestation Flood Control Association. 2003. Available online: http://www.uf.a.u-tokyo.ac.jp/~kuraji/Midorinodam.pdf (accessed on 14 September 2016). (In Japanese).
- Gerold, G.; Leemhuis, C. Effects of “ENSO-events” and rainforest conversion on river discharge in Central Sulawesi (Indonesia). In Tropical Rainforests and Agroforests under Global Change; Tscharntke, T., Leuschner, C., Veldkamp, E., Faust, H., Guhardja, E., Bidin, A., Eds.; Springer: Berlin, German, 2010; pp. 327–350. ISBN 978-3-642-26259-3. [Google Scholar]
- Munoz-Villers, L.E.; McDonnell, J.J. Land use change effects on runoff generation in a humid tropical montane cloud forest region. Hydrol. Earth Syst. Sci. 2013, 17, 3543–3560. [Google Scholar] [CrossRef]
- Pham, T.T.H.; Moeliono, M.; Nguyen, T.H.; Nguyen, H.T.; Vu, T.H. The Context of REDD+ in Vietnam: Drivers, Agents and Institutions; CIFOR Occasional Paper No. 75; Center for International Forestry Research (CIFOR): Bogor, Indonesia, 2012. [Google Scholar]
- Vietnam Statistical Yearbook. General Statistics Office of Viet Nam. 2014. Available online: http://www.gso.gov.vn/default_en.aspx?tabid=515&idmid=&ItemID=15197 (accessed on 20 December 2015).
- Forest Science Institute of Vietnam (FSIV). Vietnam Forestry Outlook Study; Asia-Pacific Forestry Sector Outlook Study II, Working Paper No. APFSOS II/WP/2009/09; FAO-Regional Office for Asia and the Pacific: Bangkok, Thailand, 2009; Available online: http://www.fao.org/docrep/014/am254e/am254e00.pdf (accessed on 1 October 2015).
- Department of Forest Protection (DoFP). Data of Annual Change in Forest Area of Vietnam. Available online: http://kiemlam.org.vn/Desktop.aspx/List/So-lieu-dien-bien-rung-hang-nam (accessed on 1 October 2015).
- Ministry of Natural Resources and Environment, Vietnam (MONRE). The Climate Change and Sea Level Rise Scenarios for Vietnam; MONRE: Hanoi, Vietnam, 2009; Available online: http://www.imh.ac.vn/files/doc/KichbanBDKH/Kich%20ban%20Bien%20doi%20khi%20hau_2009.pdf (accessed on 1 October 2015). (In Vietnamese)
- Approval of Revisions to the National Power Development Plan from 2011 to 2020 with Visions Extended to 2030; Decision No. 428/QD-TTg; Vietnam Government: Hanoi, Vietnam, 2016. (In Vietnamese)
- Asian Development Bank (ADB). Water: Vital for Viet Nam’s Future; ADB: Hanoi, Vietnam, 2009. [Google Scholar]
- Japan International Cooperation Agency (JICA): Nippon Koei Co., Ltd. The Master Plan Study on Dong Nai River and Surrounding Basins Water Resources Development: Final Report; Appendix II: Topography and Geology, Appendix III: Meteorology and Hydrology; Japan International Cooperation Agency: Yokosuka, Japan, 1996; Volume 4, Available online: http://open_jicareport.jica.go.jp/617/617/617_123_11309523.html (accessed on 20 September 2017).
- Sustainable Hydropower Development on the Dong Nai River System. Available online: http://hpcdongnai.com/index.php/news/Tin-noi-bo/Phat-trien-Thuy-dien-ben-vung-tren-he-thong-song-Dong-Nai-322/ (accessed on 22 August 2018). (In Vietnamese).
- World Bank. Viet Nam—Water Resources Sector Review; World Development Sources, WDS; World Bank: Washington, DC, USA, 1996; Available online: http://documents.worldbank.org/curated/en/485611468780338713/Viet-Nam-Water-resources-sector-review (accessed on 1 October 2015).
- Ministry of Agriculture and Rural Development, Vietnam (MARD). Ecology of Natural Forests in Vietnam. In Handbook of Forestry; Phung, N.L., Phan, N.H., Trieu, V.H., Nguyen, N.T., Le, T.C., Eds.; MARD: Ha Noi, Vietnam, 2006. Available online: http://agro.gov.vn/images/2007/04/He%20sinh%20thai%20rung%20tu%20nhien%20Viet%20Nam.pdf (accessed on 20 September 2017). (In Vietnamese)
- Vu, T.P. Final Report on Forest Ecological Stratification in Vietnam; UN-REDD Program Vietnam: Hanoi, Vietnam, 2011. [Google Scholar]
- General Statistics Office of Viet Nam. Statistical Yearbook of Vietnam 2005, 2014, 2016. Available online: https://www.gso.gov.vn/Default.aspx?tabid=512 (accessed on 20 December 2015).
- Global Land Cover Facility, University of Maryland (GLCF). GIMMS Documentation. Available online: http://glcf.umd.edu/library/guide/GIMMSdocumentation_NDVIg_GLCF.pdf (accessed on 14 September 2016).
- Foster, H.A. Duration curves. Trans. Am. Soc. Civ. Eng. 1934, 99, 1213–1267. [Google Scholar]
- James, K.S. Flow-Duration Curves, Manual of Hydrology: Part 2, Low-Flow Techniques; Geological Survey Water-Supply Paper 1542-A; U.S. Government Printing Office: Washington, DC, USA, 1959.
- Kawamura, A.; Kuno, Y.; Jinno, K. Proposal of ascending and descending order logarithmic flow duration curve. Doboku Gakkai Ronbunshu 2004, 761, 91–94. [Google Scholar] [CrossRef]
- Tamai, K.; Miyama, T.; Goto, Y.; Kominami, Y. Influence of Forest Decline by Forest Fire and Pine Wilt Disease on Discharge and Discharge Duration Curve: In the Case of Tatsunokuchi-yama Experimental Forest. J. Jpn. For. Soc. 2004, 86, 375–379. (In Japanese) [Google Scholar]
- Tamai, K.; Shimizu, A.; Hosoda, I.; Miyabuchi, Y.; Shimizu, T.; Miyama, T.; Kominami, Y.; Asano, S. The effect of various forest disturbances on water discharge duration curve: The case comparison between the Sarukawa experi-menttal watershed in Miyazaki-shi and the Tatsunokuchi-yama experimental watershed in Okayama. Bull. For. For. Prod. Res. Inst. 2008, 7, 111–120. (In Japanese) [Google Scholar]
- Katsuyama, M.; Fukushima, K.; Tokuchi, N. Comparison of rainfall-runoff characteristics in forested catchments underlain by granitic and sedimentary rock with various forest age. Hydrol. Res. Lett. 2008, 2, 14–17. [Google Scholar] [CrossRef]
- Noguchi, S.; Nik, A.R.; Tani, M. Runoff characteristics in a tropical rain forest catchment. Jpn. Agric. Res. Q. 2005, 39, 215–219. [Google Scholar] [CrossRef]
- Fujimura, K.; Murakami, M.; Iseri, Y.; Kanae, S. Application of a hydrological model to evaluate the potential hydro energy in a mountainous small river basin of Japan. In Proceedings of the FRIEND-Water 2014, Montpellier, France, 7–10 October 2014. [Google Scholar]
- Sumi, T.; Kuwata, M.; Ishida, H.; Niwa, N.; Kojima, H.; Inoue, M.; Sato, Y.; Takemon, Y.; Kantoush, S. Evaluation of Hydropower Potential in Japan in Consideration of Climate Change; Annuals of Disaster Prevention Research Institute, No. 59 B; Kyoto University: Kyoto, Japan, 2016; (In Japanese with English Abstract). [Google Scholar]
- Nakano, H.; Kikuya, A.; Morisawa, M. Effects of changes in forest conditions especially cutting on runoff—Effects on water-yearly, plentiful, ordinary, low and scanty runoff. Bull. Gov. For. Exp. Stn. 1963, 156, 1–84, (In Japanese with English Abstract). [Google Scholar]
- Ministry of Land, Infrastructure, Transport and Tourism. River Glossary 39–45. Available online: https://www.kkr.mlit.go.jp/yamato/about/glossary/index_category.html (accessed on 22 August 2018). (In Japanese).
- Irish, R. Frame and Fill Program; NASA Goddard Space Flight Center: Greenbelt, MD, USA, 2009.
- Anderson, J.R.; Hardy, E.E.; Roach, J.T. Witmer, R.E. A land Use and Land Cover Classification System for Use with Remote Sensor Data; U.S. Geological Survey Professional Paper 964; U.S. Government Printing Office: Washington, DC, USA, 1976. [Google Scholar]
- Rientjes, T.H.M.; Hailel, A.T.; Kebede, E.; Mannaerts, C.M.M.; Habib, E.; Steenhuis, T.S. Changes in land cover, rainfall and stream flow in Upper Gilgel Abbay catchment, Blue Nile basin—Ethiopia. Hydrol. Earth Syst. Sci. 2011, 15, 1979–1989. [Google Scholar] [CrossRef]
- Congalton, R.G. A review of assessing the accuracy of classification of remotely sensed data. Remote Sens. Environ. 1991, 37, 35–46. [Google Scholar] [CrossRef]
- Foody, G.M. Harshness in image classification accuracy assessment. Int. J. Remote Sens. 2008, 29, 3137–3158. [Google Scholar] [CrossRef]
- General Statistics Office of Vietnam. The 1999 Vietnam Population and Housing Census: Completed Results. Available online: https://www.gso.gov.vn/default.aspx?tabid=407&idmid=4&ItemID=1346 (accessed on 20 December 2015). (In Vietnamese)
- DeFries, R.S.; Rudel, T.; Uriarte, M.; Hansen, M. Deforestation driven by urban population growth and agricultural trade in the twenty-first century. Nat. Geosci. 2010, 3, 178–181. [Google Scholar] [CrossRef]
- Maita, E. A Study on the Influence of Deforestation on Runoff at Fukuroyamasawa Experimental Watershed in Chiba Forest. Ph.D. Thesis, University of Tokyo, Tokyo, Japan, 2006. (In Japanese). Available online: https://repository.dl.itc.u-tokyo.ac.jp/?action=pages_view_main&active_action=repository_view_main_item_detail&item_id=4274&item_no=1&page_id=41&block_id=85 (accessed on 14 September 2016). (In Japanese).
- Maita, E.; Suzuki, M. The effect of forest cutting on flow duration curve of mountainous small watershed: Evaluation of the influence of vegetation on inter-watershed variation in flow duration curve. J. Jpn. For. Soc. 2008, 90, 36–45. [Google Scholar] [CrossRef]
- Kuraji, K.; Gomyo, M. Long-term variation of 10-year mean flow duration curve in a small watershed undergoing forest restoration and succession on denuded hills. Water Sci. 2013, 57, 117–127. (In Japanese) [Google Scholar] [CrossRef]
- Yao, H.; Hashino, M.; Xia, J.; Chen, X. Runoff reduction by forest growth in Hiji River basin, Japan. Hydrol. Sci. J. 2009, 54, 556–570. [Google Scholar] [CrossRef]
- Ministry of Agriculture Forestry and Fisheries (MAFF), Forestry Agency, Japan. Multiple Functional Roles of Forests and Forest Management Activities. In Annual Report on Forest and Forestry in 2013. Available online: http://www.rinya.maff.go.jp/j/kikaku/hakusyo/25hakusyo/pdf/5hon1-1.pdf (accessed on 20 September 2017). (In Japanese).
- Kuznetsov, A.N.; Kuznetsova, S.P. Tropical monsoon forests of Vietnam (Results of 20 Years of Phytoecological Research). Biol. Bull. 2013, 40, 187–196. [Google Scholar] [CrossRef]
- Whitmore, T.C. An Introduction to Tropical Rain Forests; Oxford University Press Inc.: New York, NY, USA, 1990; ISBN 0-19-854276-3. [Google Scholar]
- Ministry of Planning and Investment. Evaluate the Performance of Five Million Hectare Reforestation Programme, Vietnam (MPI-5MHRP). Available online: http://www.ncif.gov.vn/Page/Download.aspx?fileid=379 (accessed on 20 September 2017). (In Vietnamese).


| Provinces | Area (km2) | Agricultural Land (km2) | Forestry Land (km2) | Population Density (person/km2) |
|---|---|---|---|---|
| Binh Phuoc | 6877 | 4463 | 1729 | 139 |
| Binh Thuan | 7944 | 3618 | 3442 | 154 |
| Dak Nong | 6509 | 3600 | 2353 | 93 |
| Dong Nai | 5864 | 2784 | 1802 | 505 |
| Lam Dong | 9783 | 3677 | 5397 | 132 |
| Whole country | 331,231 | 115,302 | 149,236 | 280 |
| Class | Classification Description |
|---|---|
| Dense-Forest | Areas covered with continuous canopy |
| Sparse-Forest/Shrub | Including areas disturbed by or regenerating following recent harvest or fire, areas covered with shrubs, bushes and small trees |
| Perennial/Orchard | Areas covered with plants that live for more than two years such as rubber, cashew, pepper, fruit trees |
| Crop Land | Areas used for crop cultivation, and the scattered rural settlements |
| Built-Up/Residential | Residential, commercial services, industrial, transportation, communications, industrial and commercial, urban or built-up land |
| Marsh/Grasses | Area covered by grass for a considerable period of the year; area along streams in poorly drained areas and the shallow water along the boundaries of lakes, reservoirs, and rivers |
| Water Bodies | Permanent open water, lakes, reservoirs, and rivers |
| Accuracy | Dense Forest | Sparse Forest | Perennial/Orchard | Crop | Marsh Grasses | Built-Up/ Residential | Water Bodies |
|---|---|---|---|---|---|---|---|
| Pa | 97% | 85% | 93% | 61% | 64% | 79% | 89% |
| Ua | 91% | 87% | 92% | 76% | 82% | 83% | 80% |
| Land Cover Class | Area (km2) (Percentage) | |||||||||
|---|---|---|---|---|---|---|---|---|---|---|
| 1973 | 1989 | 1994 | 2005 | 2014 | ||||||
| Dense Forest | 5395 | 37% | 6224 | 42% | 6630 | 45% | 5052 | 34% | 4505 | 31% |
| Sparse Forest/Shrub | 7184 | 49% | 4808 | 33% | 4113 | 28% | 2536 | 17% | 2060 | 14% |
| Perennial/Orchard | 1622 | 11% | 2607 | 18% | 2724 | 19% | 5687 | 39% | 6458 | 44% |
| Crop | 404 | 3% | 683 | 5% | 734 | 5% | 906 | 6% | 963 | 7% |
| Marsh Grasses | 6 | 0% | 14 | 0% | 13 | 0% | 17 | 0% | 17 | 0% |
| Built-Up/Residential | 5 | 0% | 10 | 0% | 19 | 0% | 86 | 1% | 128 | 1% |
| Water Bodies | 90 | 1% | 360 | 2% | 473 | 3% | 422 | 3% | 575 | 4% |
| 2005 | Forest | Agriculture | Marsh Grasses | Built-Up/ Residential | Water Bodies | 1994 Total | |
|---|---|---|---|---|---|---|---|
| 1994 | |||||||
| Forest | 7329 | 3343 | 5 | 17 | 49 | 10,743 | |
| Agriculture | 240 | 3147 | 0 | 52 | 20 | 3459 | |
| Marsh Grasses | 2 | 0 | 11 | 0 | 0 | 13 | |
| Built-up/Residential | 0 | 2 | 0 | 17 | 0 | 19 | |
| Water Bodies | 18 | 101 | 0 | 1 | 353 | 473 | |
| 2005 total | 7588 | 6593 | 17 | 86 | 422 | 14,706 | |
| Provinces | 1999 | 2005 | 2014 |
|---|---|---|---|
| Binh Phuoc | 653,926 | 795,900 | 932,500 |
| Binh Thuan | 1,046,320 | 1,150,600 | 1,207,400 |
| Dak Nong | - | 397,500 | 571,300 |
| Dong Nai | 1,990,678 | 2,193,400 | 2,838,600 |
| Lam Dong | 998,027 | 1,161,000 | 1,259,300 |
| Whole country | 76,323,173 | 83,119,900 | 90,728,900 |
| Provinces | 2000 | 2001 | 2002 | 2003 | 2004 | 2005 |
|---|---|---|---|---|---|---|
| Binh Phuoc | 5.785 | 4.138 | 8.760 | 4.370 | 9.460 | 14.480 |
| Binh Thuan | 4.257 | - | 2.070 | 5.430 | 1.660 | 0.840 |
| Dak Nong | - | - | - | - | 2.580 | 2.250 |
| Dong Nai | 0.332 | 0.620 | 1.250 | 0.279 | 0.215 | 1.475 |
| Lam Dong | 2.380 | 2.050 | 10.998 | 3.140 | 1.630 | 2.863 |
| Total | 12.754 | 6.808 | 23.078 | 13.219 | 15.545 | 21.908 |
| Max. Flow | Plentiful Flow | Ordinary Flow | Low Flow | Scanty Flow | Min. Flow | ||
|---|---|---|---|---|---|---|---|
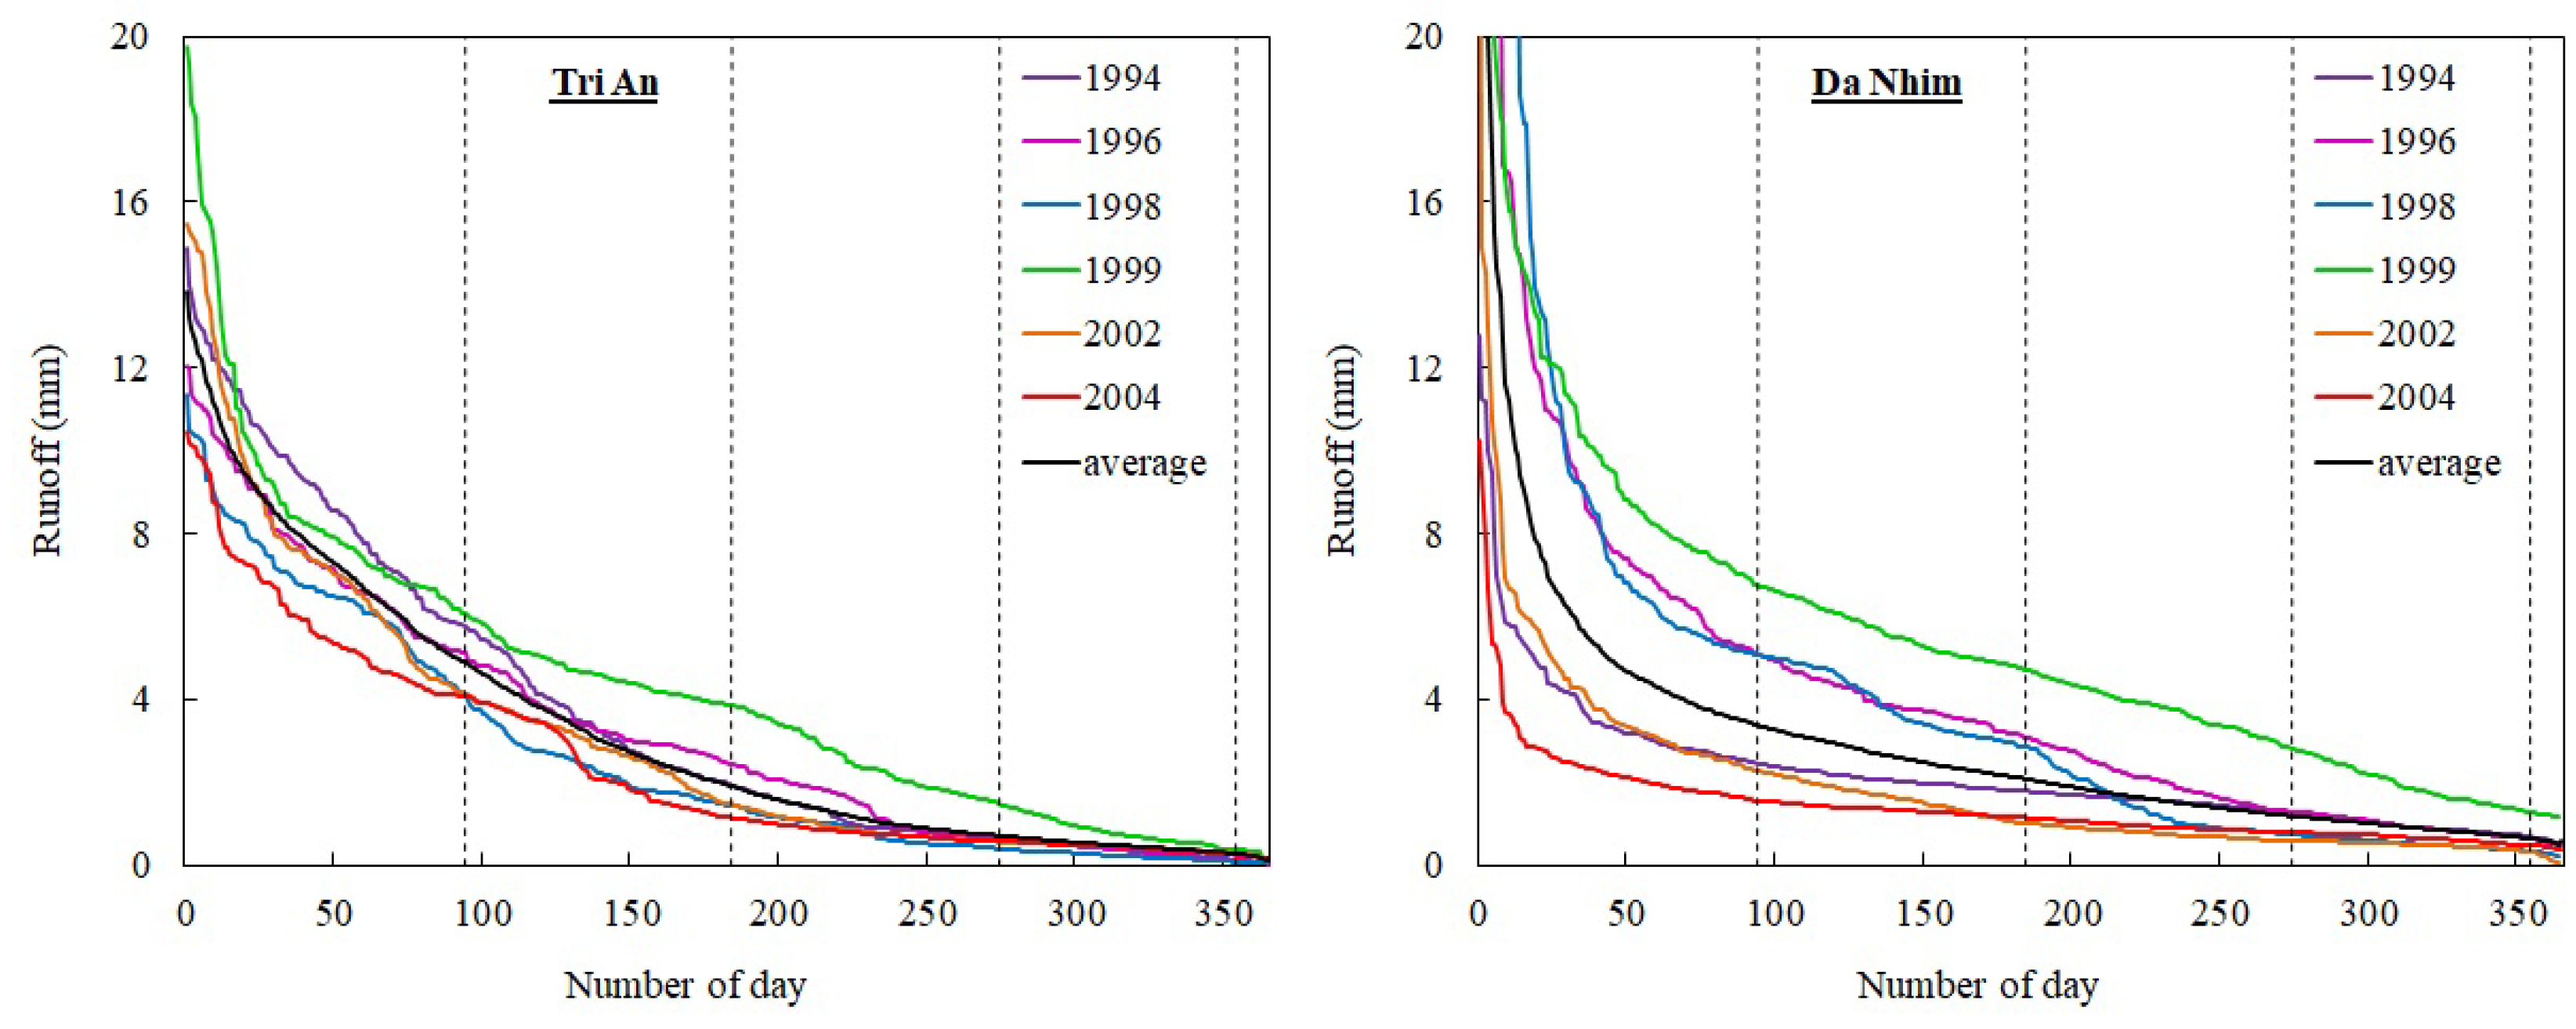
| Before | Tri An | 14.91 | 5.72 | 1.91 | 0.61 | 0.27 | 0.18 |
| Da Nhim | 12.80 | 2.42 | 1.78 | 1.26 | 0.67 | 0.42 | |
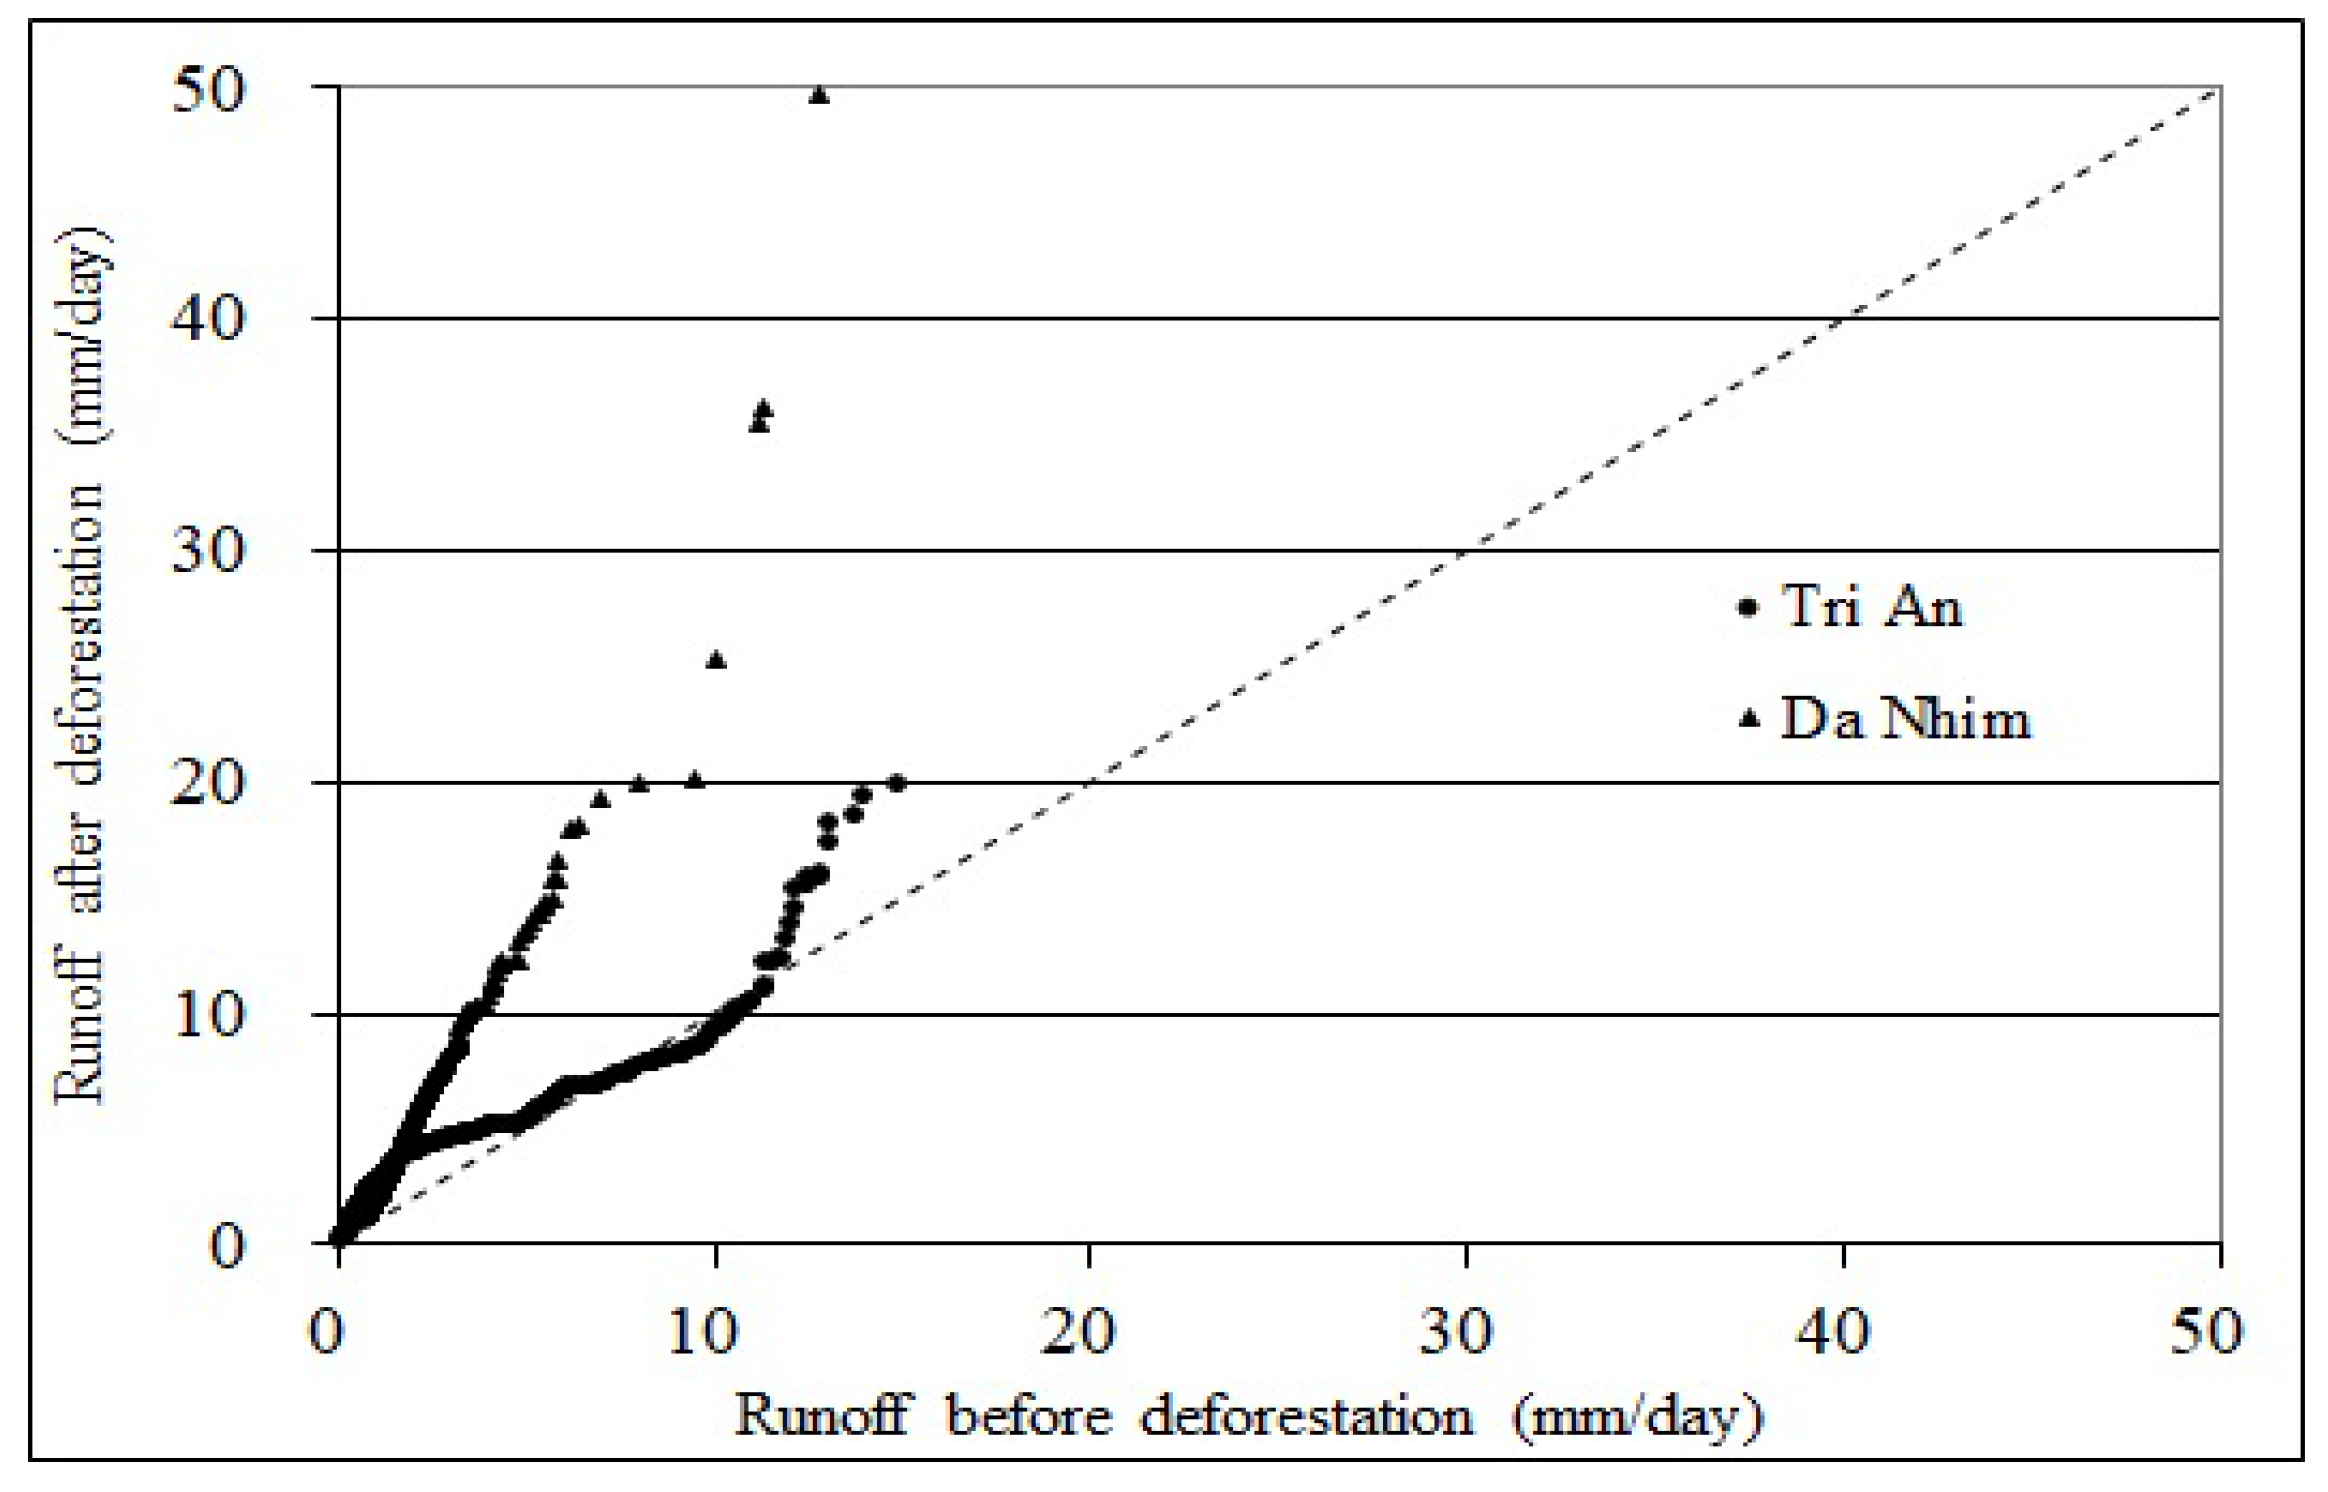
| After | Tri An | 19.73 | 6.04 | 3.84 | 1.45 | 0.37 | 0.11 |
| Da Nhim | 49.66 | 6.73 | 4.68 | 2.79 | 1.27 | 1.16 | |
| Changes | Tri An | 4.82 | 0.32 | 1.93 | 0.84 | 0.11 | −0.07 |
| Da Nhim | 36.86 | 4.31 | 2.91 | 1.53 | 0.60 | 0.74 | |
| Rate of Changes | Tri An | 0.32 | 0.06 | 1.01 | 1.37 | 0.40 | −0.40 |
| Da Nhim | 2.88 | 1.78 | 1.64 | 1.21 | 0.90 | 1.77 | |
© 2018 by the authors. Licensee MDPI, Basel, Switzerland. This article is an open access article distributed under the terms and conditions of the Creative Commons Attribution (CC BY) license (http://creativecommons.org/licenses/by/4.0/).
Share and Cite
Truong, N.C.Q.; Nguyen, H.Q.; Kondoh, A. Land Use and Land Cover Changes and Their Effect on the Flow Regime in the Upstream Dong Nai River Basin, Vietnam. Water 2018, 10, 1206. https://doi.org/10.3390/w10091206
Truong NCQ, Nguyen HQ, Kondoh A. Land Use and Land Cover Changes and Their Effect on the Flow Regime in the Upstream Dong Nai River Basin, Vietnam. Water. 2018; 10(9):1206. https://doi.org/10.3390/w10091206
Chicago/Turabian StyleTruong, Nguyen Cung Que, Hong Quan Nguyen, and Akihiko Kondoh. 2018. "Land Use and Land Cover Changes and Their Effect on the Flow Regime in the Upstream Dong Nai River Basin, Vietnam" Water 10, no. 9: 1206. https://doi.org/10.3390/w10091206
APA StyleTruong, N. C. Q., Nguyen, H. Q., & Kondoh, A. (2018). Land Use and Land Cover Changes and Their Effect on the Flow Regime in the Upstream Dong Nai River Basin, Vietnam. Water, 10(9), 1206. https://doi.org/10.3390/w10091206


