Article

Application of Bayesian Approach to Dynamic Assessment of Flood in Urban Underground Spaces

Department of Safety Technology and Management, China University of Mining & Technology, Beijing 100083, China
*
Author to whom correspondence should be addressed.
Water 2018, 10(9), 1112; https://doi.org/10.3390/w10091112
Submission received: 19 July 2018 / Revised: 18 August 2018 / Accepted: 20 August 2018 / Published: 21 August 2018
(This article belongs to the Section Urban Water Management)

Abstract

:
Urban underground facilities tend to be vulnerable to flood that is generated by the breaking of a dam or a levee, or a flash flood after an exceptional rainfall. Rapid and dynamic assessment of underground flood evolution process is of great significance for safety evacuation and disaster reduction. Taking advantage of the Delphi method to determine the Bayesian conditional probabilities collected by expert knowledge, this paper proposes an integrated Bayesian Network (BN) framework for rapidly and dynamically assessing the flood evolution process and consequences in underground spaces. The proposed BN framework, including seventeen nodes, can represent the flood disaster drivers, flood disaster bearers, flood mitigation actions, and on-site feedback information. Given evidences to specific nodes, the risk distribution of typical flood scenarios can be quantitatively estimated. The results indicate that the proposed framework can be useful for dynamically evaluating underground flood evolution process and identifying the critical influencing factors. This BN-based framework is helpful for “Scenario-Response”-based predictive analyses to support decision that is related to flood disaster emergency response.

1. Introduction

With respect to loss of lives and property that is caused by floods, it is vital to take into consideration proper planning of applications that are related to management of extreme precipitation events [1,2,3,4,5,6,7,8,9,10,11]. In the past decades, due to the rapid urbanization, city layouts around the world have been expanding not only horizontally, but also vertically upward and downward with a variety of underground facilities, such as underground subway lines, underground parking lots, and underground malls, etc. These underground spaces really facilitate the urban life. However, due to the low-lying weakness, underground facilities are prone to flood that is generated by the breaking of a dam or a levee, or a flash flood after an exceptional rainfall. Urban underground flooding could cause severe loss of life and very serious damage to properties in the underground spaces. Some of the inundation events have been really dramatic: the catastrophic inundation of subway stations in Seoul following a heavy rainfall, in 1998, South Korea; the catastrophic flooding of Taipei metro system following the typhoon Nari, in 2001; the serious inundation of Yinzuo underground mall in Jinan City following an exceptional rainfall and dike break, in 2007, China; the flooding in New York and its subway system that was caused by the hurricane Sandy, in 2012, USA; and, at present, the flooding of subway stations in Guangzhou, in May 2016, China and the serious inundation of subway stations and underground parking lots in Wuhan City in July 2016, China. As a result, more and more scientists and engineers around the world have been working on studying urban waterlogging and flooding [12,13,14,15,16], particularly underground flood problems [17].
Underground subway stations, parking lots or underground malls are half-confined spaces where persons can only evacuate to ground area through staircases when flood intrudes. Studies on urban underground flooding problems have been mainly focusing on investigating the propagation law of underground flooding and the dynamic characteristics of staircase flooding flow and their effects on safety evacuation. In the beginning, the research work on underground flooding mainly employs experimental techniques, and the Japanese researchers achieved a lot in analyzing the effects of dynamic characteristics of staircase flow on evacuation, and found the critical criteria for safety evacuation [18,19,20,21]. In addition, experimental examination of the inundation process in a three-dimensional underground space that composed of an underground mall, a subway station and a parking lot, and the underground space is constructed based on the prototype of central area of Kyoto city [22]. Recently, by taking advantages of the rapid development of computer technology and computing techniques, the approach of numerical modeling of flooding in the underground facilities has been becoming a research focus, and there are generally two ways from the point view of Computational Fluid Dynamic (CFD) techniques: grid-based methods [23,24,25,26,27] and meshfree methods [28,29]. Current experimental and numerical achievements on underground flood propagation and staircase flow characteristics are important for inundation assessment, which is helpful for making “Disaster Preparedness” strategies, e.g., flood prevention measures and the safety design of underground facilities (particularly staircases). However, for the decision-making on the disaster reduction at the time of flood control and mitigation rescue, the present CFD flood simulation models are not effective since they are computationally expensive and cannot combine a variety of flood evolvement information and mitigation measures, such as the type/origin and dynamic intensity of the flood sources, flood impacts to underground ventilation systems or drainage system, available flood control measures, etc. [30]. As a result, for performing “Scenario Response”-based disaster response on flood reduction, the present work aims to build a rapid and dynamic risk analysis framework of underground flood based on the Bayesian network (BN).
BN is a good cause-effect analysis tool for representing uncertain knowledge in probabilistic systems. BN has proven to be effective for capturing and integrating qualitative and quantitative information from various sources, which facilitates the quantitative analysis in two ways: predictive analysis and diagnostic analysis [31]. In the past decades, BN has been widely applied to the risk assessment of a lot of engineering problems, such as natural gas pipeline accidents, dust explosions, tunnel-induced building damages, mine water inrush, dam break/costal flood, tsunami, and so on [31,32,33,34,35,36,37]. With regards to the application of BN to assess flood hazard, it seldom involves comprehensive probabilistic analysis of flood causes, evolution process, and consequences, and additionally the cascading secondary impacts to the prevention measures.
In this study, an integrated framework for underground flood assessments that are based on Bayesian network and the Delphi method is established while taking into account flood source information, flood evolution impacts, mitigation measures, and feedback information during the flood evolution process. Through the proposed framework, the flood hazard evolution process and the effects of emergency rescue on flood loss prevention can be explicitly and rapidly evaluated. This is essentially helpful to the risk assessment of underground flooding and to establish a “Scenario-Response”-based disaster response strategy that can provide effective supports for critical decision-making of emergency response commanders for urban underground flood.

2. Method

2.1. Bayesian Network

BN is a combination of Directed Acyclic Graph (DAG) and Probability Theory. A BN consists of several nodes and directed edges that reflect the information of target problem and illustrate cause-effect relationships of different nodes, respectively. BN was firstly presented by Pearl in 1985 and then has proven to be an effective tool to facilitate the modeling of continuous or multi-state variables and perform the quantitative analysis taking advantage of the good representation of the conditional dependencies between the nodes [31].
A simple representation of BN is shown in Figure 1. There are two kinds of BN nodes. The nodes with arcs and arrows towards to them are called “child” node, while the nodes with edges departing to “child” nodes are called the “parent” nodes. The arcs that link Bayesian nodes represent cause-effect relationships between the nodes. In Figure 1, X1 is the “parent” nodes of X2 and X3, and meanwhile X2 and X3 are the “parent” nodes of X4.
BN can represent the joint distribution over all the variables in the DAG. The joint probability distribution of the node variable can be obtained based on their conditional independences, as follows:
P ( X 1 ,   X 2 , , X n ) = 1 n P ( X i / Parent ( X i ) )   ( i = 1 , 2 , , n )
where X = {X1, X2, …, Xn} represent a set of variables that form the nodes of BN. The marginal and the conditional probabilities can be computed for each node of the network based on the joint probability. BN is a probabilistic inference technology for reasoning under uncertainty by taking advantage of the Conditional Probabilities Tables (CPTs) of BN nodes. The CPTs are generally obtained from data training or collected by experts’ knowledge. Taking X4 as an example, if there are two states of each node in Figure 1, the CPT of X4 can be given as Table 1 shows. Given the evidence of X1 (setting a certain state), the posterior probability of X4 can be calculated by Equation (2):
P(X4/X1) = P(X4/X3,X2)P(X3/X1)P(X2/X1)
where P(X2/X1) and P(X3/X1) is given in their own CPT.
There are mainly three steps to build a BN (shown in Figure 2): firstly, determine the BN variables and their state classification based on case study or expert knowledge; secondly, determine the BN structure, i.e., the casual relationship of BN variables; thirdly, determine the conditional probabilities of all the nodes.

2.2. Delphi Method

The Delphi method is devoted to solve the problems under some situations that statistical data could be difficultly acquired. The Delphi method is an interactive forecasting method relying on judgements from a panel of experts, and it has been widely used in information emerging, forecasting and policy-making on financial markets, medical coding, site selection of desalination plants, etc. [38,39,40,41]. The performing procedure of the Delphi method includes: (a) Setting up the leadership group; (b) Designing the questionnaire; (c) Selecting experts; and, (d) Data collection. Firstly, experts are asked to give their opinion on the target problem generally through answering questionnaires. Then, a facilitator assesses the expert judgments, makes an anonymous summary, gives feedback to the experts, and obtains the new opinions. This procedure could be repeated several times (two to five rounds) until a consensus emerged. When using the Delphi method, the consistency and reliability of the collected data from experts should be evaluated according to the Coefficient of Variation and Cronbach’s coefficient. The Coefficient of Variation V represents the coordination degrees between experts. The Cronbach’s coefficient Alpha refers to the consistency of the results. Generally, the collected data is reliable when the Cronbach’s coefficient Alpha > 0.9 [42]. There are two main advantages of the Delphi method evaluated with the Cronbach’s coefficient Alpha. Firstly, the final data are reliable after the examination by the Cronbach’s coefficient Alpha. Secondly, it could efficaciously increase the efficiency of the investigation. The main equations of the Delphi method are listed, as follows:
V j = σ j x j ¯
α = K K 1 [ 1 i = 1 K σ Y 2 σ X 2 ]
where Vj, σj and x j ¯ are the variable coefficient of the components, variances of the components, and average of the components. The bigger the Vj is, the more deviations the homologous datum has α, σ X 2 , and σ Y 2 are the Cronbach’s coefficient Alpha, variances of the total scores, and the variance of the components respectively, and K is the number of components.

3. Bayesian Network of Urban Underground Flooding

3.1. Node Variables and the BN Structure

In this study, based on a comprehensive analysis of some typical flood cases in urban underground spaces (especially the flooding in subway stations) and further evaluation by expert experience, we identify eleven basic BN variables for representing underground flood from causes to consequences. These node variables are classified into two groups: the “parent” variables that need prior probabilities; “child” variables that have “parent” nodes, and the conditional probability of these variables should be given at different state combinations of their parent nodes. The node variables that are involved in underground flooding BN are briefly introduced, as follows, and the classifications of all the eleven nodes are shown in Table 2.
(a) Precipitation intensity: According to the rainfall levels in State Standard of China (GB/T 28592-2012), we set three states of “Precipitation intensity” node, and each state would cause different extents of urban waterlogging.
(b) Dike/dam-break: From the underground flood cases, it is known that the dike/dam break could significantly aggravate the flood extent. As a result, we give this node, and set two states of “Dike/dam-break”: Occurrence and Nonoccurrence.
(c) Flooding Entrances: Generally, the overland waterlogging flows into the underground space through the ground entrances. The discharge of flood in the underground space normally increases with the number of entrances from which the flooding intrudes. According to underground flood cases, there is mostly only one flooding entrance, but some cases have two or more flooding entrances. Therefore, we set two states of “Flooding entrances” node: One and One more.
(d) Flood control measures: Once the urban waterlogging turns up, the flood prevention measures arranged at the entrances of underground facilities that work effectively or not have great or adverse effects on mitigating underground flood. In this study, we arrange “Flood control effectiveness” node with two states. One state is “Effectiveness” that means the measures can successfully prevent the flood from flowing into underground space, and the other state, “Failure” reveals that the prevention measures fail.
(e) Underground flooding charge: Based on the critical criteria for safety evacuation underground flooding [18] and the step flow formula that was proposed by Takahashi [43], it can be obtained that the maximum allowable flooding charge is approximately 0.28 m3/s/m if the trapped people can successfully evacuate through the staircases. In this study, we classify the “Underground flooding charge” into two states: Less than 0.28 m3/s/m; More than 0.28 m3/s/m.
(f) Threatened persons: This node is mainly to represent the effects of flooding occurrence time on casualty, since at different times the number of persons in underground spaces varies a lot. It is primarily referred to persons in underground subway stations at different working time, and usually the threatened persons will get the maximum in rush hour. According to the statistical data of subway ride in big cities in China, we set three states of threatened persons: Less than 150 persons; 150 to 300 persons; More than 300 persons.
(g) Staircase flow intensity: Under different extent of underground flooding charge, the staircase flow intensity differs. The water depth (h) and flow velocity (v) of the staircase flow are usually used to evaluate the staircase flow intensity. Inoue et al. proposed that if the value of v2h exceeds 1.5 m3/s2, trapped people would not evacuate from underground space through staircases [44]. Later, Ishigaki et al. experimentally demonstrated the criteria value as 1.2 m3/s2 [18]. In this paper, we choose 1.2 m3/s2 as the criteria value for safety evacuation, and two states of “Staircase flow intensity” are set: Less than 1.2 m3/s2; More than 1.2 m3/s2.
(h) Working condition of the ventilation system: If the ventilation system in underground facilities was destroyed by the flood, the trapped people would be quickly in a life-threatening situation due to a lack of oxygen, and thus this will directly affect the casualty. In this study, the damage assessment of the ventilation system is given two states: Working; Failure that means the ventilation system is failed or damaged to ventilation disorder.
(i) Working condition of the drainage system: The drainage system is generally equipped in underground facilities. Normally, the working condition of the drainage system significantly affects the flood mitigation when the underground flood is not that severe (e.g., dam/dike break induced flood). Two states of damage evaluation of the drainage system are given: Working; Failure that means the ventilation system is failed or damaged to weak drainage.
(j) Casualties: Casualty is the most representative indicator to assess hazard consequences. According to the statistical death data of underground flood cases, casualties can be classified into three states: None; One to three persons; More than three persons.
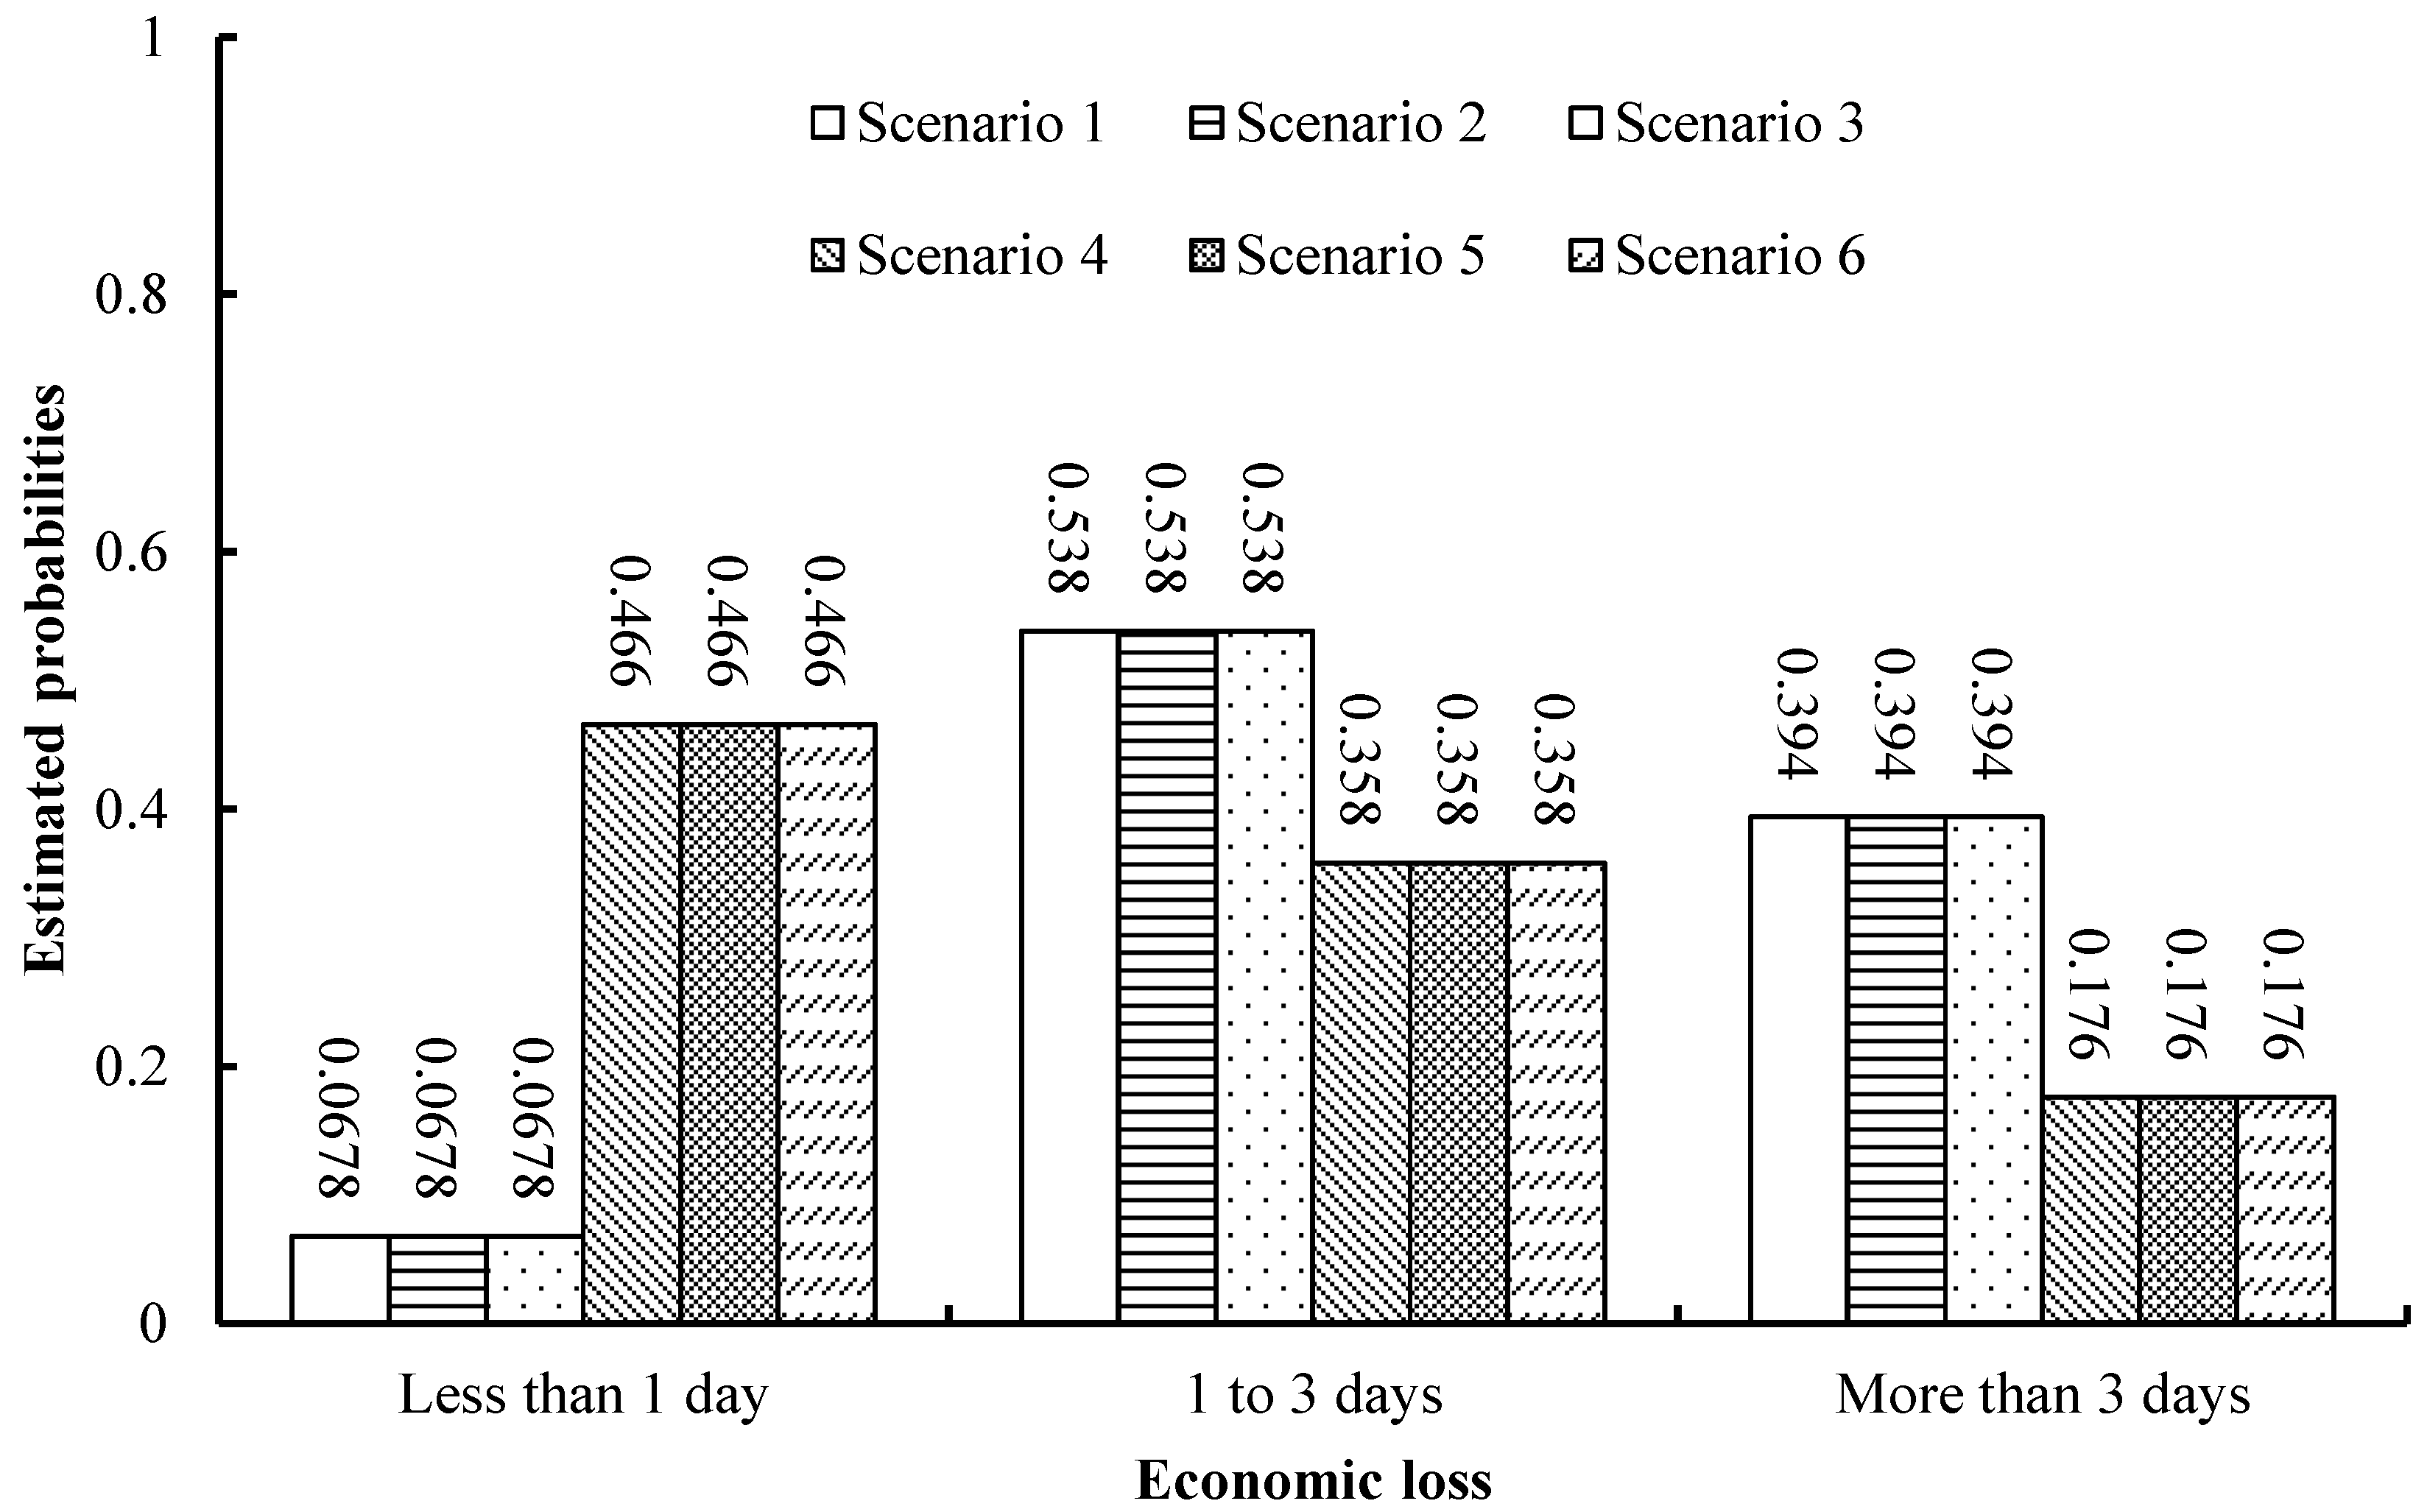
(k) Economic loss: In this study, two nodes, i.e., “Casualties” and “Economic loss”, are proposed to quantify the flood consequences. However, in some cases, it is difficult to measure and quantitate the economic loss of the underground space after flood with money. In this study, we choose the out-of-service time instead of specific property loss to estimate the damage loss that is caused by flood, and three states of “Economic loss” are set based on the statistical underground flood cases: Less than 1 day; 1 to 3 days; More than 3 days.
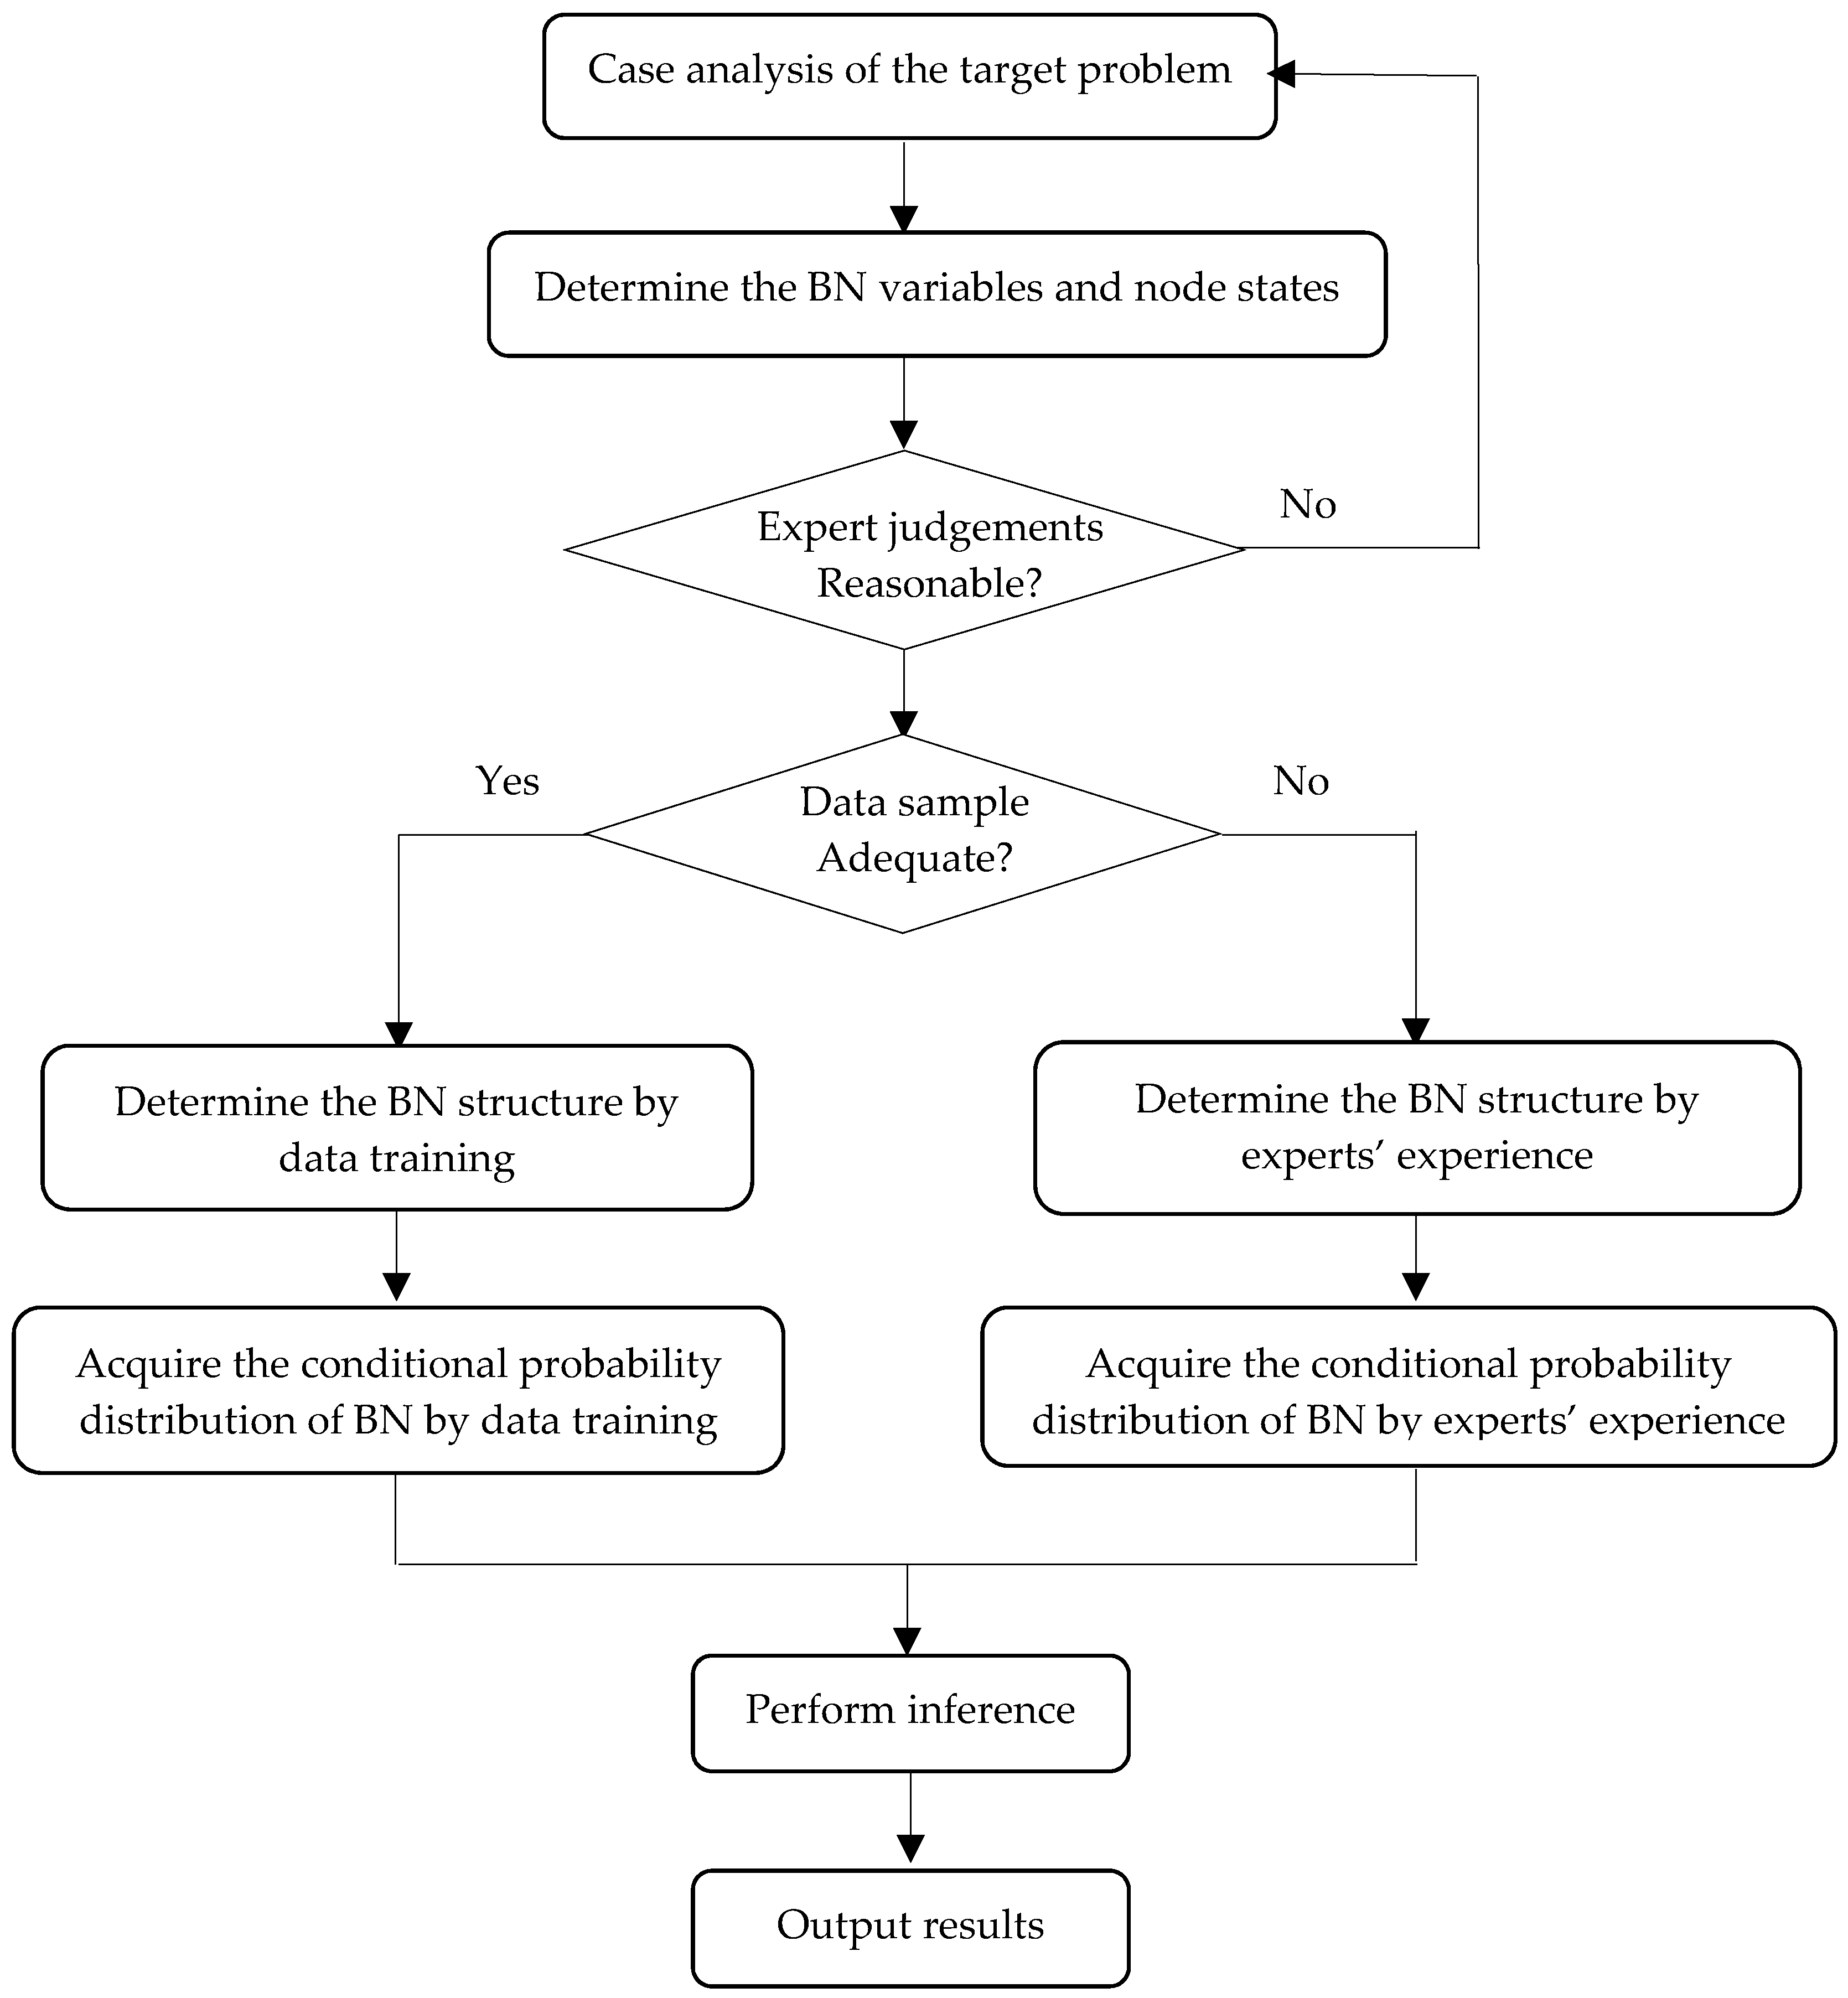
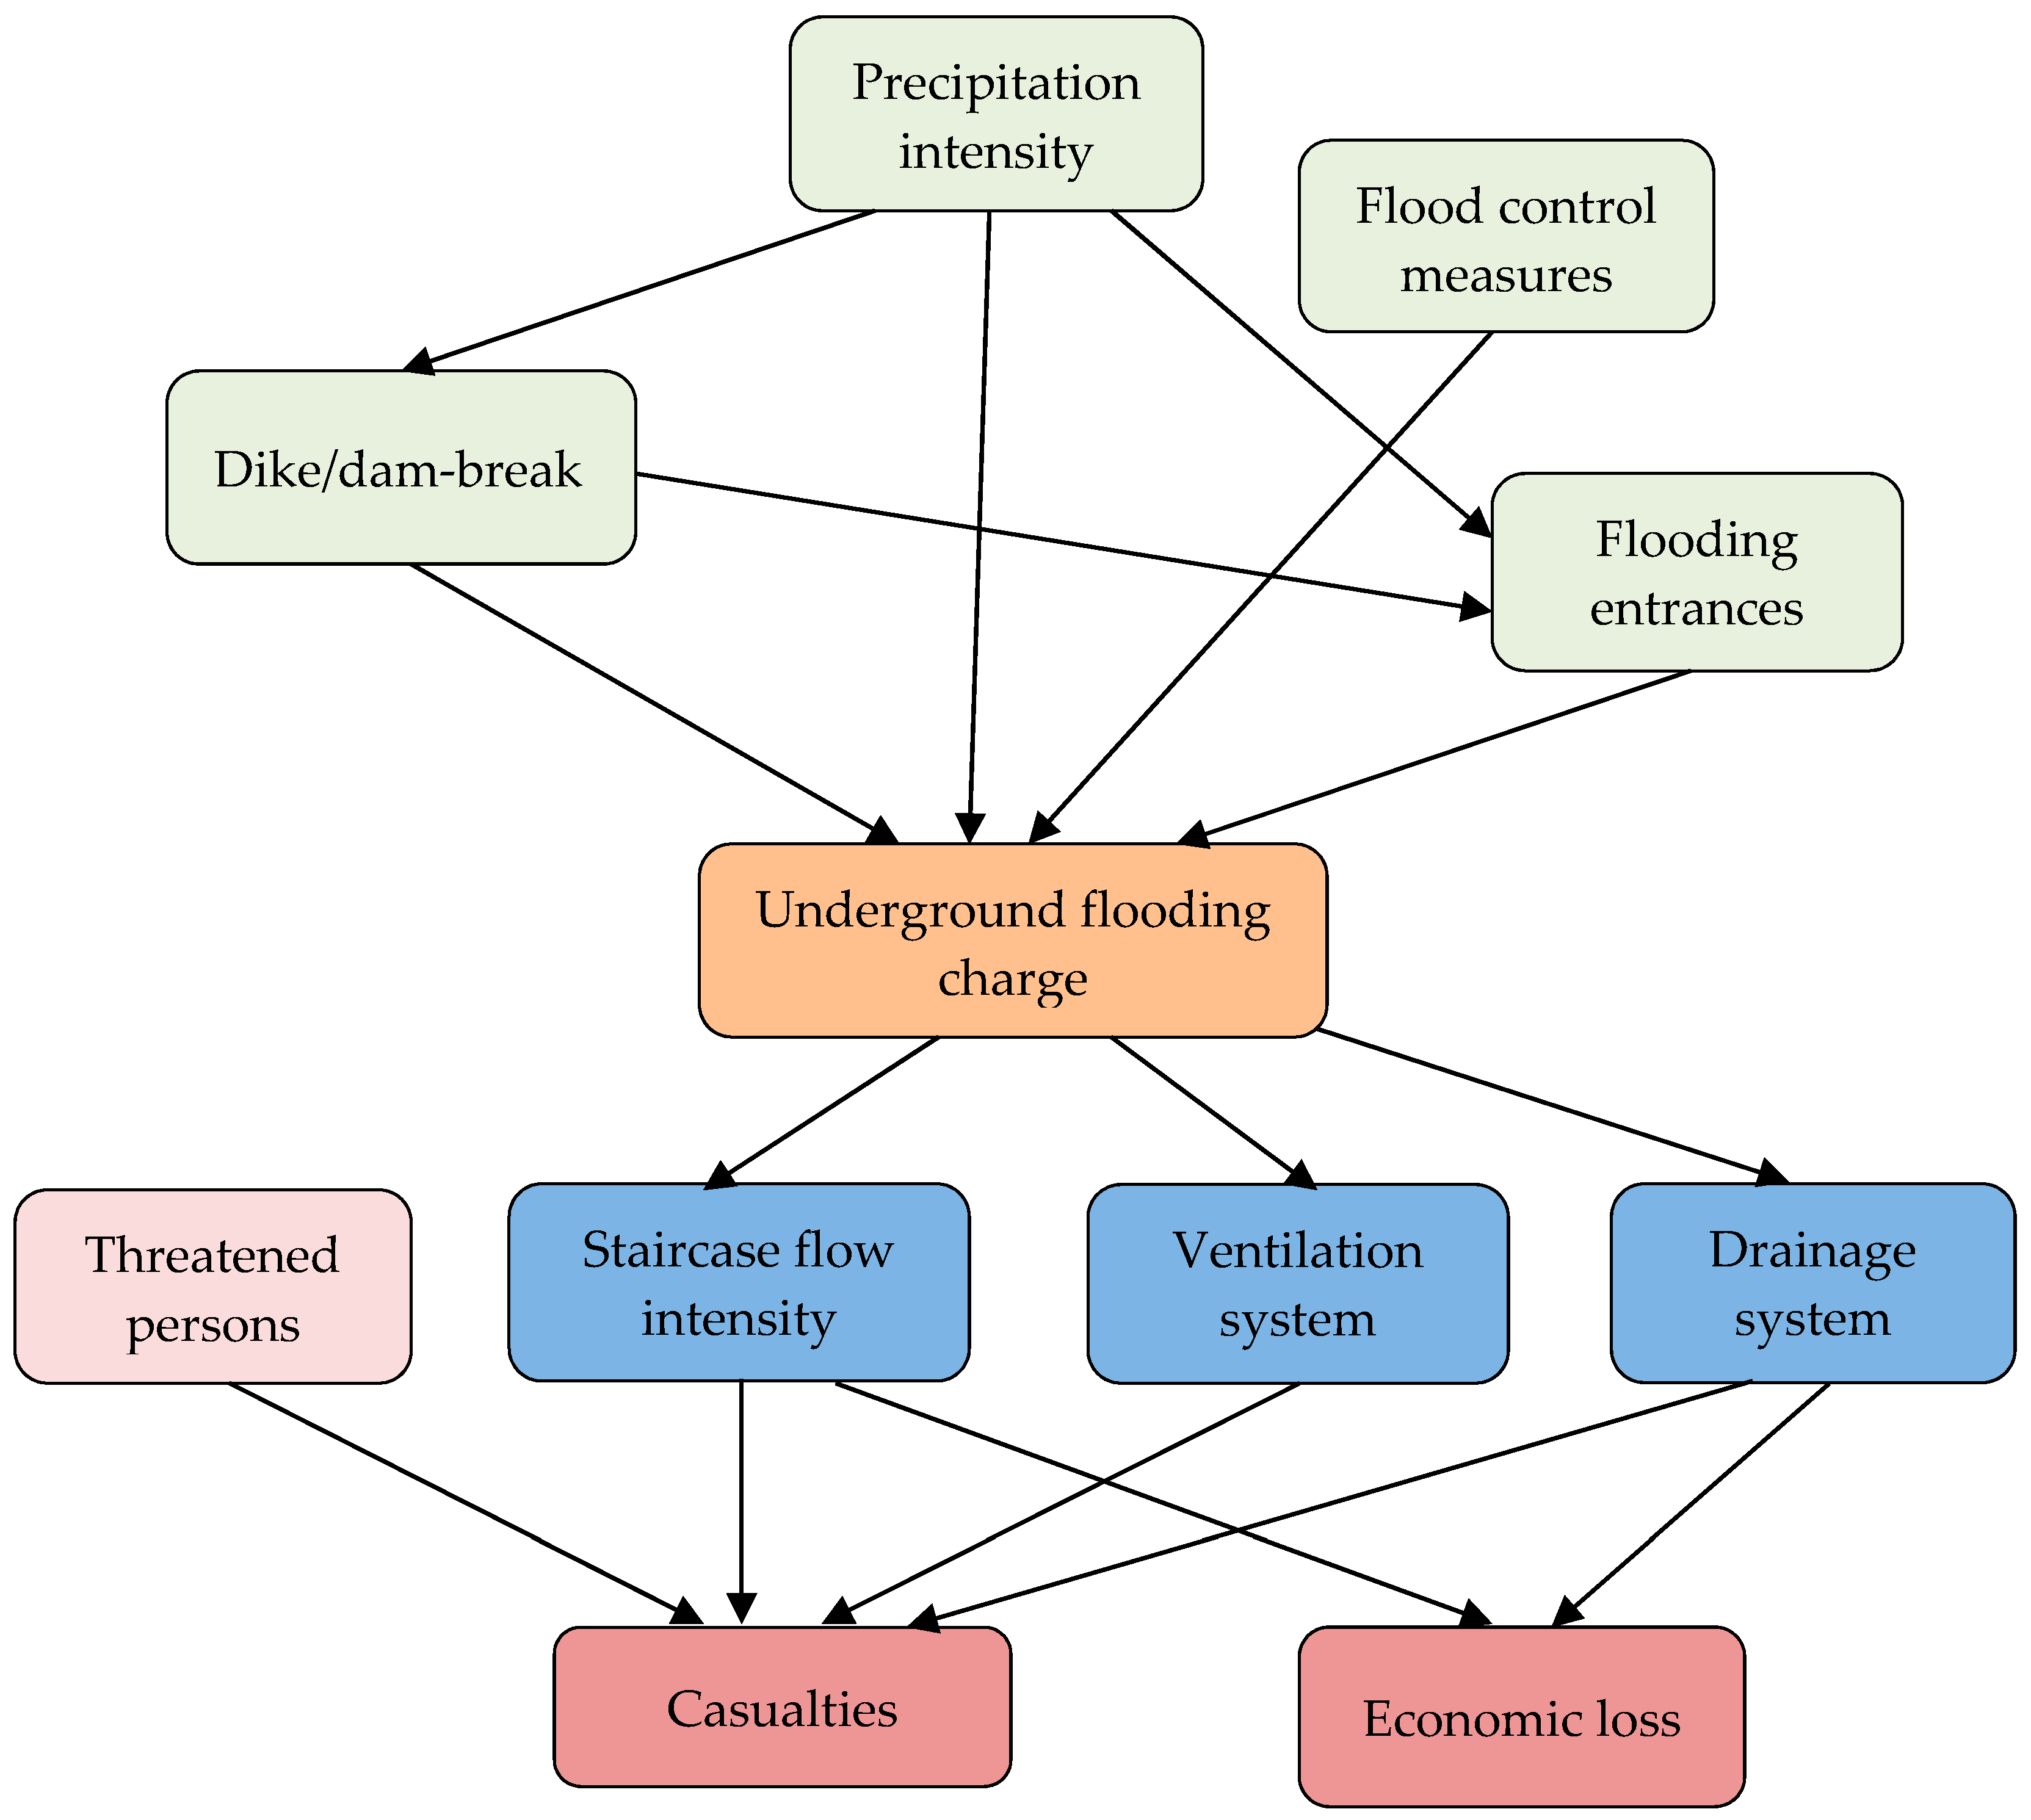
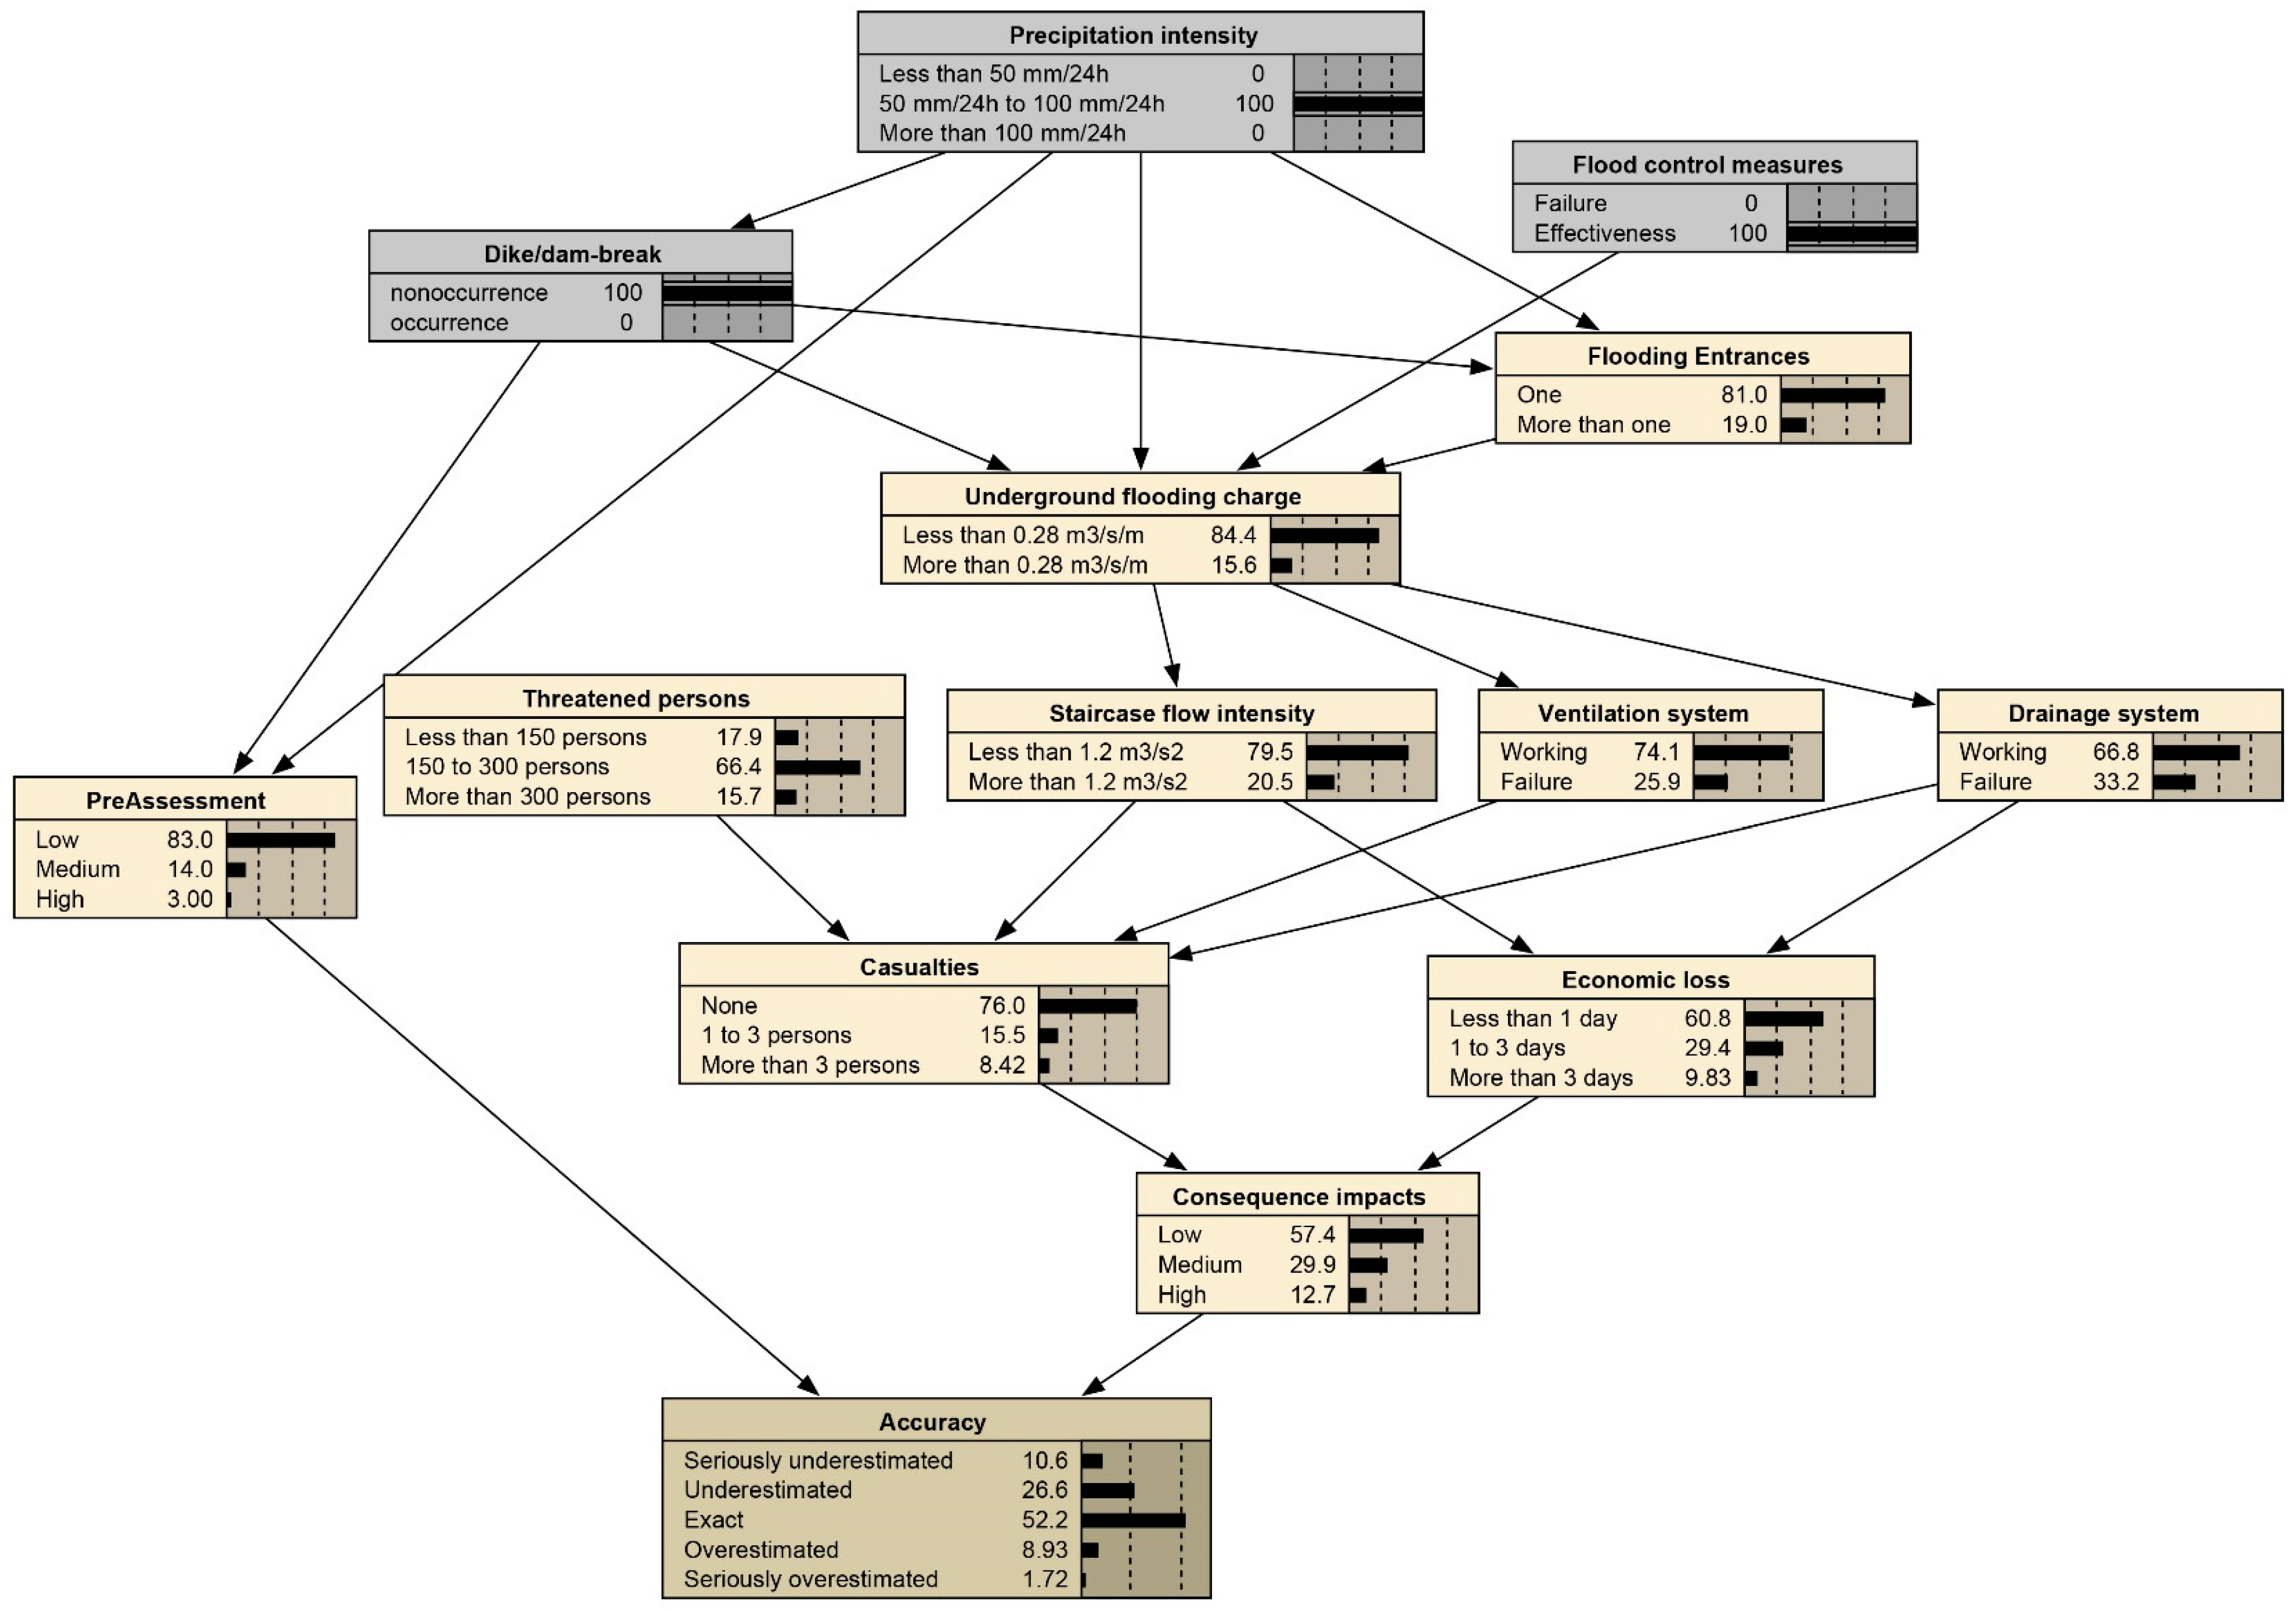
After determining the node variables of Bayesian network, there are generally two ways to determine the structure (or called cause-effect relationships). The first one is data learning, which should be based on sufficient statistical data. The other way is based on expert knowledge, and this way is suitable for the target problem like the underground flooding without sufficient and detailed historic data. In this paper, we adopt the latter way to determine the structure and meanwhile combined experts’ opinion. The determined BN structure of urban underground flooding is shown in Figure 3.
In order to illustrate the flooding evolvement in underground spaces and the influence of feedback information at emergency rescue stage, three kinds of BN structures for modeling urban underground flooding are put forward. The first BN structure contains 11 variables focusing on elucidating the basic evolution process of flooding in underground space (shown in 
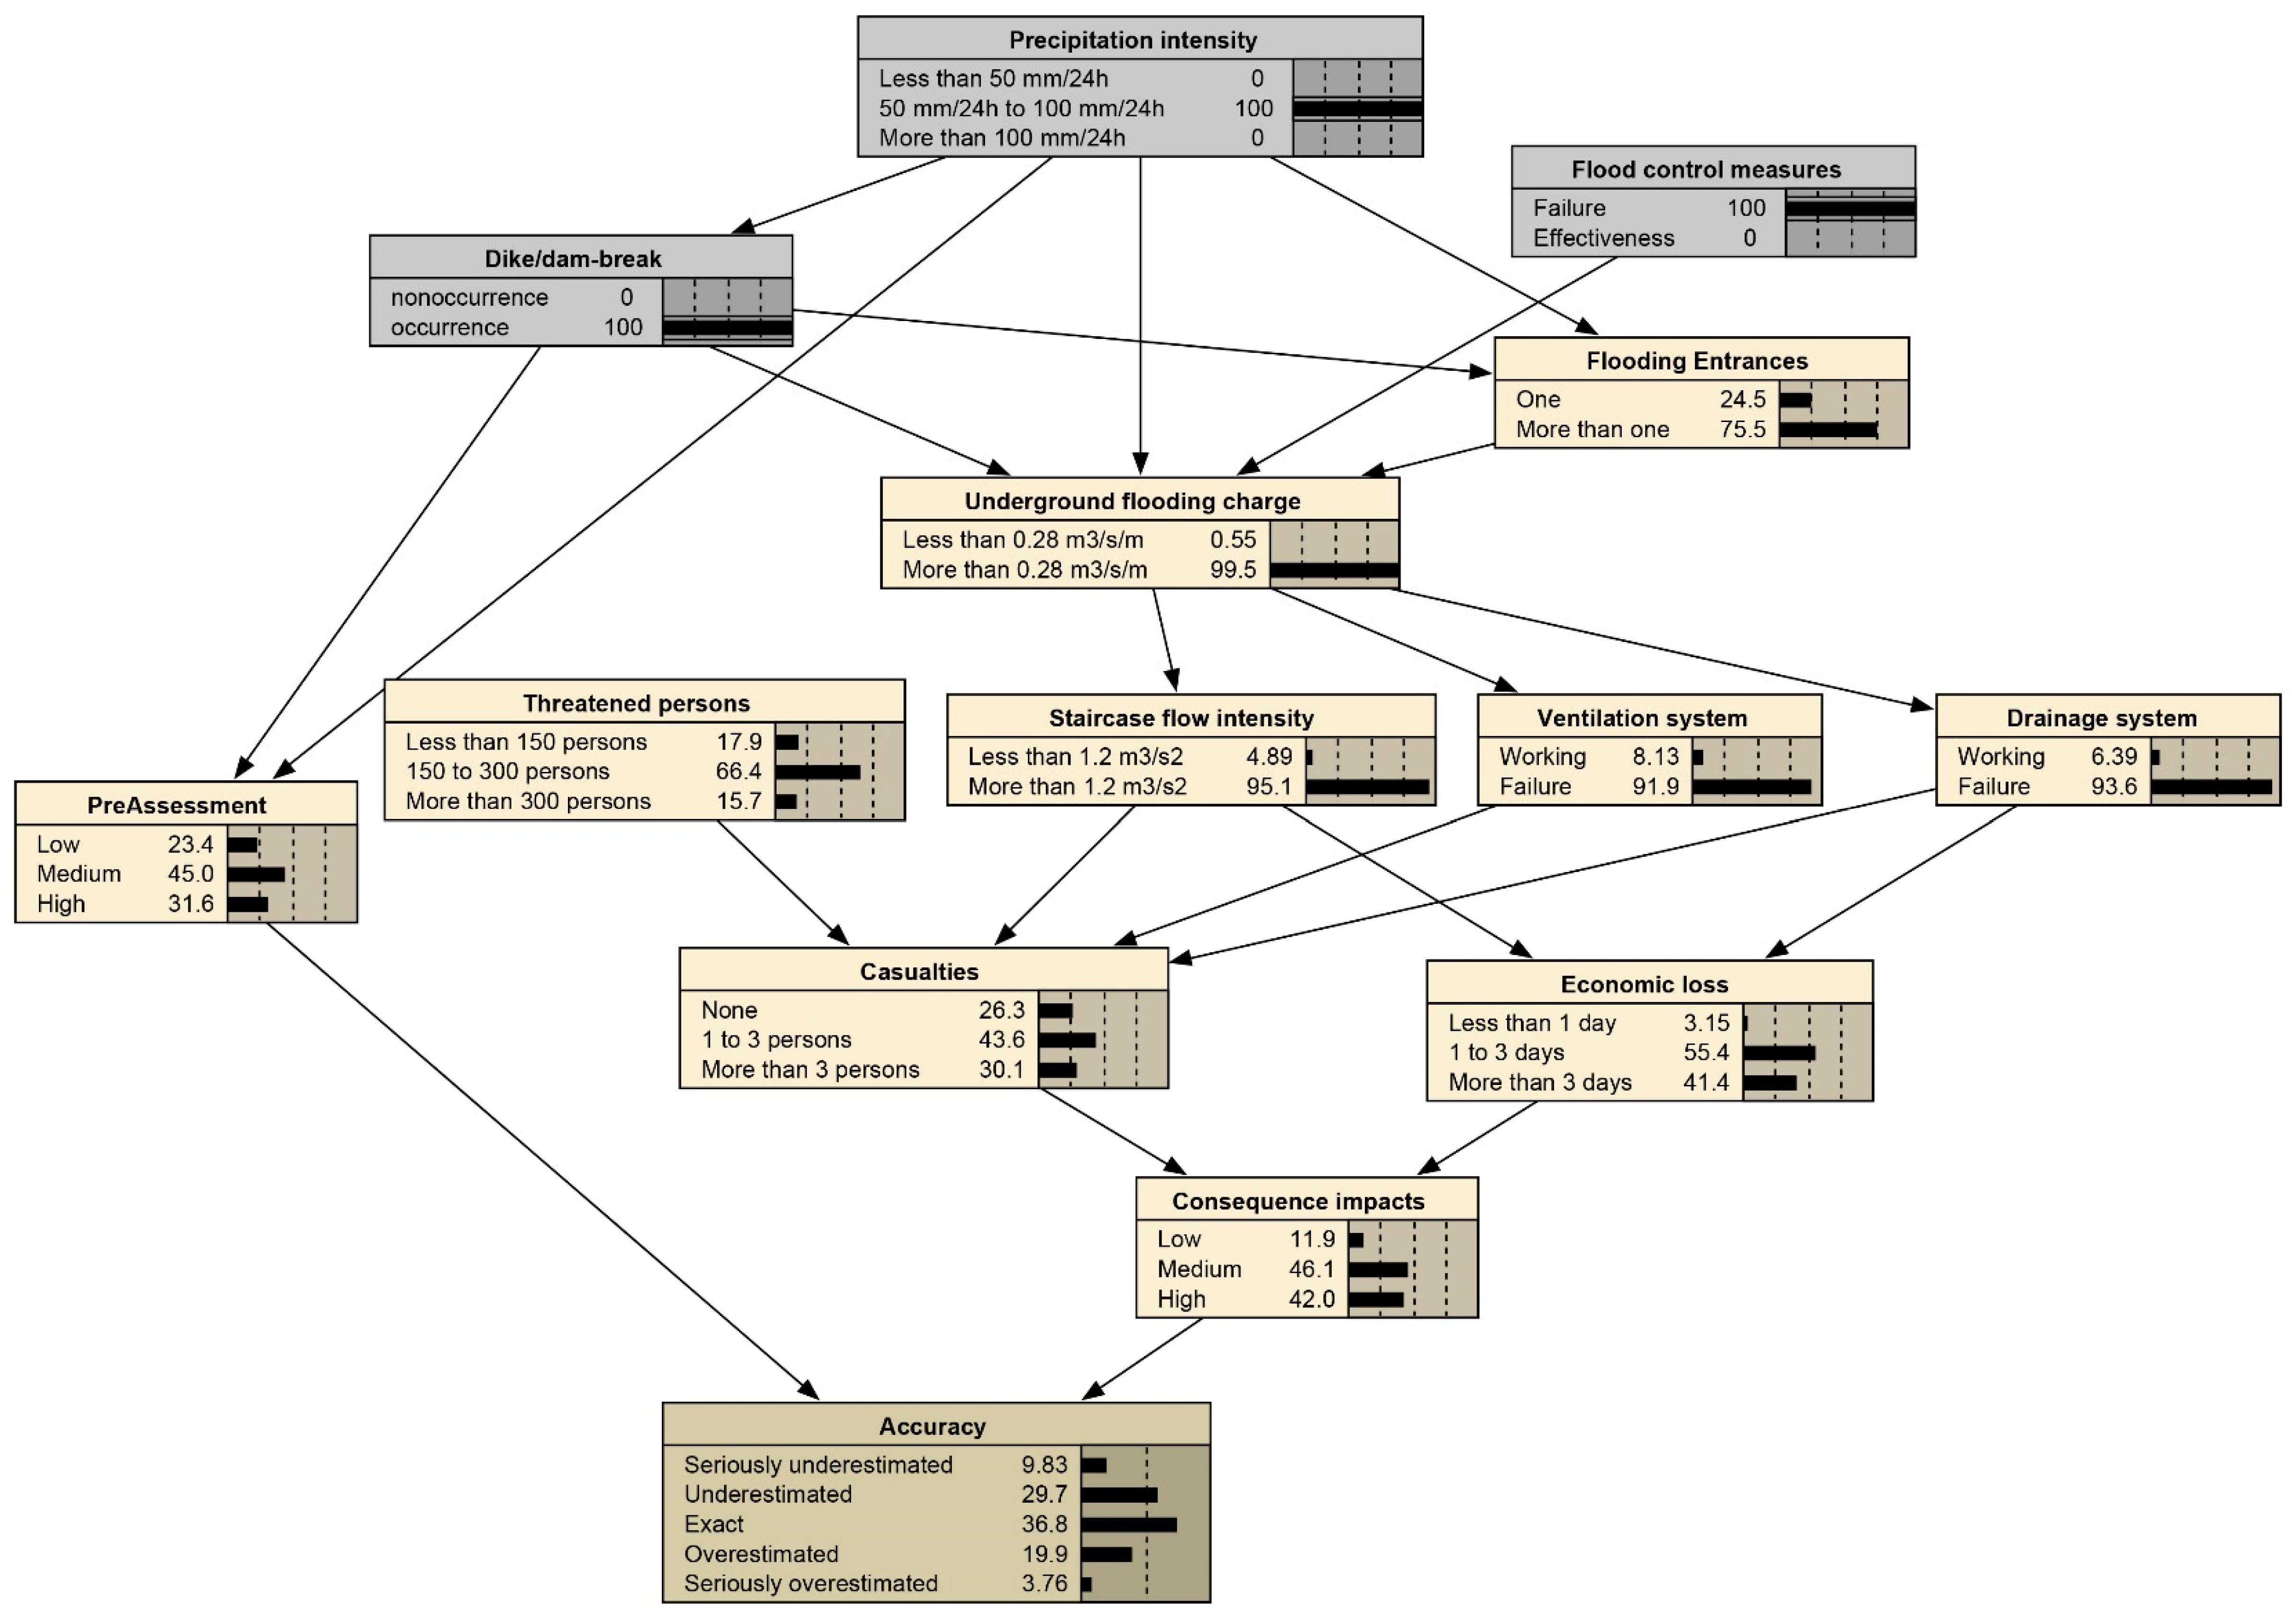
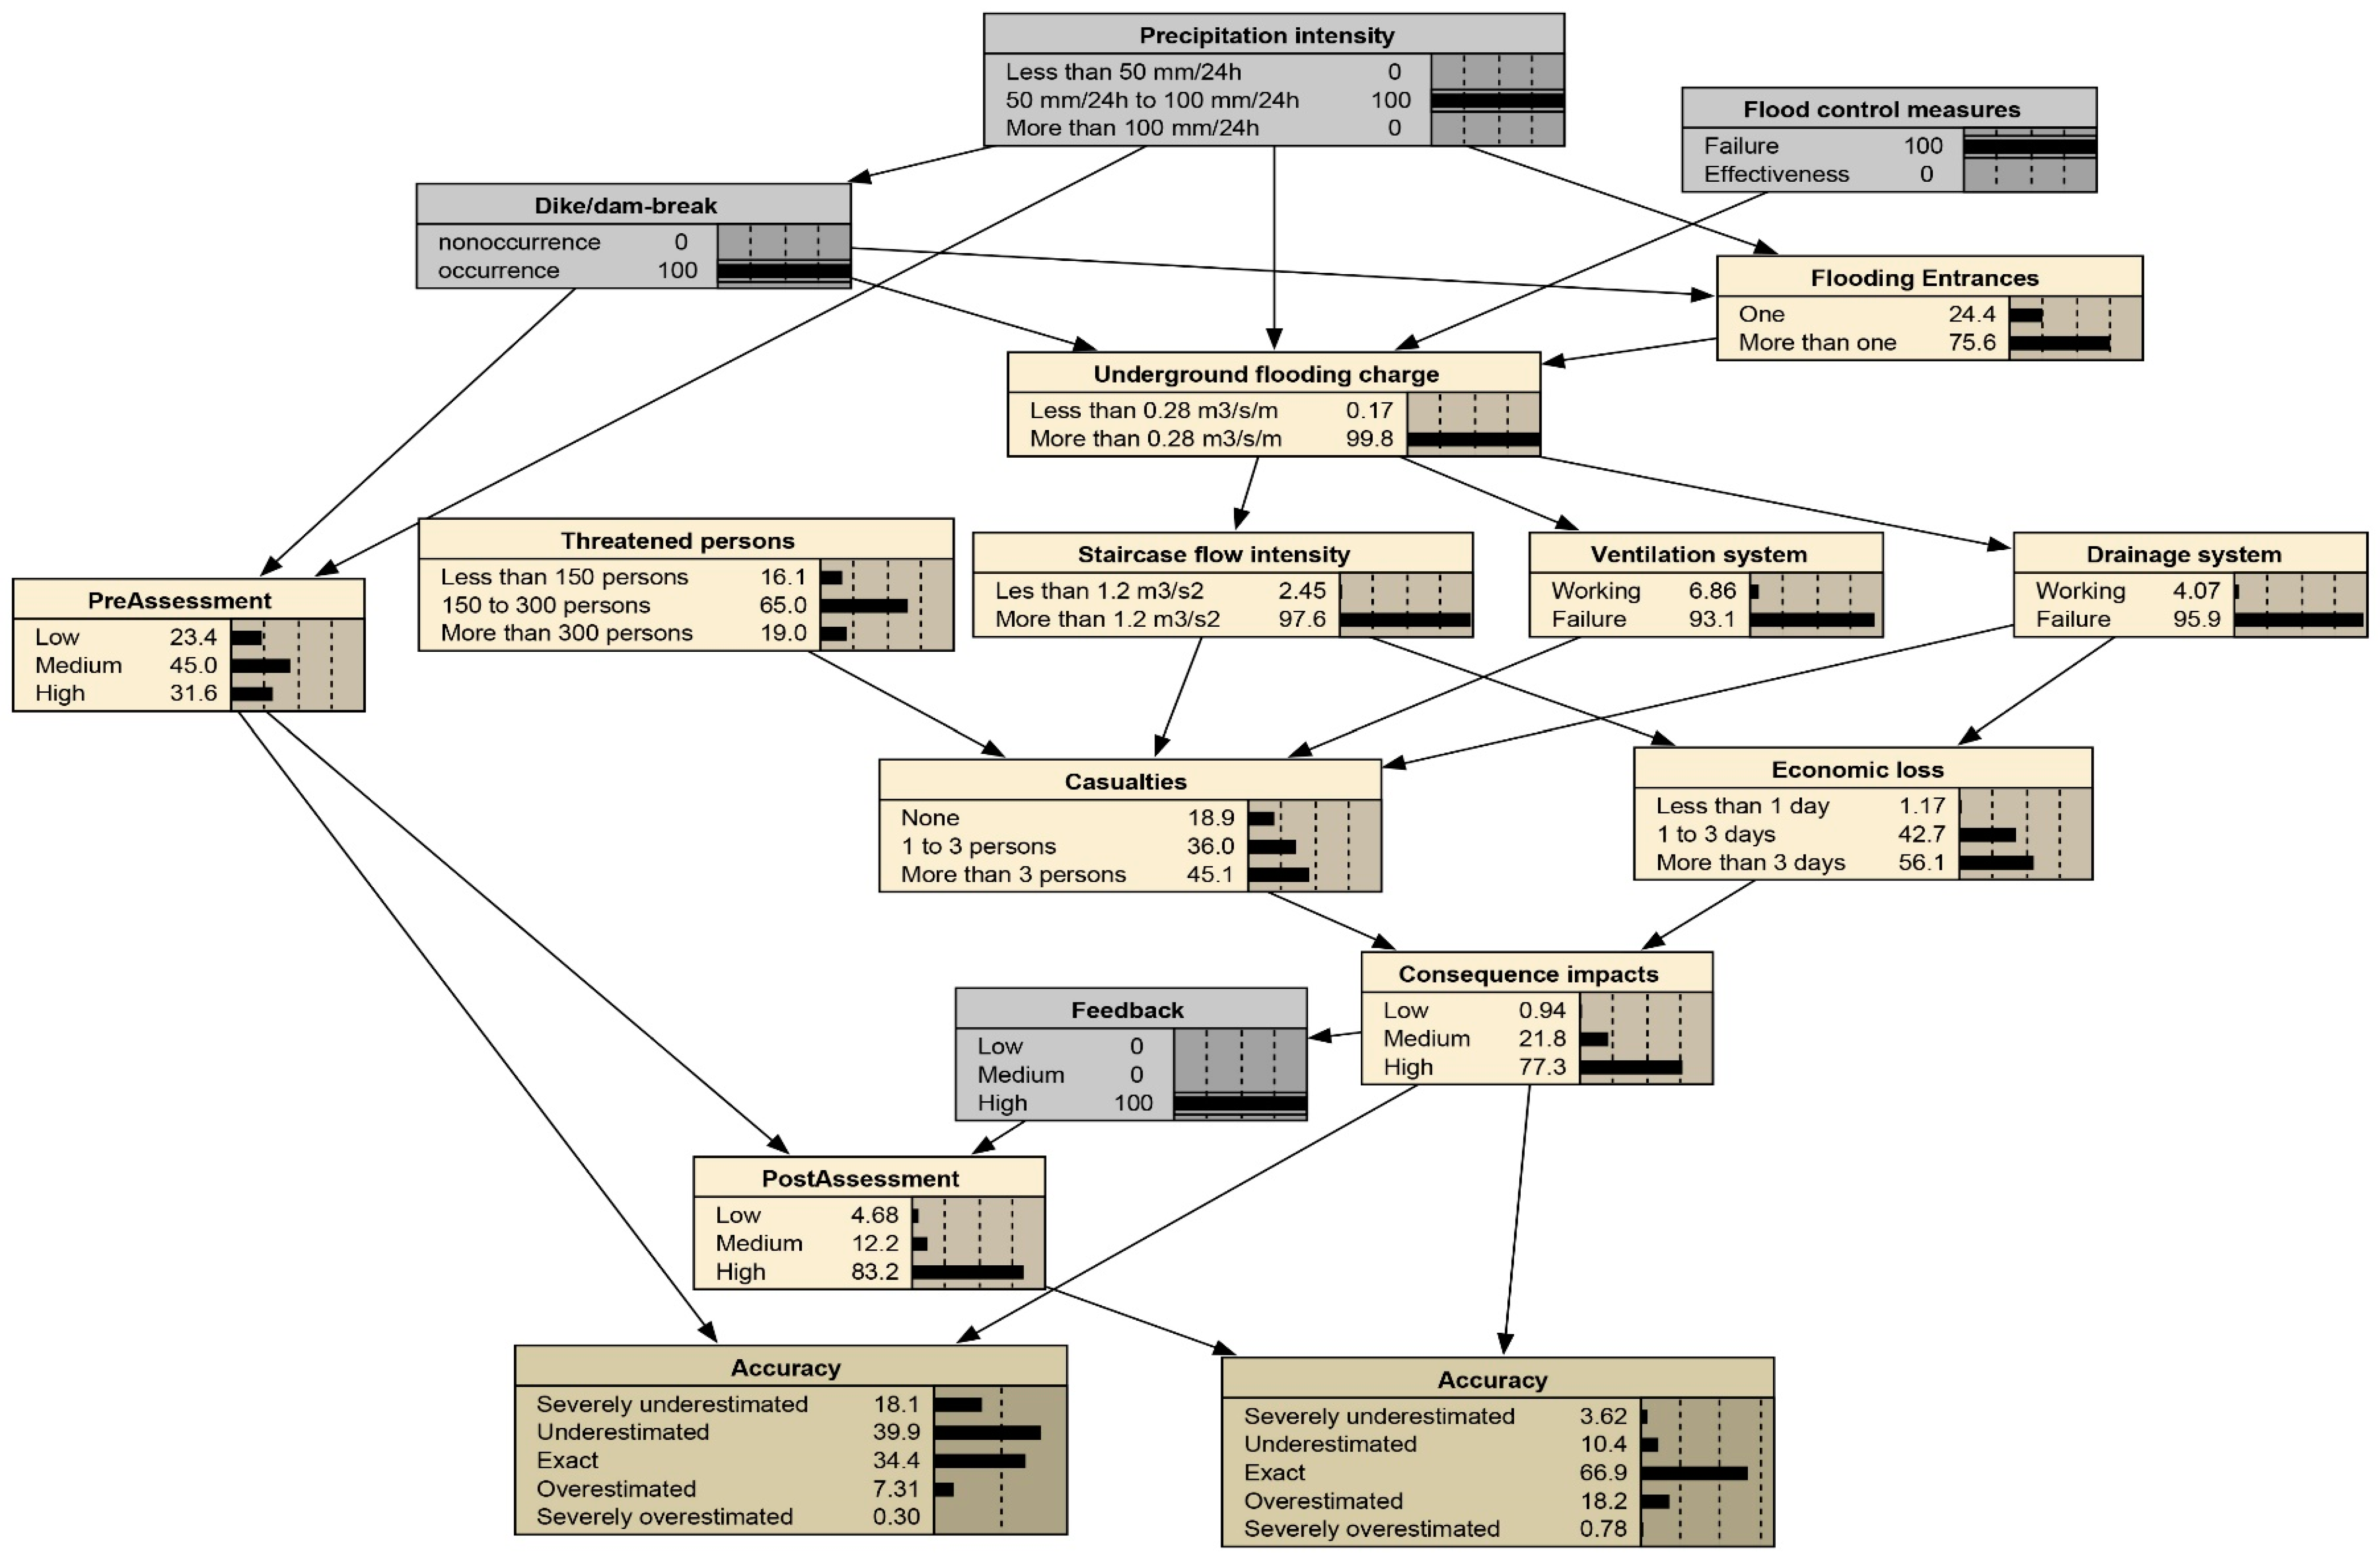
Figure 3). The second BN structure introduces the pre-assessment casualty that is based on historic flood records, the results of which will be compared with the estimated casualty by using the proposed BN framework. The third structure puts the feedback information into the second BN structure.

3.2. Determination of CPTs of the BN Nodes

To perform the inference calculation, it is required to collect the conditional probability distribution for every BN node. Due to the lack of sufficient and detailed statistical data that can elaborate the flood evolvement in underground spaces, it is difficult to determine the conditional probability tables (CPTs) of the proposed BN with historical data by data training (or called parameter learning) algorithms. In this case, it is suitable and effective to employ expert knowledge to determine the CPTs, which has been proved to work well in constructing BN in a variety of areas [45,46]. In this paper, we collect the conditional probabilities by questionnaire from experts. There are several similar methods taking advantage of experts’ experiences, for example, in Delphi, it is generally proposed to choose three to five experts to perform the judgements if there were 10 to 20 nodes in the network [47]. In this study, we invited six experts to complete the questionnaires, and all of the experts have professional knowledge and rich research or engineering experience on flood problems. The collected data of questionnaire are further processed using the Delphi method and the consistency check of Cronbach’s coefficient Alpha to enhance the consistency and credibility, as the example in the next paragraph shows. Finally, a list of conditional probability distribution of every BN node is obtained.
With regards to the first type “parent” nodes, such as “Precipitation intensity”, “Flood control measures”, and “Threatened persons”, the experts need to give the prior probability distribution to each state of the node, according to their professional experience. Taking the node “Precipitation intensity” with three states as an example, the probability distribution (0.600, 0.300, 0.100) given by one of the experts means that the expert believes that it is more likely for the first state “Less than 50 mm/24 h” to come up with the probability of 0.600. For the second type (“child”) nodes which have parent nodes, their prior probability distributions are determined by the state combinations of their “parent” nodes. Herein, we take the “Economic loss” node, which depends on “Staircase flow intensity” node and “Working condition of the drainage system” node as an example. After conducting the questionnaire, the experts’ insights and the results of scores are listed in Table 3. In the column “Expert opinion”, the probabilistic values corresponding to m1~m6 represent the evaluation results of the “Economic loss” node by the six experts. When the “Staircase flow intensity ” state is “Less than 1.2 m3/s2” and “Drainage system” is “Working”, the probability of the expert m1 in column “L” (“L” means the state of “Economic loss” is “Less than 1 day”, “M” means the state of “Economic loss” is “1 to 3 days” and “N” means the state of “Economic loss” is “More than 3 days”) is 0.900, which means that expert m1 believes that if the staircase flow intensity is less than 1.2 m3/s2 and drainage system is working, the probability of economic loss less than one day is 0.900.
As shown in Table 3, m1 to m6 are the final judgement of the six experts which are obtained by several rounds checking through the Delphi method. The Cronbach’s coefficient Alpha is 0.995, as calculated by SPSS (IBM SPSS statistics 25.0), which indicates the consistency of the collected data from the six experts. Finally, an average of the results given by six experts is shown in column m. After repeating the method mentioned above, the conditional probability tables of all BN nodes can be acquired.

3.3. Procedures of Applying the Framework

After the determination of BN structure and the CPT of all BN nodes, the complete BN is derived. With the proposed BN model, the probability inference of flooding in underground spaces can be achieved. With regards to the application of this BN-based framework for the risk assessment of underground flood, the procedures are introduced, as follows:
(a) Collect various on-site flood information like: (1) the size of the rainfall intensity; (2) possible dam/dike break around the underground space; (3) the number of flooding entrances to underground space; (4) the estimated number of threatened people; (5) working condition of ventilation and drainage system; and, (6) available flood control measures.
(b) According to the obtained flood information, give the evidences to the corresponding Bayesian nodes.
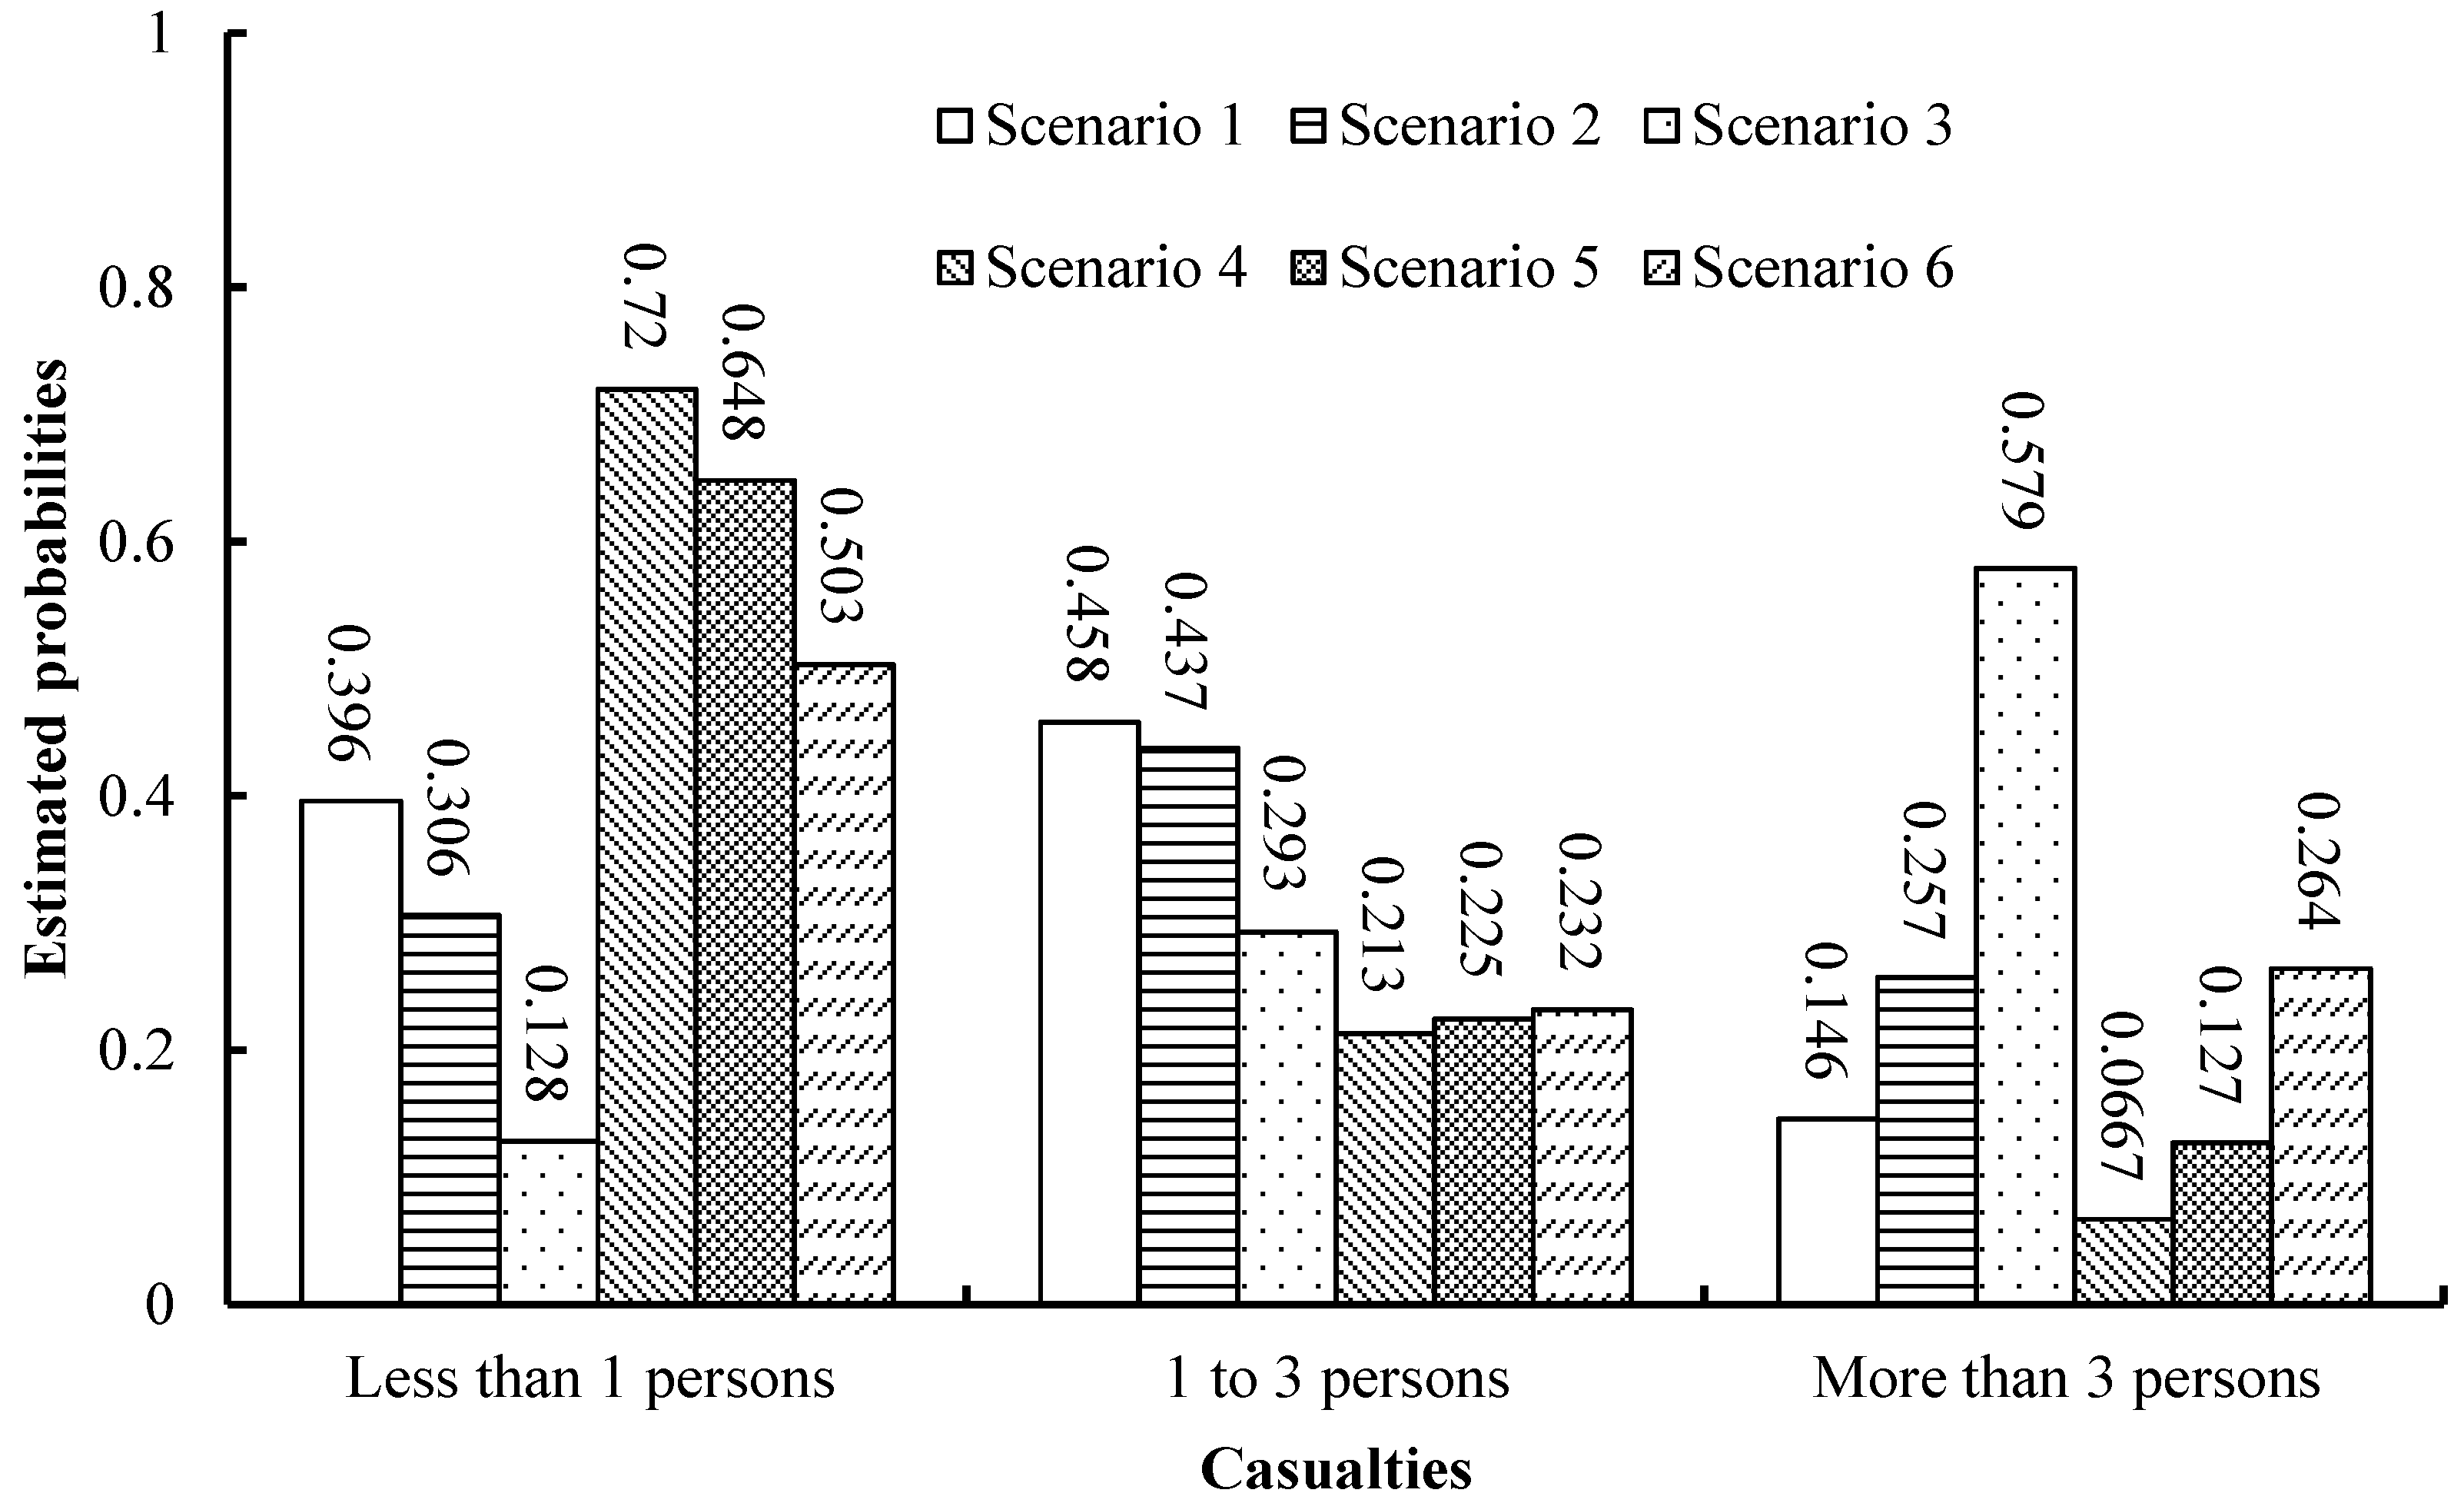
(c) Perform the BN inference, we can get the posterior probability distribution of every Bayesian node, and we may mainly refer to the number of casualties and economic losses.
(d) Based on the flood scenario consequences, we can implement different mitigation measures, and if given, this mitigation action evidence to the BN model, we can examine its effectiveness.
It should be noted that if we get some feedback information about the flood status like water depth and velocity underground, this can also give evidence to the corresponding BN nodes and perform calculation. Furthermore, according to the specific situation, we can also updated (add or delete) some nodes to adjust the BN for dynamic evaluation. In this paper, the probabilistic analysis of underground flooding evolvement is taking advantage of the junction tree inference algorithm of BN in Netica software (one of the most widely used Bayesian network development software, Norsys Software Corp., Vancouver, BC, Canada), which is an effective approach to process the probability inference.

4. Results and Discussion

4.1. Basic BN of Underground Flood

Based on the proposed Bayesian network of flooding in underground spaces, scenario analysis of the evolution process and the consequences of the underground flooding can be conducted. In the basic BN of underground flooding, two main kinds of flood scenarios were discussed by setting up different state combinations of some “parent” nodes. The first scenario mainly focuses on analyzing the dike/dam-break flooding case in urban underground facilities and demonstrating the feasibility of the proposed Bayesian network for modeling underground flooding. The second scenario is to assess the importance of effective measures for flood prevention and the effects of flood occurrence time, which significantly affect the number of threatened persons in the underground facilities.

4.1.1. Dike/Dam-Break Flood in Urban Underground Space

The rainfall and the water from dike/dam-break are the primary source of urban waterlogging. Especially, dike/dam-break usually results in enormous economic loss and casualties because of the large water volume that far surpass the maximum designed capability of the urban drainage system. In order to mainly examine the effects of dike/dam-break flooding on urban underground facilities, the states combination for “Dike/dam-break” flooding are set to be: (a) “Dike/dam-break” with “② Occurrence”; (b) “Precipitation intensity” with “① Less than 50 mm/24 h”, which is to reduce, to the largest extent, the impact of rainfall intensity on underground flooding. Meanwhile, for specifically comparative analysis, we calculated the results on condition of the following state combinations, as listed in Table 4.
The estimated probabilities of dike/dam-break flooding case (seen the results with grey background in Table 5) and other comparative results are given in Table 5. When the state of “Precipitation intensity” is set to be “① Less than 50 mm/24 h” and the state of “Dike/dam-break” changes from “① Nonoccurrence” to “② Occurrence”, it can be clearly observed that the inference probability of the first state of “Casualties” (① Less than 1 person) decreases apparently from 0.800 to 0.479, while the inference probabilities of the second state and the third state of “Casualties” increase dramatically from 0.133 to 0.314 and from 0.067 to 0.207, respectively. Meanwhile, the inference probability of “Economic loss” has the same changing tendency as “Casualties”. This indicates that the underground flooding that was caused by dike/dam break is of high possibility to result in life losses and severe property damage. When the state of “Dike/dam-break” is set to be “② Occurrence” and the state of “Precipitation intensity” changes from “① Less than 50 mm/24 h” to “③ More than 100 mm/24 h”, it can be obviously seen that the inference probability of the third state of “Casualties” (③ More than three persons) increases from 0.314 to 0.437, while the inference probability of the third state of “Economic loss” goes up to 0.415, which reveals that the dike/dam-break and heavy rainfall would be more likely to lead to catastrophic life and economic losses. These results demonstrate that strong rainfall and dike/dam-break should not be ignored in the process of urban planning, especially the design and planning for the flooding prevention in underground facilities. Besides the nodes “Casualties” and “Economic loss”, the inference probabilities of other nodes have a similar and reasonable changing trend when the “Precipitation intensity” is getting more severe and meanwhile the dike/dam break arises. These reasonable results verify the feasibility of the proposed basic BN of underground flooding.

4.1.2. Scenario Analysis of Flood Occurrence Time and Mitigation Measures

The flood occurrence time significantly affects the number of threatened persons in the underground facilities, and thus may influence the casualties. In order to mainly discuss the effects of “Flood control measures” and “Threatened persons” on flood consequence, six scenarios are selected through the states combination of “Flood control measures” and “Threatened persons” (Seen in Table 6), and at the same time, the evidences of two other Bayesian nodes “Precipitation intensity” and “Dike/dam-break” are given in Table 6.
The inference probabilities of “Casualties” and “Economic loss” are illustrated in Figure 4 and Figure 5. It can be been observed that a rapid response and a set of effective mitigation measures could dramatically reduce the probability of causing casualties. Taking the comparative analysis of Scenario 1 and Scenario 4 as an example, when the states of “Threatened persons” are both set as “② 150 to 300 persons”, the probability of the first state (① Less than 1 person) of “Casualties” increases from 0.396 to 0.72, while the state of “Flood control measures” is set from “① Failure” to “② Effectiveness”, and the probability of other states of “Casualties” has the tendency to decrease(seen in Figure 4). Meanwhile, with the change of “Threatened persons”, the probability of “Economic loss” is a constant. That is because that the node “Economic loss” is independent with “Threatened persons”, as shown in the proposed Bayesian network (seen Figure 2). From the estimated probability of “Economic loss” (seen in Figure 5), when the state of “Flood control measures” was set from “① Failure” to “② Effectiveness”, the probability of causing severe economic loss was decreased, and the probability of causing less than one day has increased by 39.82%. It can be concluded that it is essential to make sure the measures for flood prevention work effectively in case of underground space flooding. Furthermore, from Figure 4, the inference results also indicate that the “Threatened persons” has strong impact on “Casualties”. For instance, if the state of “Flood control measures” is set as “① Failure”, the probability of causing more than three persons death changed quickly from 14.6% to 25.7%, 57.9% with the increase of “Threatened persons”. Based on this, it is advised that citizens should avoid outdoor activities in order to reduce the risk of being trapped by the underground flooding. In addition, the calculated results conform to the general knowledge of life, which also verify the reasonableness of this Bayesian network for flood in underground spaces.

4.2. BN with Pre-Assessment and Feedback Information

In this section, we add and introduce “Pre-Assessment” node, “Feedback” node, and a couple of mating nodes with “Pre-Assessment” node and “Feedback” node, such as “Consequence impacts”, “Accuracy” and “Post-assessment”, to the basic BN structure. This is to establish and refine the framework of emergency management, and aim to comprehensively examine the proposed BN that represents flood evolution and incorporates more dynamic information for emergency decision-making. The added nodes and the detailed description of their classifications are listed below:
(l) Pre-Assessment: In practice, underground facilities normally have flood emergency plans that are made based on the pre-assessment using the aforementioned experimental or numerical tools. At the occurrence time of underground flooding, the emergency response commanders would generally perform preliminary emergency rescue based on the pre-assessment information, but sometimes it would misguide the emergency response for some flood cases with more dynamic disaster-causing characteristics. In this study, the pre-assessment of the flood consequences is approximately predicted by expects based on the state combination of “Precipitation intensity” and “Dike/dam-break”. The classification of “Pre-Assessment” is defined as follows: Low; Medium; High, which are evaluated by the severity combination of “Casualties” and “Economic loss” like the states of “Consequence impacts” node.
(m) Consequence impacts: This node is introduced to basic BN to estimate the total loss of underground flooding based on comprehensive evaluation of “Casualties” and “Economic loss”. Three states are given to “Consequence impacts” node: low; medium; and, high, which are evaluated by the severity combination of “Casualties” and “Economic loss”. For instance, “High” is mainly determined by the most serious situation of both “Casualties” and “Economic loss”; “Low” is primarily determined by the slightest situation of both “Casualties” and “Economic loss”; “Medium” is the combinations of medium severity of both “Casualties” and “Economic loss” and the combinations of slight and serious severity of both “Casualties” and “Economic loss”.
(n) Feedback: Emergency response is a dynamic decision-making process because of the complexity, variety, and randomness of accident evolution, which requires the emergency response commander to adjust the rescue strategies according to the feedback information from the accident site. The feedback information (water depth, working condition of drainage system, available mitigation measures, etc.) from evacuees, rescue team, or the monitoring system acquired by sensors or video system could offer real-time or more detailed information about flood propagation and casualties. This is really helpful for emergency decision-making and thus making proper mitigation strategies. In this study, “Feedback” on the flooding severity is divided to three states that are similar to “Consequence impacts”, which is to easily examine the estimated probability accuracy of the proposed BN.
(o) Post-Assessment: After combining the dynamic flooding evolvement information and the feedback information, the post-assessment of flood severity (or consequence impacts) is examined with the proposed BN in this study. The classification of “Post-Assessment” is similar to “Consequence impacts”.
(p) Accuracy: This node is to evaluation of the inference accuracy between “Pre-Assessment” and “Post-Assessment”, and the states of “Accuracy” involved in five levels: Severely underestimated; Underestimated; Exact, Overestimated; Severely overestimated.
In order to examine the effects of “Pre-Assessment”, two kinds of flood scenarios, i.e., a slight underground flooding and a serious underground flooding, are calculated with the evidences of some nodes given in Table 7. From the estimated results as shown in Figure 6 and Figure 7, even though the pre-assessment probability of causing great loss are obviously on the high side when compared with the inference value by the proposed BN, the tendency of each state is consistent with the estimated values. From the viewpoint of the rule of maximum membership degree, the “Pre-Assessment” and estimated “Consequence impacts” tend to cause great losses in both slight and serious underground flooding scenario. Meanwhile, the probability of the third state (③ exact) of “Accuracy” has played a dominant role in accuracy evaluation under both two underground flooding scenarios, which demonstrates the reasonability of the implementation of pre-assessment in the proposed BN of underground flooding and also indicates the validity of the proposed BN model for assessment of flooding evolvement in underground spaces.
Feedback information that was acquired from the accident site is pretty helpful for the dynamic decision-making process. In order to examine the effects of the feedback information, “Feedback”node is put into the former BN structure with “Pre-Assessment” for comparative analysis. If the emergency response center receives the feedback information that the flood in the underground space (i.e., consequence impacts) is severe, in this case the state of “Feedback” is set as causing high loss accordingly. From the estimated results as shown in Figure 8, it can be observed that the probability of “Post-Assessment” with “Feedback” has an apparent change when compared with the “Pre-Assessment”, and the probability distribution of “Post-Assessment” is more similar to the “Consequence impacts”. With the verification of flood status by the action of “Feedback” information from accident site, the assessment of flood severity is more accurate, e.g., the probability of the third state (③ exact) of “Accuracy” has reached to 66.9%. The calculated results demonstrate that the feedback information could correct and refine the inaccurate results of pre-assessment in case of inadequate precipitation and other flooding information, and thus avoid the misguide for emergency decision-making.
Obviously, the proposed BN of underground flooding well present the effects of pre-assessment and feedback information, which is really important for loss mitigation for emergency response. In this study, we mainly try to incorporate and examine these two important elements in the BN framework of emergency response for underground flooding. For the better application of this BN framework to the emergency decision-making on specific flooding cases or other accidents, we can extend the “Feedback” node to a couple of nodes to combine specific information of the different type of accident evolution and then refine the rescue strategies and measures, which can provide more technical support for decision-making for emergency response.

5. Conclusions

In this study, taking advantage of the Delphi method to examine the expert knowledge for determining the conditional probabilities, a Bayesian network model for rapid assessments of underground flood is established considering more dynamic information during the flood evolution process. Given evidences to some “parent” nodes, like ‘‘Precipitation intensity”, “Flood control measures”, and “Threatened persons”, the probability distribution of typical flood scenarios are estimated and analyzed, and the influence of feedback information on emergency response is examined. The major conclusions are:
(a) Based on comprehensive analysis of some typical flooding cases in urban underground spaces (especially the flooding in subway stations) and further evaluation by expert experience, eleven/seventeen BN nodes for representing the underground flooding from causes to consequences were determined.
(b) The causing factors (precipitation or dike/dam break) and flood occurrence time significantly affect the damage condition of underground facilities and casualties.
(c) Feedback information acquired from flooding onsite can greatly raise (66.9%) the inference accuracy of the assessment of flood severity, which is really helpful for adjusting emergency response strategies.
The proposed BN-based framework can facilitate rapidly predicting the underground flood evolution process and identifying the critical influencing factors of the flood disaster, which is helpful to achieve “Scenario-Response”-based flood emergency decision-making. However, so far due to the scarcity of historical data and the lack of detailed description of underground flood, the application of this framework to real-life flood events has not been comprehensively verified. In the future, with more emerging underground flood cases, the proposed framework concerning on the BN node variables and their conditional probability tables could be effectively optimized and the accuracy and applicability of this framework to real-life flood disasters can be improved.

Author Contributions

For research articles with several authors, a short paragraph specifying their individual contributions must be provided. The following statements should be used “Conceptualization, J.W. and W.F.; Methodology, J.W.; Software, W.F.; Formal Analysis, J.W.; Investigation, W.F. and Z.H.; Data Curation, B.H.; Writing-Original Draft Preparation, W.F., Z.H. and J.W.; Writing-Review & Editing, J.W.; Supervision, J.W.; Funding Acquisition, J.W.

Funding

This research was funded by National Natural Science Foundation of China grant number [11502283], National Key Research and Development Program of China grant number [2017YFC0805001] and the Yue Qi Young Scholar Program of China University of Mining & Technology, Beijing.

Acknowledgments

Great gratitude is extended to the experts for their opinion on the BN building.

Conflicts of Interest

The authors declare no conflict of interest.

References

  1. Wang, K.; Wang, L.; Wei, Y.M. Beijing storm of July 21, 2012: Observations and reflections. Nat. Hazards 2013, 67, 969–974. [Google Scholar] [CrossRef]
  2. Box, P.; Thomalla, F.; Robin, V.D.H. Flood Risk in Australia: Whose Responsibility Is It, Anyway? Water 2013, 5, 1580–1597. [Google Scholar] [CrossRef] [Green Version]
  3. Joo, J.; Lee, J.; Kim, J.H.; Jun, H.; Jo, D. Inter-event time definition setting procedure for urban drainage systems. Water 2013, 6, 45–58. [Google Scholar] [CrossRef]
  4. Su, B.N.; Huang, H.; Zhang, N. Dynamic urban waterlogging risk assessment method based on scenario simulations. Sci. Technol. 2015, 55, 684–690. [Google Scholar]
  5. Onyutha, C.; Willems, P. Uncertainties in Flow-Duration-Frequency Relationships of High and Low Flow Extremes in Lake Victoria Basin. Water 2013, 5, 1561–1579. [Google Scholar] [CrossRef] [Green Version]
  6. Webster, T.; Mcguigan, K.; Collins, K.; Macdonald, C. Integrated River and Coastal Hydrodynamic Flood Risk Mapping of the LaHave River Estuary and Town of Bridgewater, Nova Scotia, Canada. Water 2014, 6, 517–546. [Google Scholar] [CrossRef] [Green Version]
  7. Zachos, L.G.; Swann, C.T.; Altinakar, M.S. Flood vulnerability indices and emergency management planning in the Yazoo Basin, Mississippi. Int. J. Disaster Risk Reduct. 2016, 18, 89–99. [Google Scholar] [CrossRef]
  8. Schnebele, E.; Cervone, G.; Kumar, S.; Waters, N. Real time estimation of the calgary floods using limited remote sensing data. Water 2014, 6, 381–398. [Google Scholar] [CrossRef]
  9. Morita, M. Flood Risk Impact Factor for Comparatively Evaluating the Main Causes that Contribute to Flood Risk in Urban Drainage Areas. Water 2014, 6, 253–270. [Google Scholar] [CrossRef] [Green Version]
  10. Assani, A.; Landry, R.; Labrèche, M.; Frenette, J.J.; Gratton, D. Temporal Variability of Monthly Daily Extreme Water Levels in the St. Lawrence River at the Sorel Station from 1912 to 2010. Water 2014, 6, 196–212. [Google Scholar] [CrossRef] [Green Version]
  11. Keast, D.; Ellison, J. Magnitude Frequency Analysis of Small Floods Using the Annual and Partial Series. Water 2014, 5, 1816–1829. [Google Scholar] [CrossRef]
  12. Su, B.N.; Huang, H.; Li, Y.T. Integrated simulation method for waterlogging and traffic congestion under urban rainstorms. Nat. Hazards 2016, 81, 23–40. [Google Scholar] [CrossRef]
  13. Sörensen, J.; Persson, A.; Sternudd, C.; Aspegren, H.; Nilsson, J.; Nordström, J.; Jönsson, K.; Mottaghi, M.; Becker, P.; Pilesjö, P.; et al. Re-thinking urban flood management—Time for a regime shift. Water 2016, 8, 332. [Google Scholar] [CrossRef]
  14. Guerreiro, S.B.; Glenis, V.; Dawson, R.J.; Kilsby, C. Pluvial flooding in European cities—A continental approach to urban flood modeling. Water 2017, 9, 296. [Google Scholar] [CrossRef]
  15. Wang, X.; Chen, W.; Zhou, Z.; Zhu, Y.S.; Wang, C.; Liu, Z. Three-dimensional flood routing of a dam break based on a high-precision digital model of a dense urban area. Nat. Hazards 2017, 86, 1–28. [Google Scholar] [CrossRef]
  16. Lyu, H.; Ni, G.H.; Cao, X.J.; Ma, Y.; Tian, F.Q. Effect of temporal resolution of rainfall on simulation of urban flood processes. Water 2018, 10, 880. [Google Scholar] [CrossRef]
  17. Wu, J.S.; Xu, S.D.; Zhang, H. A review of experimental and numerical simulation studies on flooding in urban underground spaces. China Saf. Sci. J. 2016, 26, 1–6. [Google Scholar]
  18. Ishigaki, T.; Toda, K.; Baba, Y. Experimental study on evacuation from underground space by using real size models. Disaster Prev. Res. Inst. Annu. 2005, 48, 639–646. (In Japanese) [Google Scholar] [CrossRef]
  19. Baba, Y.; Ishigaki, T.; Toda, K. Experimental studies on difficulty of evacuation from underground spaces under inundation situations using real scale models. J. Jpn. Soc. Civ. Eng. 2011, 67, 12–27. [Google Scholar]
  20. Toda, K.; Ishigaki, T.; Baba, Y. Educational activities for urban flood damage reduction using unique facilities. Floods 2013, 357, 135–142. [Google Scholar]
  21. Shao, W.Y.; Jiang, L.J.; Zhang, Y.P. Hydraulic features of air-water mixture flow on a staircase with rest platforms. J. Hydraul. Eng. 2014, 140, 1–9. [Google Scholar] [CrossRef]
  22. Toda, K.; Oyagi, R.; Inoue, K. On the inundation process in the underground space in urban flooding. Disaster Prev. Res. Inst. Annu. 2004, 47, 293–302. [Google Scholar]
  23. Toda, K.; Kawaike, K.; Yoneyama, N. Underground inundation analysis by integrated urban flood model. In Advances in Water Resources and Hydraulic Engineering; Springer: Berlin, Germany, 2009; pp. 166–171. [Google Scholar]
  24. Sekine, M.; Furuki, Y.; Sekine, T. Numerical Simulation of Inundation in Urban Area of Tokyo and Underground Space. J. Jpn. Soc. Civ. Eng. 2015, 71, 1435–1440. [Google Scholar] [CrossRef]
  25. Son, A.L.; Kim, B.Y.; Han, K.Y. A simple and robust method for simultaneous consideration of overland and underground space in urban flood modeling. Water 2016, 8, 494. [Google Scholar] [CrossRef]
  26. Ishigaki, T.; Kawanaka, R.; Ozaki, T. Vulnerability to underground inundation and evacuation in densely urbanized area. J. Disaster Res. 2016, 11, 298–305. [Google Scholar] [CrossRef]
  27. Kim, H.J.; Rhee, D.S.; Song, C.G. Numerical computation of underground inundation in multiple layers using the adaptive transfer method. Water 2018, 10, 85. [Google Scholar] [CrossRef]
  28. Gotoh, H.; Ikari, H.; Sakai, T. Computational mechanics of a force on a human leg in flow over an underground staircase in urban flood. Ann. J. Hydraul. Eng. 2006, 60, 865–870. [Google Scholar] [CrossRef]
  29. Wu, J.S.; Zhang, H.; Yang, R.; Dalrymple, R.A. Numerical modeling of dam-break flood in city layouts including underground spaces using GPU-based SPH Method. J. Hydrodyn. 2013, 25, 818–828. [Google Scholar] [CrossRef]
  30. Narayan, S. A Conceptual Model and Rapid Appraisal Tool for Integrated Coastal Floodplain Assessments. Ph.D. Thesis, University of Southampton, Southampton, UK, 2014. [Google Scholar]
  31. Yuan, Z.; Khakzad, N.; Khan, F.; Amyotte, P. Risk analysis of dust explosion scenarios using Bayesian networks. Risk Anal. 2015, 35, 278–291. [Google Scholar] [CrossRef] [PubMed]
  32. Peng, M.; Zhang, M. Analysis of human risks due to dam-break floods—Part 1: A new model based on Bayesian networks. Nat. Hazards 2012, 64, 903–933. [Google Scholar] [CrossRef]
  33. Pagano, A.; Giordano, R.; Portoghese, I. A Bayesian vulnerability assessment tool for drinking water mains under extreme events. Nat. Hazards 2014, 74, 2193–2227. [Google Scholar] [CrossRef]
  34. Narayan, S.; Simmonds, D.; Nicholls, R.J. A Bayesian network model for assessments of coastal inundation pathways and probabilities. J. Flood Risk Manag. 2015, 11, S233–S250. [Google Scholar] [CrossRef]
  35. Wu, J.S.; Xu, S.D.; Zhou, R.; Qin, Y.P. Scenario analysis of mine water inrush hazard using Bayesian Networks. Saf. Sci. 2016, 89, 231–239. [Google Scholar] [CrossRef]
  36. Kabir, G.; Sadiq, R.; Tesfamariam, S. A fuzzy Bayesian belief network for safety assessment of oil and gas pipelines. Struct. Infrastruct. Eng. 2016, 12, 874–889. [Google Scholar] [CrossRef]
  37. Wu, J.S.; Zhou, R.; Xu, S.D.; Wu, Z. Probabilistic analysis of natural gas pipeline network accident based on Bayesian network. J. Loss Prev. Process Ind. 2017, 46, 126–136. [Google Scholar] [CrossRef]
  38. Worrell, J.L.; Gangi, P.M.D.; Bush, A.A. Exploring the use of the Delphi method in accounting information systems research. Int. J. Account. Inf. Syst. 2013, 14, 193–208. [Google Scholar] [CrossRef]
  39. Kauko, K.; Palmroos, P. The Delphi method in forecasting financial markets—An experimental study. Int. J. Forecast. 2014, 30, 313–327. [Google Scholar] [CrossRef]
  40. Sepehr, M.; Fatemi, S.M.R.; Danehkar, A. Application of Delphi method in site selection of desalination plants. Glob. J. Environ. Sci. Manag. 2017, 3, 89–102. [Google Scholar]
  41. Strand, J.; Carson, R.T.; Navrud, S. Using the Delphi method to value protection of the Amazon rainforest. Ecol. Econ. 2017, 131, 475–484. [Google Scholar] [CrossRef]
  42. Zangenehmadar, Z.; Moselhi, O. Prioritizing deterioration factors of water pipelines using Delphi method. Measurement 2016, 90, 491–499. [Google Scholar] [CrossRef]
  43. Takahashi, T.; Nakagqwa, H.; Nomura, I. Simulation method on inundation in an underground space due to intrusion of overland flood flows. Disaster Prev. Res. Inst. Annu. 1990, 33, 427–442. [Google Scholar]
  44. Inoue, K.; Toda, K.; Nakal, T. Simulation on the inundation process in the underground space. Annu. Rep. Prev. Res. Inst. 2003, 46, 263–273. (In Japanese) [Google Scholar]
  45. Nordgard, D.E.; Sand, K. Application of Bayesian networks for risk analysis of MV air insulated switch operation. Reliab. Eng. Syst. Saf. 2010, 95, 1358–1366. [Google Scholar] [CrossRef]
  46. Zhao, L.J.; Wang, X.L.; Qian, Y. Analysis of factors that influence hazardous material transportation accidents based on Bayesian networks: A case study in China. Saf. Sci. 2012, 50, 1049–1055. [Google Scholar] [CrossRef]
  47. Banuls, V.A.; Turoff, M.; Hiltz, S.R. Collaborative scenario modeling in emergency management through cross-impact. Technol. Forecast. Soc. 2013, 80, 1756–1774. [Google Scholar] [CrossRef]
Figure 1. Sample of Bayesian network.
Water 10 01112 g001
Figure 2. Flowchart of establishing Bayesian network.
Water 10 01112 g002
Figure 3. Bayesian network of flooding in underground space.
Water 10 01112 g003
Figure 4. Inference probability of “Casualties”.
Water 10 01112 g004
Figure 5. Inference probability of “Economic loss”.
Water 10 01112 g005
Figure 6. Inference results with pre-assessment (no dike/dam break).
Water 10 01112 g006
Figure 7. Inference results with pre-assessment (dike/dam break).
Water 10 01112 g007
Figure 8. Inference results with feedback information.
Water 10 01112 g008
Table 1. Sample of the Conditional Probabilities Tables (CPT) of X4 in Figure 1.
X2State OneState Two
X3State OneState TwoState OneState Two
X4State 10.90.70.750.65
State 20.10.30.250.35
Table 2. Classified states of Bayesian network (BN) nodes.
Bayesian NodesStates of Nodes
Dike/dam-break① Nonoccurrence
② Occurrence
Precipitation intensity① Less than 50 mm/24 h
② 50 mm/24 h to 100 mm/24 h
③ More than 100 mm/24 h
Flooding entrances① One
② More than one
Flood control measures① Failure
② Effectiveness
Underground flooding charge① <0.28 m3/s/m
② ≥0.28 m3/s/m
Threatened persons① Less than 150 persons
② 150 to 300 persons
③ More than 300 persons
Staircase flow intensity① Less than 1.2 m3/s2
② More than 1.2 m3/s2
Working condition of the ventilation system① Working
② Failure/damaged to ventilation disorder
Working condition of the drainage system① Working
② Failure/damaged to weak drainage
Casualty① None
② 1 to 3 persons
③ More than 3 persons
Economic loss① Less than 1 day
② 1 to 3 days
③ More than 3 days
Table 3. Experts’ CPT scores of “Economic loss” node.
NodesExpert Opinion
Staircase Flow IntensityDrainage Systemm1m2m3m4m5m6m
L M NL M NL M NL M NL M NL M NL M N
Less than 1.2 m3/s2Working0.900 0.090 0.0100.890 0.095 0.0150.928 0.069 0.0030.895 0.100 0.0050.915 0.080 0.0050.920 0.070 0.0100.908 0.084 0.008
Less than 1.2 m3/s2Failure0.190 0.720 0.0900.204 0.735 0.0610.214 0.618 0.1680.170 0.755 0.0750.252 0.710 0.0380.230 0.680 0.0900.210 0.703 0.087
More than 1.2 m3/s2Working0.170 0.530 0.3000.128 0.750 0.1220.270 0.670 0.0600.220 0.720 0.0600.100 0.750 0.1500.198 0.600 0.2020.181 0.670 0.149
More than 1.2 m3/s2Failure0.007 0.570 0.4230.005 0.600 0.3950.004 0.478 0.5180.010 0.560 0.4300.010 0.550 0.4400.006 0.620 0.3740.007 0.563 0.430
Table 4. The setup of states combination of dike/dam-break flooding case and other comparative cases.
NodesSetup of Bayesian Nodes
Dike/dam-break① Nonoccurrence② Occurrence
Precipitation intensity① Less than 50 mm/24 h③ More than 100 mm/24 h
Table 5. Inference probabilities of dike/dam-break flooding in urban underground space and other comparative cases.
BN NodesState of BN NodesEvidences
① Less than 50 mm/24 h③ More than 100 mm/24 h
① NonoccurrenceOccurrence① Nonoccurrence② Occurrence
Flood control measures① Failure0.1090.1090.1090.109
② Effectiveness0.8910.8910.8910.891
Flooding entrances① One0.9240.4120.6880.077
② More than one0.0760.5880.3120.923
Underground flooding charge① <0.28 m3/s/m0.9100.3690.5740.002
② ≥0.28 m3/s/m0.0900.6310.4260.998
Threatened persons① Less than 150 persons0.1790.1790.1790.179
② 150 to 300 persons0.6640.6640.6640.664
③ More than 300 persons0.1570.1570.1570.157
Staircase flow intensity① <1.2 m3/s20.8540.3730.5550.046
② ≥1.2 m3/s20.1460.6270.4450.954
Ventilation system① Working0.7930.3680.5290.078
② Failure0.2070.6320.4710.922
Drainage system① Working0.7150.3260.4740.061
② Failure0.2850.6740.5260.939
Casualties① None0.8000.4790.6010.261
② 1 to 3 persons0.1330.3140.2450.437
③ More than 3 persons0.0670.2070.1540.302
Economic loss① Less than 1 day0.6540.2820.4230.029
② 1 to 3 days0.2730.4410.3770.556
③ More than 3 days0.0730.2770.2000.415
Table 6. Given state evidences of some BN nodes.
ScenarioStates of Bayesian Nodes
Flood Control MeasuresThreatened PersonsPrecipitation IntensityDike/Dam-Break
1① Failure① Less than 150 persons③ More than 100 mm/24 h① Nonoccurrence
2① Failure② 150 to 300 persons③ More than 100 mm/24 h① Nonoccurrence
3① Failure③ More than 300 persons③ More than 100 mm/24 h① Nonoccurrence
4② Effectiveness① Less than 150 persons③ More than 100 mm/24 h① Nonoccurrence
5② Effectiveness② 150 to 300 persons③ More than 100 mm/24 h① Nonoccurrence
6② Effectiveness③ More than 300 persons③ More than 100 mm/24 h① Nonoccurrence
Table 7. Given state evidences of some BN nodes.
ScenarioStates of Bayesian Nodes
Precipitation IntensityDike/Dam-BreakFlood Control Measures
1② 50 mm/24 h to 100 mm/24 h① Nonoccurrence② Effectiveness
2② 50 mm/24 h to 100 mm/24 h② Occurrence① Failure

