1. Introduction
Hydrological studies are based on a set of hydrometric and meteorological data that must be measured directly in the field with a precision suitable for the intended purposes [
1]. One type of such data consists of flow records, which prove indispensable since effective management of water resources requires precise flow measurements [
2].
Streamflow magnitude is determined directly by flow measurements. Among the various flow measurement methods, the most commonly used in both shallow and deep rivers is the area-velocity method since it is a precise method that is simple to carry out in the field [
3]. Streamflow is calculated as the product of area and velocity. The measurement is made by subdividing the cross-section of the flow into segments (known as subsections, verticals, or partial areas) through the measurement of depth, width, and velocity within each vertical. The total streamflow is the sum of the products of the partial areas of the cross-section and their respective average velocities [
4].
USGS [
5] recommendations indicate that the spacing of the verticals should provide between 25 and 30 subsections. They should be spaced such that no subsection has more than 10% of the total streamflow. The ideal measurement is one in which a subsection has at most 5% of the total streamflow, but this is rarely achieved with 25 subsections [
5].
According to the USGS [
4], velocity observations in each vertical must consist of measurements of at least 40 s and, in the case of mechanical current-meters, they must be between 40 and 70 s. The measurement points at each vertical vary by depth (
Table 1) with the following methods used for wading measurements: (i) One-point method: a velocity measurement must be made at 0.6 H with H representing depth, which is measured from the water surface to the river bottom. In this case, the measured velocity represents the average velocity of the water column and is assumed to be representative of the subsection, (ii) Two-point method: observations are made in the vertical at 0.2 and 0.8 H and the average velocity in the vertical is determined by calculating the arithmetic mean. This method applies to depths greater than 0.46 m and, according to the USGS [
4], to current-meters such as Pygmy or ADV (Acoustic Doppler Velocimeter). In addition, if the velocity at 0.8 H is greater than the velocity at 0.2 H, or if the velocity at 0.2 H is double the velocity at 0.8 H, the measures will be deemed abnormally distributed velocities and the three-point method will be recommended [
4]. (iii) Three-point method: this method applies when velocity is seriously affected by friction or turbulence produced by the streambed or an obstruction in the stream. The average velocity of the subsection is calculated, according to the equation indicated in
Table 1. Velocities must be measured at 0.2, 0.6, and 0.8 H (from the water surface). This method only applies when river or canal depths are greater than 0.46 m [
4].
Depending on the regulations for carrying out flow measurements and point velocity measurement time (VMT), developing flow measurements may be a very extensive task. To simplify it without sacrificing precision or the quality of the results, electronic devices have been developed that simplify the data acquisition process and improve data precision, but measurement times and field resource expenses can still be optimized. Therefore, optimization of the different stages of the flow measurement process is aimed at reducing both the resources needed and the risk associated with measurement.
Techniques to quantify uncertainty in streamflow data have made up an increasingly important area in hydrological research [
6] since data reliability depends on uncertainty in the data and the calculation method [
7]. Moreover, flow data affects subsequent water resources management. Therefore, inadequate attention to aspects such as data quality and streamflow record uncertainty when making decisions could lead to unsatisfactory results [
8].
A few studies aimed at improving streamflow data quality and uncertainty while optimizing the measurement process have been carried out. For example, Coxon et al. [
9] studied the streamflow uncertainty at gauging stations to provide a streamflow benchmark in England and Wales. Saldías [
10] automated data acquisition and processing to improve efficiency in these areas. Helmbrecht et al. [
11] and Fernández et al. [
3] studied streamflow uncertainty based on the ISO standard 748 [
12]. However, the point VMT for flow measurements have not yet been reduced or optimized.
Beven and Binley [
13] developed a methodology for the estimation of uncertainty associated with a hydrological model. Its use was demonstrated by an application to a runoff dataset from the Gwy experimental catchment of the Institute of Hydrology in Plynlimon, mid-Wales. This method, called the Generalized Likelihood Uncertainty Estimation (GLUE), represents an extension of the generalized sensitivity analysis published by Hornberger and Spear [
14] and Spear et al. [
15]. It involves randomly choosing several model parameter sets with the possibility of carrying out various simulations that can represent reality. The objective of the GLUE methodology is to produce a set of values that adequately reflect the uncertainty resulting from the modeling process and that reproduce the observed behavior within a range of feasible results [
16]. GLUE has been used in the calibration and analysis of the predictive capacity of models of solute transport in a river [
17] in the analysis of parameter uncertainty in hydrological and sediment modeling [
18] and in the study of hydrological model behavior [
19] among other areas. Therefore, it appears to be adequate for use in this study to calculate the uncertainty associated with flow measurements for different point VMTs and, thereby, define an optimal measurement time.
This study aims to determine the optimal point VMT for flow measurements in order to reduce the total time needed for the process. To this end, a stability criterion of variation of the uncertainty bands (estimated using GLUE) is used. In addition, since the objective of the study is to estimate the optimal time for point velocity measurements, a single, broad method for the flow measurement (i.e., the USGS, 2010 area-velocity method) method is used.
3. Methods
For a flow measurement calculation, the geometric characteristics of the river section are required and the velocity must be measured at different depths. The velocity that is used for the calculation corresponds to the arithmetic mean of the time series of velocities measured at each point. To calculate uncertainty following GLUE methodology, it was assumed that each instantaneous velocity measurement (measurements are carried every one second) corresponds to a random representative value at each recording point. Subsequently, the area-velocity method is used to calculate the total streamflow of the flow measurement. Simulation of this process at different measurement times gives different streamflow results. To obtain the uncertainty that adequately reflects the flow measurement, the process is carried out repeatedly by generating all the potential results and, therefore, uncertainty bands.
To determine the total streamflow of a river cross-section, the area-velocity method was used as a basis for this study. In this method, the streamflow of a subsection is the product of the area and its average velocity. At the same time, the total streamflow is the sum of the stream-flows of all of the subsections. The present study aims to determine the optimum average VMT for a flow measurement using the point measurement method [
5], which is an established and widely used method.
The GLUE methodology rejects the notion of only one optimal solution and adopts the concept of the model, parameter, and variable equifinality [
13]. Equifinality stems from the imperfect knowledge of the system under consideration. Therefore, different sets of models, parameters, and/or variables have some probability of certainty to correctly represent a system. The GLUE methodology aims to find possible sets of models, parameters, and/or variables that represent an observed natural process in an equivalent manner. Therefore, when there are different equivalent representations of a system, the uncertainty of the representation is obtained.
Considering that the average VMT is one of the main variables that would allow flow measurement times to be reduced, this study focuses on determining the optimum measurement time at each point and, thereby, reducing the total time needed for a flow measurement. To this end, the methodology of this study considers the velocity at each flow measurement point as a set of independent variables that compose a random sample of velocity.
In the flow calculation and uncertainty estimation procedure, average velocities at each flow measurement point for different measurement times from 1 to 70 s (or instant measurements) were calculated. For example, one random value was extracted from the velocity sample when the measurement time was 1 s. Likewise, for a measurement time of 2 s, two random values were used to calculate the average velocity until 70 s of average velocity measurements were completed at each gauging point. Subsequently, the mean velocity for each vertical was calculated according to the USGS [
5] criteria described in
Table 1 and the total streamflow of each flow measurement was calculated using the area-velocity method. The random extraction of velocity values was carried out with a uniform probability distribution.
To create the uncertainty surface or region, the Monte Carlo method was used, which consists of carrying out “n” experiments with randomly chosen variables. This results in a set of possible results, which make up the uncertainty bands. In this study, 50,000 streamflow simulations at different VMTs for each flow measurement section were carried out. In the subsequent analysis of them, the extremes of the possible results (5% highest and lowest) were discarded and the remaining results were defined as the uncertainty bands.
Field records were obtained according to the recommendations of the USGS [
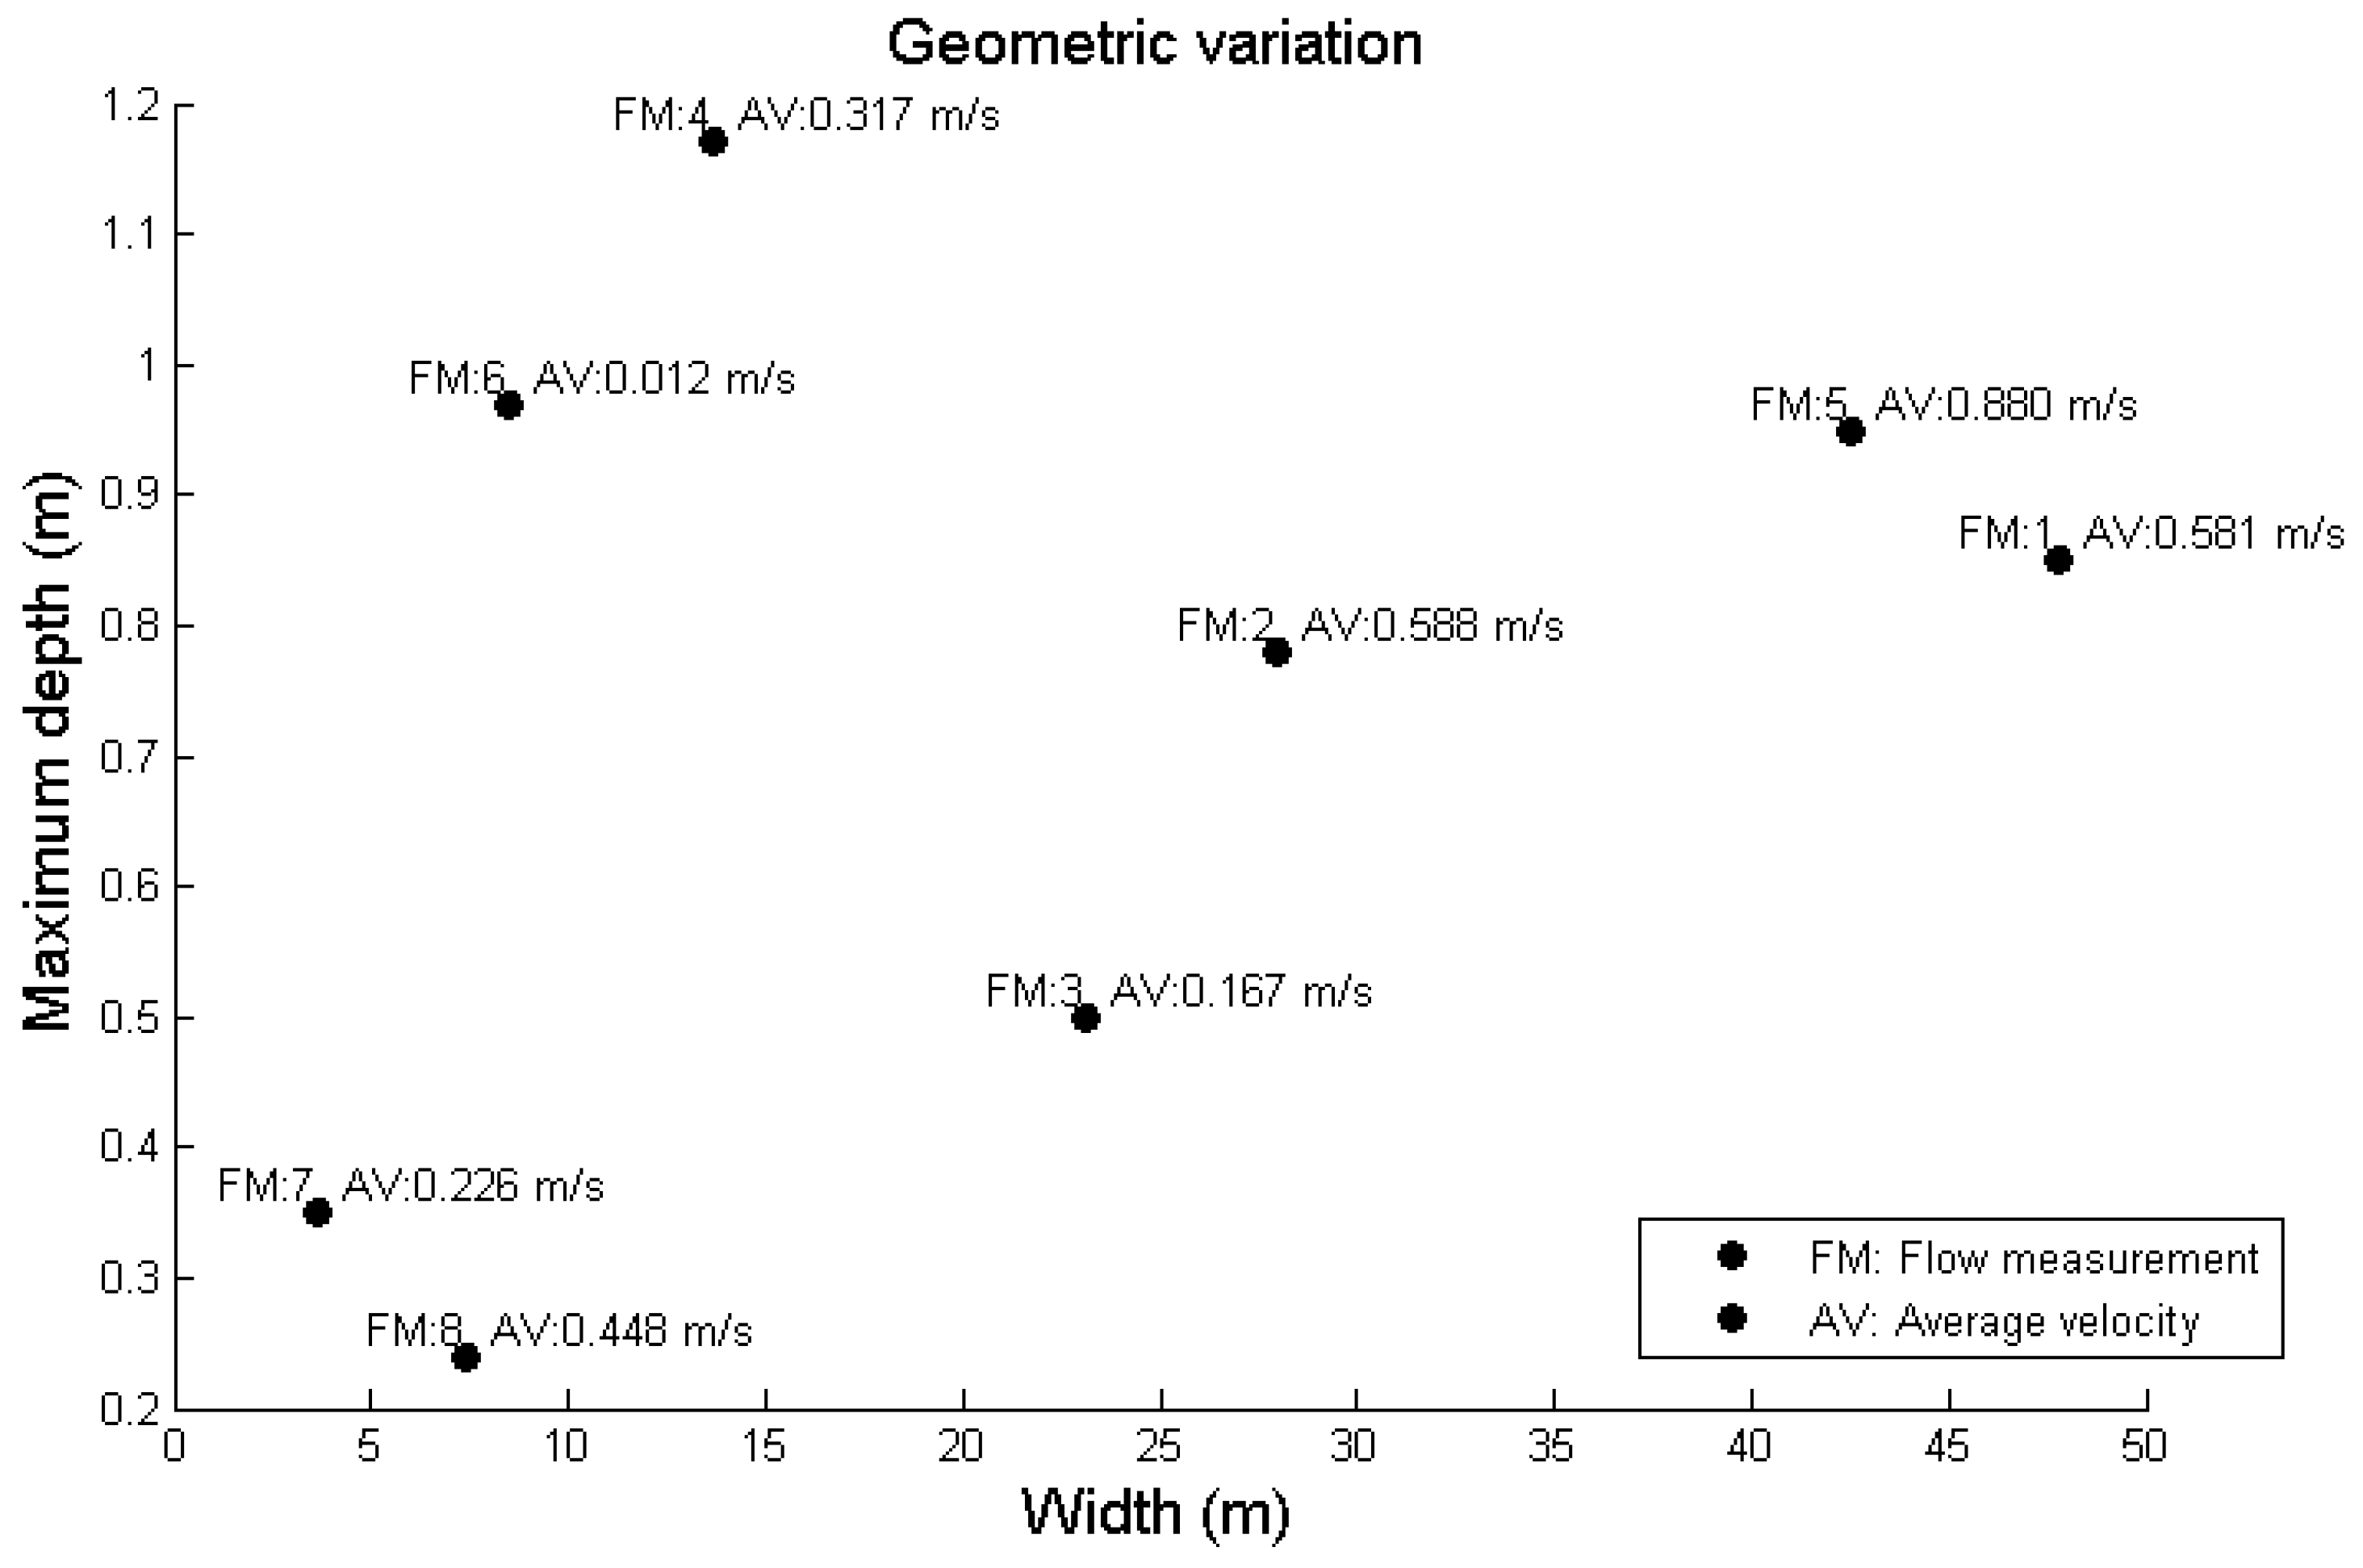
4]. A flow measurement selection criterion consisting of shallow rivers with depths of less than 1.6 m was established. Eight flow measurements were carried out with 26 verticals per gauging point. The geometry of each section and associated vertical was recorded. Then the instantaneous velocity for each second of measurement was recorded over a total time of 120 s. Therefore, a sample with 120 random instantaneous velocity records was obtained for each velocity measurement point, which allowed for the sample size to be considered wide, representative, and sufficient for obtaining random values for use with the GLUE method.
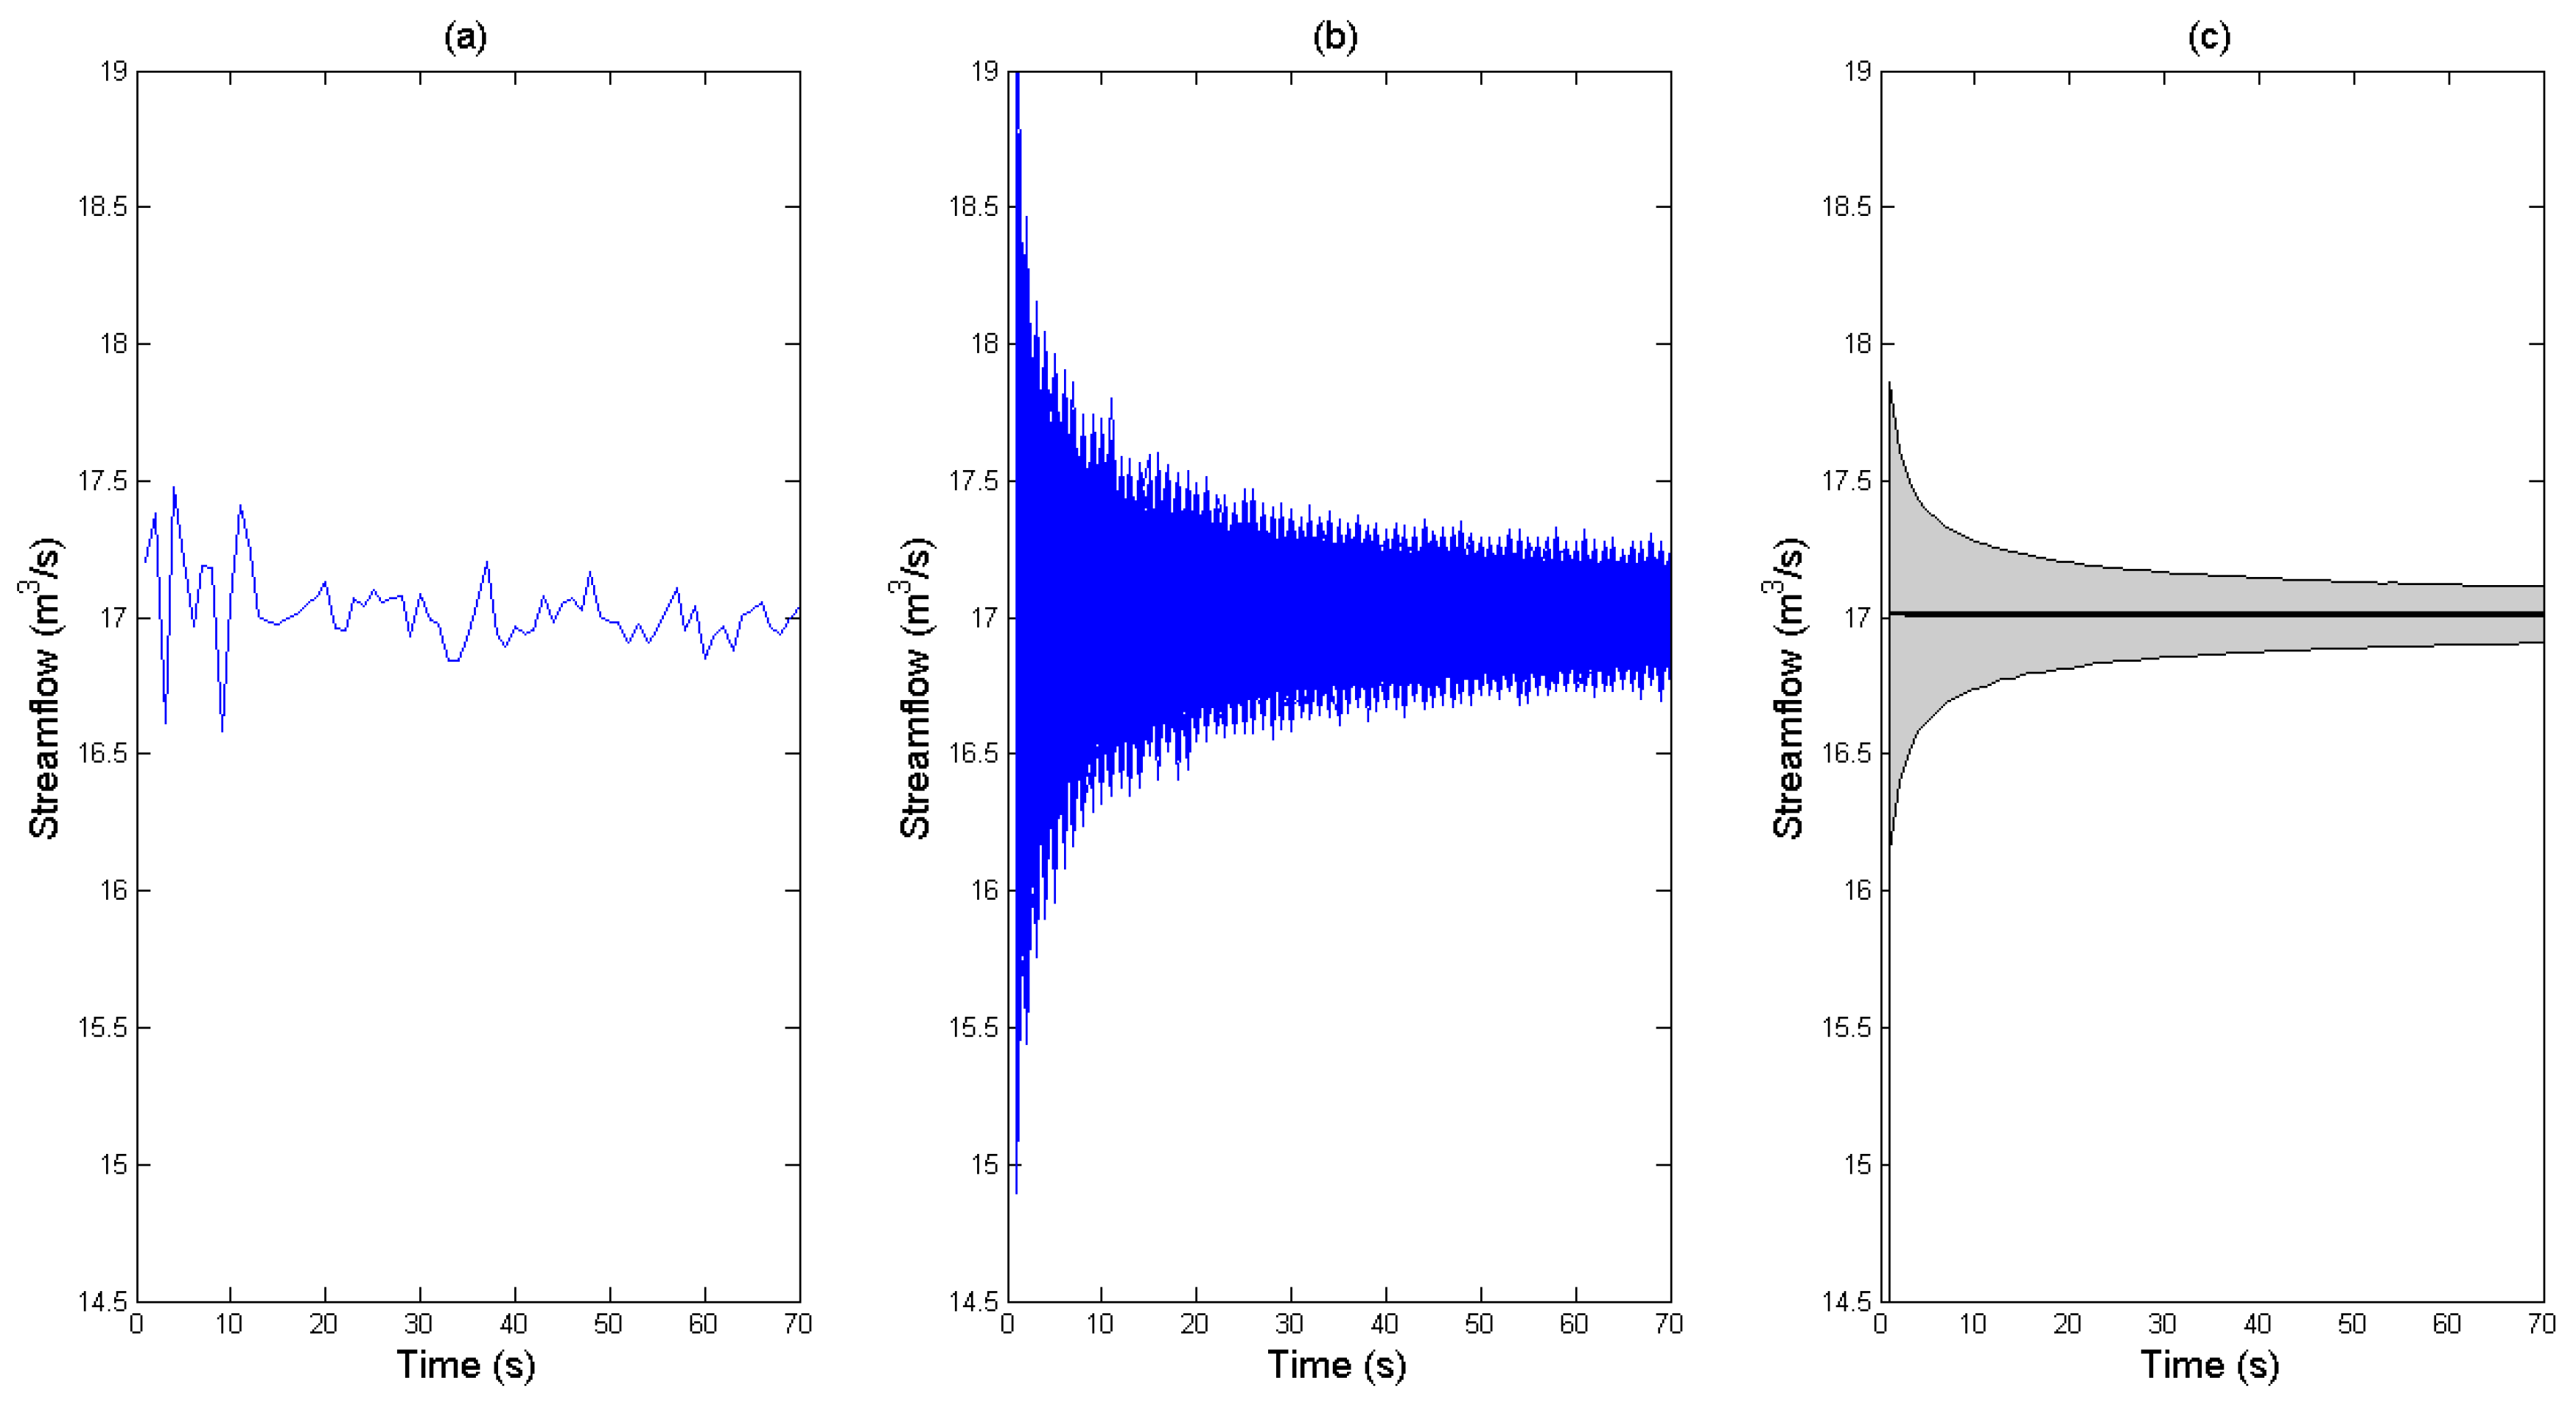
Figure 3 shows a scheme of the results obtained for the flow measurement made at Gauge 1.
Figure 3a shows a streamflow simulation with different times for the calculation of average velocity per subsection.
Figure 3b shows 50,000 simulations of the same streamflow for different measurement times and
Figure 3c shows the flow measurement uncertainty bands and their average, which is represented by the solid black line.
A Valeport 801 electromagnetic flow meter was used for the velocity field measurements. This device has a precision of ±0.5%. Electromagnetic meters are suitable for point velocity measurements and have the advantage of having no moving parts, which eliminates uncertainty due to friction and resistance [
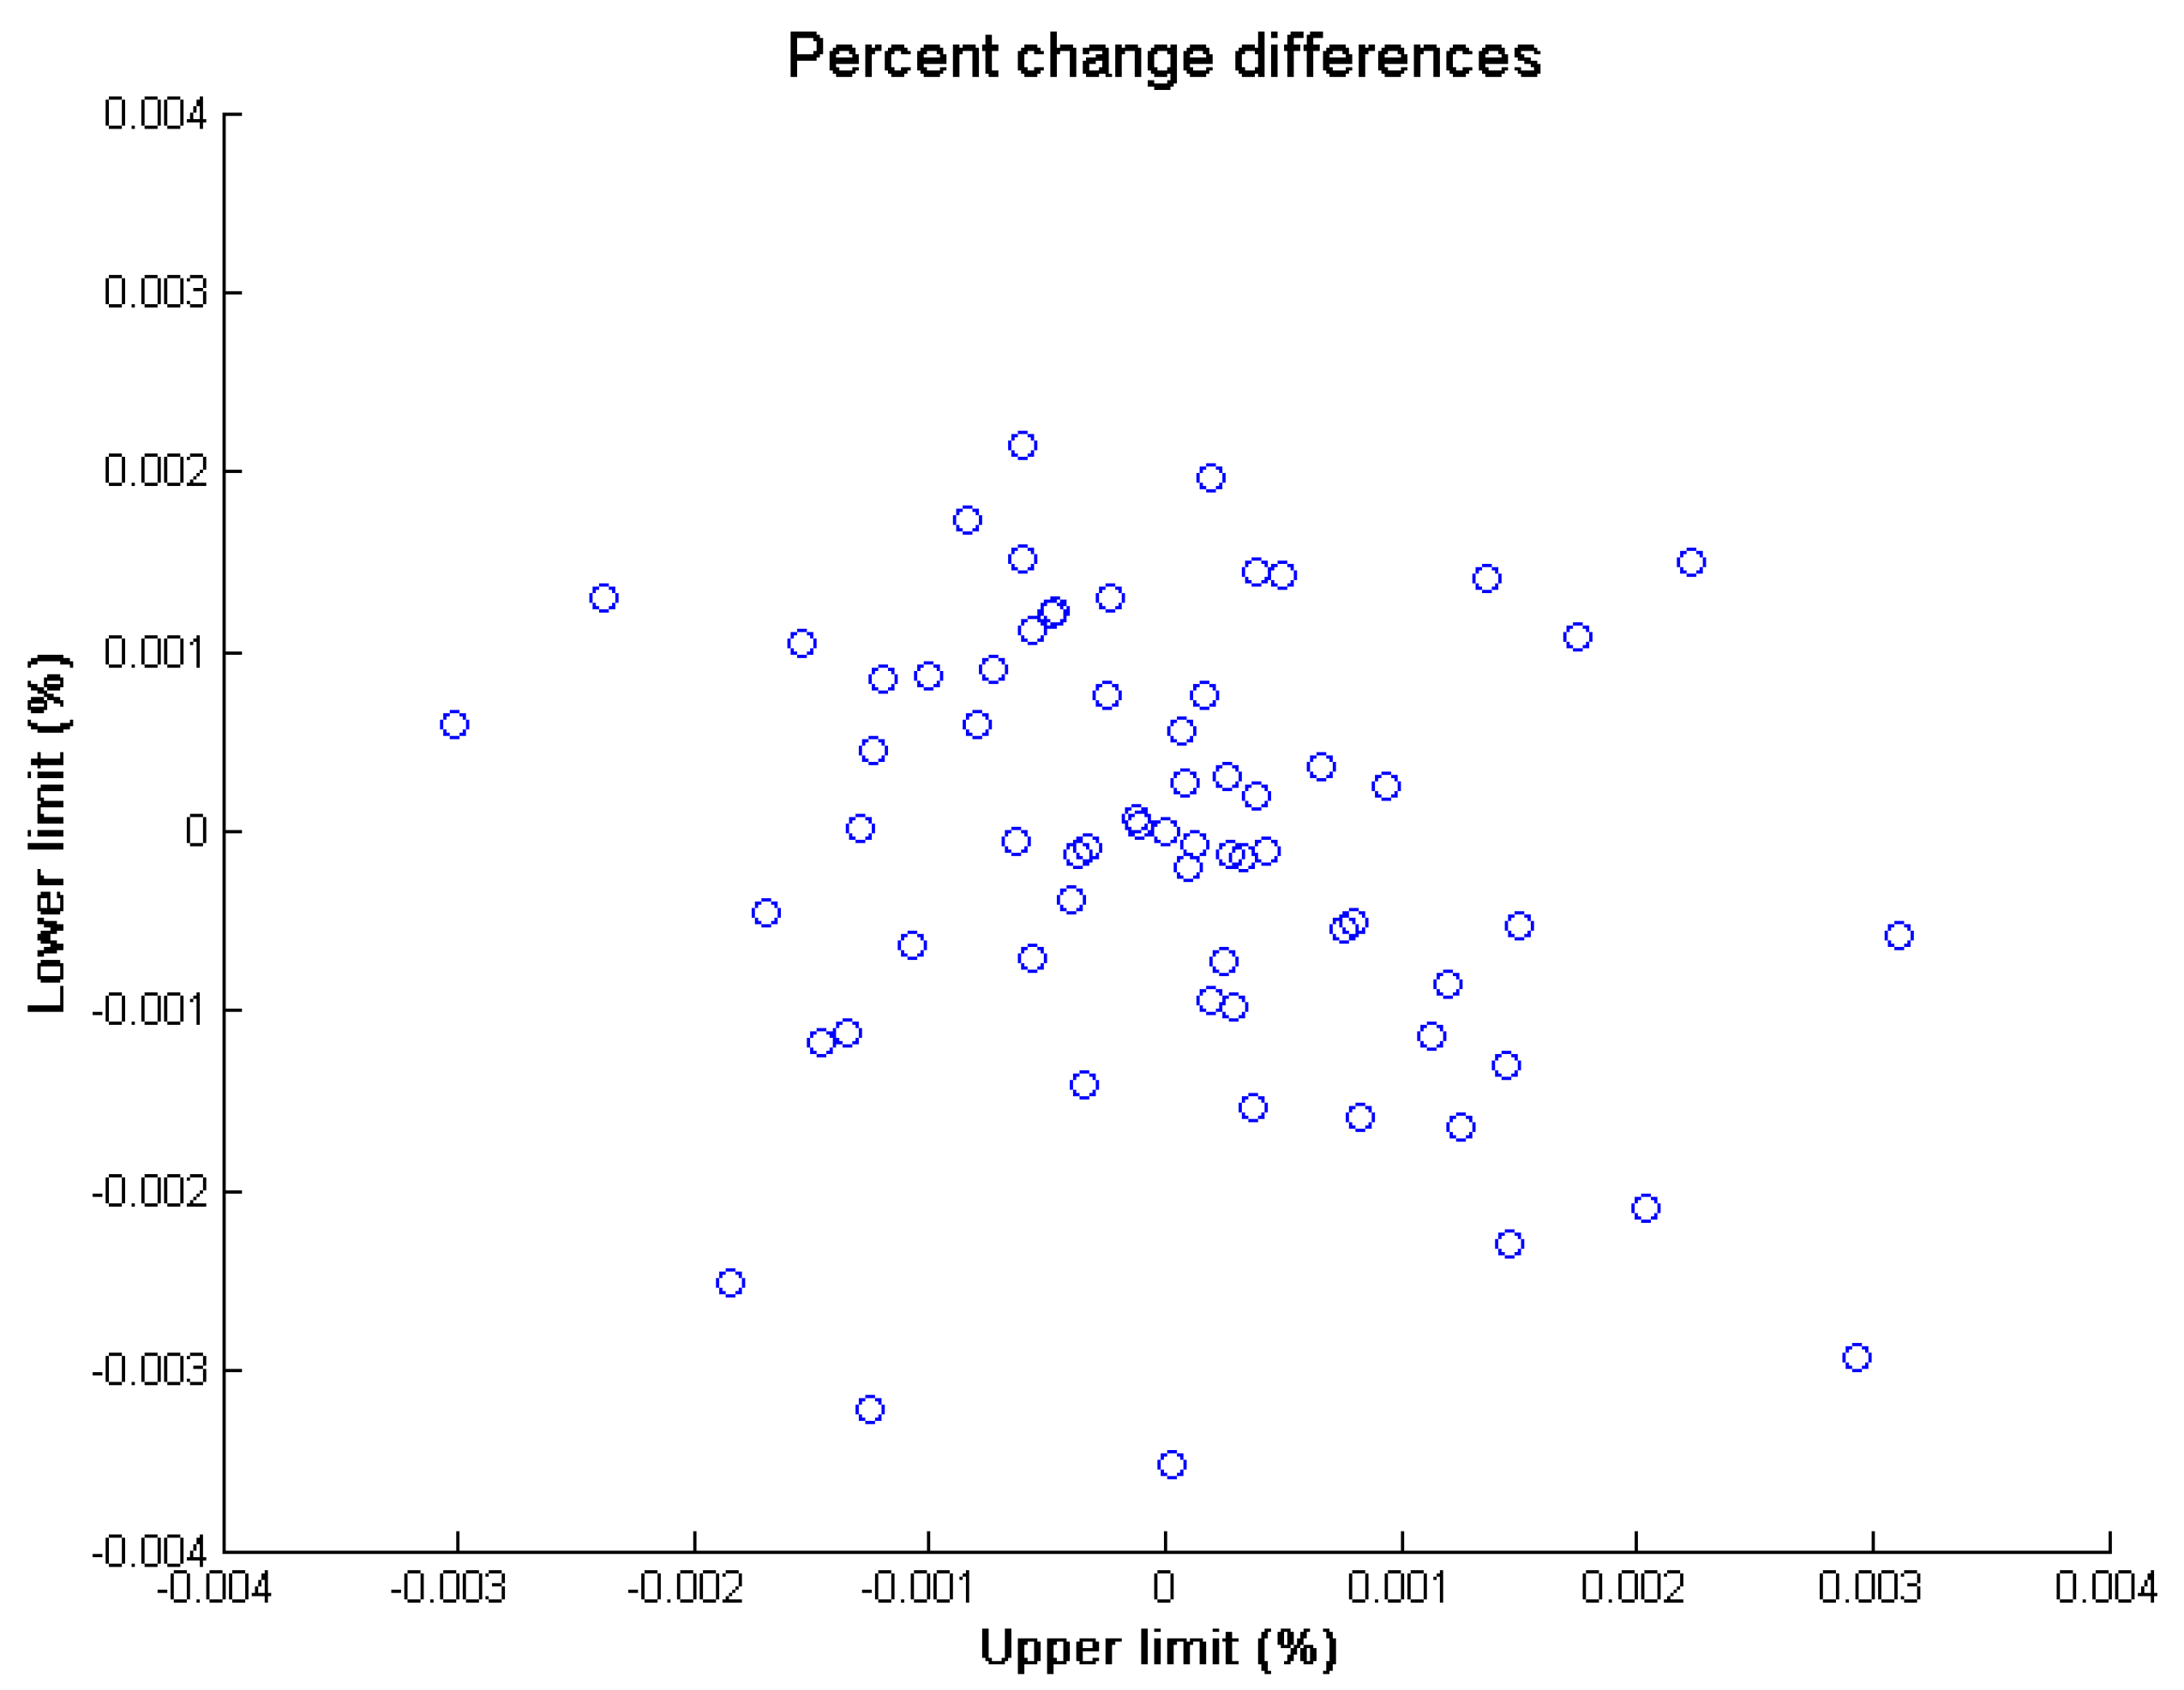
12]. To analyze the effect of instrument precision on the calculation of the uncertainty bands, an error factor that varied randomly within the precision range of the device (between 0.995 and 1.005, which corresponds to an instrumental error of ±0.5%) was used. Each velocity value used in the calculation of the uncertainty bands was multiplied by a randomly chosen error factor with uniform distribution within the precision range. Then, in order to analyze the influence of the instrumental error on the uncertainty bands, the percent change values of the upper and lower uncertainty bands for each gauge were compared. The results for Gauge 1 are shown in
Figure 4.
Figure 4 shows that the dispersion does not exhibit trends and its differences are less than 0.004%, which demonstrates that the effect of the precision of the device on the uncertainty calculation is negligible. Therefore, it was not considered in subsequent analyses.
To define the optimal point VMT, two criteria were used in which one is based on the uncertainty bandwidth variation over time and another is based on the stability of the upper and lower slopes of the uncertainty band. The bandwidth was considered the difference between the upper and lower bounds of the band. This width defines the range of the total streamflow results in m
3/s for the different measurement times. To determine the variation of the uncertainty bandwidth, the percent difference was calculated every second (Equation (1)) where
Hi is the bandwidth value at a given time
i.
It was established that percent differences in bandwidth variation from one second to the next of less than 5% are not significant. Therefore, lower variations were considered a stabilization criterion of the uncertainty bands and a definition criterion of optimal measurement time.
As a complement, the slopes of the upper and lower bounds of each uncertainty band were calculated for every second and their variation was assumed to be negligible for slopes of less than 1%. The uninterrupted satisfaction of both criteria during the measurement time demonstrates the stability in the width and bounds of the band. Therefore, the time at which stability of both criteria began was considered the optimal measurement time. Based on this consideration, continued measurement beyond that time was deemed to contribute neither to a more precise solution nor lower uncertainty.
Lastly, the results of the flow measurements taken in the field, their bands, bounds, and bandwidths were compared and all of the criteria defined for optimal time selection were applied. In addition, the change in uncertainty between different measurement times was analyzed and quantified.
4. Results
Uncertainty bands, the width of each and the slopes of their upper and lower bounds were obtained for the eight gauging points.
Figure 5 shows, as an example, the results of Gauge 4. In addition,
Figure 5 includes the criteria of bandwidth variation less than 5% (blue circles in
Figure 5b) and slopes of the upper and lower bounds less than 1% (blue and red circles in
Figure 5c, respectively).
Figure 5 shows that the uninterrupted percent change of less than 5% is established after 13 s. Regarding the criterion of variation of the upper and lower bounds of the uncertainty band, it is observed that the two slopes vary by less than 1% starting at six seconds. Therefore, for Gauge 4, the optimal measurement time according to both criteria is 13 s.
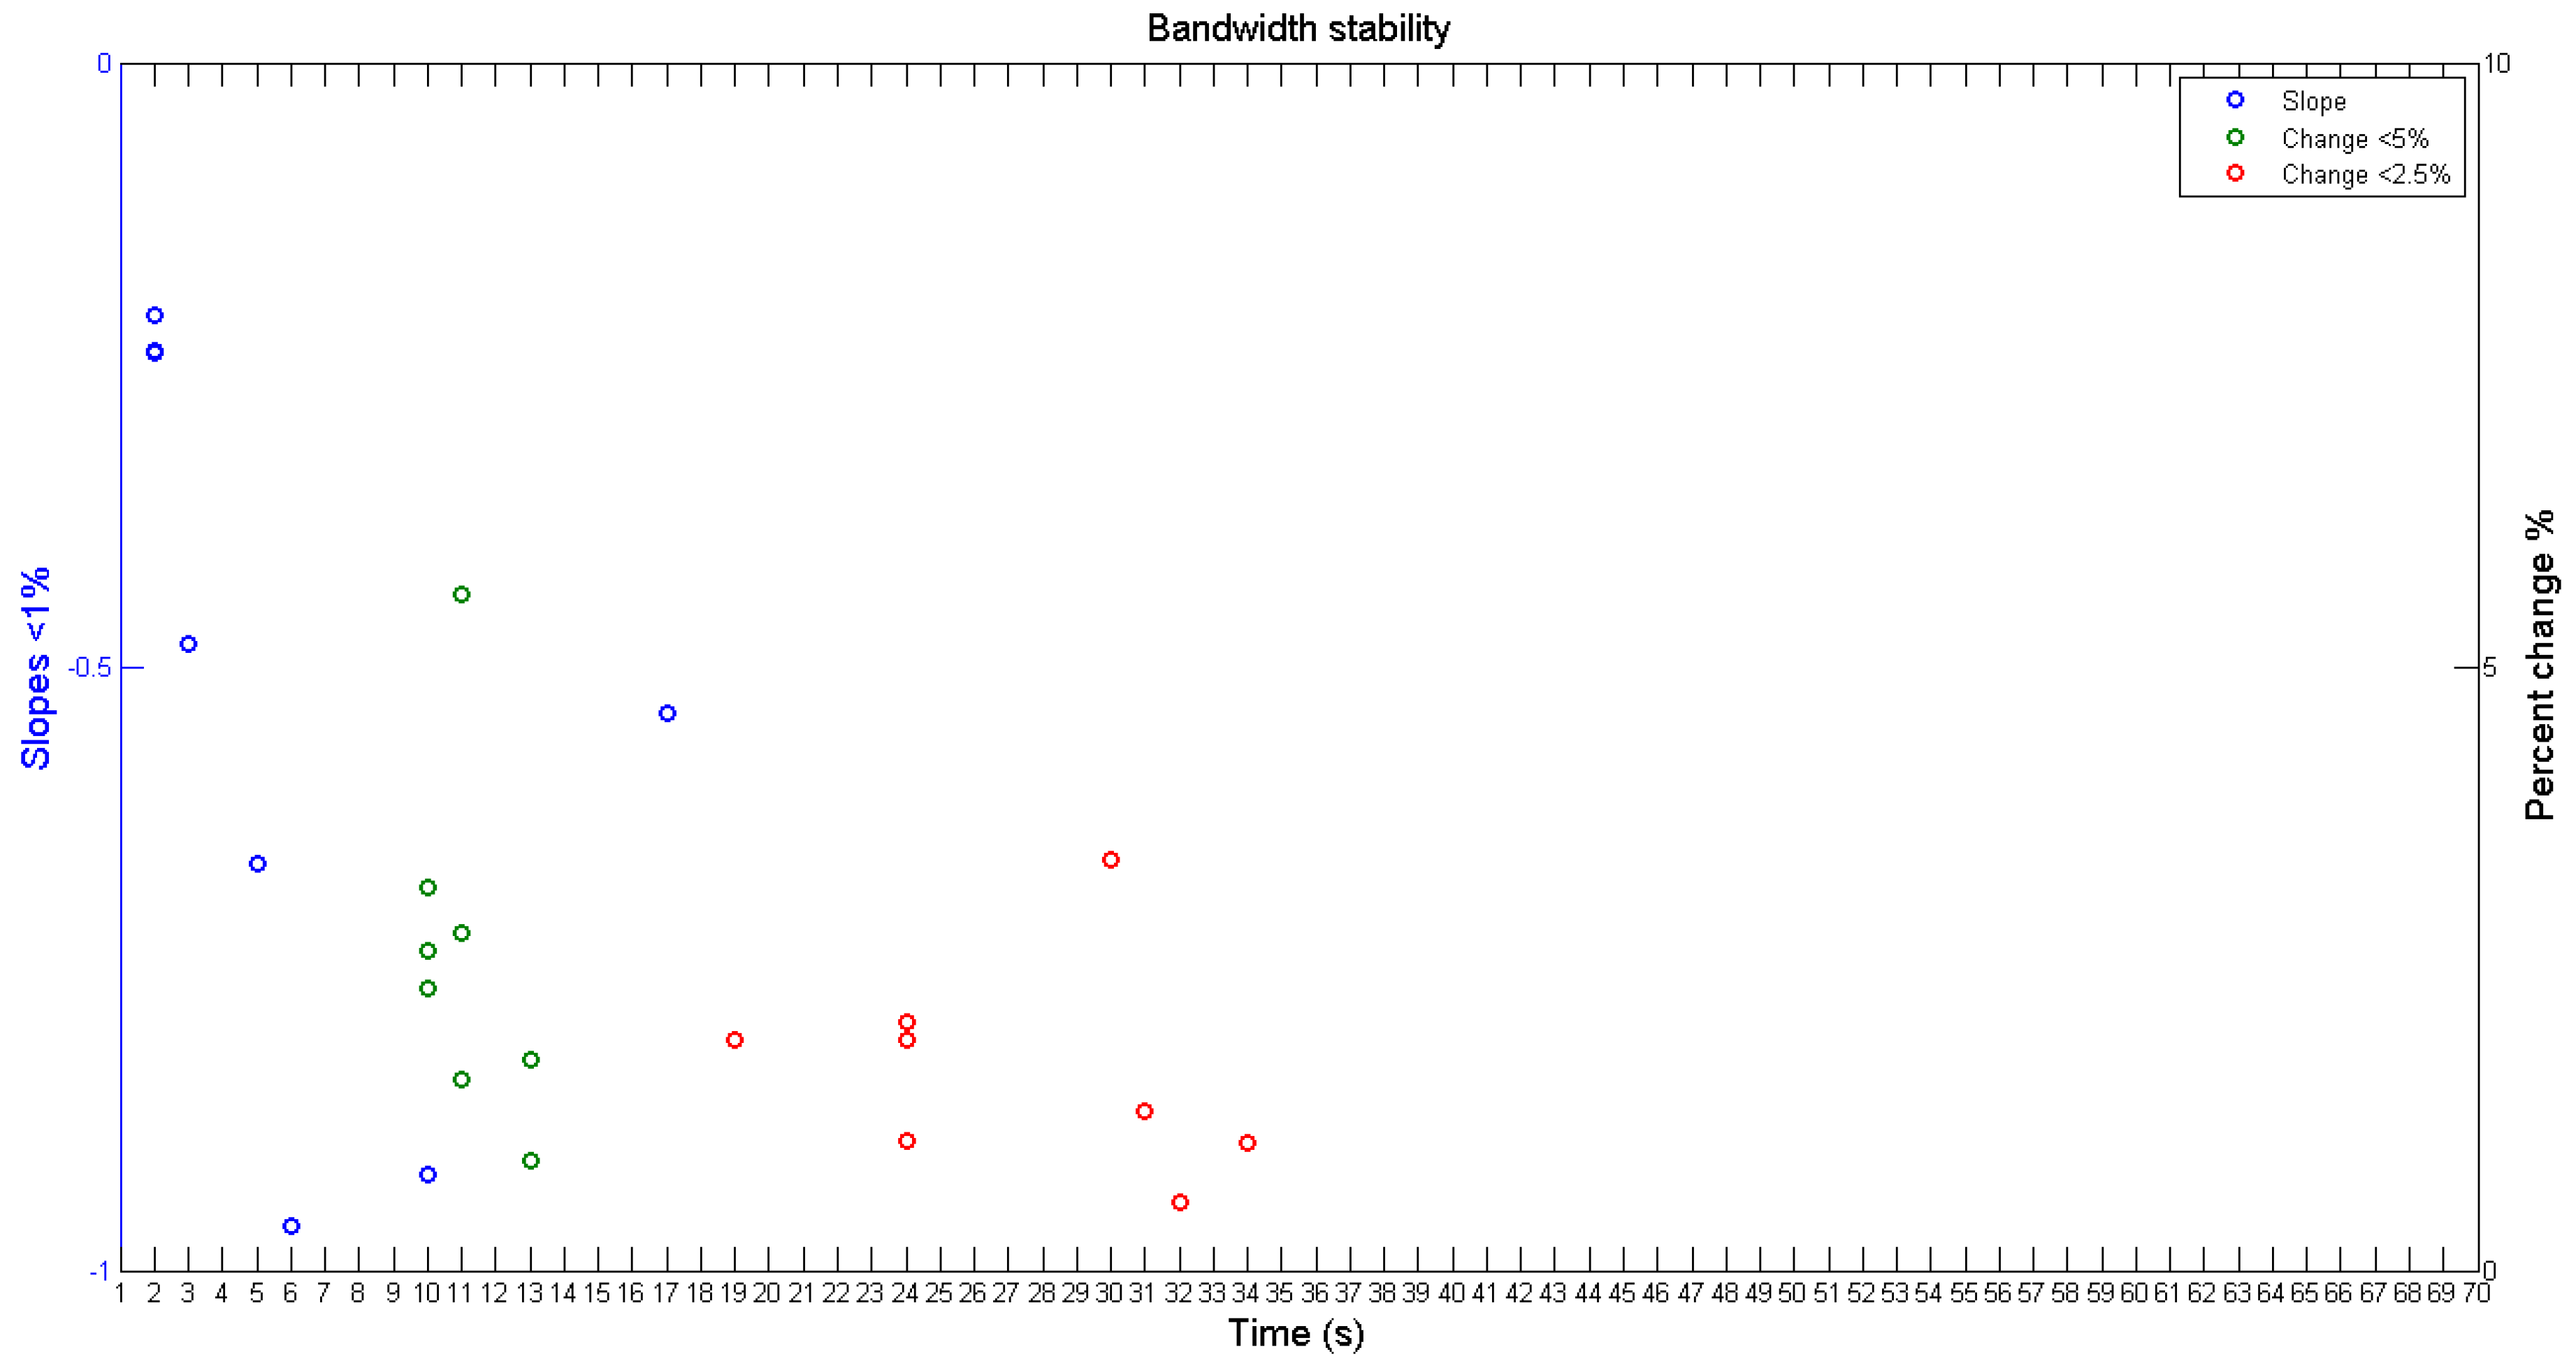
Figure 6 shows the results obtained for the eight gauging points, which indicates the time at which the criteria of the slope of less than 1% (blue circles) and percent change in bandwidth of less than 5% (green circles) are established. As a comparison, a second stability criterion for bandwidth, calculating the time at which percent change is lower than 2.5% (red circles), was added. Based on the results shown in
Figure 6, an optimal time of 17 s is obtained using the less than 5% bandwidth change criterion while 34 s is the optimal time when a 2.5% change is considered.
Given that uncertainty decreases at greater measurement times, the percent benefit of measuring for different times was calculated. To this end, the decrease in the uncertainty band from 17 to 34 s was calculated and, from 17 to 70 s, the latter is the recommended cut-off time according to USGS [
5].
Table 2 shows the obtained results.
Table 2 shows that, on average, the uncertainty bands decrease by only 0.61% and 1.05% when the VMT increases from 17 s to 34 and 70 s, respectively. Similarly, it is observed that uncertainty decreases by a maximum of 1.32% and 2.27% when measuring for 34 s and 70 s, respectively. Given that the variation in uncertainty related to measurement time is considerably low, the criterion of percent variation is less than 5%, which represents the stability of the bandwidth curve. This was chosen to define the optimal point VMT. Therefore, according to these criteria, the measurement time at which the uncertainty bands stabilize and their contribution to the quality of the results is no longer significant begins at 17 s, which can be recognized as the optimal point VMT for a flow measurement.
Based on the obtained results, a VMT of 20 s can be recommended for shallow rivers with characteristics in the range presented in this study following the flow measurement method established by the USGS [
5]. Comparing the uncertainty of flow measurements carried out for 20 s and 70 s, which is the maximum average VMT for a flow measurement point according to USGS [
5] regulations. An average reduction in uncertainty of 0.89% is obtained for the eight gauged sections with a maximum of 1.95% (obtained for Gauge 6).
Considering the criteria of slopes less than 1% and percent variation of bandwidth less than 5%, the time of stability is concentrated between 10 and 13 s with a flow measurement that meets this criterion at 17 s. In addition, the fulfillment of stability conditions considering a percent variation in bandwidth less than 2.5% for all the flow measurements is found at 34 s.


