Article

Influence of an Extended Domestic Drinking Water System on the Drinking Water Quality

by
Ljiljana Zlatanović
1,2,*,
Aleksandra Knezev
3,
Jan Peter Van der Hoek
1,2,4 and
Jan H. G. Vreeburg
5
1
Department of Water Management, Delft University of Technology, 2628 CN Delft, The Netherlands
2
Amsterdam Institute for Advanced Metropolitan Solutions, 1092 AD Amsterdam, The Netherlands
3
Het Waterlaboratorium, 2031 BE Haarlem, The Netherlands
4
Waternet, Strategic Centre, 1096 AC Amsterdam, The Netherlands
5
Evides Water Company, 3063 NH Rotterdam, The Netherlands
*
Author to whom correspondence should be addressed.
Water 2018, 10(5), 582; https://doi.org/10.3390/w10050582
Submission received: 29 March 2018 / Revised: 17 April 2018 / Accepted: 26 April 2018 / Published: 30 April 2018
(This article belongs to the Section Water Quality and Contamination)

Abstract

:
Drinking water and fire safety are strongly bonded to each other. Actual drinking water demand and fire flows are both delivered through the same network, and are both devoted to public health and safety. In The Netherlands, the discussion about fire flows supplied by the drinking water networks has drawn fire fighters and drinking water companies together, searching for novel approaches to improve public safety. One of these approaches is the application of residential fire sprinkler systems fed by drinking water. This approach has an impact on the layout of domestic drinking water systems (DDWSs), as extra plumbing is required. This study examined the influence of the added plumbing on quality of both fresh and 10 h stagnant water in two full scale DDWSs: a conventional and an extended system. Overnight stagnation was found to promote copper and zinc leaching from pipes in both DDWSs. Microbial numbers and viability in the stagnant water, measured by heterotrophic plate count (HPC), flow cytometry (FCM) and adenosine tri-phosphate (ATP), depended on the temperature of fresh water, as increased microbial numbers and viability was measured in both DDWSs when the temperature of fresh water was below the observed tipping point (15 °C for the HPC and 17 °C for the FCM and ATP measurements respectively) and vice versa. A high level of similarity between water and biofilm communities, >98% and >70–94% respectively, indicates that the extension of the DDWS did not affect either the microbial quality of fresh drinking water or the biofilm composition.

1. Introduction

The primary role of drinking water distribution systems is to supply sufficient drinking water quantity and quality, at adequate pressure ranges, to consumers. Apart from that, most of the drinking water distribution networks also carry along so-called “fire flows”, which are the amounts of water necessary to extinguish fires by firefighting services. Nowadays, the usual demand of a fire hydrant, which supplies firefighting water, is in the range from 30 to 60 m3/h, which is delivered through the network with pipes of 100 mm diameter (or larger). Additionally, the maximum allowable spacing between the hydrants and objects should not exceed 40 m in The Netherlands. These spatial and flow requirements have led to the phenomena of generously sized networks, given that a standard residential service connection is rated at 1.5 to 2.5 m3/h [1]. This means that the majority of the distribution networks are dimensioned on fire flows rather than on actual drinking water demands. The impact of large networks is low velocities in the networks and prolonged water residence times. The extent of the water residence time in distribution networks depends on several parameters, such as: the distance from the water treatment facility, pipe diameters (ranging from 20 mm for service pipes to 1600 mm for the transmission mains), and water velocities, which depend on drinking water consumption and population size [2]. Because it may cause an accumulation of sediment and related water quality issues like discoloration, decay of disinfectant residual, and pronounced microbiological growth [3,4,5,6,7], water residence time is usually regarded as the surrogate for water quality. In the past years, substantial efforts have been devoted to minimizing water residence time and achieving the optimal design of water distribution networks with respect to the disinfectant concentrations, formation of disinfection by-products (trihalomethanes), and overall construction costs of water distribution networks [8,9,10,11].
Despite the fire flows—which are delivered through commonly large drinking water networks, and in spite of fire safety developments in the last decades, the number of residential fires and fire fatalities remains almost constant in The Netherlands. Around 7000 dwelling fires occur each year, leaving on average 45 dead and dozens more injured [12]. One of the main reasons for this trend is that the evacuation time has decreased from 17 to 3 min [13,14]. Over 30 years ago, when the evacuation time was estimated to be 17 min, houses were furnished with natural materials (genuine wooden furniture, wool carpets, etc.), while most of the modern residential occupancies and their interiors are made with synthetic materials that can ignite readily and lead to the rapid spreading of the fire, and the release of toxic gases. Therefore, deadly conditions are nowadays reached in as little as 3 min in home fires. In addition to this, statistics show that the fire services’ response time is around 8 min in The Netherlands [15], and that once the fire brigade reaches the fire scene, it might be too late to save the lives from the hazards, assuming that only the conventional fire flow approach is applied.
The discussion about the fire flows supplied by generously sized water networks has drawn fire fighters and drinking water companies together, seeking new approaches to improve public health and safety. An automatic fire sprinkler system, being one of the discussed approaches, is an active fire protection measure which does not only extend the evacuation time of residents, but also serves to control the fire before the fire brigade reaches the fire event, and uses the water from fire hydrants. According to the statistics, automatic fire sprinklers have proven to prevent more than 80% of residential fire casualties and around 70% of property damage [16]. Though the first sprinkler patent dates from 1874 [17], their implementation in Europe is typically limited to industrial applications. The technical issue of widespread implementation of residential fire sprinkler systems was required water flow and pressure for a conventional fire sprinkler head, which were in the order of 50 to 80 L/min and 0.7 to 1.6 bar, respectively. Innovations in the design of a sprinkler head have yielded fire sprinkler heads [18] that show outstanding performance under low flow and pressure conditions (30 L/min and 0.5 bar respectively), which are the thresholds at the farthest points in a typical Dutch house. With no technical obstacles regarding the operational flow and pressure, it is, nowadays, feasible to integrate sprinkler systems into domestic drinking water systems (DDWSs) in The Netherlands. Nevertheless, sprinkler system integration into a conventional DDWS has an impact on the layout of DDWSs, such as increased piping diameters, extended pipe length, more volume of the system; hence, it may affect the quality of drinking water at the consumers’ tap. In The Netherlands, the quality of the drinking water is routinely monitored and measured at the tap. Dutch drinking water companies are responsible for the water quality, unless a poor maintenance of DDWSs is proven [19]. Unlike with drinking water distribution systems, where the drinking water is hardly ever entirely stagnant because of aggregated water consumption, in the DDWSs, water may stagnate in pipes for hours, days or even weeks before consumption takes place. Recent research showed that the overnight stagnation of water in DDWSs strongly influences the microbial activity and richness [7,20,21,22], and results in leaching of various compounds from pipes and fixtures, such as copper, zinc, lead and organic compounds [23,24,25]. This study aimed to determine the extent to which an implementation of a sprinkler system in DDWSs results in alteration of water quality at consumer’s taps. The foci of the study were: chemical and microbial parameters of fresh and stagnant water, and microbial characterization of biofilm in both conventional and extended full scale DDWSs.

2. Materials and Methods

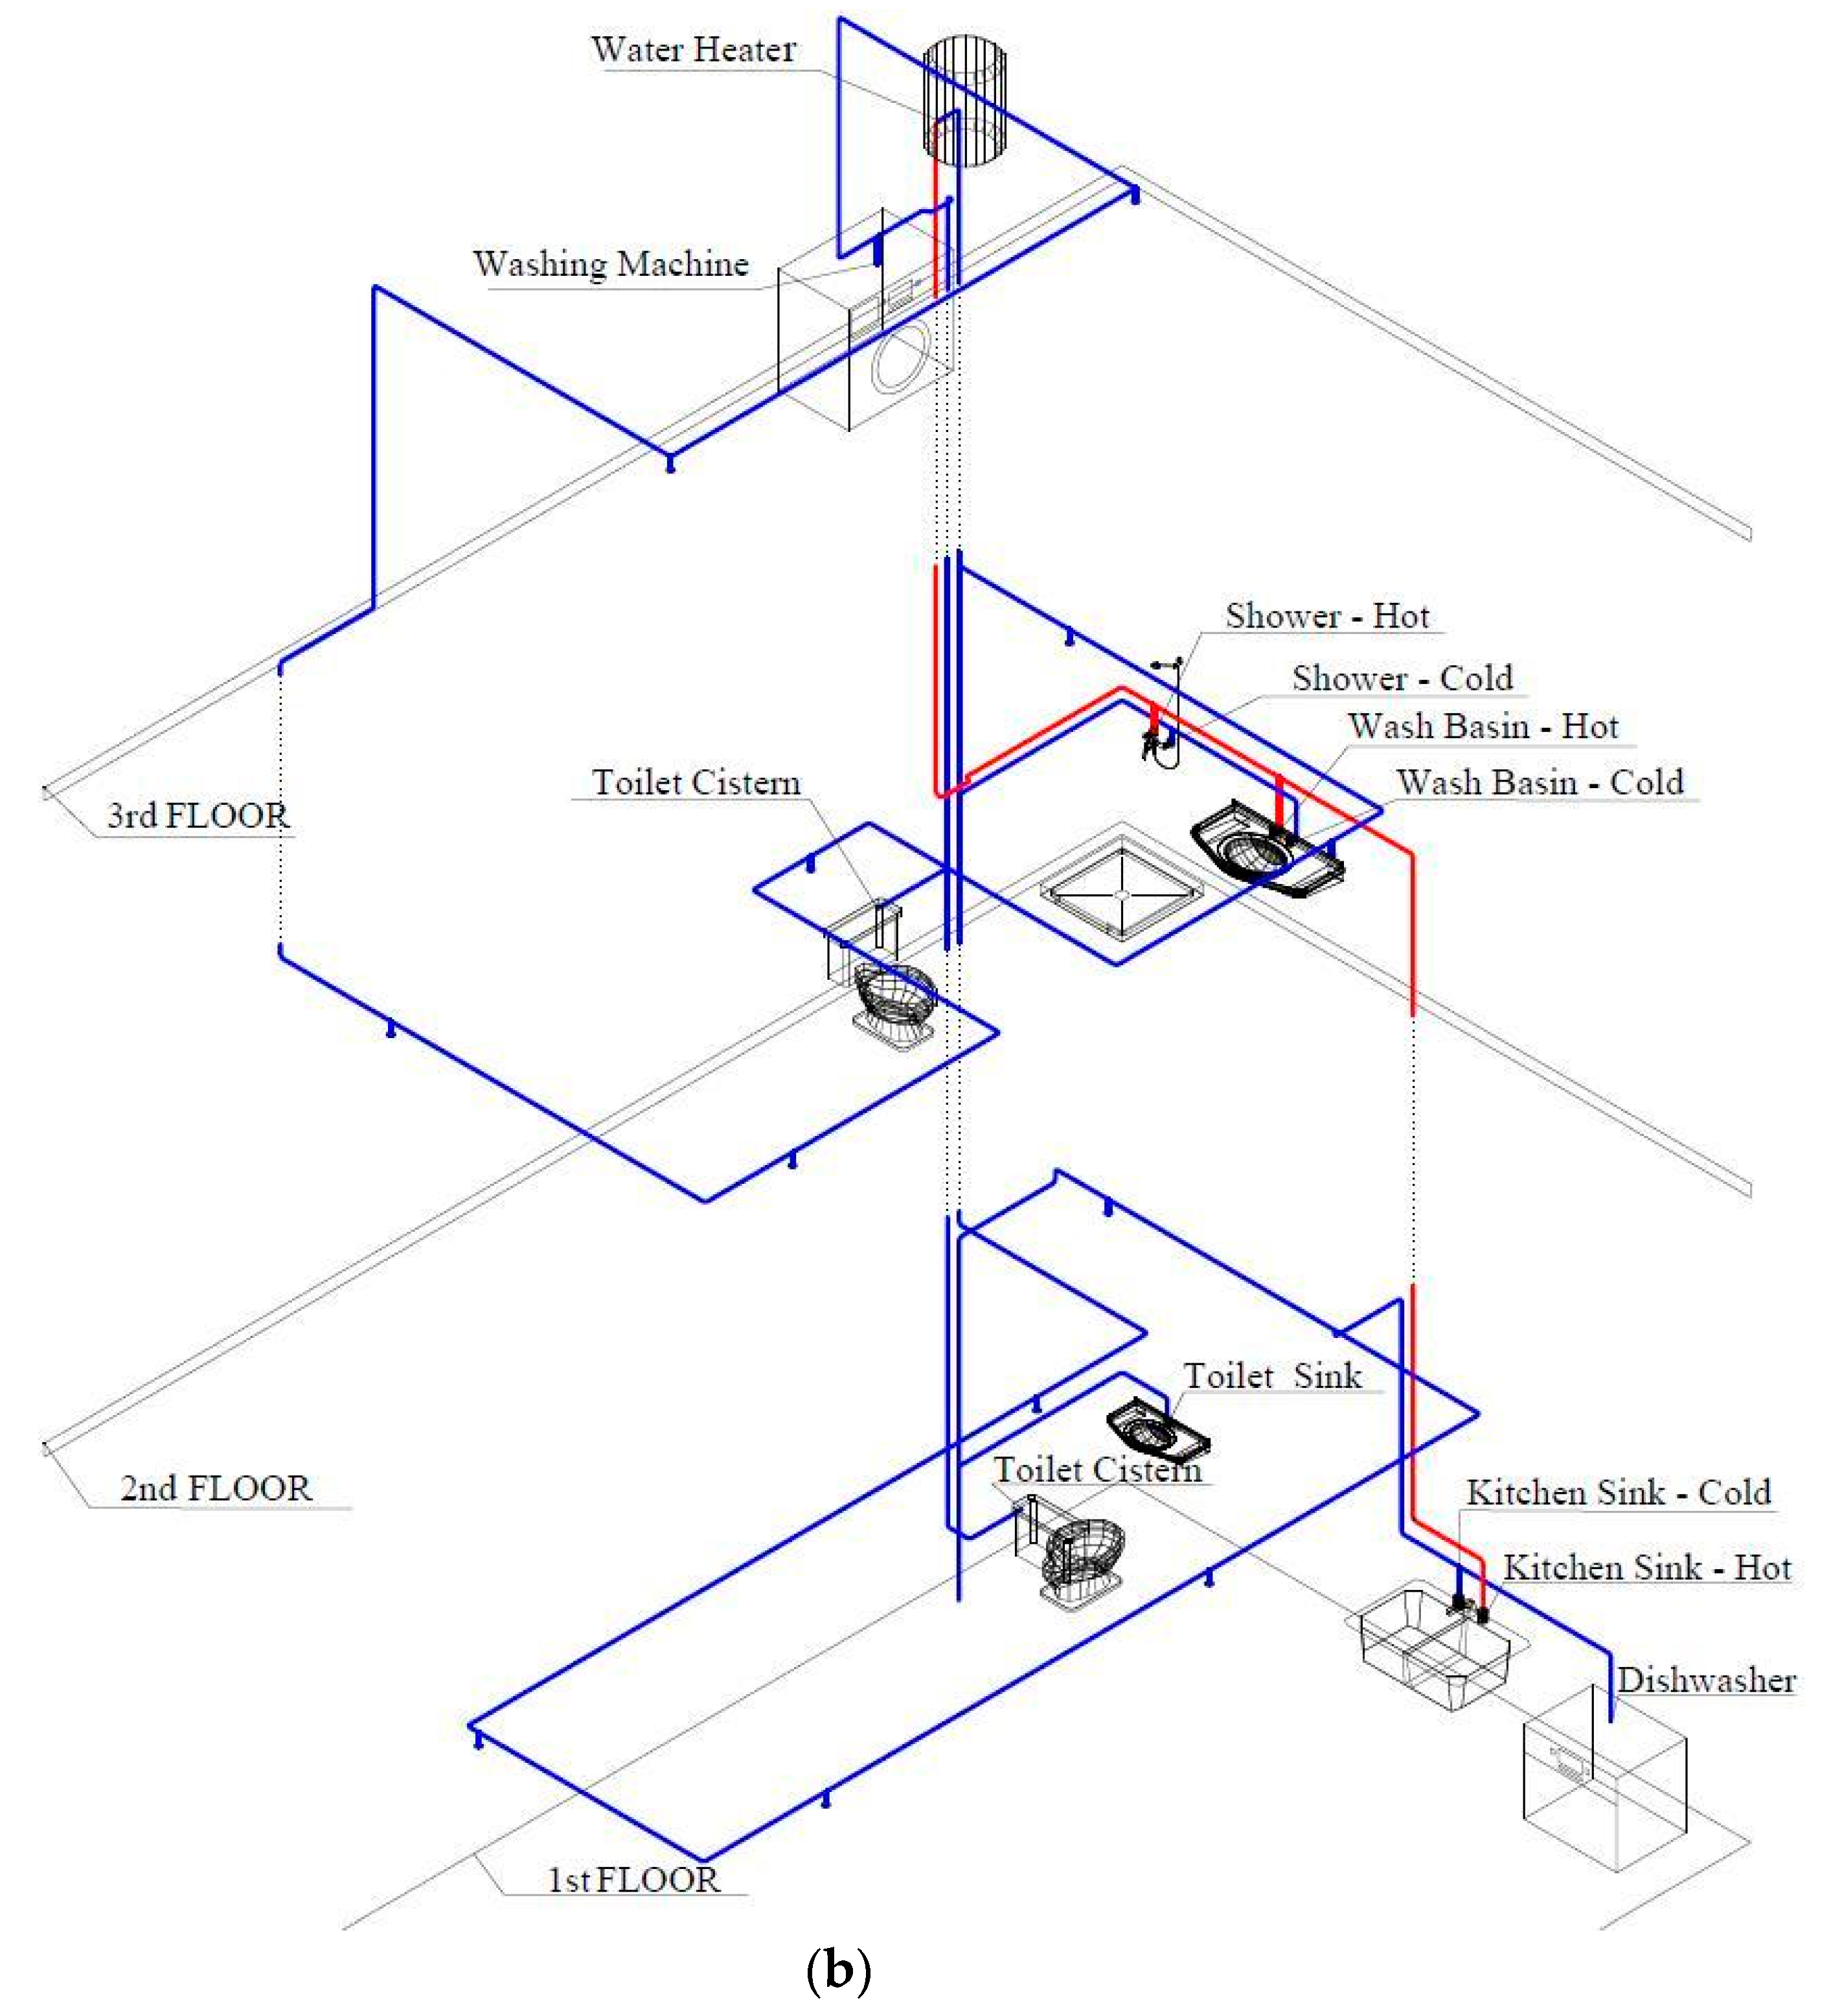
Description of the DDWS Experimental Rigs

To study the impact on water quality of added plumbing for the installation of residential fire sprinkler heads to a conventional DDWS, two full-scale DDWSs, a conventional (CS) and an extended (E-S) DDWS, were built (Figure 1 and Supplemental Figure S1) and operated for 430 days, applying the stochastic water demand patters at each tap. The experimental rigs were constructed by a licensed plumber, using readily available material—copper, manufactured in accordance with European Standard EN 1057. The configuration of the CS complied with the Dutch home plumbing codes NEN 1006 [26], while the ES contained additional loops of 22 mm diameter piping on each floor for the fire sprinkler system accommodation.
The detailed description of the experimental methodology, including (1) mimicking the real water consumption during the experimental run, (2) overnight stagnation experiments, (3) sampling of (fresh and stagnant) water and biofilms, (4) chemical and microbial analysis of (fresh and stagnant) water and biofilm samples, and (5) statistical analysis, is given in our previous work (available via Open Access) [21,27].

3. Results

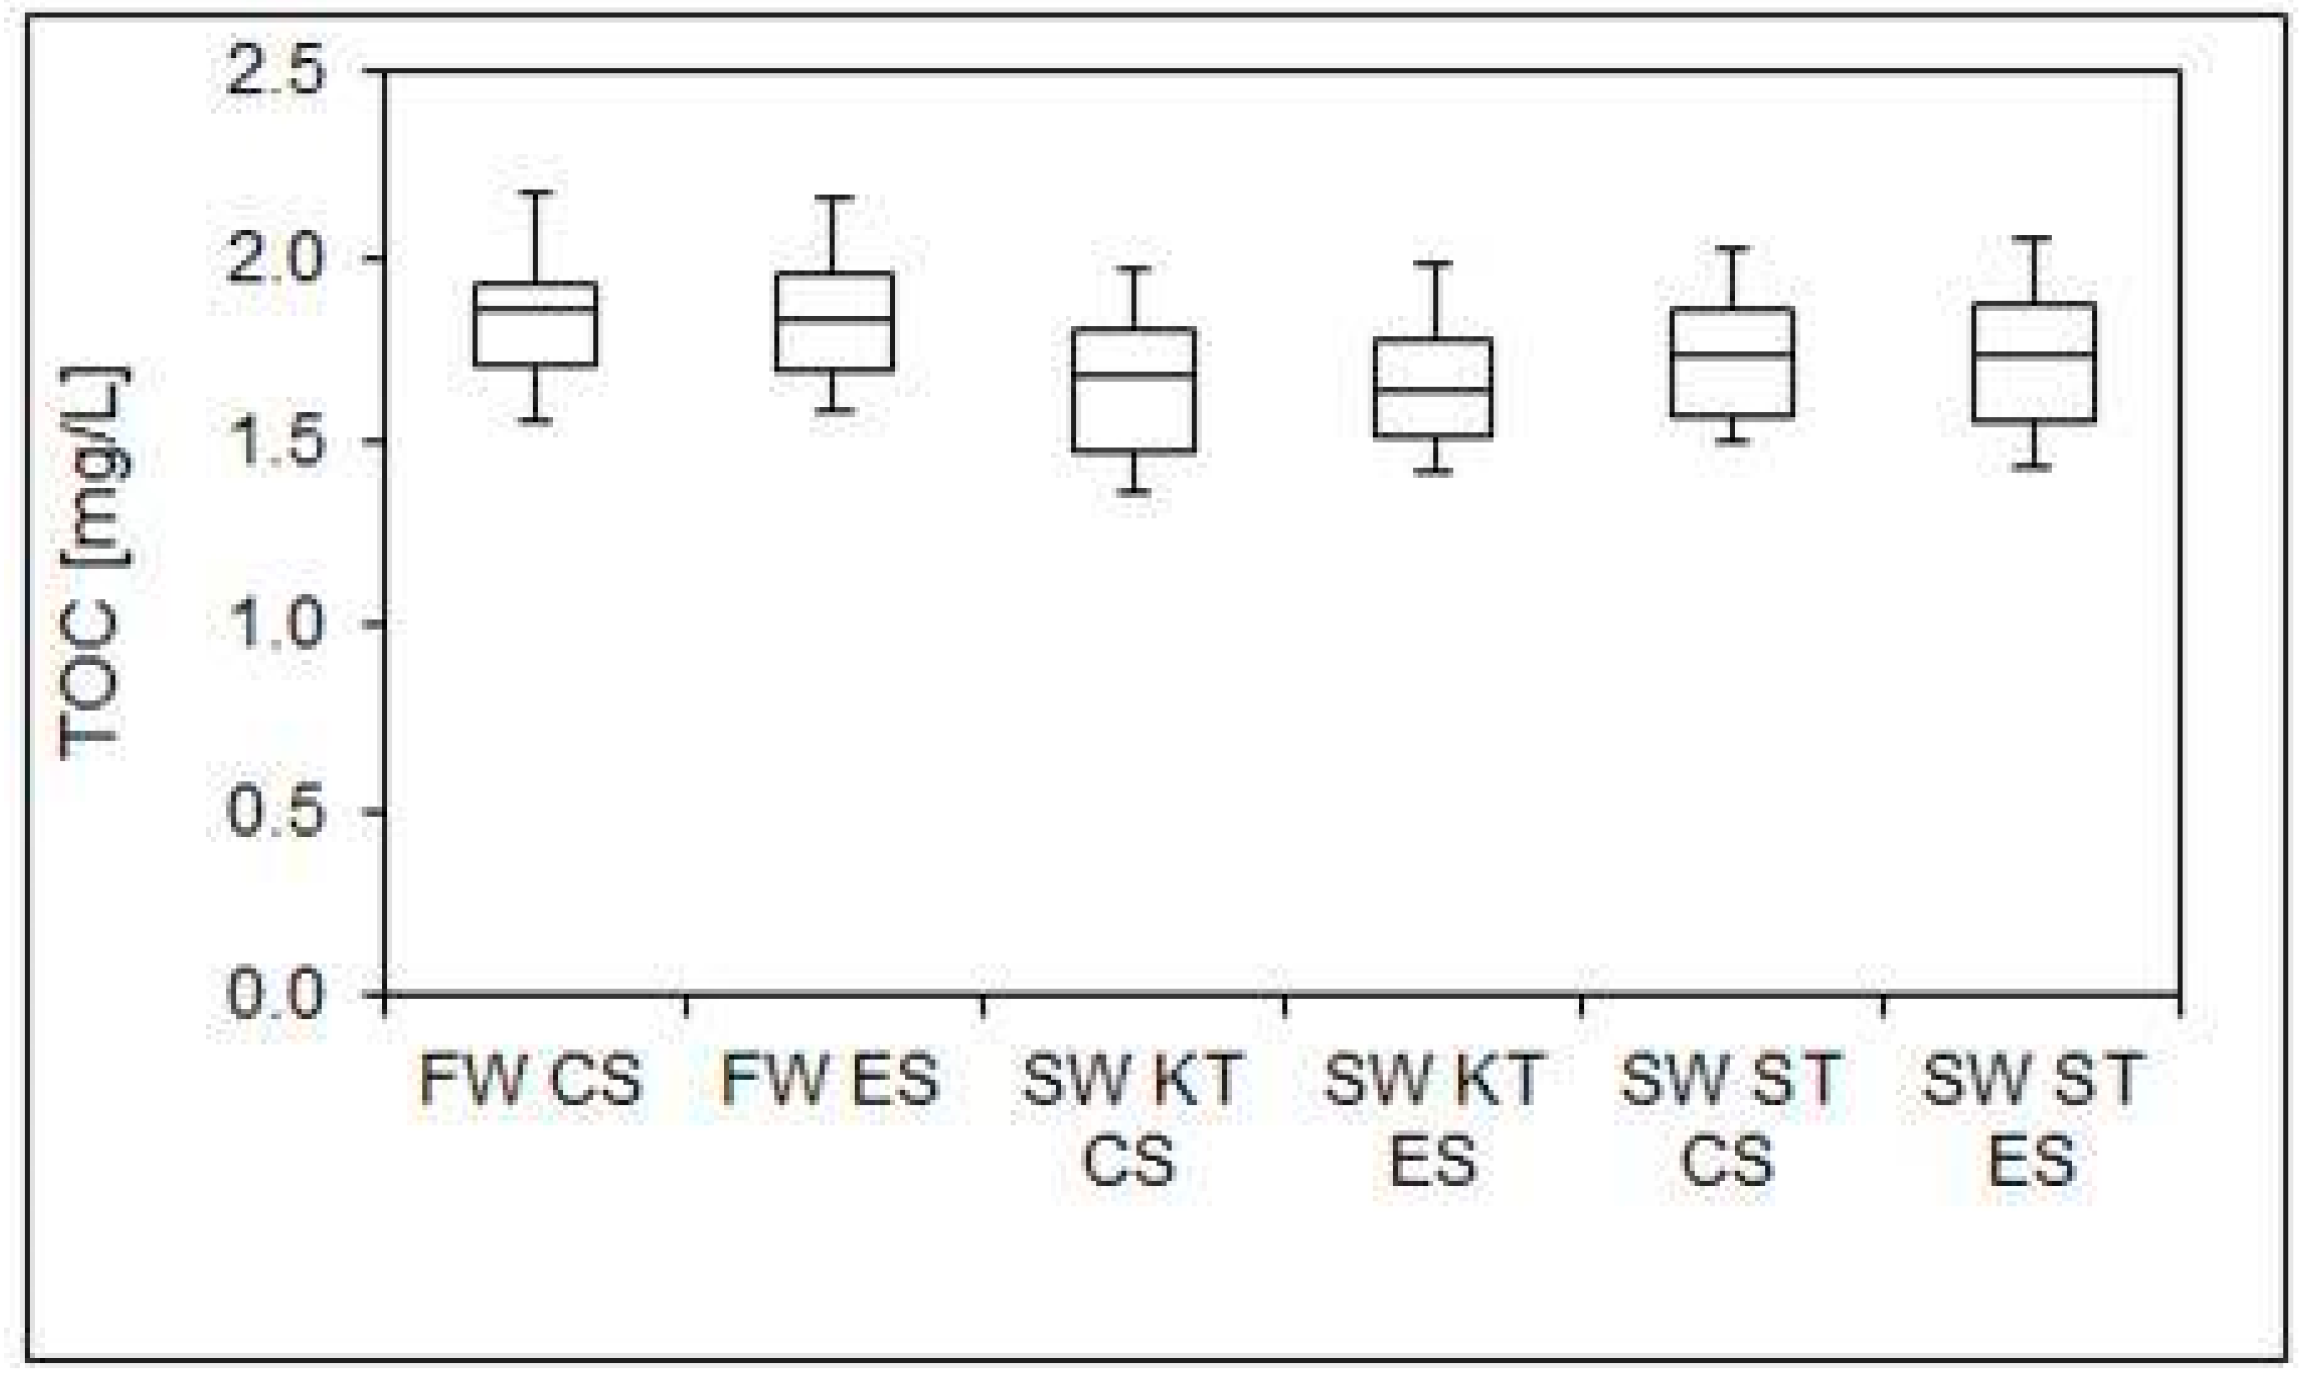
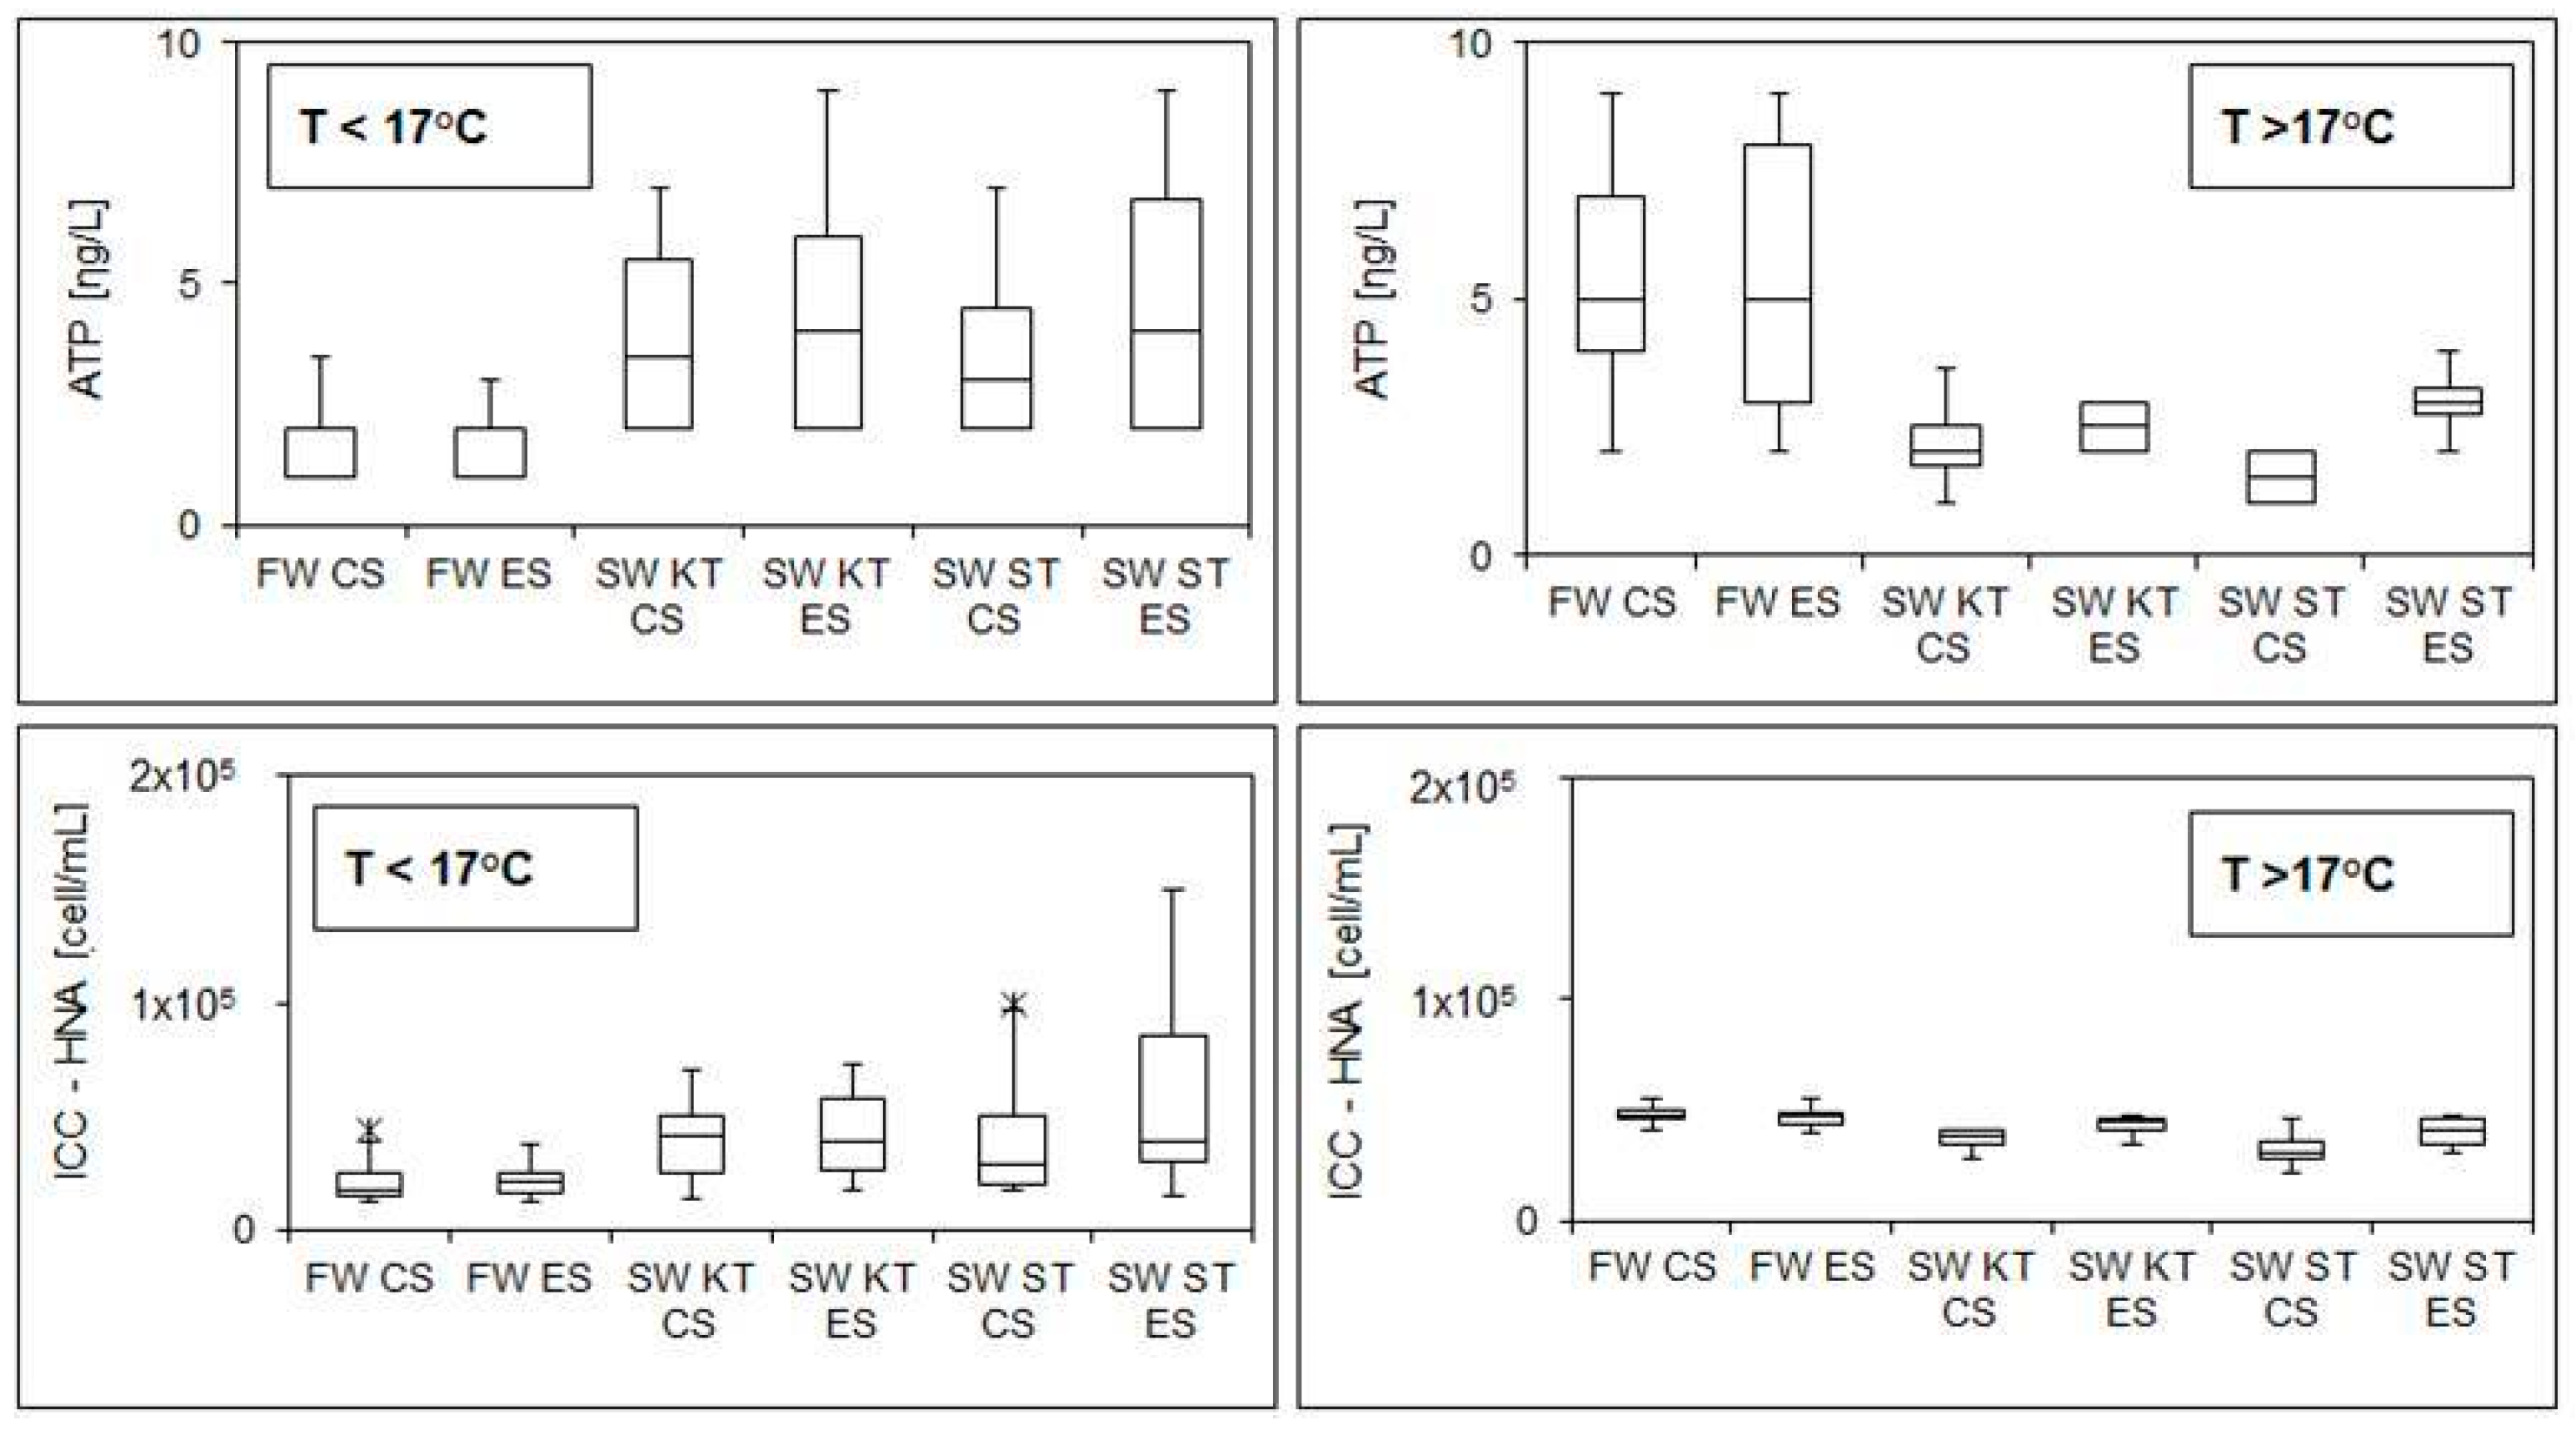
3.1. Overnight Stagnation Experiments

In Figure 2, measured copper and zinc concentrations in fresh and stagnant water are summarized.
The average concentration of copper in the fresh water samples from two DDWSs was 30 µg/L (range 12–75 µg/L). As shown in the Figure 2, copper levels significantly increased (30–50 fold) after an overnight stagnation of 10 h. The copper content of stagnant water was not significantly different between the two stagnant samples collected from the kitchen taps from two experimental rigs, and was on average 1082 ± 183 µg/L for the conventional system, and 996 ± 118 µg/L for the extended system, respectively. The stagnant water from the shower tap in the conventional DDWS contained, on average, ~400 µg/L more copper than the water from the kitchen tap in the conventional system. For the extended system, the copper levels in the shower stagnant samples were ~450 µg/L lower than those from the conventional DDWS, and were statistically different from the measured copper levels in the shower samples from the conventional rig.
The average zinc concentration in the fresh water samples from two DDWSs was 10 µg/L (range 5–33 µg/L). Similarly to the leaching of copper, overnight stagnation appeared to promote zinc release from the brass components, which are used in drinking water distribution systems as valves, faucets and other fixings; a 3–7 fold increase in zinc levels was observed after 10 h of stagnation. The zinc levels in the stagnant water samples were not significantly different between the two kitchen stagnant samples and the shower sample from the conventional system (average 57 ± 14 µg/L at the kitchen tap for the conventional system, 68 ± 27 µg/L at the kitchen tap for the extended system and 68 ± 21 µg/L at the shower tap for the conventional system, respectively). For the extended system, the levels of zinc in the shower stagnant samples were ~40 µg/L lower than in the other water samples.
The TOC concentrations in the fresh and 10 h stagnant water samples are presented in Figure 3.
The average TOC content in the fresh water samples was 1.80 ± 0.3 mg/L. As shown in Figure 3, the TOC concentrations were reduced by 5–15% during the overnight water stagnation.
During the period of the experimental research, the fresh water temperatures ranged from 6 °C to 23 °C. A tipping point of fresh water at 15 °C was observed, at which a shift in the HPC concentrations was observed (Figure 4). Over the study period, the numbers of heterotrophic bacteria in fresh water samples from the conventional and extended DDWSs were similar; i.e., on average 10 ± 7 CFU/mL was observed in water samples with temperatures lower than 15 °C, and 63 ± 26 CFU/mL (Figure 4 left) was measured in water samples with temperatures higher than 15 °C (Figure 4 right). The numbers of HPC bacteria generally increased with the overnight stagnation, i.e., up to a 5-fold increase in HPC levels was measured if the temperatures of fresh water were lower than 15 °C. However, when the temperatures of fresh water were above the tipping point of 15 °C, up to 6-fold reduction in HPC was observed in stagnant water samples.
The same trend was observed with ATP and FCM measurements, but here, the tipping point was found to be 17 °C. Figure 5 gives an overview of ATP and ICC-HNA concentrations in fresh and stagnant water samples from the conventional and the extended DDWS.
The statistical differences between the ATP and ICC-HNA concentrations in the fresh water samples for both investigated DDWSs were non-significant. The mean values of ATP and ICC-HNA concentrations in fresh water samples with temperatures lower than 17 °C were 1.85 ± 0.78 ηg/L and 2.1 × 10⁴ ± 0.7 × 10⁴ cell/mL, respectively. The average ATP and ICC-HNA concentrations in fresh samples with drinking water temperatures higher than 17 °C were 5.1 ± 2.4 ηg/L L and 4.6 × 10⁴ ± 0.5 × 10⁴ cell/mL respectively. In this research, most of the changes in measured cell concentrations after the overnight stagnation experiments were observed for ICC—HNA fraction, while ICC—LNA fraction remained stable.
Finally, concentrations of opportunistic pathogen Legionella pneumofila in all fresh and stagnant water samples were below the detection limit of 100 CFU/mL throughout the whole experimental period.

3.2. Biofilm Measurements

The characteristics of the biofilms formed along the kitchen and shower pipes in the conventional and extended systems were determined by HPC, ATP and FCM measurements (Table 1) and by next-generation sequencing (Table 2).
The amount of HPC bacteria and viable biomass in the biofilm samples (Table 1) were similar for the four pipes: in the range from 0.3–6 CFU/cm2 and 8–12 pg ATP/cm2. In the conventional system, as given in Table 1, the biofilm which was formed along the shower pipe contained higher amounts of total cells and intact cells (1.0 × 10⁶ cells/cm2 and 5.7 × 10⁵ cells/cm2) than the biofilm in the kitchen pipe (TCC 6.6 × 10⁵ cells/cm2 and ICC 2.9 × 10⁵ cells/cm2 respectively). The biofilm extracted from the kitchen pipe in the extended system contained similar concentrations of total intact cells (TCC 5.4 × 10⁵ cells/cm2 and ICC 3.3 × 10⁵ cells/cm2 respectively) to the biofilm from the conventional DDWS, while the biofilm from the shower tap in the extended system had the least cells among all examined biofilms (TCC 2.1 × 10⁵ cells/cm2 and ICC 1.5 × 10⁵ cells/cm2 respectively).
As statistically significant differences were observed in stagnant water quality between shower samples from the two systems, two fresh (shower) water samples were also taken for the analysis of the richness and diversity of microbiota in shower water samples. Determination of the community richness in all samples was done by calculation of richness estimators (OTU and Chao Index), while the microbial diversity was assessed by applying the diversity index (Shannon Index) [28,29]. To check whether the microbial communities are dominated by a few species or the species are evenly distributed in the microbial assembly, an evenness parameter was calculated (for entirely even community, evenness value is one, and if a few species dominate in the community evenness value is close to zero) [30]. Sampling intensity was calculated by using the coverage parameter, which shows the percentage of individual microbial species sampled in a microbial community [31].
The number of generated sequences were ~180,000 for water samples and from ~80,000 to 130,000 for biofilm samples (Table 2). These high numbers of sequences helped to detect higher numbers of operational units (OTUs at a 3% cut-off., i.e., 3056 and 3122 in the water samples and from 736 to 1313 for the biofilm samples, respectively). Higher bacteriological richness was observed in the water samples than in the biofilms, Chao1 index 3480–3509 for water and 1086–1959 for biofilm samples, respectively. In addition to this, it was found that the coverage for water samples was 88–89%, while for the biofilm samples, coverage was found to be lower, namely 45–67%. According to the Shannon index, fresh water samples contained higher microbial diversity than the biofilm samples: 6.15–6.17 and 2.37–2.95 respectively. The other diversity parameter, evenness, showed that the species were more evenly distributed in the drinking water samples than in the biofilms (0.76 for water samples and 0.33–0.41 for biofilm samples).
Proteobacteria were found to be the predominant phyla in both water and biofilm samples, varying from 61% to 81% (Figure 6 left). In the water samples, Proteobacteria consisted of 57% of Alphaproteobacteria, 25% of Betaproteobacteria, 7% of Gammaproteobacteria and 10% of Deltaproteobacteria (Figure 6 right). Among the remaining phyla in the water samples, Plancomycetes were the second most dominant bacteria, accounting for 10% of the total, while the abundances of BD1-5, Candidate division OD1, Chloroflex, Acidobacteria and Bacteroidetes were <3%. Slightly different composition of Protobacteria content was observed for the biofilm samples: 29–62% of Alphaproteobacteria, 5–26% of Betaproteobacteria, 11–24% of Gammaproteobacteria. Biofilm samples also had slightly different abundances of the remaining phyla, i.e., 3–12% of Gemmatimonadetes, 0.1–9% of Firmicutes, 1–4% of Bacteroidetes, 0.6–4% of Actinobacteria.
A distance analysis (Unweighted Pair Group Method with Arithmetic Mean method—UPGMA), presented in Figure 7, shows that there is a high similarity between the fresh water samples and biofilms for both systems at the genus level, >98% and >70–94% respectively.

4. Discussion

In the current study, two full-scale copper DDWSs were used to examine the influence of the plumbing extension on (fresh and stagnant) water quality and biofilm composition formed along the (kitchen and shower) pipes.

4.1. Water Quality

The copper levels in all water samples increased with overnight stagnation of water in the DDWSs (Figure 2 left), which corresponds to the results of other studies on leaching of copper from copper pipes [32,33,34]. Negligible differences were found in terms of copper concentrations in the stagnant water samples collected from two kitchen taps. This was expected, because the layouts and locations of the kitchen plumbing were almost identical for the two DDWSs. The differences in copper levels which were observed between the kitchen and shower water samples in the conventional DDWS (average 380 µg/L) are probably caused by the influence of a microclimate around the experimental DDWSs; this has already been reported in our previous work [21]. The lower copper concentrations in the shower water samples collected from the extended system can be explained by a 1.5 times greater volume-to-surface ratio of the loops that deliver drinking water to the shower tap, meaning that a smaller surface area of the pipes is available for the copper leaching process. Elevated copper concentrations in drinking water are known to cause acute and chronic health effects, such as gastrointestinal disorders and liver damage. The World Health Organization (WHO) has set 2 mg/L as a maximum concentration value for drinking water [35]. In this research, the measured copper levels in both fresh and stagnant water samples were all below the guideline value proposed by WHO.
Overnight water stagnation in both DDWSs also promoted zinc leaching from brass elements (Figure 2 right), which has already been shown in several studies [36,37,38]. Non-statistically significant differences were observed between the zinc levels in stagnant water samples collected from the two kitchen taps. The differences in leached zinc between the samples from the kitchen and shower taps (average 20 µg/L) in conventional DDWSs are possibly triggered by microclimate effects [21]. The lower zinc concentrations in the shower water samples from the extended system might be a result of the larger volume-to-surface area of the loops for the fire sprinkler system. Dezincification is defined as a de-alloying process, which is caused by the leaching of zinc from brass components [39]. Currently, no health-based guideline value for zinc in drinking water exists. However, if the zinc concentration in water exceeds 3 mg/L, color and taste may develop [40]. In this research, zinc concentrations in both fresh and stagnant water samples were below the aesthetic guidelines.
The TOC content was generally lower in water samples from both DDWSs after overnight stagnation (Figure 3). The TOC reduction in the stagnant samples could be due to the adsorption of organic matter onto pipe surfaces, and microbial activity in water and biofilms, as leached copper can bond with organic matter, forming various (soluble and particulate) compounds [41]. These compounds may adhere to the pipe surfaces via precipitation and/or sorption. An examination of biofilms established on copper surfaces revealed the existence of two layers: (1) a layer of consisting of extracellular polymeric substances (EPSs) which is established directly on copper surfaces, and (2) a microbial layer which is not fixed firmly in the EPS layer [42]. The EPSs have functional groups which deliver bonding locations both for metal cations (as copper and zinc) and NOM [43,44]. Furthermore, organic carbon is known as one of the limiting factors for the growth of microorganisms in water distribution systems: 1 µg/L of organic carbon is enough to stimulate the growth of 103–104 cell/mL [45]. During overnight stagnation, an increase in ICC counts (up to 5 × 10⁴ cell/mL) was recorded, which indicates that only a small portion of the TOC (1–10%) might be related to the TOC bacterial consumption.
The growth of HPC bacteria in the water phase in distribution networks is influenced by several factors, such as disinfectant residual, available nutrients, temperature and pipe material [46,47]. In our study, the concentrations of HPC bacteria in stagnant water depended on the temperature of incoming fresh water; a tipping point of 15 °C was observed (Figure 4). The numbers of HPC bacteria generally increased with overnight stagnation if the temperatures of fresh water were lower than 15 °C, while a reduction in HPC numbers was measured if the temperatures of fresh water were above the tipping point of 15 °C (Figure 4). Recent research reported that assimilable organic carbon (AOC), the part of the TOC that can be consumed by HPC bacteria, showed a reverse seasonal trend compared to the temperature of water. A minimum AOC level of 3.5 μg/L was observed in summer months (at highest temperature of the drinking water), while a maxim AOC level of 41.4 μg/was measured in winter months (at low water temperatures) at the water treatment plant outlet [7]. The shift in the numbers of HPC bacteria which was observed in the present study may be a result of the seasonal AOC variations in drinking water. For instance, at higher temperatures of drinking water, low AOC concentrations could be additionally decreased by microbial consumption in the drinking water distribution network. In that way, a limited quantity of AOC might be available for growth of HPC bacteria in the experimental DDWSs. In winter months on the other hand, advantageous temperature conditions for HPC growth could only be found in the DDWSs, which were surrounded by the ambient temperature of 16 to 26 °C in this research.
Overnight stagnation was also found to promote microbial viability, as an increase of up to 8-fold in ATP levels was measured, when the temperature of fresh water was lower than 17 °C (Figure 5 top left). This observation coincides with the findings from a previous study on induced microbial viability in terms of increased ATP after overnight stagnation of water in DDWSs [20]. However, when the temperature of fresh water was higher than 17 °C, up to 9-fold reduction in ATP concentrations was observed (Figure 5 top right). The same trend was found in the ICC-HNA subgroup, which is accountable for the most important part of the bulk activity in stagnant water [20]; i.e., up to a 4 fold increase in ICC-HNA levels was observed if the fresh water temperature was below 17 °C (Figure 5 bottom left), and up to 40% of reduction in ICC-HNA levels was found if the fresh water temperature was above 17 °C (Figure 5 bottom right). The observed increase in the HNA fraction of the intact cells might explain the higher ATP concentrations in the stagnant water samples. One study demonstrated that higher HNA content could be related to the elevated ATP concentrations [48], because HNA bacteria are generally bigger cells holding a 10-fold higher ATP-per-cell content than LNA bacteria [49].
In conclusion, the overnight stagnation in both conventional and extended DDWSs resulted in an increase in HPC, ATP and ICC-HNA concentrations when the fresh water temperature was below an observed tipping point (15 °C for HPC and 17 °C for ATP and ICC-HNA respectively). Decreased ICC, ATP and HPC concentrations were observed in water samples when the fresh water temperatures below the observed tipping point, which was also reported in our previous work [21]. Past research on drinking water quality in experimental and real DDWSs demonstrated that the overnight stagnation of water in DDWSs can exclusively lead to higher cell concentrations and bacterial community metabolic activity [20,34,50,51,52]. The reduction in ICC, ATP and HPC content, which was observed in this research when the freshwater temperature was above the tipping point, could be due to the substrate limitation following the starvation—induced death or accumulation of the bacteria on the pipe wall [20,21,53,54,55].
It is also important to point out that the differences in microbial activity, measured by HPC, ATP and FCM measurements, were non-significant between the stagnant samples from the kitchen taps from the two different DDWSs. The differences found between the microbiological parameters in the stagnant shower water samples were statistically significant, which is probably a result of the DDWS lay-out alteration, as extra plumbing loops were added to the extended system. However, the approach of flushing the pipes did “restore” the quality of drinking water, because the Kruskal-Wallis test showed that non-significant differences existed between all examined parameters in the fresh water samples, which were collected from the inlet tap, kitchen and shower taps in both conventional and extended DDWSs.

4.2. Biofilm Measurements

After the experimental period of 430 days, kitchen and shower biofilms were extracted from both DDWSs. The biofilm results, which were determined by HPC, ATP, FCM methods for the kitchen pipes from the two systems, were similar (Table 1). Higher values of total and intact bacteria were found in the biofilm from the shower pipe in the conventional system, while the biofilm from the shower pipe in the extended DDWS had almost 4–5 times less cells (intact and total), compared to that from the conventional DDWS. This is probably due to a change in the layout (1.5 larger volume to surface ratio of the pipe delivering the water to shower tap in the extended system). In a previous research on the growth characteristics of bulk phase and biofilm bacteria, it was shown that bulk phase bacterial growth is considerable compared to the biofilm growth, especially under larger volume to surface ratio [53]. The densities of all four biofilms, which were determined by TCC and ICC measurements correspond to those reported in literature, which were in the range from 104 to 107 cell/cm2. ATP and HPC concentrations in the sampled biofilms appeared to be lower than the reported ATP and HPC concentrations in biofilms formed in drinking water distribution systems, which ranged from 40 to 4000 pg ATP/cm2 and from 104 to 107 CFU/cm2, respectively [56,57,58,59,60,61]. Lower HPC and ATP concentrations in the DDWSs biofilms are probably due to the fact that drinking water was mostly stagnant in the experimental DDWSs, while in the mentioned studies, (nutrient-enriched) drinking water was constantly circulating through the systems, which enabled the growth and viability of microorganisms in the biofilms.
Higher bacteriological richness (Chao1 index) and higher microbial diversity (Shannon index) in the water than in the biofilm samples (Table 2) suggest that not all bacteria from water phase are capable of attaching and growing on pipe surfaces, which agrees with the conclusions reached in previous studies [62,63]. The other diversity parameter, evenness, showed that the species were more evenly distributed in the drinking water samples than in the biofilms. The lower evenness in the biofilms might be related to the specialization in biofilms which are formed on copper surfaces, or that certain species are more abundant. Despite its toxicity to bacteria when available at high concentrations, copper is also crucial for the metabolism of cells. This double-edged copper property enforced certain bacteria to acquire complex resistance mechanisms, which was discussed in our previous work [21].
Proteobacteria were the most dominant phyla in both water and biofilm samples, and their abundance varied from 61% to 80% (Figure 6 left). Bacterial communities of the biofilms in the conventional and extended DDWSs were similar to the communities reported in earlier research [48,64,65,66], dominating by Alpha-, Beta- and Gammaproteobacteria (Figure 6 right). Among the other phyla, sequences related to bacteria Firmicutes were dominant (~9%) in the biofilm extracted from the shower pipe biofilm in the extended system. The higher abundance of the obligate anaerobes Firmicutes is probably because the water refreshment rate in the extended system is lower than in the conventional, which agrees with the observation from a recent study in which more Firmicutes were found under static water flow conditions [55]. A high level of similarity at the genus level between fresh water and biofilm communities, 98% and >70–94% respectively (Figure 7) indicates that the extension of the copper DDWS did not significantly affect either the microbial quality of fresh water or the biofilm composition in the examined DDWSs.

5. Conclusions

  • Overnight stagnation of water in the conventional and extended DWDSs stimulated leaching of copper and zinc from the copper pipes and brass elements. However, the measured copper and zinc concentrations in stagnant water samples were below the WHO maximum contaminant levels.
  • Significant differences in water quality were observed between the stagnant water samples from the shower taps in the conventional and extended DWDSs. Insignificant differences between all fresh water samples were found for all examined parameters, indicating that tap flushing can restore the quality of the drinking water quality in DDWSs.
  • Alteration in microbial parameters was evident after overnight stagnation in both systems, while the overall trend appeared to be a function of fresh water temperature (i.e., increased cell concentrations and viability were observed at low temperatures of fresh water, while at high temperatures of fresh water, we detected a reduction in the cell concentrations and viability in stagnant water samples).
  • Characterization of microbiota in water samples and biofilms showed that Proteobacteria dominated among phyla sequences. The high level of similarity at the genus level between fresh water and biofilm communities for both systems, >98% and >70–94% respectively, indicates that the extension of the DWDS affects neither microbial water quality, nor the biofilm compositions.
  • Extension of the copper DWDS for residential fire sprinklers accommodation had no effect on the drinking water quality parameters of fresh water during the 14 months of the experimental study.

Supplementary Materials

The following are available online at https://www.mdpi.com/2073-4441/10/5/582/s1, Figure S1: Test rigs.

Author Contributions

L.Z. designed and performed the experiments. A.K., J.P.v.d.H. and J.V. provided guidance and expertise and contributed to the data analysis and preparation of the manuscript.

Acknowledgments

The authors would like to acknowledge AgentschapNL (Project No. IMV1100047), Stichting PIT, and drinking water companies Waternet, Vitens, Oasen, PWN and Brabant Water for financial support.

Conflicts of Interest

The authors declare no conflict of interest.

References

  1. VEWIN. Water Supply Statistics 2007; VEWIN: Rijswijk, The Netherlands, 2008. [Google Scholar]
  2. Bartram, J. Heterotrophic Plate Counts and Drinking-Water Safety: The Significance of Hpcs for Water Quality and Human Health; World Health Organization: London, UK, 2003. [Google Scholar]
  3. Vreeburg, J.H.G. Discolouration in Drinking Water Systems: A particular Approach (Chapters 4 and 5). Ph.D. Thesis, Technical University of Delft, Delft, The Netherlands, 2007. [Google Scholar]
  4. Kerneïs, A.; Nakache, F.; Deguin, A.; Feinberg, M. The effects of water residence time on the biological quality in a distribution network. Water Res. 1995, 29, 1719–1727. [Google Scholar] [CrossRef]
  5. Uhl, W.; Schaule, G. Establishment of HPC(R2A) for regrowth control in non-chlorinated distribution systems. Int. J. Food Microbiol. 2004, 92, 317–325. [Google Scholar] [CrossRef] [PubMed]
  6. Nescerecka, A.; Rubulis, J.; Vital, M.; Juhna, T.; Hammes, F. Biological instability in a chlorinated drinking water distribution network. PLoS ONE 2014, 9, e96354. [Google Scholar] [CrossRef] [PubMed]
  7. Prest, E.I.E.D. Biological Stability in drinking Water Distribution Systems: A Novel Approach for Systematic Microbial Water Quality Monitoring. Ph.D. Thesis, Delft University of Technology, Delft, The Netherlands, 2015. [Google Scholar]
  8. Andrade, M.A.; Choi, C.Y.; Lansey, K.; Jung, D. Enhanced artificial neural networks estimating water quality constraints for the optimal water distribution systems design. J. Water Resour. Plan. Manag. 2016, 142, 04016024. [Google Scholar] [CrossRef]
  9. Quintiliani, C.; Alfonso, L.; Di Cristo, C.; Leopardi, A.; de Marinis, G. Exploring the use of operational interventions in water distribution systems to reduce the formation of TTHMs. Procedia Eng. 2017, 186, 475–482. [Google Scholar] [CrossRef]
  10. Shokoohi, M.; Tabesh, M.; Nazif, S.; Dini, M. Water quality based multi-objective optimal design of water distribution systems. Water Resour. Manag. 2017, 31, 93–108. [Google Scholar] [CrossRef]
  11. Prasad, T.D.; Walters, G.A. Minimizing residence times by rerouting flows to improve water quality in distribution networks. Eng. Optim. 2006, 38, 923–939. [Google Scholar] [CrossRef]
  12. NIFV. Fire Fatalities during the Period from 2001 to 2015 (In Dutch: Dodelijke Slachtoffers bij Branden Periode 2001 t/m 2015); Nederlands Instituut Fysieke Veiligheid (NIFV): Arnhem, The Netherlands, 2001–2015. [Google Scholar]
  13. Bukowski, R.W.; Waterman, T.E.; Christian, W.J. Detector Sensitivity and Siting Requirements for Dwellings: A Report of the NBS Indiana Dunes Tests; NFPA: Quincy, MA, USA, 1975. [Google Scholar]
  14. Bukowski, R.W.; Peacock, R.D.; Averill, J.D.; Cleary, T.G.; Bryner, N.P.; Walton, W.D.; Reneke, P.A.; Kuligowski, E.D. Performance of Home Smoke Alarms Analysis of the Response of Several Available Technologies in Residential Fire Settings; National Institute of Standards and Technology (NIST): Gaithersburg, MD, USA, 2007.
  15. Gadet, B. Private fire service performance. In Lessons to Learn for the Dutch Fire Service? Erasmus University: Rotterdam, The Netherlands, 2009. [Google Scholar]
  16. Hall, J.R.; Ahrens, M.; Evarts, B. Sprinkler impact on fire injury. In Sprinkler Impact on Fire Injury; NFPA: Quincy, MA, USA, 2012. [Google Scholar]
  17. Ford, J. Automatic Sprinklers: A 10 Year Study. A Detailed History of the Effects of the Automatic Sprinkler Code in Scottsdale, Arizona; Home Fire Sprinkler Coalition: Frankfort, IL, USA, 1997. [Google Scholar]
  18. Zlatanovic, L.; Vreeburg, J.; Van Der Hoek, J.P.; Poznakovs, I. An experimental study on the spray characteristics of residential sprinklers under low-flow and low-pressure conditions. Fire Saf. J. 2014, 68, 30–40. [Google Scholar] [CrossRef]
  19. Staatscourant. Drinking water decree 2011 (drinkwaterbesluit 2011). In Quality Standards; Official Journal of the Royal Kingdom of The Netherlands: The Hague, The Netherlands, 2011; Volume 293. [Google Scholar]
  20. Lautenschlager, K.; Boon, N.; Wang, Y.; Egli, T.; Hammes, F. Overnight stagnation of drinking water in household taps induces microbial growth and changes in community composition. Water Res. 2010, 44, 4868–4877. [Google Scholar] [CrossRef] [PubMed]
  21. Zlatanović, L.; van der Hoek, J.P.; Vreeburg, J.H.G. An experimental study on the influence of water stagnation and temperature change on water quality in a full-scale domestic drinking water system. Water Res. 2017, 123, 761–772. [Google Scholar] [CrossRef] [PubMed]
  22. Ling, F.; Whitaker, R.; LeChevallier, M.W.; Liu, W.-T. Drinking water microbiome assembly induced by water stagnation. ISME J. 2018, 1. [Google Scholar] [CrossRef] [PubMed]
  23. Lehtola, M.; Miettinen, I.; Hirvonen, A.; Vartiainen, T.; Martikainen, P. Estimates of microbial quality and concentration of copper in distributed drinking water are highly dependent on sampling strategy. Int. J. Hyg. Environ. Health 2007, 210, 725–732. [Google Scholar] [CrossRef] [PubMed]
  24. Zhang, L.; Liu, S.; Liu, W. Investigation of organic matter migrating from polymeric pipes into drinking water under different flow manners. Environ. Sci. Process. Impacts 2014, 16, 280–290. [Google Scholar] [CrossRef] [PubMed]
  25. Sarver, E.; Zhang, Y.; Edwards, M. Understanding dezincification failures in premise plumbing systems. In Proceedings of the Water Quality Technology Conference and Exposition 2009, Seattle, WA, USA, 15–18 November 2009; pp. 3592–3619. [Google Scholar]
  26. NEN. General Requirements for Water Supply Installations; NEN: Delft, The Netherlands, 2002; Volume 1006. [Google Scholar]
  27. Zlatanovic, L.; Moerman, A.; van der Hoek, J.P.; Vreeburg, J.; Blokker, M. Development and validation of a drinking water temperature model in domestic drinking water supply systems. Urban Water J. 2017, 14, 1031–1037. [Google Scholar] [CrossRef]
  28. Chao, A. Nonparametric estimation of the number of classes in a population. Scand. J. Stat. 1984, 11, 265–270. [Google Scholar]
  29. Ludwig, J.A.; Reynolds, J.F. Statistical Ecology: A Primer in Methods and Computing; John Wiley & Sons: New York, NY, USA, 1988; Volume 1. [Google Scholar]
  30. Mulder, C.P.H.; Bazeley-White, E.; Dimitrakopoulos, P.G.; Hector, A.; Scherer-Lorenzen, M.; Schmid, B. Species evenness and productivity in experimental plant communities. Oikos 2004, 107, 50–63. [Google Scholar] [CrossRef]
  31. Good, I.J. The population frequencies of species and the estimation of population parameters. Biometrika 1953, 40, 237–264. [Google Scholar] [CrossRef]
  32. Lytle, D.A.; Schock, M.R. Impact of stagnation time on metal dissolution from plumbing materials in drinking water. J. Water Supply Res. Technol. AQUA 2000, 49, 243–257. [Google Scholar]
  33. Merkel, T.H.; Groß, H.J.; Werner, W.; Dahlke, T.; Reicherter, S.; Beuchle, G.; Eberle, S.H. Copper corrosion by-product release in long-term stagnation experiments. Water Res. 2002, 36, 1547–1555. [Google Scholar] [CrossRef]
  34. Lehtola, M.J.; Miettinen, I.T.; Hirvonen, A.; Vartiainen, T.; Martikainen, P.J. Estimates of microbial quality and concentration of copper in distributed drinking water are highly dependent on sampling strategy. Int. J. Hyg. Environ. Health 2007, 210, 725–732. [Google Scholar] [CrossRef] [PubMed]
  35. WHO. Copper in Drinking-Water: Background Document for Development of Who Guidelines for Drinking-Water Quality; WHO: Geneva, Switzerland, 2004. [Google Scholar]
  36. Lytle, D.A.; Schock, M.R. Stagnation Time, Composition, PH, and Orthophosphate Effects on Metal Leaching from Brass; National Risk Management Research Laboratory, Office of Research and Development, US Environmental Protection Agency: Washington, DC, USA, 1996.
  37. Quevauviller, P.; Thompson, C. Analytical Methods for Drinking Water: Advances in Sampling and Analysis; John Wiley & Sons: New York, NY, USA, 2005; Volume 26. [Google Scholar]
  38. Sorlini, S.; Gialdini, F.; Collivignarelli, C. Metal leaching in drinking water domestic distribution system: An Italian case study. Int. J. Environ. Health Res. 2014, 24, 497–514. [Google Scholar] [CrossRef] [PubMed]
  39. Coker, A.K. Ludwig’s Applied Process Design for Chemical and Petrochemical Plants, 4th ed.; Elsevier: Burlington, MA, USA, 2010; Volume 2, pp. 1–961. [Google Scholar]
  40. WHO. Zinc in Drinking-Water: Background Document for Development of Who Guidelines for Drinking-Water Quality; WHO: Geneva, Switzerland, 2003. [Google Scholar]
  41. Edwards, M.; Sprague, N. Organic matter and copper corrosion by-product release: A mechanistic study. Corros. Sci. 2001, 43, 1–18. [Google Scholar] [CrossRef]
  42. Momba, M.N.B.; Kfir, R.; Venter, S.N.; Cloete, T.E. Overview of Biofilm Formation in Distribution Systems and Its Impact on the Deterioration of Water Quality; Water Research Commission: Gezina, South Africa, 2000. [Google Scholar]
  43. Tao, Q.; Liu, Z.; Dai, Y.; Zhan, X. Biosorption properties of extracellular polymeric substances towards Zn (II) and Cu (II). Desalin. Water Treat. 2012, 45, 40–47. [Google Scholar]
  44. Wang, Z.; Hessler, C.M.; Xue, Z.; Seo, Y. The role of extracellular polymeric substances on the sorption of natural organic matter. Water Res. 2012, 46, 1052–1060. [Google Scholar] [CrossRef] [PubMed]
  45. Prest, E.I.; Hammes, F.; van Loosdrecht, M.; Vrouwenvelder, J.S. Biological stability of drinking water: Controlling factors, methods, and challenges. Front. Microbiol. 2016, 7, 45. [Google Scholar] [CrossRef] [PubMed]
  46. LeChevallier, M.W.; Welch, N.J.; Smith, D.B. Full-scale studies of factors related to coliform regrowth in drinking water. Appl. Environ. Microbiol. 1996, 62, 2201–2211. [Google Scholar] [PubMed]
  47. Volk, C.; Dundore, E.; Schiermann, J.; LeChevallier, M.W. Practical evaluation of iron corrosion control in a drinking water distribution system. Water Res. 2000, 34, 1967–1974. [Google Scholar] [CrossRef]
  48. Liu, G.; Van Der Mark, E.J.; Verberk, J.Q.J.C.; Van Dijk, J.C. Flow cytometry total cell counts: A field study assessing microbiological water quality and growth in unchlorinated drinking water distribution systems. BioMed Res. Int. 2013, 2013, 595872. [Google Scholar] [CrossRef] [PubMed]
  49. Wang, Y.; Hammes, F.; Boon, N.; Chami, M.; Egli, T. Isolation and characterization of low nucleic acid (LNA)-content bacteria. ISME J. 2009, 3, 889–902. [Google Scholar] [CrossRef] [PubMed]
  50. Prest, E.I.; Hammes, F.; Kötzsch, S.; van Loosdrecht, M.C.M.; Vrouwenvelder, J.S. Monitoring microbiological changes in drinking water systems using a fast and reproducible flow cytometric method. Water Res. 2013, 47, 7131–7142. [Google Scholar] [CrossRef] [PubMed]
  51. Lipphaus, P.; Hammes, F.; Kötzsch, S.; Green, J.; Gillespie, S.; Nocker, A. Microbiological tap water profile of a medium-sized building and effect of water stagnation. Environ. Technol. 2014, 35, 620–628. [Google Scholar] [CrossRef] [PubMed]
  52. Zhang, H.H.; Chen, S.N.; Huang, T.L.; Shang, P.L.; Yang, X.; Ma, W.X. Indoor heating drives water bacterial growth and community metabolic profile changes in building tap pipes during the winter season. Int. J. Environ. Res. Public Health 2015, 12, 13649–13661. [Google Scholar] [CrossRef] [PubMed]
  53. Boe-Hansen, R.; Albrechtsen, H.J.; Arvin, E.; Jørgensen, C. Bulk water phase and biofilm growth in drinking water at low nutrient conditions. Water Res. 2002, 36, 4477–4486. [Google Scholar] [CrossRef]
  54. Morita, R.Y. Bacteria in Oligotrophic Environments: Starvation-Survival Lifestyle; Chapman & Hall: New York, NY, USA, 1997; Volume 1. [Google Scholar]
  55. Fang, H.; Chen, Y.; Huang, L.; He, G. Analysis of biofilm bacterial communities under different shear stresses using size-fractionated sediment. Sci. Rep. 2017, 7, 1299. [Google Scholar] [CrossRef] [PubMed]
  56. Kalmbach, S.; Manz, W.; Szewzyk, U. Isolation of new bacterial species from drinking water biofilms and proof of their in situ dominance with highly specific 16S rRNA probes. Appl. Environ. Microbiol. 1997, 63, 4164–4170. [Google Scholar] [PubMed]
  57. Liu, G. Microbiological Water Quality in Drinking Water Distribution Systems: Integral Study of Bulk Water, Suspended Solids, Loose Deposits, and Pipe Wall Biofilm (Chapter 5). Ph.D. Thesis, Technische Universiteit Delf, Delft, The Netherlands, 2013. [Google Scholar]
  58. Lehtola, M.J.; Laxander, M.; Miettinen, I.T.; Hirvonen, A.; Vartiainen, T.; Martikainen, P.J. The effects of changing water flow velocity on the formation of biofilms and water quality in pilot distribution system consisting of copper or polyethylene pipes. Water Res. 2006, 40, 2151–2160. [Google Scholar] [CrossRef] [PubMed]
  59. Boe-Hansen, R. Microbial Growth in Drinking Water Distribution Systems; Environment & Resources, DTU: Copenhagen, Denmark, 2001. [Google Scholar]
  60. Lehtola, M.J.; Miettinen, I.T.; Keinänen, M.M.; Kekki, T.K.; Laine, O.; Hirvonen, A.; Vartiainen, T.; Martikainen, P.J. Microbiology, chemistry and biofilm development in a pilot drinking water distribution system with copper and plastic pipes. Water Res. 2004, 38, 3769–3779. [Google Scholar] [CrossRef] [PubMed]
  61. Inkinen, J.; Kaunisto, T.; Pursiainen, A.; Miettinen, I.T.; Kusnetsov, J.; Riihinen, K.; Keinänen-Toivola, M.M. Drinking water quality and formation of biofilms in an office building during its first year of operation, a full scale study. Water Res. 2014, 49, 83–91. [Google Scholar] [CrossRef] [PubMed]
  62. Keinänen, M.M.; Korhonen, L.K.; Lehtola, M.J.; Miettinen, I.T.; Martikainen, P.J.; Vartiainen, T.; Suutari, M.H. The microbial community structure of drinking water biofilms can be affected by phosphorus availability. Appl. Environ. Microbiol. 2002, 68, 434–439. [Google Scholar] [CrossRef] [PubMed]
  63. Inkinen, J.; Jayaprakash, B.; Santo Domingo, J.W.; Keinänen-Toivola, M.M.; Ryu, H.; Pitkänen, T. Diversity of ribosomal 16S DNA-and rna-based bacterial community in an office building drinking water system. J. Appl. Microbiol. 2016, 120, 1723–1738. [Google Scholar] [CrossRef] [PubMed]
  64. Eichler, S.; Christen, R.; Höltje, C.; Westphal, P.; Bötel, J.; Brettar, I.; Mehling, A.; Höfle, M.G. Composition and dynamics of bacterial communities of a drinking water supply system as assessed by RNA- and DNA-based 16s rRNA gene fingerprinting. Appl. Environ. Microbiol. 2006, 72, 1858–1872. [Google Scholar] [CrossRef] [PubMed]
  65. Lührig, K.; Canbäck, B.; Paul, C.J.; Johansson, T.; Persson, K.M.; Rådström, P. Bacterial community analysis of drinking water biofilms in southern Sweden. Microbes Environ. 2015, 30, 99–107. [Google Scholar] [CrossRef] [PubMed]
  66. Magic-Knezev, A.; Wullings, B.; Van der Kooij, D. Polaromonas and hydrogenophaga species are the predominant bacteria cultured from granular activated carbon filters in water treatment. J. Appl. Microbiol. 2009, 107, 1457–1467. [Google Scholar] [CrossRef] [PubMed]
Figure 1. Axonometric scheme of the test rigs: (a) Conventional system (CS); (b) Extended system (ES). Blue line—cold water, red line—hot water. 1st floor: Guest toilet taps—toilet cistern and toilet sink; kitchen taps—cold and hot and dishwasher. 2nd floor: Bathroom taps—toilet cistern, shower taps—cold and hot, wash basin taps—cold and hot; 3rd floor: Washing machine tap. Vertical copper tube of 22 mm diameter—carrying cold water to the upper floors, vertical copper tube of 15 mm—delivering hot water from a 50 L water heater and copper tubing’s of 15 mm—supplying cold and hot water from the vertical pipes to the 11 plumbing fixtures (solenoid valves). CS—The total length of the pipes was 48.6 m and the volume of the plumbing rig was ~6 L. ES has additional loops of 22 mm diameter piping on each floor, and the total length of the piping in the extended system was 116 m and the volume was ~29 L.
Water 10 00582 g001aWater 10 00582 g001b
Figure 2. Copper (left) and zinc (right) concentrations in fresh water (FW) and stagnant water (SW) in the conventional (CS) and extended (E-S) system at the kitchen tap (KT) and shower tap (ST). Number of fresh samples (inlet, kitchen and shower) = 48. Number of samples per tap = 16, SDcopper < 2.5%, SDzinc < 2.8%.
Water 10 00582 g002
Figure 3. TOC concentrations in fresh (FW) and stagnant water samples (SW) in the conventional (CS) and extended system (ES) at the kitchen tap (KT) and shower tap (ST). Number of fresh samples (inlet, kitchen and shower) = 48. Number of samples per tap = 16, SD < 2%.
Water 10 00582 g003
Figure 4. HPC levels in fresh water (FW) and stagnant water (SW) in the conventional (CS) and extended (E-S) system at the kitchen tap (KT) and shower tap (ST). Number of fresh samples (inlet, kitchen and shower) = 48. Left: Temperature of fresh water < 15 °C, number of fresh samples = 33, number of stagnant samples per tap = 11. Right: Temperature of fresh water >15 °C, number of fresh samples = 15, Number of stagnant samples per tap = 5; SD < 5%, *—outliers.
Water 10 00582 g004
Figure 5. ATP (up) and ICC-HNA (down) concentrations in fresh water (FW) and stagnant water (SW) in the conventional (CS) and extended system (ES) at the kitchen tap (KT) and shower tap (ST). Number of fresh samples (inlet, kitchen and shower) = 48. Left: Temperature of fresh water < 17 °C, number of fresh samples = 36, number of stagnant samples per tap = 12, SDATP < 4%, SDICC < 4%. Right: Temperature of fresh water >17 °C, number of fresh samples = 12, Number of stagnant samples per tap = 4; *—outliers.
Water 10 00582 g005
Figure 6. Left: Relative abundance of bacterial phyla. Right: Relative abundance of Proteobacteria classes in water from shower tap samples (W_ST) and biofilms (BF) sampled from kitchen (KT) and shower taps (ST) in conventional (CS) and extended system (ES).
Water 10 00582 g006
Figure 7. UPGMA Pearson correlation for the biofilm and water samples at genus level.
Water 10 00582 g007
Table 1. Biofilm characteristics determined by HPC, ATP and FCM measurements from-kitchen and shower tap in conventional and extended systems.
Biofilm SampleHPC [CFU/cm2]ATP [pg/cm2]TCC [105 cell/cm2]ICC [105 cell/cm2]
Kitchen tap—conventional system6.1126.62.9
Kitchen tap—extended system6.9105.43.3
Shower tap—conventional system3.711105.7
Shower tap—extended system0.382.11.5
Table 2. Number of sequences, richness, diversity, evenness indexes and coverage for water samples and biofilm samples harvested from kitchen and shower taps in conventional (CS) and extended system (ES).
SampleNumber of SequencesOTU (97%)Chao IndexShannon IndexEvennessCoverage [%]
Fresh water—shower tap—CS185,546312235096.170.7689
Fresh water—shower tap—ES178,081305634806.150.7688
Biofilm—kitchen tap—CS115,046114419592.670.3858
Biofilm—kitchen tap—ES132,662120216272.950.4160
Biofilm—shower tap—CS79,962131322062.370.3367
Biofilm—shower tap—ES79,38373610862.440.3745

