What Large Sample Size Is Sufficient for Hydrologic Frequency Analysis?—A Rational Argument for a 30-Year Hydrologic Sample Size in Water Resources Management
Abstract
:1. Introduction
2. Physical Mechanism that Restricts the Sample Size
2.1. The Law of Solar Activities Makes the Hydrologic Phenomenon almost Periodic
2.2. Sampling Theory Serving as Theoretical Basis for Sample Size
3. Characteristics of Hydroclimate in China
3.1. Analysis of Water Vapor Sources for China
3.2. Regional Precipitation Cycle Identification
4. Numerical Simulation Verification
4.1. Normal Distribution Simulation
4.2. P-III Distribution
5. Conclusions
5.1. Conclusions
- (1)
- Countries in the East Asian monsoon region such as China, Japan and South Korea all require a sample size of exceeding 30 years in the calculation of hydrologic frequency.
- (2)
- Solar activity makes hydrologic phenomena almost periodic, and the sampling theorem can be used as a theoretical basis to deduce a reasonable sample size for hydrologic frequency calculations.
- (3)
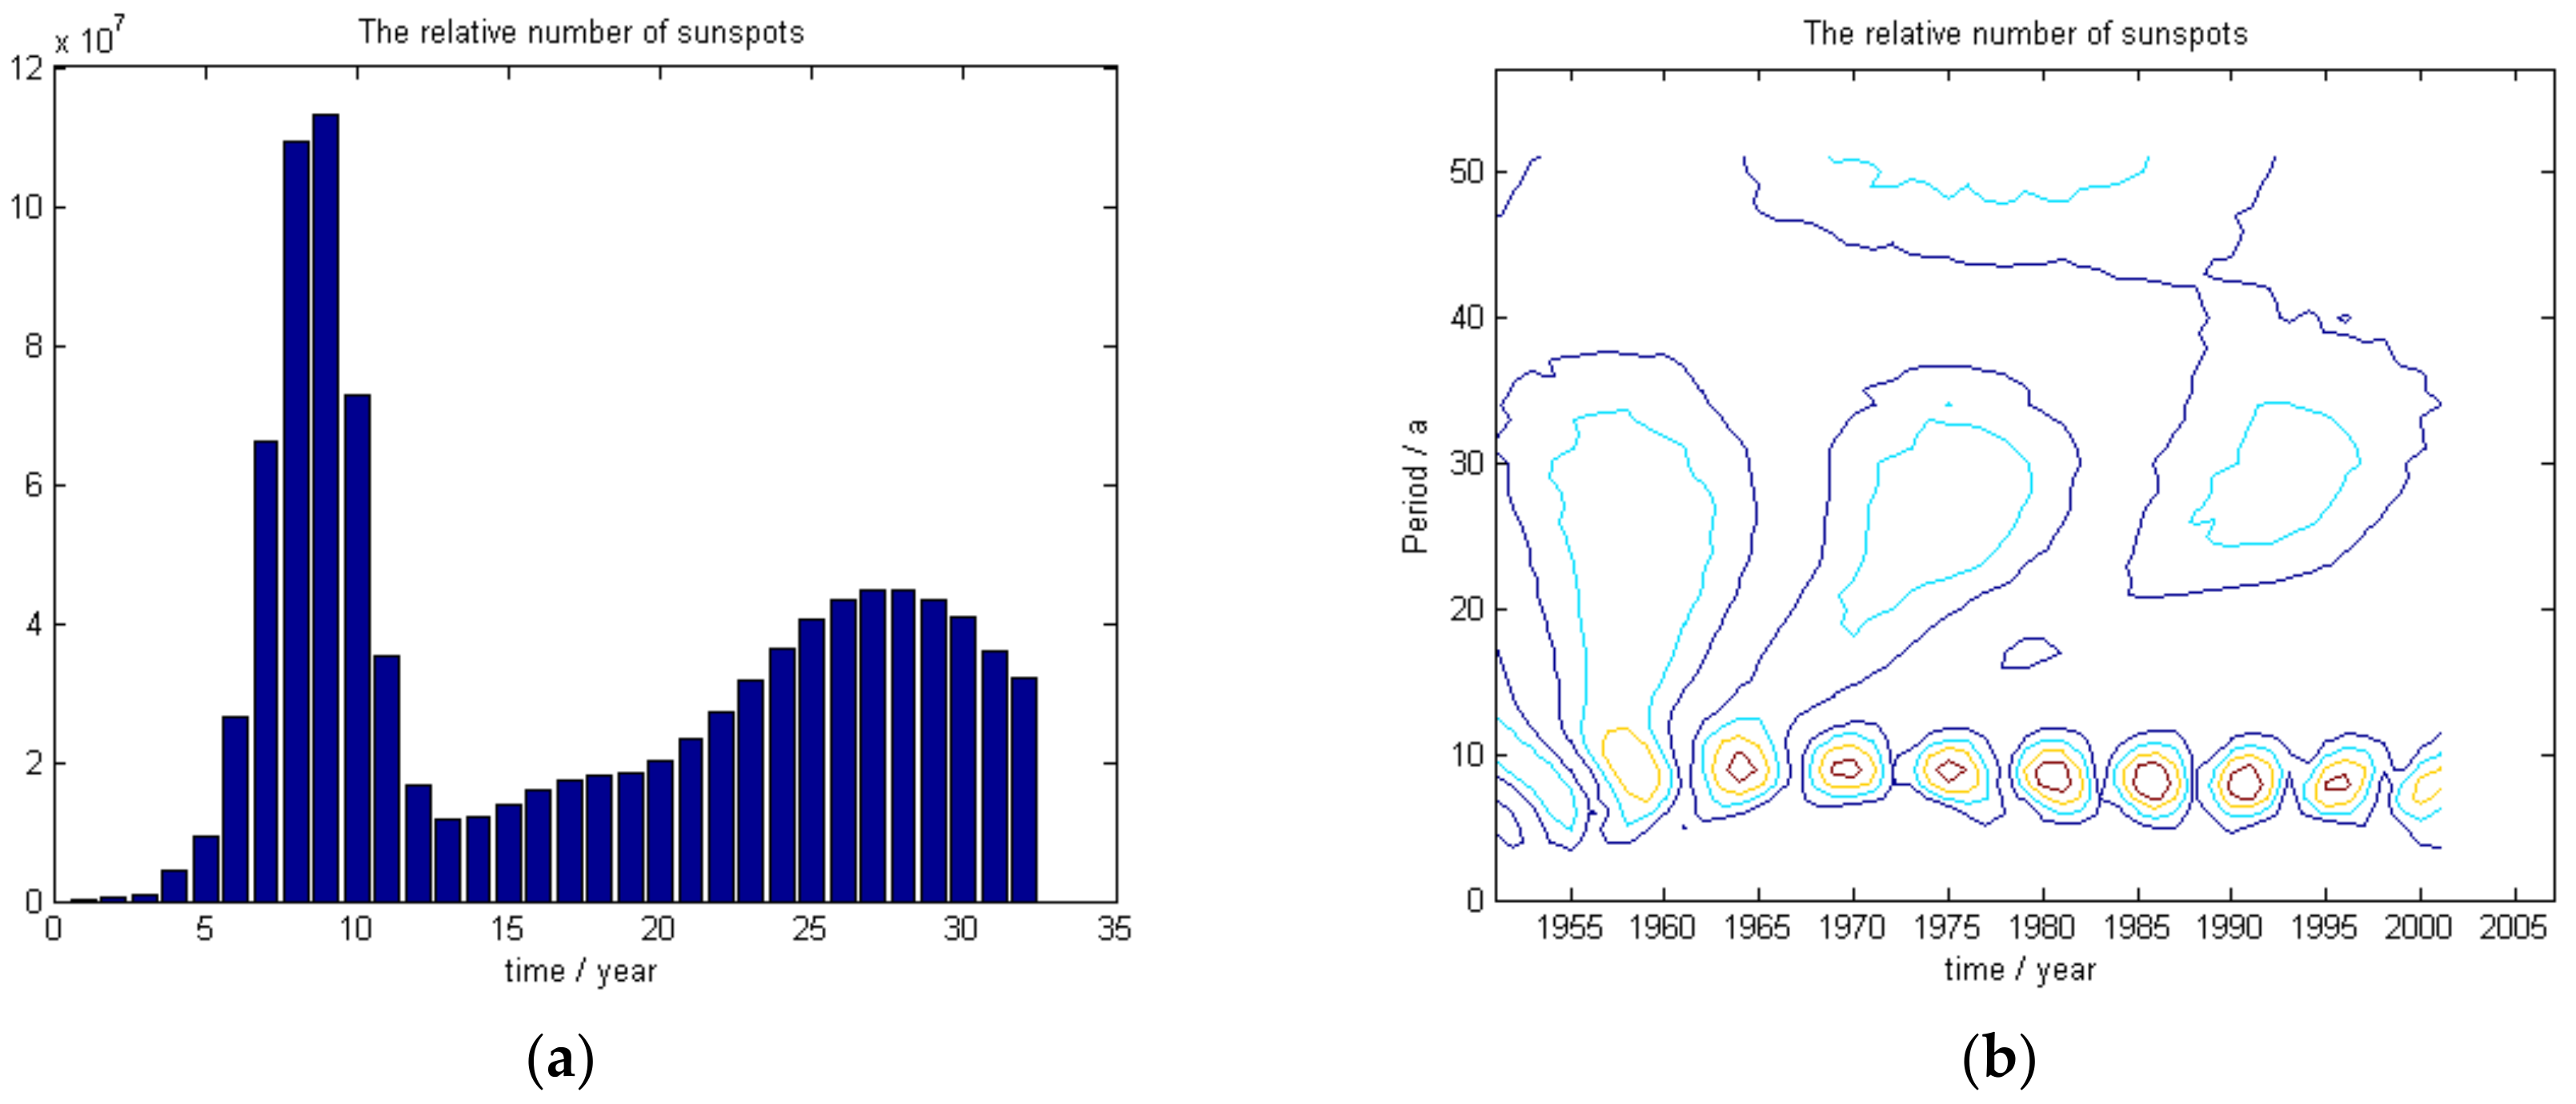
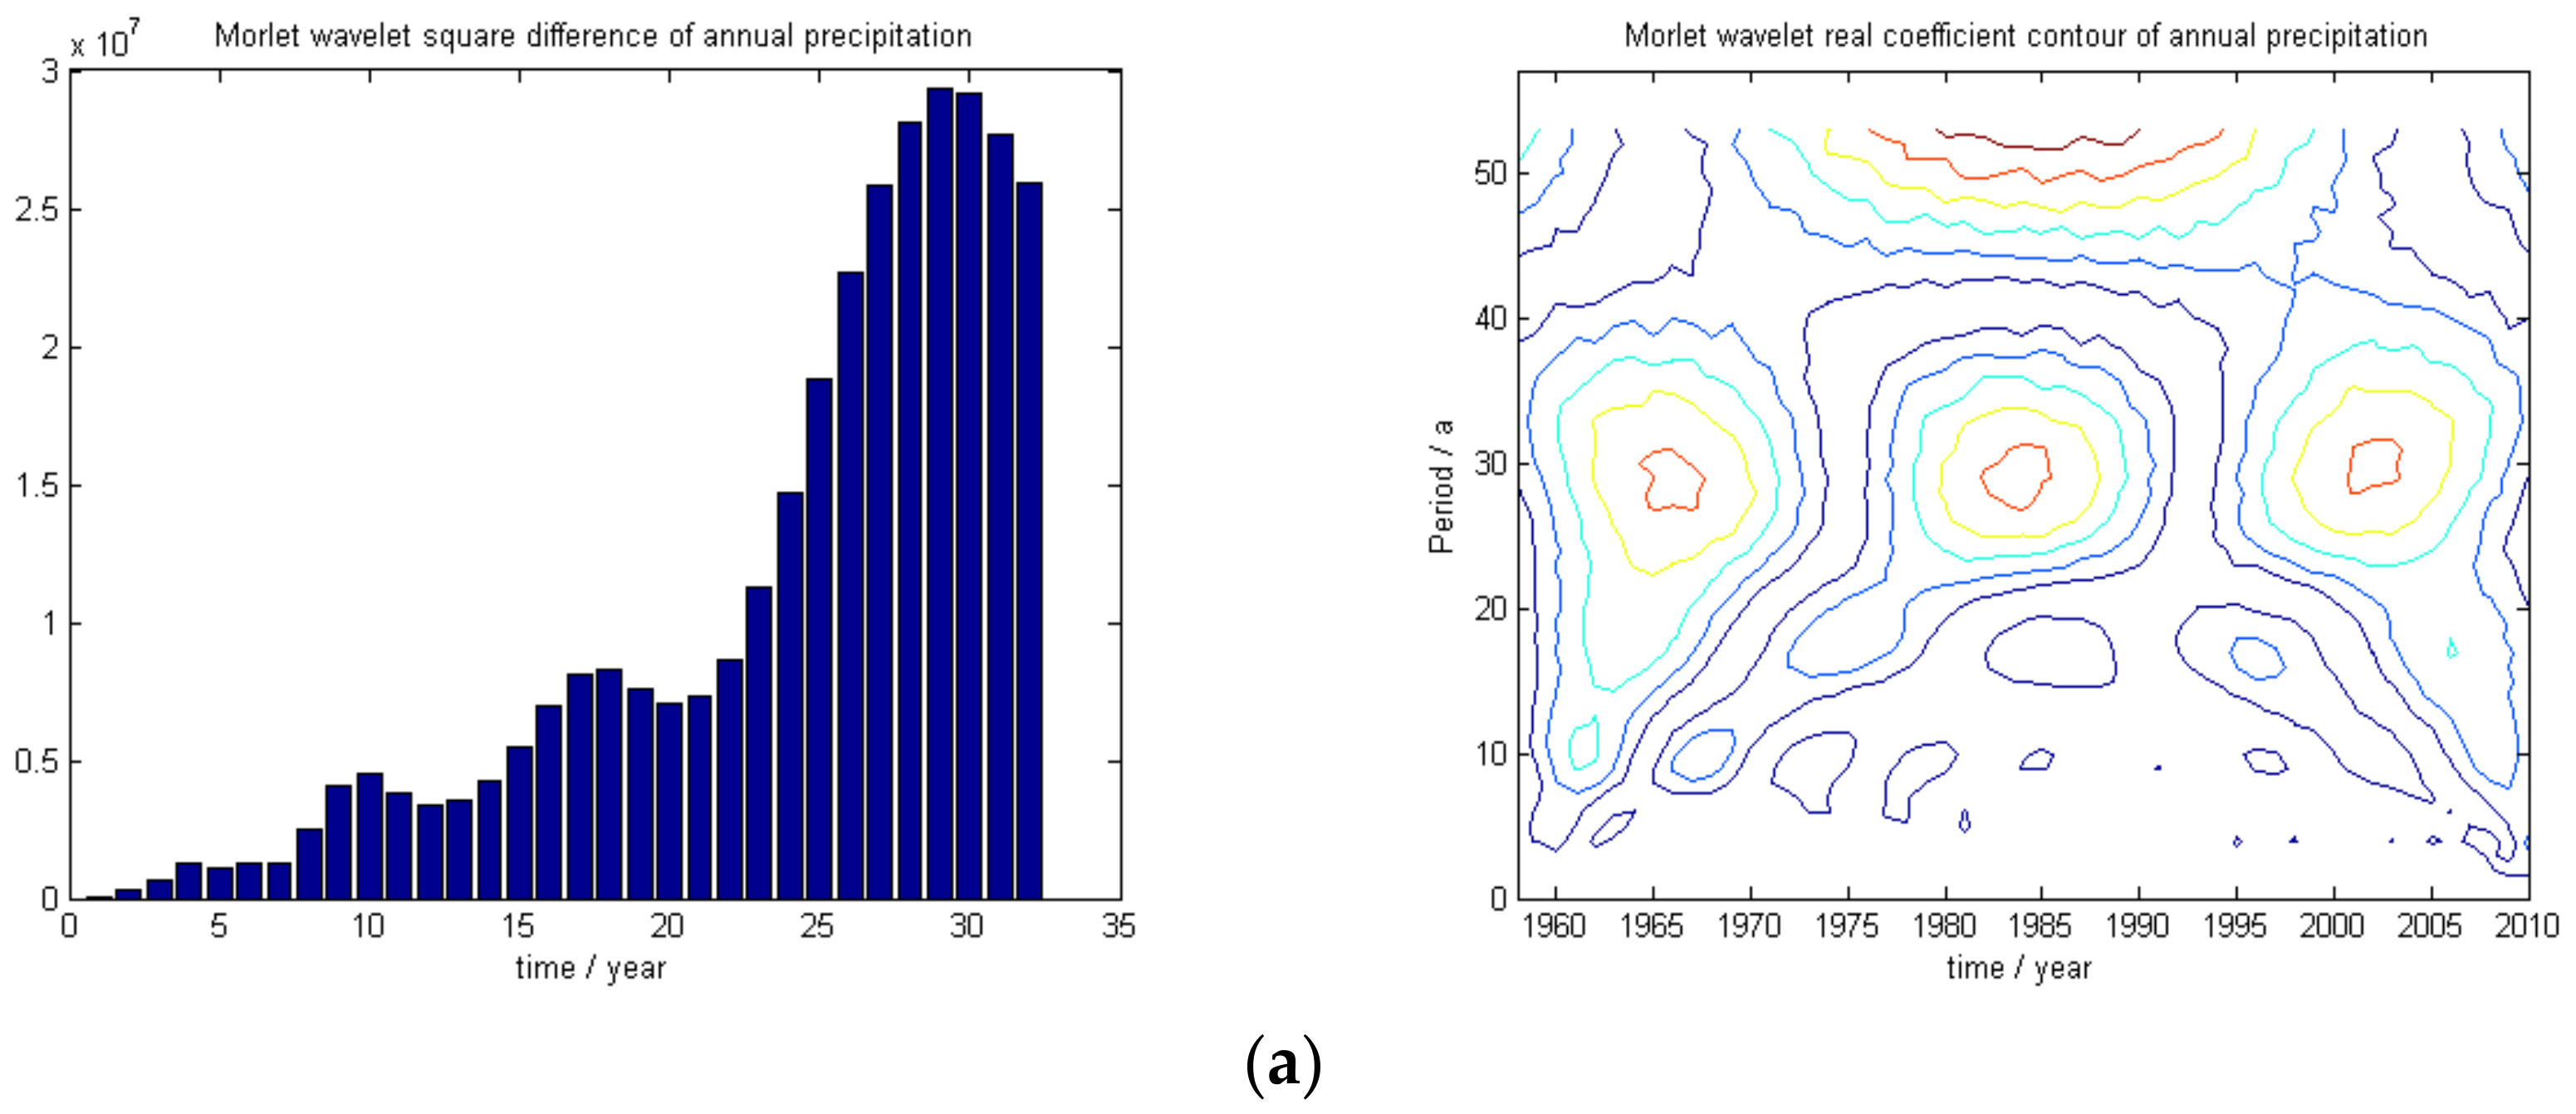
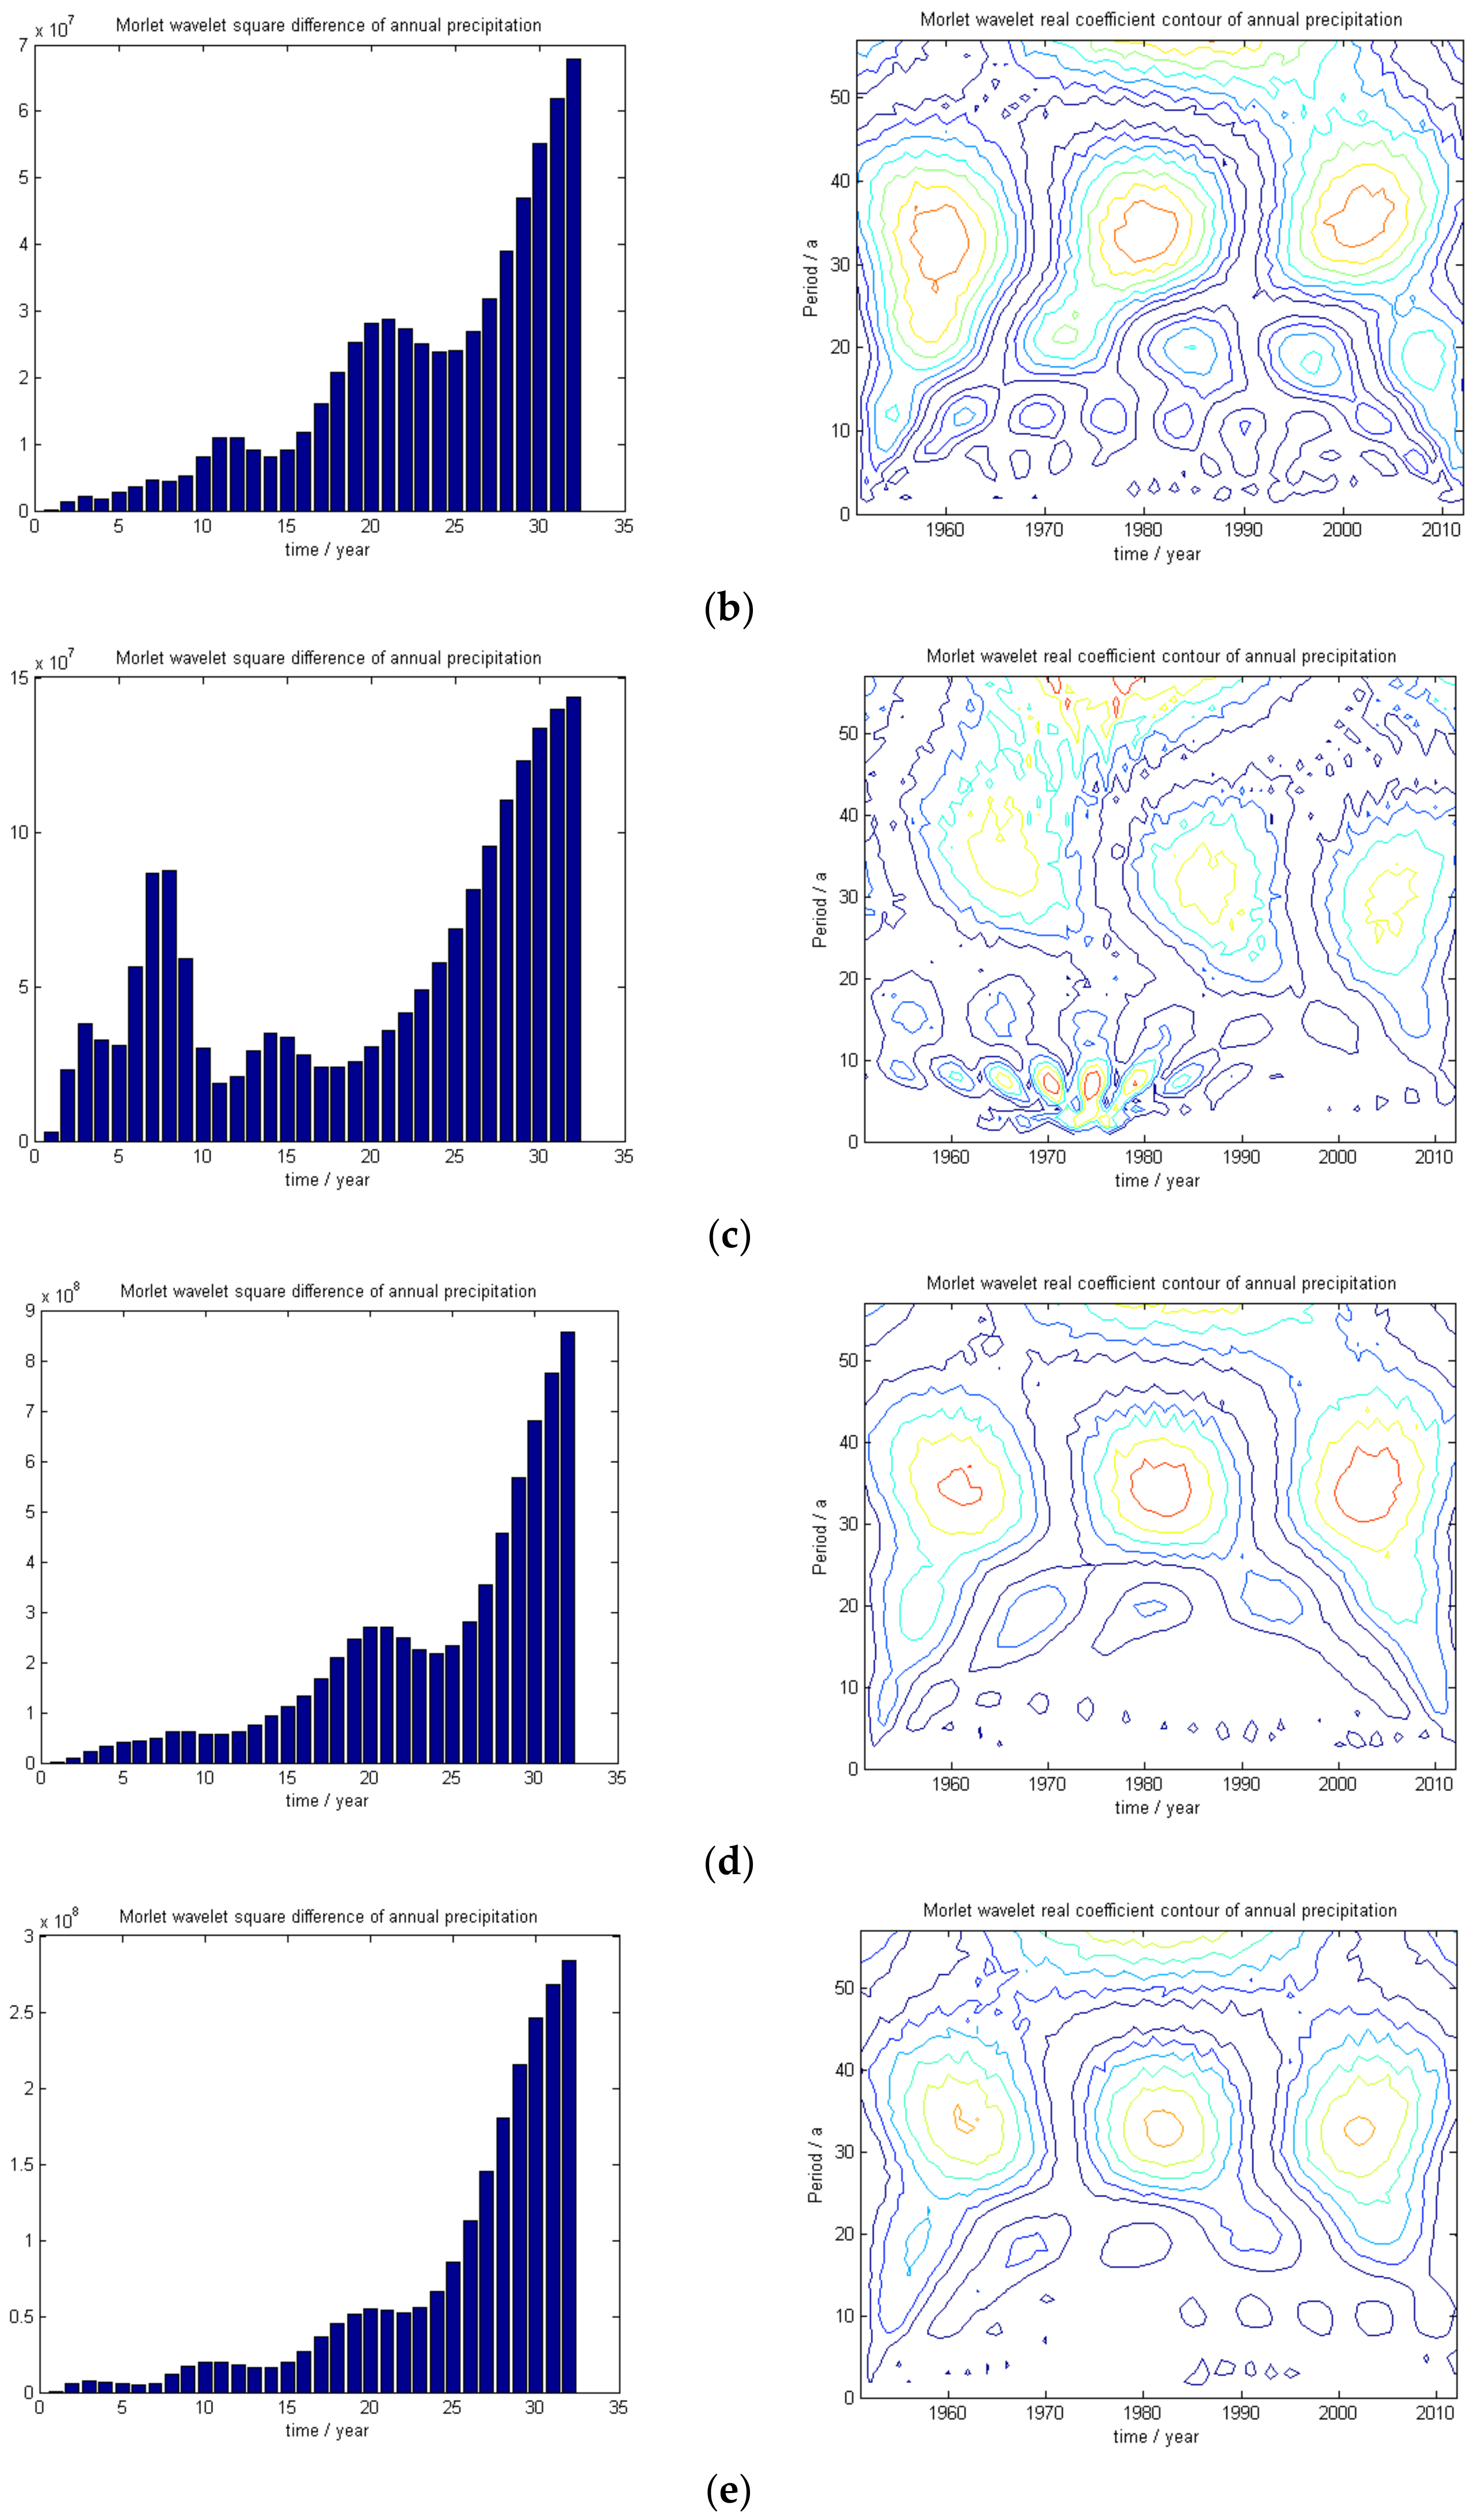
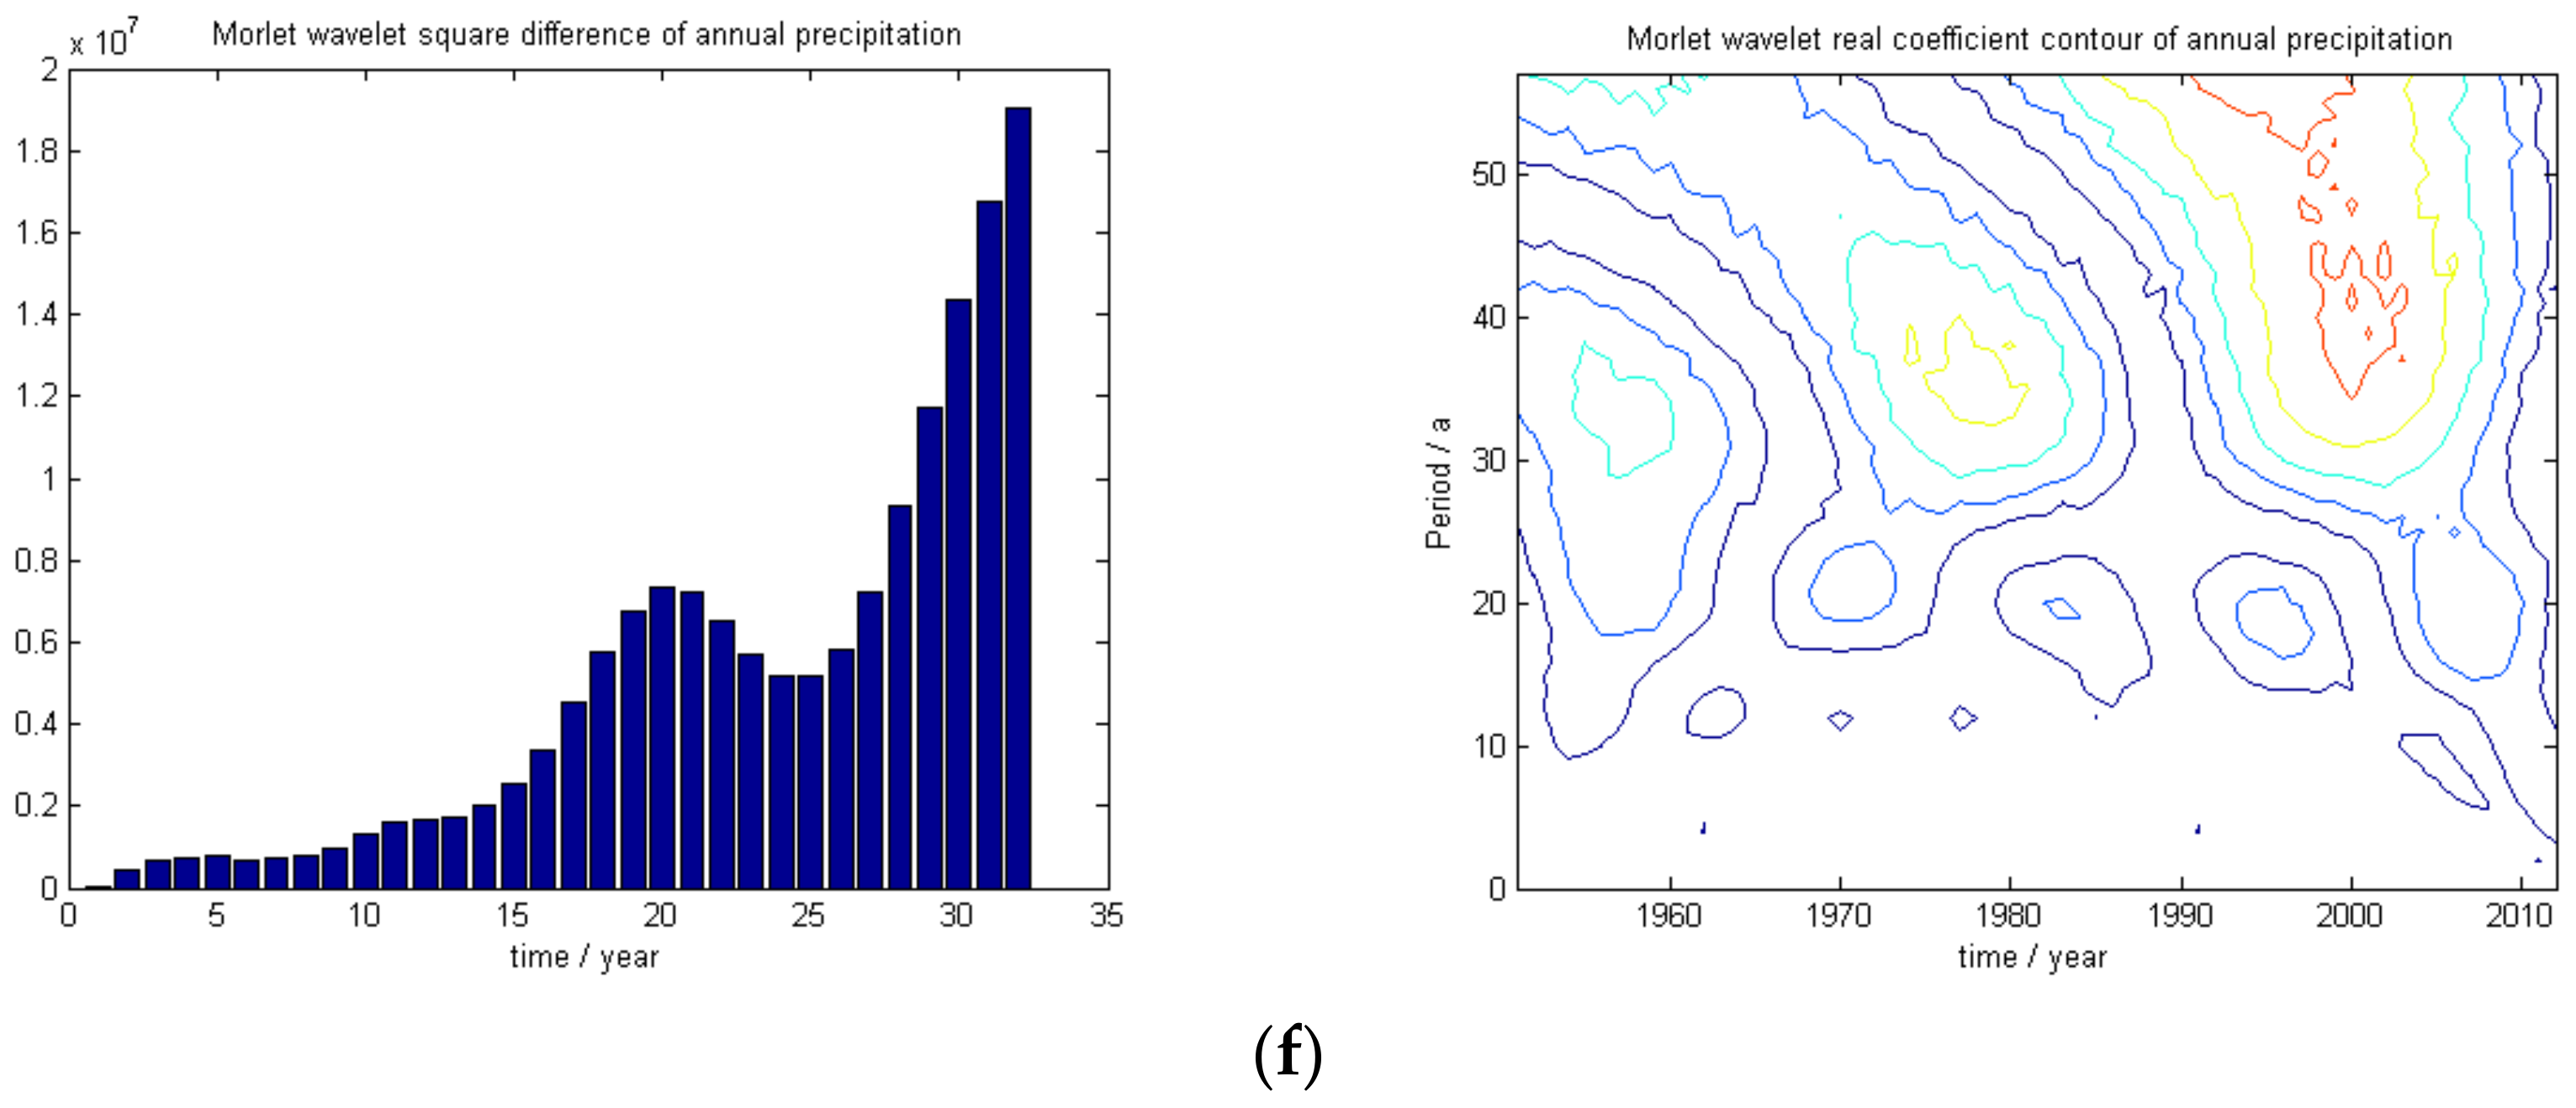
- The wavelet analysis method combined with a long series of sunspot number data and representative station annual precipitation data can be used to show that solar activity is periodic with a cycle of 10 years, that the annual wet-dry cycle of representative precipitation observation stations is periodic with a cycle of 10–12 years, and that the sunspot and precipitation data are consistently aligned.
- (4)
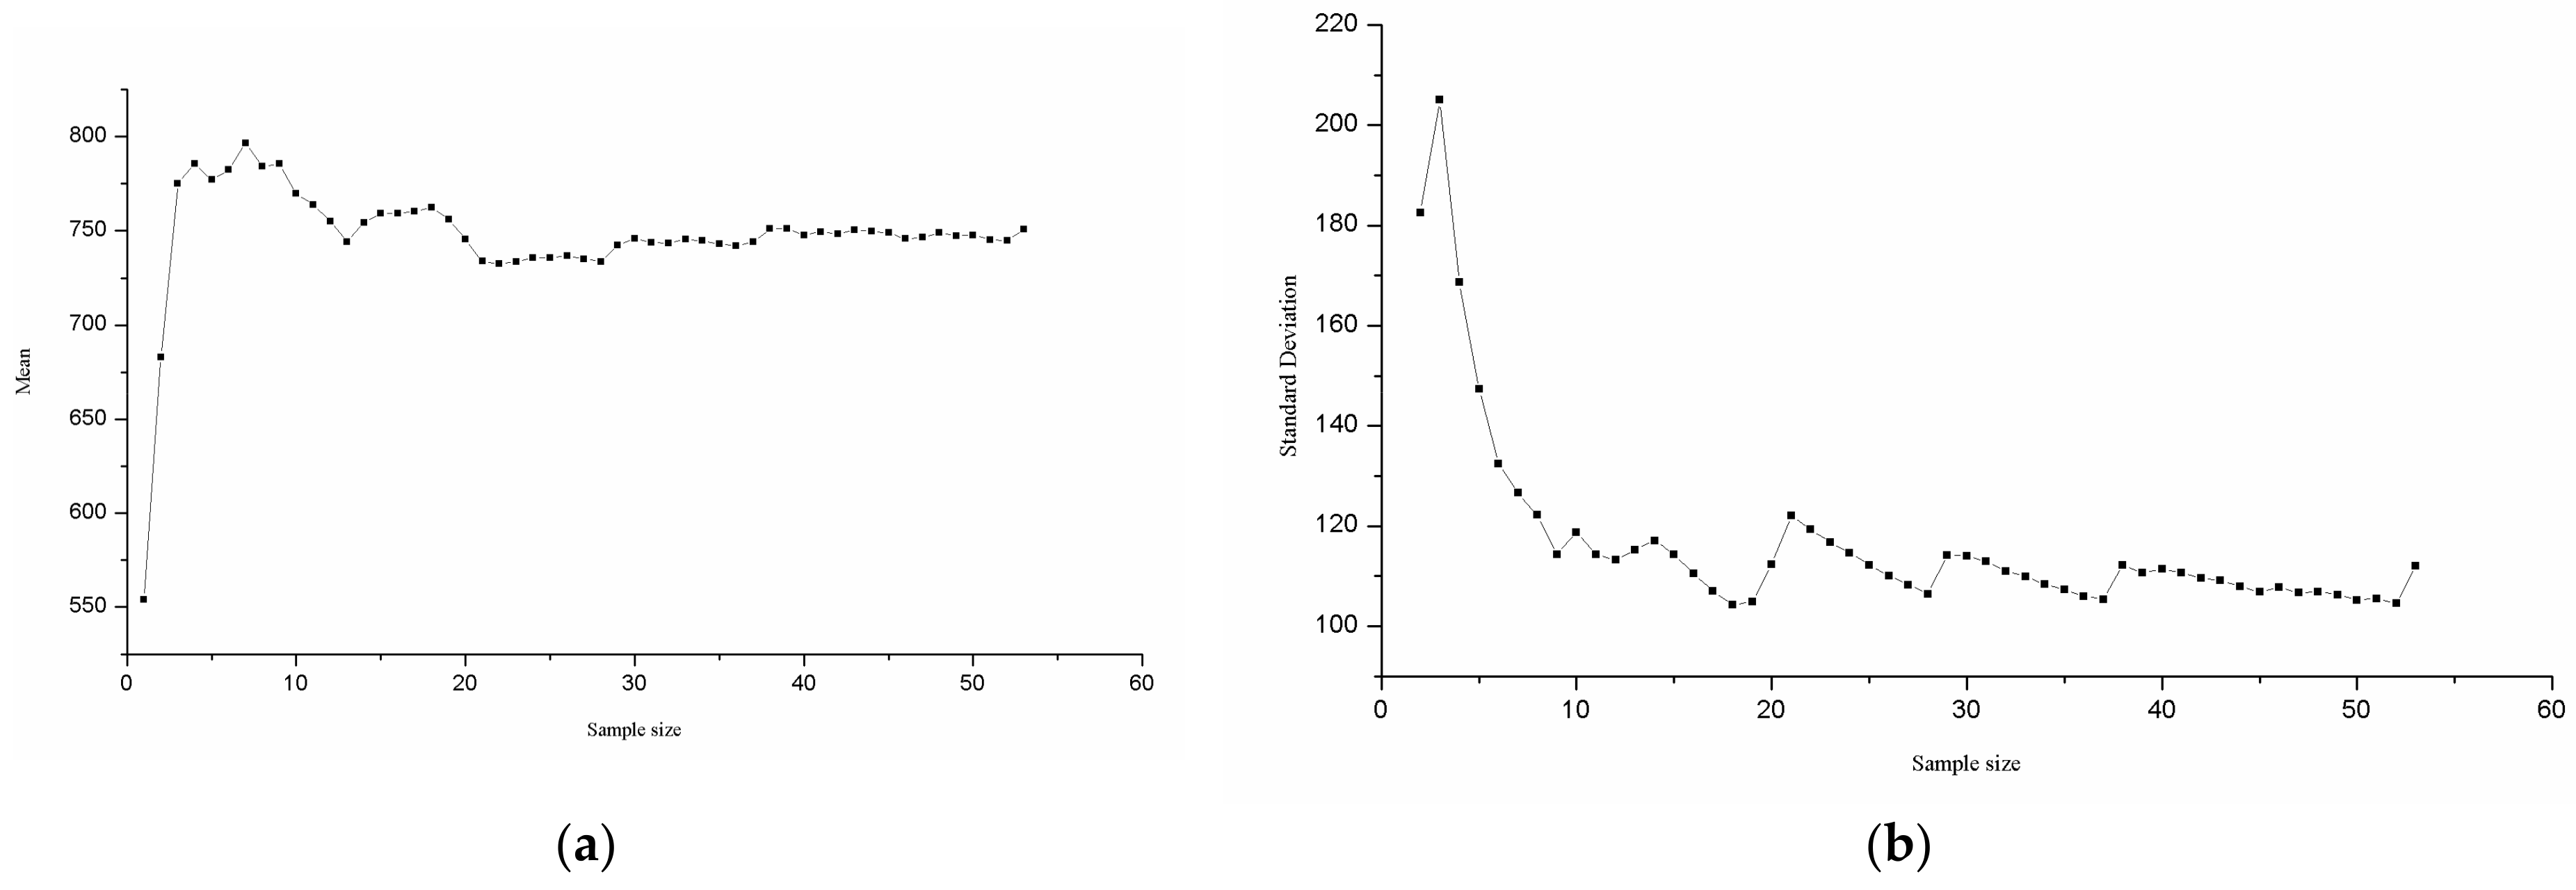
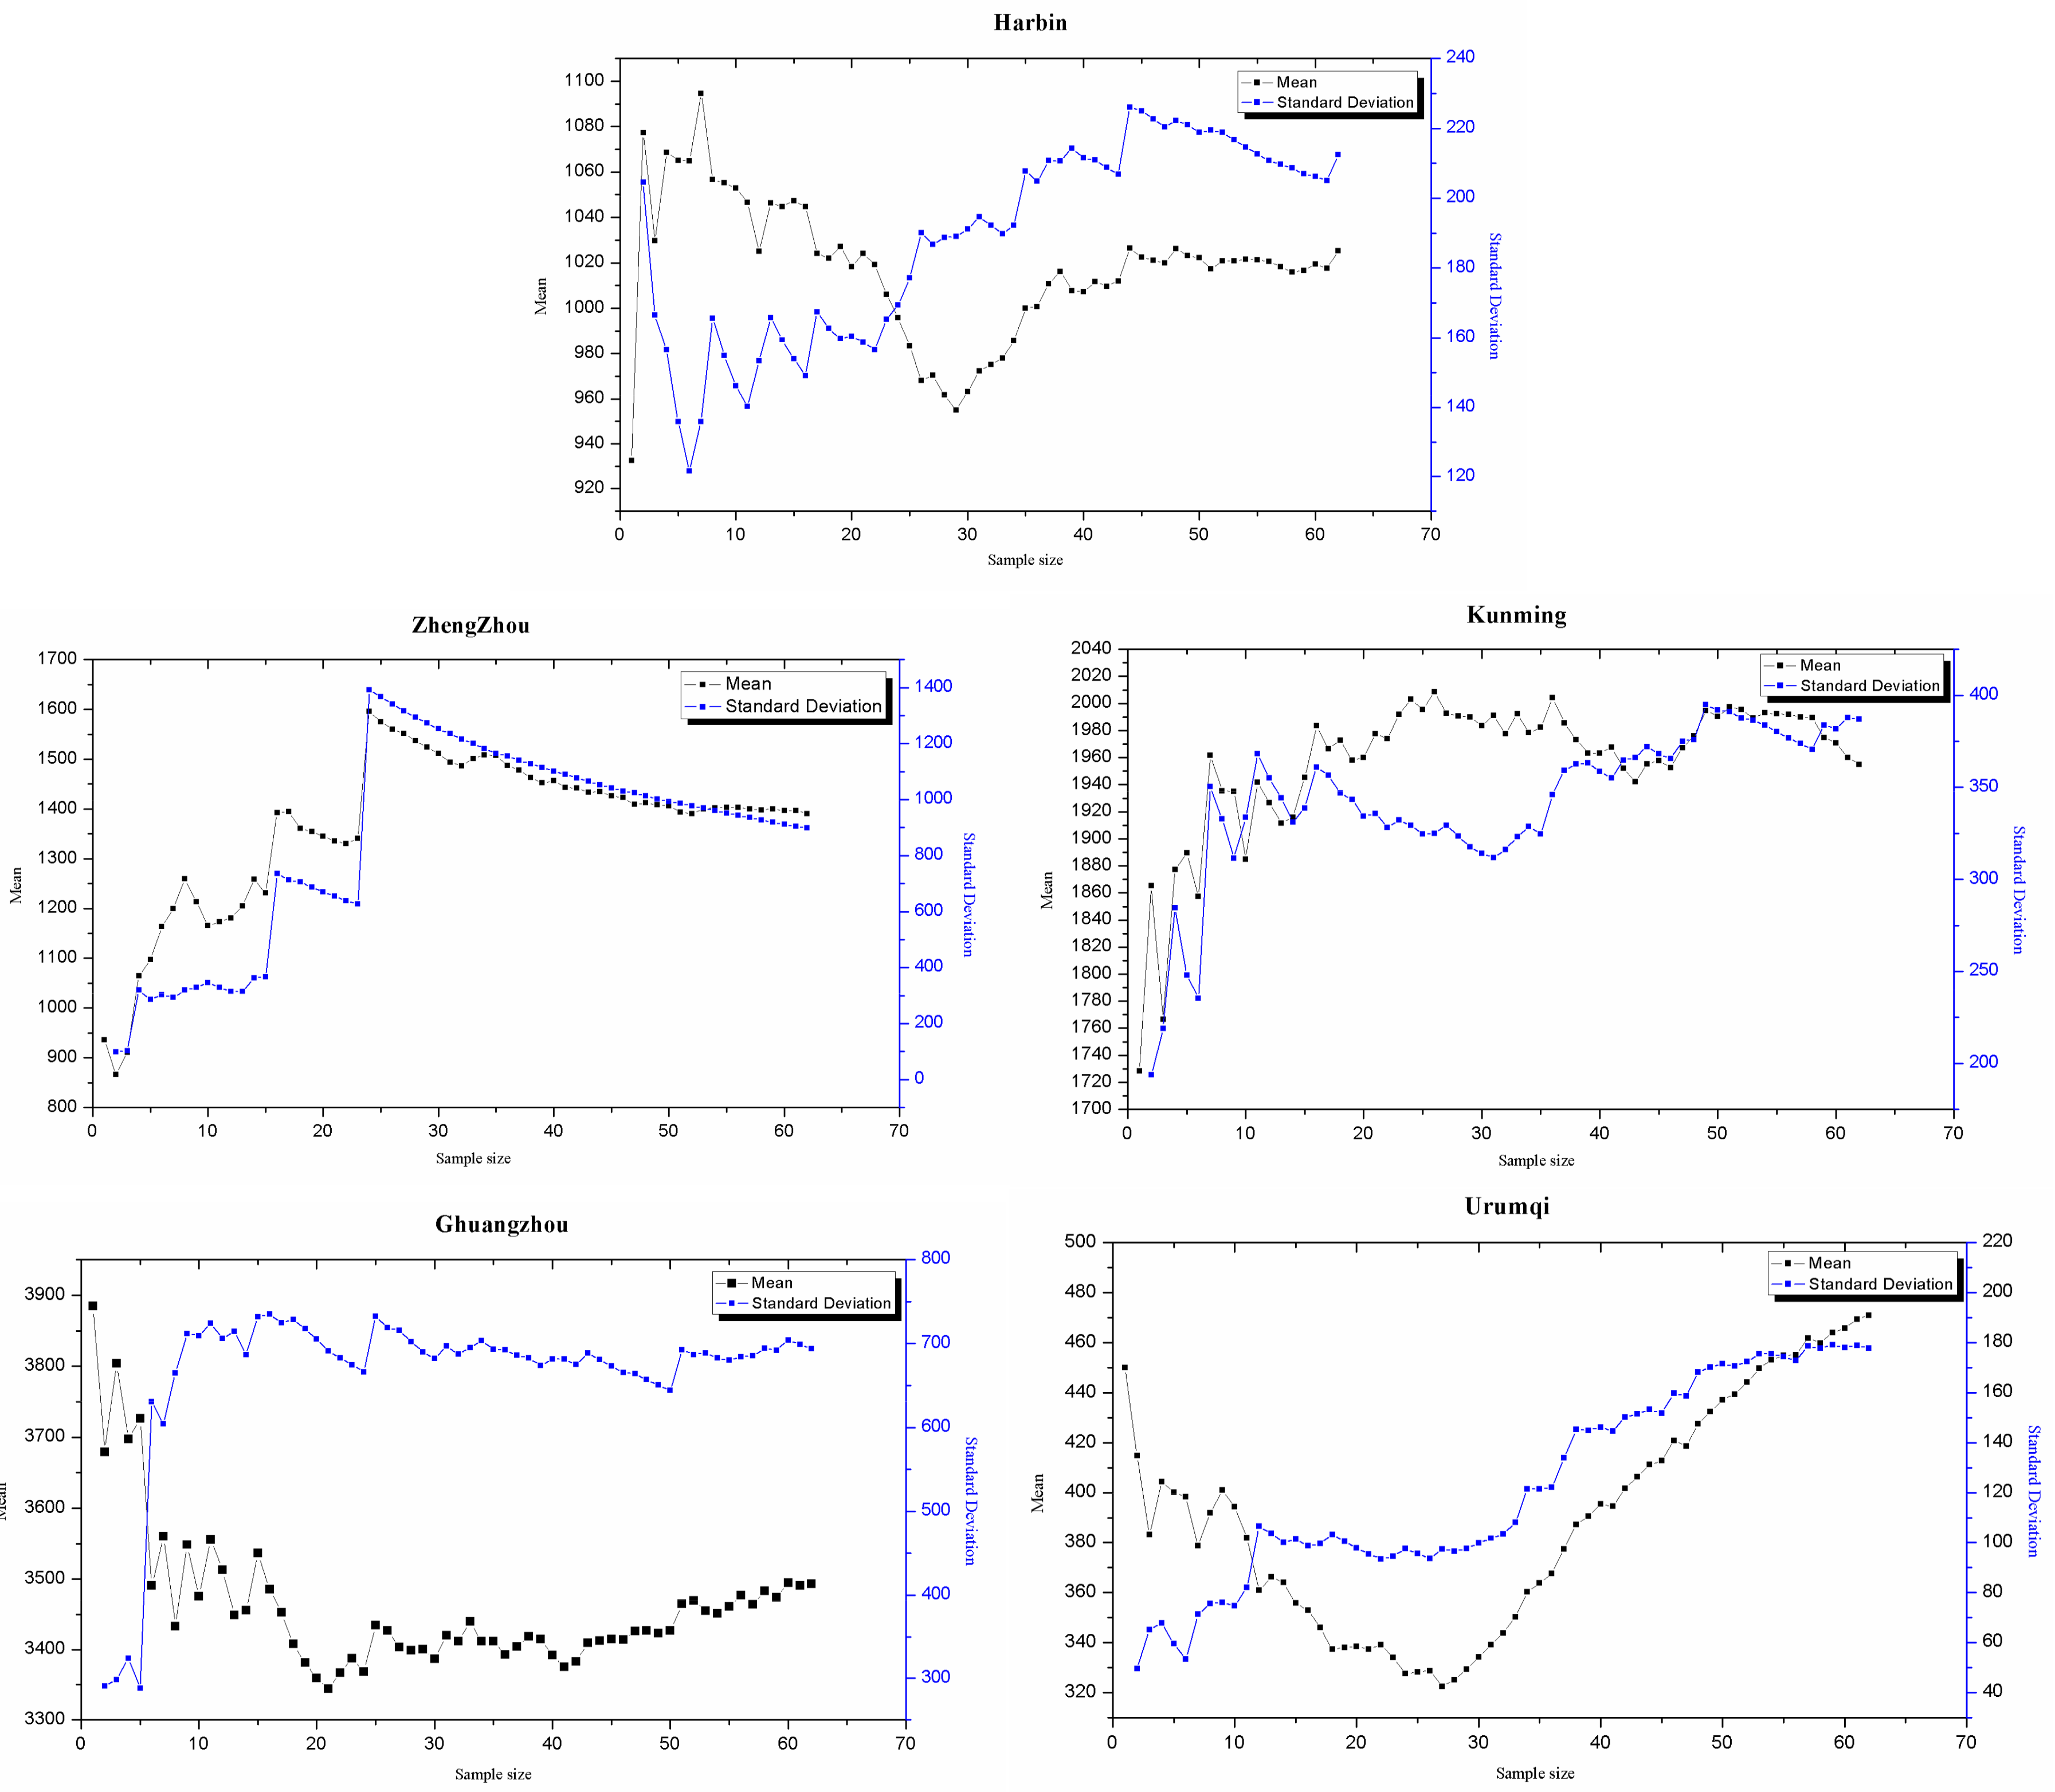
- Numerical simulation of the normal distribution and the annual precipitation series of representative stations, corroborated by hypothesis verification, shows that when the sample size is 30 years, the mean and variance tend to be stable, proving that a sample size of 30 years is reasonable for the calculation of hydrologic frequency.
- (5)
- Precipitation data from five stations in the southeast and southwest monsoon areas of China are consistent, and statistical parameters (mean and variance) calculated using a sample size of 30 years pass the hypothesis verification test. Precipitation data from a sixth station located in the inland west wind circulation of China do not pass a hypothesis test that a 30-year sample size is adequate for hydrologic frequency calculations.
5.2. Forecast
- (1)
- This paper aimed to provide a general method for statistical analysis to determine the reasonable sample size for hydrologic frequency calculations. The method involves making the qualitative analysis of suitable sample size according to the main influencing factors of random variables, its rule of influence and the sampling theorem. Then, numerical experiments are used to analyze the evolution trend and stabilizing state of statistical parameters of the random variables as sample size increases, from which the reasonable sample size is initially determined. Finally, through hypothesis verification, the method demonstrates how large a sample size should be so as to ensure that no significant changes occur in the values of statistical parameters describing the sample set, thus confirming that the initially determined sample size is, in fact, the proper sample size.
- (2)
- The sample size rationality verification can be widely applied for statistical analyses. For example, it can be used in trend analysis of hydro-meteorological factors (climate change research), to explore the hydrologic series non-stationarity issue (ergodic verification), and in artificial neural network training (excessive training problem), among other applications. When conducting these statistical analyses, statistical parameters related to the issue have to be analyzed first, and, by means of numerical analysis, the trend of change and stabilizing status of statistical parameters can be analyzed as a function of increasing sample size. Finally, hypothesis verification can be used to determine the reasonable sample size.
Acknowledgments
Author Contributions
Conflicts of Interest
References
- Wang, J. Hydrologic Statistics; Water Resources and Electric Power Press: Beijing, China, 1993; Volume 6, p. 2. (In Chinese) [Google Scholar]
- Bure, V.; Parilina, E. Probability Theory and Mathematical Statistics; World Scientific: Singapore, 2013; pp. 617–619. [Google Scholar]
- Bronshtein, I.N.; Semendyayev, K.A.; Musiol, G.; Mühlig, H. Probability Theory and Mathematical Statistics; Mir Publishers: Moscow, Russia, 1986. [Google Scholar]
- Ibragimov, I.A.; Zaitsev, A.Y. Probability Theory and Mathematical Statistics; World Scientific: Singapore, 1992. [Google Scholar]
- Standard for Hydrologic Calculation of Water Resources and Hydropower Engineering; DL/T5431-2009; China Electric Power Press: Beijing, China, 2009. (In Chinese)
- Oh, T.-S.; Kim, M.-S.; Moon, Y.-I.; Ahn, J.-H. An Analysis of the Characteristics in Design Rainfall According to the Data Periods. J. Korean Soc. Hazard Mitig. 2009, 9, 115–127. (In Korean) [Google Scholar]
- Kim, N.W.; Won, Y.S. Estimates of Regional wet Frequency in Korea. J. Korea Water Resour. Assoc. 2004, 37, 1019–1032. (In Korean) [Google Scholar] [CrossRef]
- Japan Meteorological Office. Japan Meteorological Office; Special Edition; Japan Meteorological Agency: Tokyo, Japan, 2017. (In Japanese)
- Mujere, N. Wet frequency analysis using the Gumbel distribution. Int. J. Comput. Sci. Eng. 2011, 3, 2774–2778. [Google Scholar]
- Robson, A.J.; Reed, D.W. Statistical procedure for wet frequency estimation. In The Wet Estimation Handbook; Centre for Ecology & Hydrology: Bailrigg, UK, 1999; Volume 3. [Google Scholar]
- Li, H.; Wang, Y.; Li, X. Mechanism and Forecasting Methods for Severe Droughts and wets in Songhua River Basin in China. Chin. Geogr. Sci. 2011, 21, 531–542. [Google Scholar] [CrossRef]
- Li, H.; Xue, L.; Wang, X. Relationship between Solar Activity and Wet/Drought Disasters of the Second Songhua River Basin. J. Water Clim. Chang. 2015, 6, 578–585. [Google Scholar]
- Wu, T.; Hua, H. Mechanical Vibration; Tsinghua University Press: Beijing, China, 2014. (In Chinese) [Google Scholar]
- Sampling Theory. Econometric 1948, 16, 69.
- China Water Resources and Hydropower Planning and Design Institute. China’s Water Resources and Its Development and Utilization Survey; China Water Conservancy and Hydropower Press: Beijing, China, 2014; Volume10, p. 2. (In Chinese) [Google Scholar]
- Murakami, T. The general circulation and water-vapor balance over the Far East during the rainy season. Geoph. Mag. 1959, 29, 131–171. [Google Scholar]
- Shen, R.; Luo, S.; Chen, L. Relationship between Summer Monsoon Environment and Precipitation in China. In Proceedings of the Tropical Weather Conference, Beijing, China, 3 September 1980; Science Press: Beijing, China, 1980; pp. 102–111. (In Chinese). [Google Scholar]
- Tao, J.; Chen, J. Water vapor source and conveying channel of rainstorm in Jianghuai region. J. Nanjing Inst. Meteorol. 1994, 4, 443–447. (In Chinese) [Google Scholar]
- Tian, H.; Guo, P.; Lu, W. Characteristics of summer water vapor transmission and its relationship with precipitation anomalies in China. J. Nanjing Meteorol. Coll. 2002, 4, 496–502. (In Chinese) [Google Scholar]
- Liu, C. Chinese Hydrology; Science Press: Beijing, China, 2014; Volume 1, p. 26. (In Chinese) [Google Scholar]
- Miao, R. Principles of Hydrology; China Waterpower Press: Beijing, China, 2007; p. 3. (In Chinese) [Google Scholar]
- Venugopal, V.; Foufoula-Georgiou, E. Energy decomposition of rainfall in the time-frequency-scale domain using wavelet packets. J. Hydrol. 1996, 187, 3–27. [Google Scholar] [CrossRef]
- Foster, H.A. Theoretical Frequency Curves and Their Application to Engineering Problems. Trans. ASCE 1924, 87, 825–855. [Google Scholar]
- Chang, J.; Shao, Q.M.; Zhou, W.X. Cramér-type moderate deviations for Studentized two-sample U-statistics with applications. Ann. Stat. 2016, 44, 1931–1956. [Google Scholar] [CrossRef]
- Dixon, W.J. Analysis of Extreme Values. Ann. Math. Stat. 1950, 21, 488–506. [Google Scholar] [CrossRef]
- Grubbs, E.F. Sample criterion for testing outlying observations. Ann. Math. 1950, 21, 27–58. [Google Scholar] [CrossRef]
- Su, W. Talk about hypothesis testing (t test) and its application. China Qual. 1997, 6, 44–46. (In Chinese) [Google Scholar]


| Sites | Climate Zones | Maximum (mm) | Minimum (mm) | Mean (mm) | Mean Variance Value |
|---|---|---|---|---|---|
| Baishan | Northern temperate continental monsoon climate | 1057.6 | 497.21 | 750 | 112.07 |
| Harbin | Temperate continental monsoon climate | 1652.6 | 558.1 | 1025.36 | 212.44 |
| Zhengzhou | Northern temperate continental monsoon climate | 3811.6 | 732.8 | 1390.74 | 441.98 |
| Kunming | Low latitude subtropical-plateau mountain monsoon climate | 2899.8 | 1131.6 | 1954.88 | 386.90 |
| Guangzhou | Marine subtropical monsoon climate | 5357.8 | 2316 | 3493.19 | 693.57 |
| Urumqi | In the temperate continental arid climate | 839 | 131.6 | 471 | 177.86 |
| Objects | Sample Series (Year) | Sample Size | Wavelet Variance Extrema (Series Number) | Extrema Number | Cycle (Year) |
|---|---|---|---|---|---|
| Relative number of sunspot | 1951–2007 | 57 | 9, 18, 30 | 3 | 9, 12 |
| Annual precipitation, Baishan | 1958–2010 | 53 | 10, 18, 28 | 3 | 8, 10 |
| Annual precipitation, Harbin | 1951–2012 | 62 | 11, 21, 32 | 2 | 10, 11 |
| Annual precipitation, Zhengzhou | 1951–2012 | 62 | 8, 14, 32 | 2 | 6, 18 |
| Annual precipitation, Guangzhou | 1951–2012 | 62 | 9, 20, 32 | 2 | 11, 12 |
| Annual precipitation, Kunming | 1951–2012 | 62 | 10, 20, 32 | 2 | 10, 12 |
| Annual precipitation, Urumqi | 1951–2012 | 62 | 5, 20, 32 | 2 | 15, 12 |
| Representative Stations | t-Verification Method Mean Value (x) | F-Verification Method Mean Variance (σ) | Note |
|---|---|---|---|
| Baishan | 0.18 | 0.97 | t0.05 = 1.65 F0.05 = 1.649 |
| Harbin | 1.34 | 1.23 | |
| Zhengzhou | 0.52 | 0.51 | |
| Kunming | 0.34 | 1.52 | |
| Guangzhou | 0.68 | 1.04 | |
| Urumqi | 3.89 | 3.17 |
© 2018 by the authors. Licensee MDPI, Basel, Switzerland. This article is an open access article distributed under the terms and conditions of the Creative Commons Attribution (CC BY) license (http://creativecommons.org/licenses/by/4.0/).
Share and Cite
Li, H.; Sun, J.; Zhang, H.; Zhang, J.; Jung, K.; Kim, J.; Xuan, Y.; Wang, X.; Li, F. What Large Sample Size Is Sufficient for Hydrologic Frequency Analysis?—A Rational Argument for a 30-Year Hydrologic Sample Size in Water Resources Management. Water 2018, 10, 430. https://doi.org/10.3390/w10040430
Li H, Sun J, Zhang H, Zhang J, Jung K, Kim J, Xuan Y, Wang X, Li F. What Large Sample Size Is Sufficient for Hydrologic Frequency Analysis?—A Rational Argument for a 30-Year Hydrologic Sample Size in Water Resources Management. Water. 2018; 10(4):430. https://doi.org/10.3390/w10040430
Chicago/Turabian StyleLi, Hongyan, Jiaqi Sun, Hongbo Zhang, Jianfeng Zhang, Kwnasue Jung, Joocheol Kim, Yunqing Xuan, Xiaojun Wang, and Fengping Li. 2018. "What Large Sample Size Is Sufficient for Hydrologic Frequency Analysis?—A Rational Argument for a 30-Year Hydrologic Sample Size in Water Resources Management" Water 10, no. 4: 430. https://doi.org/10.3390/w10040430
APA StyleLi, H., Sun, J., Zhang, H., Zhang, J., Jung, K., Kim, J., Xuan, Y., Wang, X., & Li, F. (2018). What Large Sample Size Is Sufficient for Hydrologic Frequency Analysis?—A Rational Argument for a 30-Year Hydrologic Sample Size in Water Resources Management. Water, 10(4), 430. https://doi.org/10.3390/w10040430


