Article

Influence of Carbon Source on the Efficiency of Nitrogen Removal and Denitrifying Bacteria in Biofilm from Bioelectrochemical SBBRs

by
Izabella Kłodowska
1,
Joanna Rodziewicz
1,*,
Wojciech Janczukowicz
1,
Agnieszka Cydzik-Kwiatkowska
2 and
Paulina Rusanowska
1
1
Department of Environment Engineering, Faculty of Environmental Science, University of Warmia and Mazury in Olsztyn, Warszawska 117a, 10-719 Olsztyn, Poland
2
Department of Environmental Biotechnology, Faculty of Environmental Science, University of Warmia and Mazury in Olsztyn, Słoneczna 45g, 10-709 Olsztyn, Poland
*
Author to whom correspondence should be addressed.
Water 2018, 10(4), 393; https://doi.org/10.3390/w10040393
Submission received: 6 February 2018 / Revised: 15 March 2018 / Accepted: 26 March 2018 / Published: 28 March 2018
(This article belongs to the Section Wastewater Treatment and Reuse)

Abstract

:
Bioelectrochemical sequencing batch biofilm reactors (SBBRs) may be used as post-anoxic reactors. The aim of this study was to determine how nitrate removal depends on the type of external carbon source and the electric current density (J). The effect of citric acid and potassium bicarbonate on N removal efficiency and the denitrifying bacteria biofilm community at an electric current density of 105 and 210 mA/m2 was determined. Nitrogen removal efficiency depended on the density of the electric current and the carbon source. The highest efficiency of N removal was in the reactor with 210 mA/m2 and citric acid. Regardless of the J value, the addition of an external carbon source to the reactors resulted in a 4–6 fold increase in the relative number of denitrifying bacteria in the biomass in relation to the reactor operated without an electric current flow and organics in the influent. The highest number of denitrifiers was observed in the reactor with an inorganic carbon source and with a density of 105 mA/m2. The main factor determining the shifts in composition of the denitrifying bacteria was the electric current flow. In the reactors operated with the electric current flow, Thauera aminoaromatica MZ1T occurred in the reactors with potassium bicarbonate while Alicycliphilus denitrificans K601 preferred citric acid.

1. Introduction

In the 19th century, a biofilm reactor (reactor with immobilized biomass) was the most commonly used technology for biological wastewater treatment [1]. In many countries, biofilm reactors successfully competed with solutions based on activated sludge, especially in small wastewater treatment plants (up to 20,000 population equivalent (PE)).
Aerobic biofilm reactors ensure the removal of organic compounds and nitrification. One type of biofilm reactor is the rotating biological contactor (RBC), which is characterized by simple construction, uncomplicated operation, and fast technological start-up [1]. Technologists also note the high resistance of RBC to varying organic loading rates [2] as well as high biomass concentration, short hydraulic retention time (HRT), and low energy consumption [3]. Compared to systems with suspended biomass, lower operating and investment costs characterize RBC [4].
In relation to “classic” RBC, which has partially immersed biofilm, rotating discs with completely immersed biofilm and an external carbon source addition are characterized by high efficiency nitrate removal. The completely immersed biofilm, with better hydration and lower density, facilitates the transfer of pollutants across the entire cross-section of the bed [5]. Nitrate is removed from municipal wastewater by biological methods, most often in heterotrophic or autotrophic denitrification [6]. The effectiveness of the removal of oxidized forms of nitrogen from wastewater in the combined autotrophic (AD) and heterotrophic-autotrophic denitrification (HAD) was confirmed by using a sequencing batch biofilm reactor (SBBR) with an external carbon source [7,8,9,10]. Zhao et al. [11] observed that autotrophic bacteria in the biofilm reactors were responsible for nitrate removal at the C/N ratio of 0.75 (N expressed as total N). An increase in the C/N ratio above 1.0 resulted in the dominance of heterotrophic bacteria. The passage of an electric current through the bioelectrochemical reactors results in water electrolysis on the surface of cathodes and the generation of gaseous hydrogen as a source of energy to autotrophic bacteria, which then colonize the anaerobic layer of a biofilm and conduct hydrogenotrophic denitrification. These processes are accompanied by heterotrophic denitrification with the organic matter present in the wastewater subjected to the treatment process [10]. However, there is a lack of data on the impact of electric current density and the type of carbon source on the microbial community in bioelectrochemical SBBR. In the authors’ opinion, the efficiency of nitrogen removal in bioelectrochemical SBBR depends on the type of carbon source.
In this study, the influence of the carbon source type (organic and inorganic) and electric current density (105 mA/m2, I = 20 mA and 210 mA/m2, I = 40 mA) on the efficiency of nitrogen compound removal and the community of denitrifying bacteria in the biofilm were determined. The experiments were carried out using a continuous dose of an external carbon source (C/NNO3 = 0.75).

2. Materials and Methods

2.1. Characteristics of Wastewater Fed to Reactors

In the experiments, synthetic wastewater was used with the physical and chemical characteristics of municipal wastewater subjected to biological treatment in a system with a high efficiency of organic compound removal and nitrification. In the wastewater, nitrogen was present only in the form of nitrate at a concentration of 50.68 mgN/L. The chemical oxygen demand (COD) was 70 mgO2/L, organic carbon (TOC) 30 mgC/L, and inorganic carbon (TIC) 70 mgC/L. In order to prepare the wastewater, the following compounds were diluted in 2.0 L of tap water: NaNO3, KH2PO4, KCl (0.021 g/L), MgSO4∙7H2O (0.308 g/L), CaCl2 (0.021 g/L), and enriched broth (0.08 g/L) BIOCORP PS 110. The broth was added to the wastewater in order to obtain a concentration of COD, which is a characteristic of municipal wastewater previously treated in a technological system designed for the biological removal of organic compounds and nitrification.

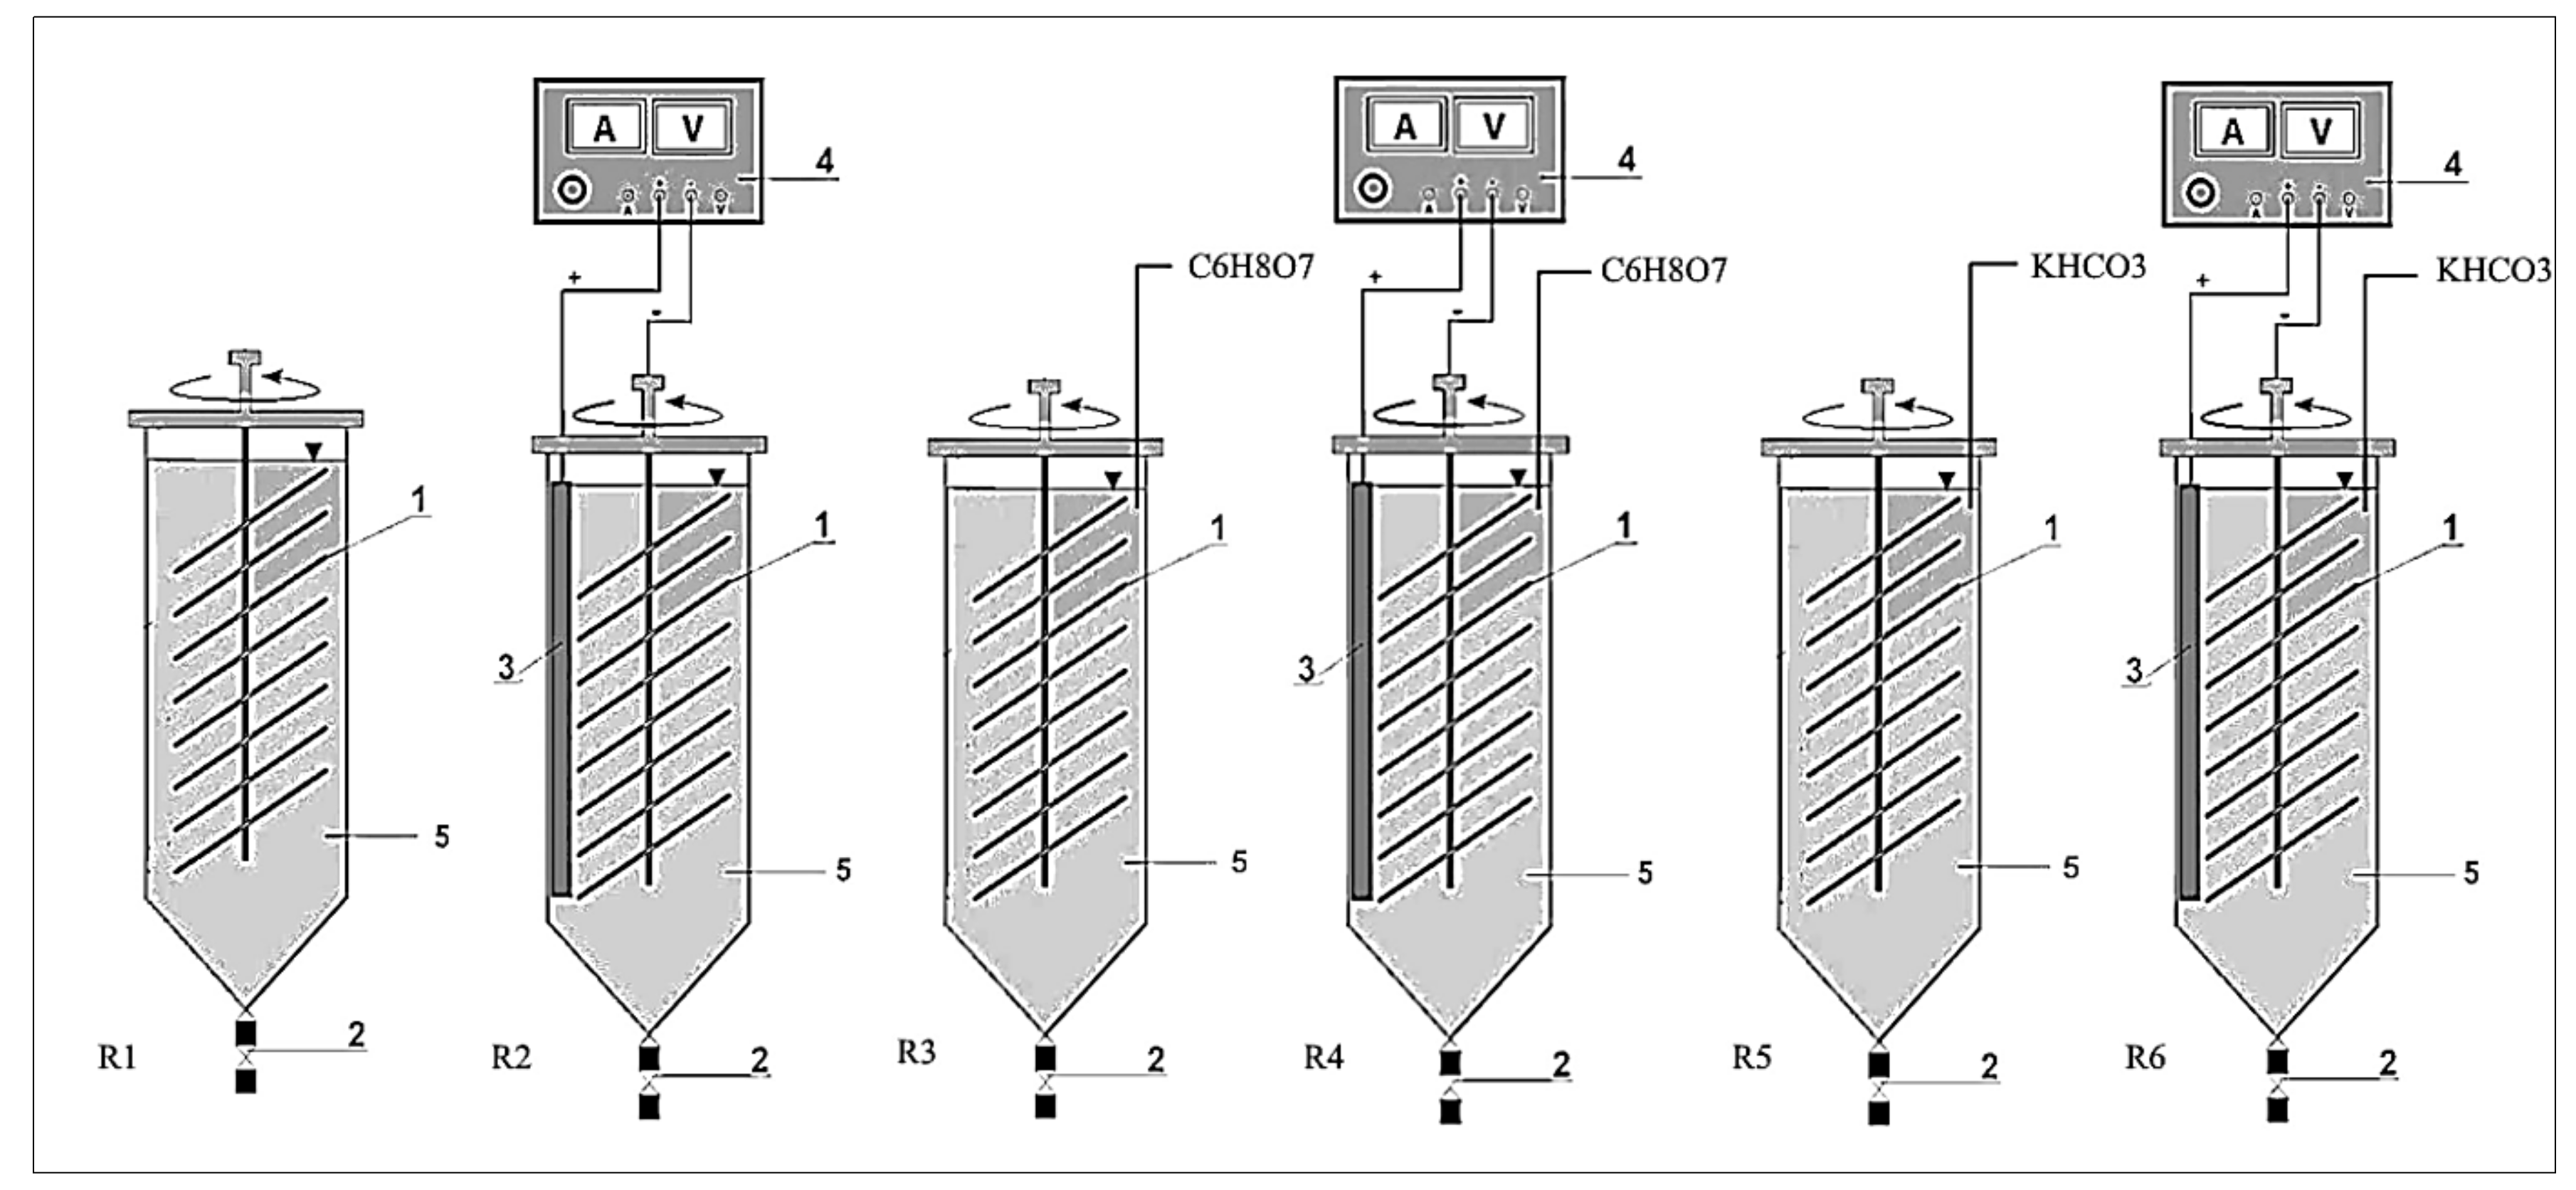
2.2. Experimental Stand and Organization

The study was carried out with six parallel vertical multi-cathodic SBBRs with a volume of 3.0 L each (active volume of 2.0 L) under anaerobic conditions (Figure 1). In each reactor, a set of 12 discs made of stainless steel with a diameter of 0.10 m and a total area of 0.19 m2 was installed. The distance between the discs was 5 mm. The discs were mounted coaxially on a vertical shaft rotated at 10 rpm and their immersion was 100%.
The experiments were conducted in conditions without an electric current flow (reactors: R0, RCA and RPB) and under conditions with an electric current flow (reactors: RH2, RCA+H2 and RPB+H2). In the control reactor (R0), synthetic wastewater was biologically treated without an electric current flow and without an external carbon source. In two reactors (RCA and RPB) without electric current flow, citric acid and potassium bicarbonate, respectively, were added to the wastewater in an amount providing a C/NNO3 ratio of 0.75. In the reactors with an electric current flow, in the RH2 reactor, no external carbon source was introduced into the wastewater, while in the RCA+H2 and RPB+H2 reactors the external carbon source was citric acid and potassium bicarbonate, respectively. An external carbon source was added in to the amount to maintain a C/NNO3 ratio of 0.75 in the wastewater introduced to the reactors. In the reactors without an external carbon source (R0, RH2), the C/NNO3 in the wastewater was 0.47. The hydraulic retention time in each reactor was 24 h. The reactors were acclimatized for three months to obtain the appropriate structure of the biofilm and a stable concentration of nitrogen compounds in the effluent. Activated sludge from the denitrification chambers in the Municipal Wastewater Treatment Plant “Łyna” in Olsztyn was used as inoculum. The source of the electric current flow was from laboratory power suppliers—Programmable DC Power Supply—HANTEK PPS 2116 A—(0–5 A) (0–32 V) and MANSON DC Power Supply—DPD 3030 (0–3 A, 0–30 V). In the reactors with the electric current flow, the cathodes were steel discs with an immobilized biofilm, whereas the anode was an aluminum plate with a total area of 0.033 m2. The cathode and the anode were connected to the laboratory power supply in order to maintain the required electric current density of 105 and 210 mA/m2 (electric current 20 and 40 mA, voltage 4.0–6.0 V). The experiments were carried out for 8 weeks under a controlled pH of 7.5–8.0 (adjusted with NaOH or HCl). Samples for analyses were collected once a day (1.0 L). Decantation (1.0 L) and filling with wastewater (2.0 L) were then conducted.

2.3. Analytical Procedures

Physicochemical analyses of raw and treated wastewater included: nitrate concentration (colorimetric method) [12], nitrite concentration (colorimetric method) [13], ammonium nitrogen concentration (colorimetric method) [14], organic compound concentration (COD) (spectrophotometric method based on the Hach Lange LCK protocol), concentration of total carbon, total organic carbon (TOC) and inorganic carbon (TIC) with a Hach IL 550 TOC-TN analyzer, electrolytic conductivity with a conductometer HI 99301 (Hanna Instruments), pH with a pH meter with stirrer pH-mV-Cond-TDS-DO type PL—700 AL, and temperature using a digital thermometer JVTIA.

2.4. Molecular Analyses of Biofilm

Samples of biofilm were aseptically scraped from the rotating discs from each experimental reactor. From the samples, DNA was extracted using a Fast DNA®SPIN for Soil Kit (MP Biomedicals) according to the manufacturer’s instructions. The concentration of DNA was measured spectrophotometrically using a NanoDrop Lite (Thermo Scientific, Waltham, MA, USA) and working solutions with a DNA concentration of 50 ng/L were prepared. The purity of the extracted DNA was very high (A260/280 = 1.79–1.83). The amplification was performed in a Mastercycler Personal (Eppendorf, Hamburg, Germany) using primer set NosZ-F/NosZ1622R GYTGTTCMTCGACAGCCAG/*5′GGCGGCGCGCCGCCCGCCCCGCCCCCG TCGCCCCGSACCTTSTGCCSTYGCG [15,16] which recognized the sequence of nosZ gene coding for nitrous oxide reductase (reduction of nitrous oxide to molecular nitrogen—identification of full-denitrifiers). The details of the polymerase chain reaction (PCR) amplification and Denaturing Gradient Gel Electrophoresis (DGGE) are given in Cydzik-Kwiatkowska et al. [17].
In order to identify the species of denitrifying bacteria occurring in the individual reactors, clear and intense bands were excised with an aseptic scalpel from the UV-illuminated DGGE gel. The obtained gel fragments containing the PCR products were washed with 400 μL of distilled water and then placed in 50 μL of distilled water and frozen at −20 °C. For re-amplification, DGGE bands were kept at room temperature for 24 h. In the re-amplification reaction, the primers set NosZ-F/NosZ1622R was used (primer Nos1622R did not have GC sequence). The annealing temperature was 60 °C. The amplicons were purified with a clean-up kit (A&A Biotechnology, Gdynia, Poland) and placed in 25 μL of distilled water. The sequencing was performed at the Institute of Biochemistry and Biophysics of the Polish Academy of Science (http://www.oligo.ibb.waw.pl). The sequences were deposited in the GenBank under accession no. KX440980-KX441009. The sequences determined in this study were aligned and the genetic relationships were determined (the Maximum Likelihood method) using BLAST tool [18].
Based on the obtained DGGE patterns, a zero-one distance matrix was made. The occurrence of the band in the electrophoretic path was defined as 1, while its absence as 0. The matrix was used in the DGGEstat 1.0 software to plot the dendrogram defining the similarities between the denitrifying bacteria in individual reactors [19].
To compare denitrifying bacteria abundance in the biofilm samples, relative real-time PCR was performed. The same primers were used as in the PCR-DGGE method, however without the GC sequence attached. The procedure of relative real-time PCR was carried out in accordance with Cydzik-Kwiatkowska et al. [17]. Reactions were carried out in a 7500 Real-Time PCR System (Applied Biosystems, Foster City, CA, USA) using MicroAmp optical tubes and caps (Applied Biosystems). The fluorescence signal was normalized by dividing the SYBR dye emission by the reference dye (ROX) signal intensity. Each DNA sample was amplified in triplicate in the presence of negative and positive controls. Data were analyzed with Sequence Detection Software, version 1.3 (Applied Biosystem). After real-time amplification, a dissociation stage was conducted to confirm the melting temperature of the PCR products. To check the molecular mass of the products, they were electrophorised in the presence of a molecular marker GeneRulerTM 100 bp DNA Ladder Plus (Fermentas, Waltham, MA, USA). The data were analyzed with sequence-detection software, version 1.3 (Applied Biosystems). The relative abundance of the investigated gene in the biofilm was compared by using a modification of the 2 − ΔΔCt method [20]. The reference was the sample of biofilm from the reactor without the electric current flow and without an external carbon source (R0).

3. Results and Discussion

The study investigated the effect of a citric acid and potassium bicarbonate dosing on the efficiency of nitrogen compound removal from wastewater and on the denitrifying bacteria community in the biofilm of SBBR, operated at two different densities of electric current. The experiments showed that the efficiency of nitrogen compound removal depended on both the density of the electric current and the type of external carbon source.

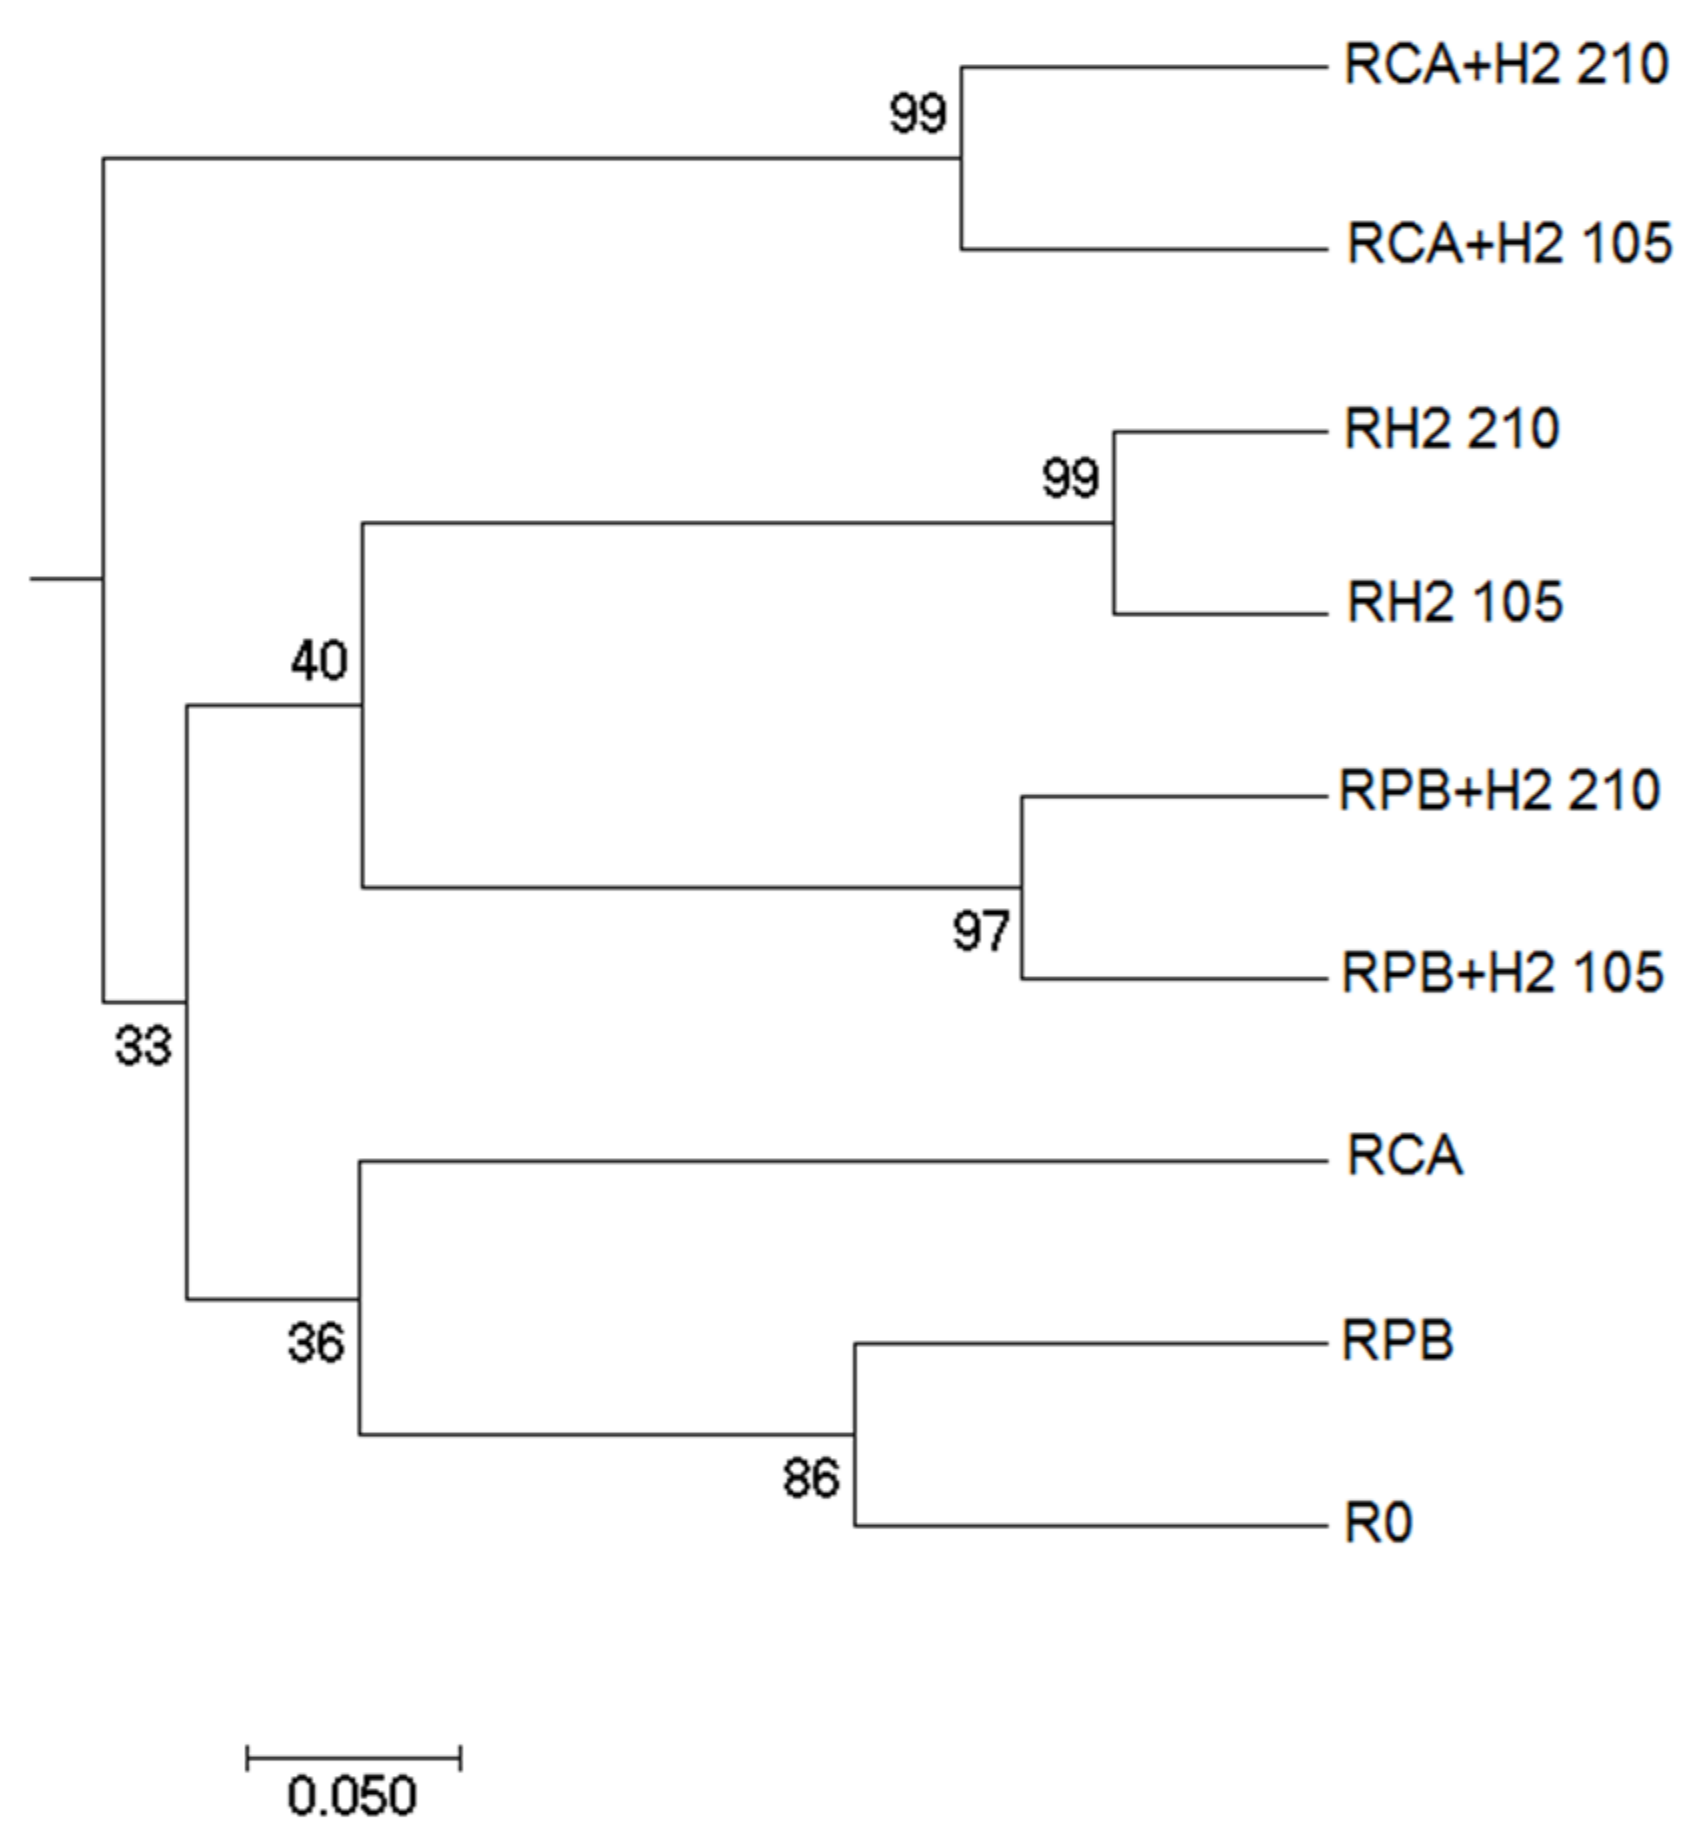
3.1. The Denitrifying Bacteria Community

Changes in the denitrifying bacteria community, in relation to the external carbon source and the electric current density, were determined using PCR-DGGE. Based on the DGGE patterns (Figure S1), a dendrogram was plotted presenting the similarity between bacterial communities in the SBBRs. The main factor that determined the composition of the denitrifying bacteria was the electric current (Figure 2). The DGGE patterns that characterized the reactors without an electric current flow (R0, RPB, RCA) were collected in a separate branch in the dendrogram. In the reactors with an electric current flow, the type of external carbon source determined the composition of denitrifying bacteria. Regardless of electric current density, DGGE patterns from the reactors R105H2 and R210H2, RPB+105H2 and RPB+210H2; RCA+105H2 and RCA+210H2 were grouped into separate branches (Figure 2).
In the biofilm from all experimental reactors, heterotrophic denitrifying bacteria Alicycliphilus denitrificans BC (CP002449.1) was identified. Alicycliphilus denitrificans K601, which is phylogenetically associated with strain BC, was not present only in the R0 and RPB reactors (Figure S1 and Table S1). These bacteria belong to the type of Proteobacteria, the class β-Proteobacteria and the family Comamonadaceae. Both Alicycliphilus denitrificans BC and Alicycliphilus denitrificans K601 have all the genes of the tricarboxylic acid cycle [21]. The BC strain uses nitrite, nitrate, oxygen, and chlorate as electron acceptors and, among others, carboxylic acids, including citrate, as electron donors [20]. The K601 strain uses nitrites, nitrates [22] and oxygen [23] as electron acceptors. Under denitrification conditions, strain K601 also uses citrate for growth as an electron donor, but also monocarboxylic acids (C2–C7), succinate or pyruvate [23]. Alicycliphilus denitrificans K601 was identified in anaerobic denitrifying indole-degrading bioreactors [24], whereas Alicycliphilus denitrificans BC was identified in fluidized sand biofilters treating aquaculture effluent [25].
Thauera aminoaromatica MZ1T was only present in RPB+H2 (Figure S1, Table S1). This species belongs to the type Proteobacteria, the class β-Proteobacteria and family Rhodocyclaceae. Thauera sp. was identified in bioreactors with autotrophic denitrification [26,27,28,29] and are known as capable of obtaining energy from the oxidation of inorganic compounds [30]. The genus Thauera might dominate in hydrogenotrophic denitrifying bacteria [26]. In the present study, during the flow of the electric current, hydrogen generated on the surface of a cathode due to water electrolysis become an internal source of energy for hydrogenotrophic bacteria, which use it to remove nitrates [30,31]. The advantage of a hydrogenotrophic process is that the only products are water and nitrogen gas, without any pH reduction [32,33].
Nitrate reduction occurs in two stages: into ammonium nitrogen in the assimilation pathway and into molecular nitrogen as a result of the dissimilation pathway. Denitrification bacteria participate in the denitrification and use nitrite as an electron acceptor in the conversion of nitrate and nitrogen oxides to nitrogen gas and during “nitrate respiration” do not use nitrite or other reduced nitrogen oxides as electron acceptors in the conversion to atmospheric nitrogen [34]. Faster growth characterizes these microorganisms more so than “real” denitrifying bacteria [35]. Mixed populations of “nitrate-respiring” bacteria can dominate over pure cultures of denitrifying bacteria [36].

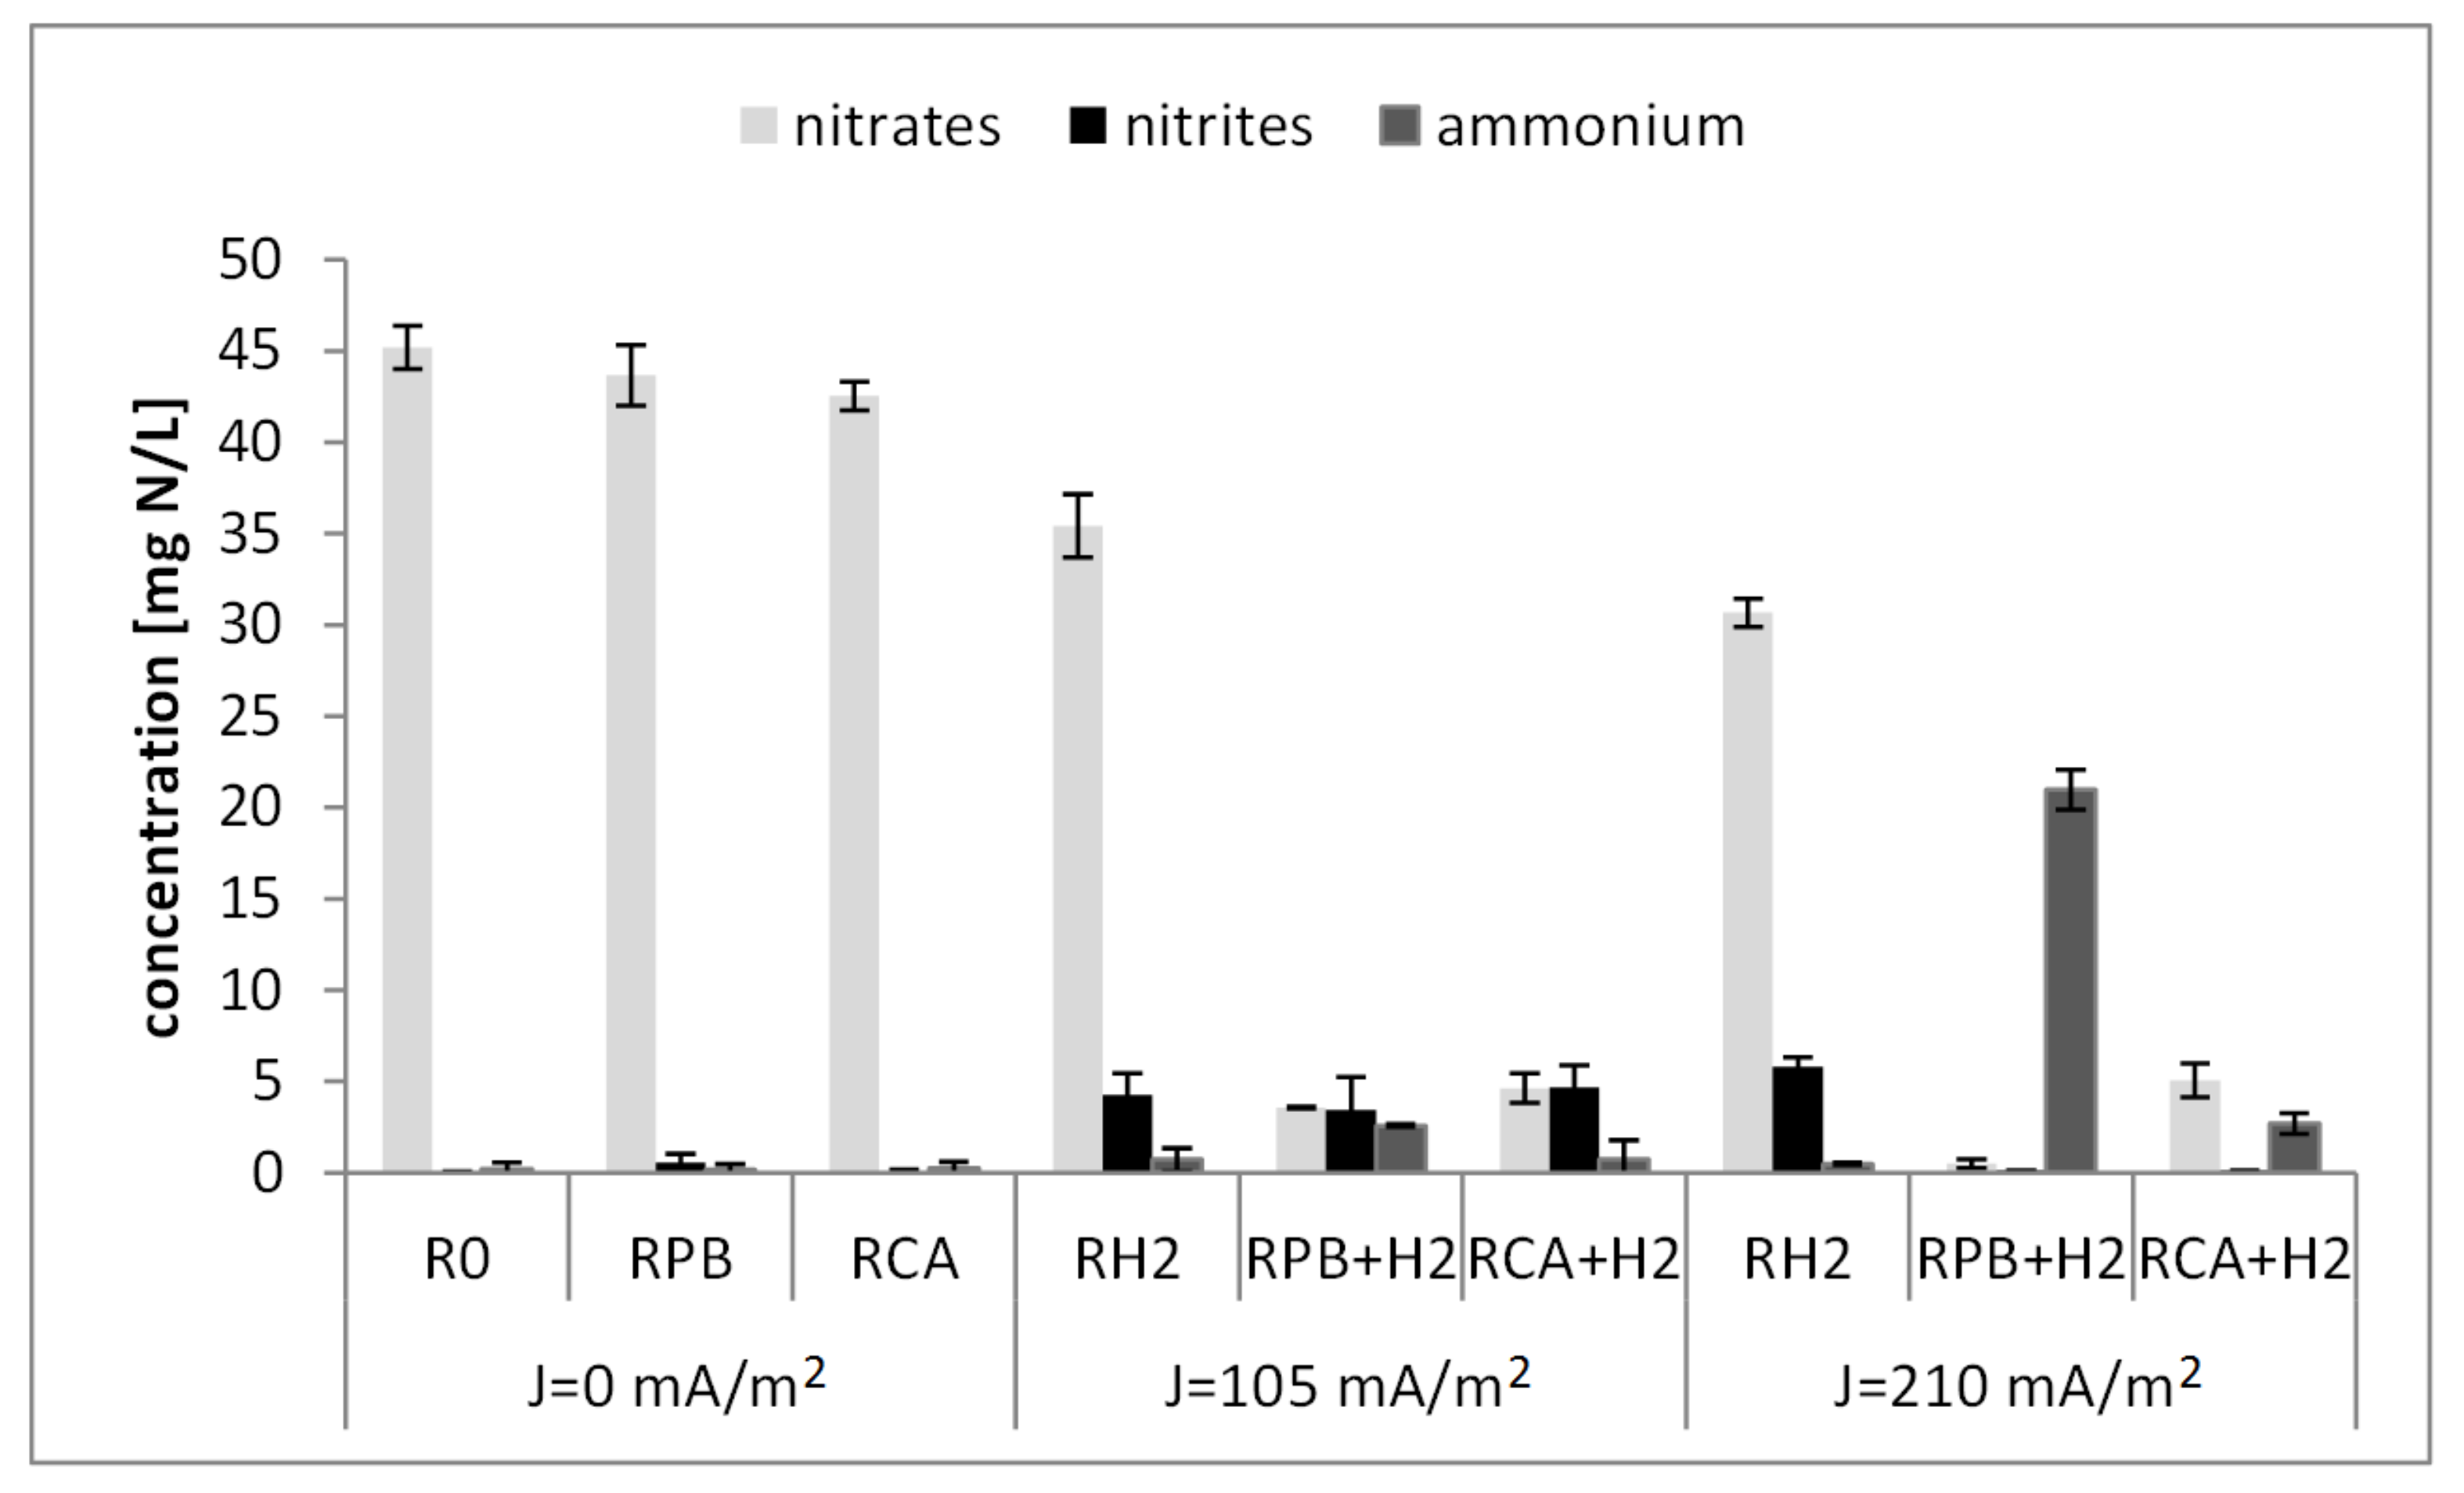
3.2. Nitrogen Compound Removal

In this study, the source of inorganic carbon was potassium bicarbonate (KHCO3) which, in comparison with carbon dioxide, influenced faster acclimatization of autotrophic bacteria and faster growth of denitrifiers [37]. In the RPB reactor, without the electric current flow with the external source of inorganic carbon (potassium bicarbonate), the denitrification efficiency was 12.74(±2.95)%. The concentration of nitrogen removed was 6.30(±1.52) mgN/L (Figure 3 and Figure 4). The efficiency of nitrogen compound removal was 12.43(±3.0)% and the concentrations of nitrogen compounds in the effluent were: 43.67(±1.67) mgNNO3/L, 0.56(±0.46) mgNNO2/L and 0.29(±0.16) mgNNH4/L (Figure 3 and Figure 4). In the reactor RPB+H2 with an electric current density of 105 mA/m2 and with an external source of inorganic carbon (KHCO3), the denitrification efficiency was 87.56(±4.25)% (Figure 3). The concentration of nitrogen removed was 42.31(±2.33) mgN/L. The efficiency of nitrogen compound removal was 83.47(±7.07)% and the concentrations of nitrogen compounds in the effluent were 3.56(±0.04) mgNNO3/L, 3.43(±1.78) mgNNO2/L and 2.58(±0.08) mgNNH4/L (Figure 3 and Figure 4).
According to Feng et al. [38], a carbon source in the form of sodium bicarbonate (NaHCO3) affects the accumulation of nitrite and the adaptation of “real” denitrifying bacteria to nitrite can accelerate its reduction, without nitrite accumulation in the effluent. In other studies [37], for an optimal 7.8 pH (adjustment of pH was carried out using CO2 and H2 gases) and a dose of sodium bicarbonate of 1070 mg/L, the nitrite removal rate was 28.57 mgNNO2/(g·h). In the bioelectrochemical reactor, the pH increase might be caused by the formation of hydroxyl ions during the electrolysis of water and denitrification [11]. In addition, the increase in alkalinity might be a result of corrosion of the anode [39]. Huang et al. [40] used sodium bicarbonate, glucose, and starch as a carbon source in wastewater with a CCOD/NNO3 ratio of 2.0 and a reactor with an electric current flow of 25 mA. The authors obtained the highest nitrate removal efficiency for an inorganic NaHCO3 substrate (1.80 ± 0.02 mmol/(L·day)). In the present study, increasing the electric current density to 210 mA/m2 (I = 40 mA) resulted in increased denitrification efficiency of 99.83(±0.41)% and nitrogen removal was 29.11(±8.71) mgN/L (Figure 3 and Figure 4). However, the efficiency of nitrogen compound removal was low (57.42(±2.51)%). The concentrations of nitrogen compounds in the effluent were 0.49(±0.23) mgNNO3/L, 0.10(±0.03) mgNNO2/L and 20.98(±1.09) mgNNH4/L (Figure 3 and Figure 4). The presence of the ammonium nitrogen in the effluent from the reactor with the electric current density of 210 mA/m2 indicates the assimilatory reduction of nitrate. According to Szewczyk [41], ammonium ions were used by microorganisms to build cellular material.

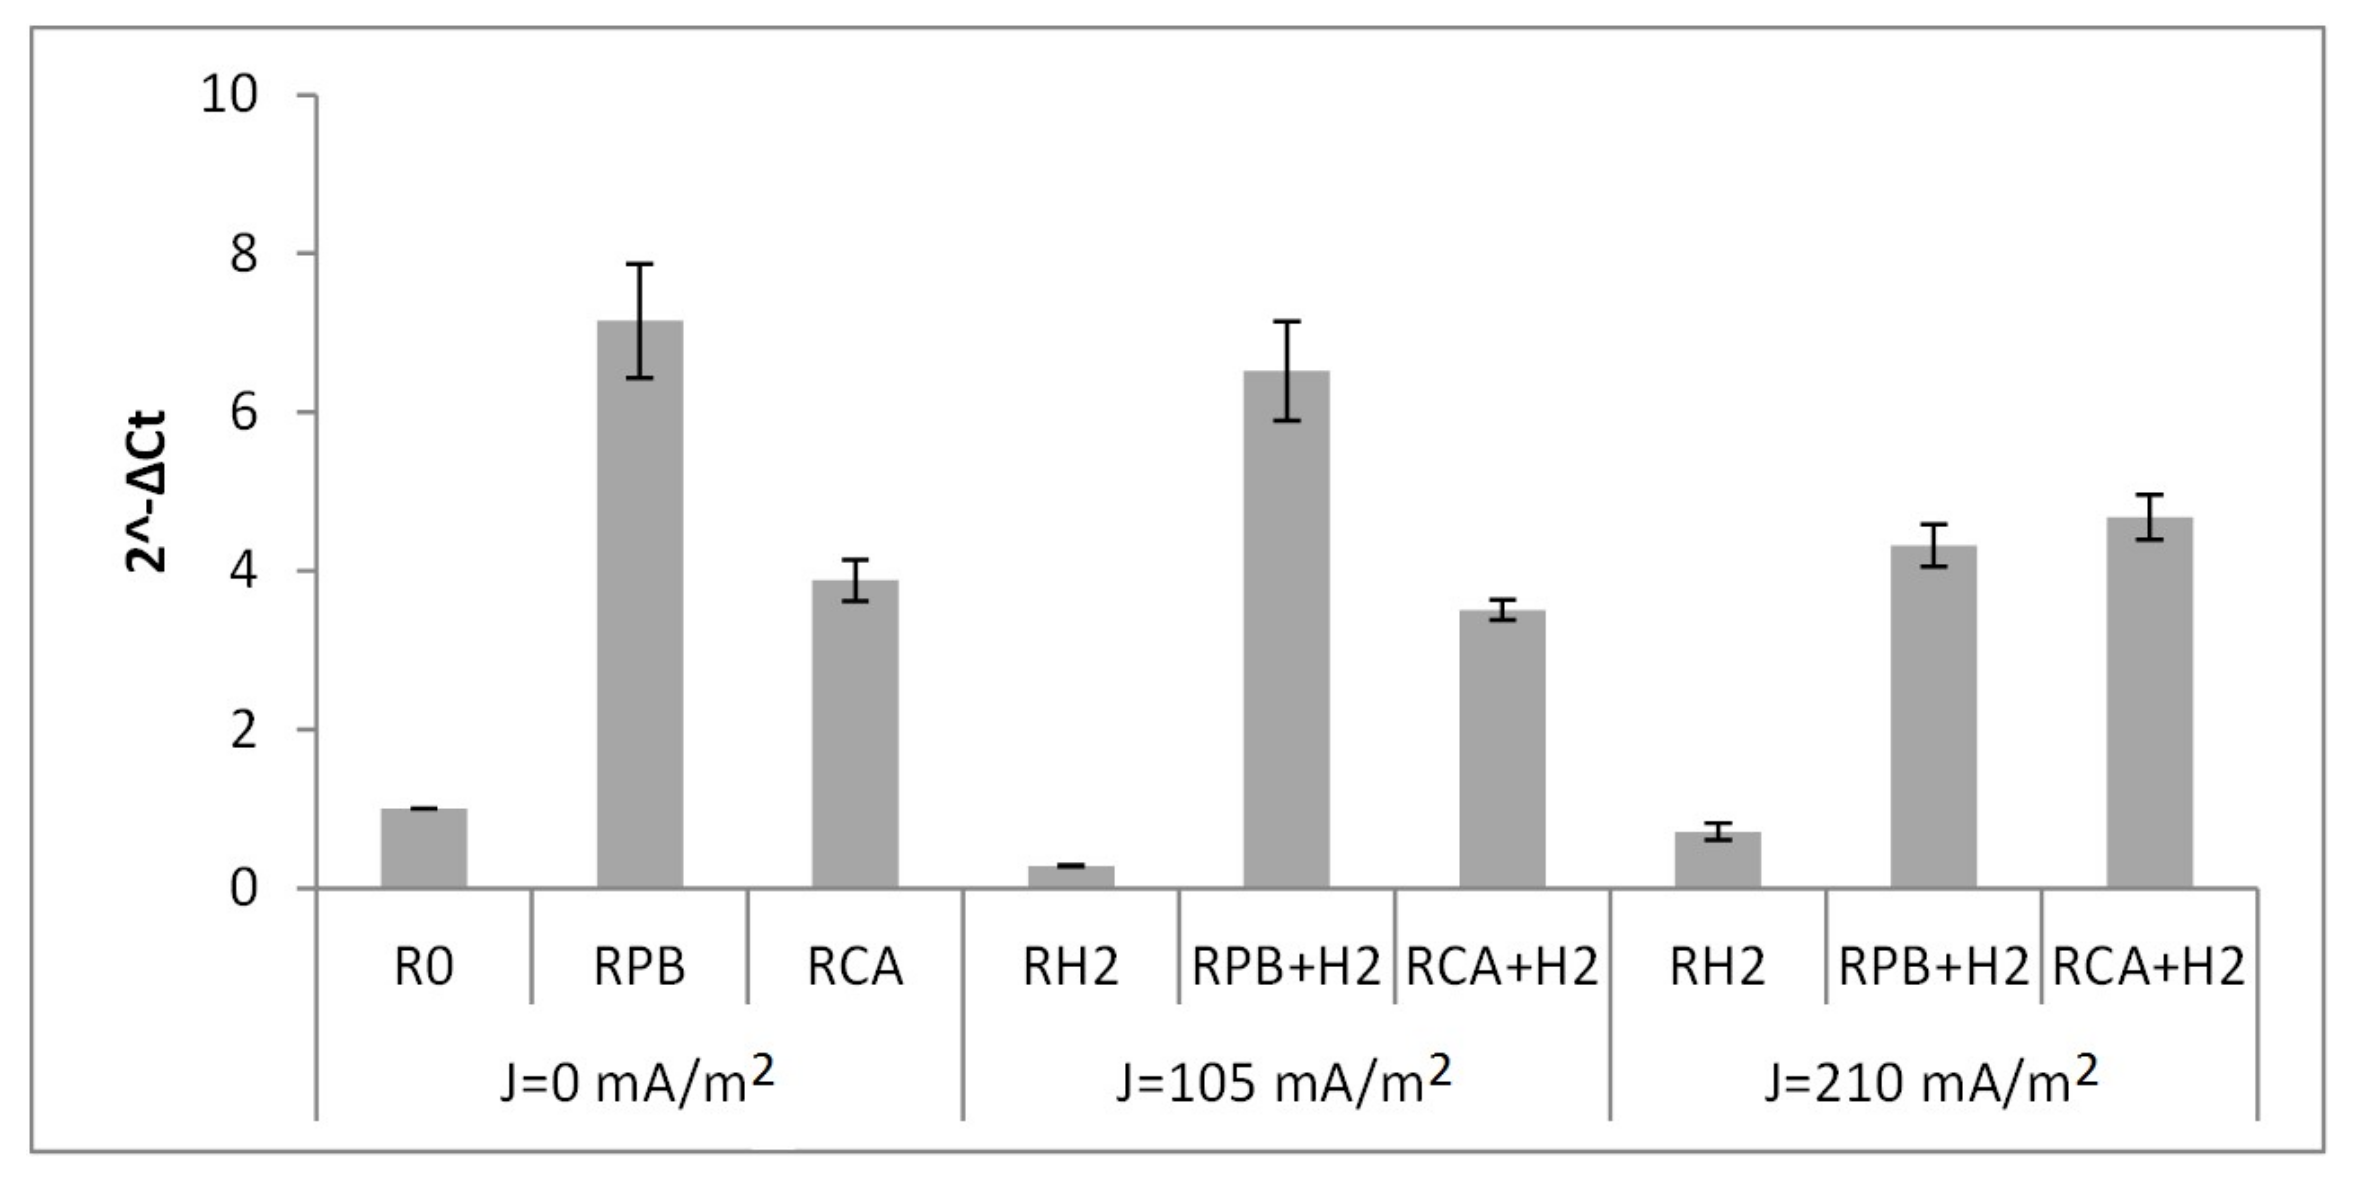
3.3. The Number of Denitrifying Bacteria

In the present study, although the external carbon source in the form of potassium bicarbonate significantly increased the relative number of denitrifying bacteria compared to the control reactor R0, the denitrifiers’ number decreased with the increasing of the electric current density. The number of denitrifiers in the RPB reactor was seven times higher than in the control reactor R0. The abundance of denitrifying bacteria in the RPB+H2 reactor, at an electric current density of 105 mA/m2, was 6.5 times higher than in the control reactor R0 and, at the electric current density of 210 mA/m2, only four times higher than in the control reactor R0 (Figure 5). The identification of heterotrophic facultative bacteria (Alicycliphilus sp.) in the discussed reactors indicated that these bacteria used cell lysis products occurring in nutrient deficient conditions in wastewater, as well as by-products from the autotrophic denitrification [42].
Heterotrophic bacteria are more sensitive to the increase of an electric current compared to autotrophic bacteria [40]. The present study showed that in the absence of an external carbon source in the RH2 reactor, an electric current density of 105 mA/m2 and 210 mA/m2 resulted in a 3.7-fold and 1.4-fold reduction in the denitrifying bacteria in the biofilm, compared to the control reactor R0 (Figure 5). The operation of the reactor at a long HRT, in a low concentration of organic carbon, might prolong the endogenous phase of respiration in heterotrophic bacteria and reduce the number of heterotrophs and denitrification efficiency [43]. The present study, however, showed that despite reducing the number of denitrifiers in the RH2 reactor, denitrification efficiency increased compared to the control reactor R0. This observation indicated that an electric current flow stimulated an increase in the activity of autotrophic denitrifiers in the biofilm.
Support of the autotrophic process with the organic carbon source depends on the substrate dose and the type of carbon source. The cooperation of autotrophs and heterotrophs in wastewater treatment might be more beneficial compared to the single autotrophic denitrification [11]. Simple carbon sources such as methanol, glucose, etc., used in a heterotrophic-autotrophic denitrification reactor, were directly used by heterotrophs, which promoted heterotrophic denitrification [38]. In the present study, an organic substrate such as citric acid (C6H8O7), belonging to simple organic carbon sources, was used for the growth of heterotrophic microorganisms that form biofilm. However, the carbon dioxide produced in heterotrophic denitrification could be an additional source of inorganic carbon for autotrophic bacteria (so-called synergism). Only in this way could citric acid support the autotrophic process. Organic complex substrates, such as starch, have a greater impact on the treatment processes, by providing electrons and reducing electricity consumption. However, Feng et al. [38] showed that this type of substrate might increase the nitrate concentration in the effluent. In the present study, the denitrification efficiency in the RCA+H2 reactor, with an electric current flow and the organic carbon source was 81.69(±1.65)% and 89.82(±1.77) at an electric current density of 105 mA/m2 and 210 A/m2, respectively (Figure 3). In the reactor with the lower current density, the concentration of removed nitrogen was 40.67(±1.07) mgN/L. The efficiency of nitrogen compound removal was 80.25(±2.12)%. The concentrations of nitrogen compounds in the effluent were 4.63(±0.81) mgNNO3/L, 4.65(±1.23) mgNNO2/L and 0.73(±1.03) mgNNH4/L (Figure 3 and Figure 4). The higher electric current density increased the efficiency of nitrogen compound removal to 84.53(±1.88%) (Figure 3). The concentrations of nitrogen compounds in the effluent were 5.06(±0.91) mgNNO3/L, 0.1(±0.01) mgNNO2/L and 2.68(±0.57) mgNNH4/L (Figure 3 and Figure 4). In the reactors with the external carbon source in the form of citric acid, a 4-fold increase in the abundance of denitrifying bacteria was observed in comparison to the control reactor R0. However, there were no significant differences in the relative numbers of denitrifiers in the reactors either with or without the electric current flow. In the biofilm of these reactors Alicycliphilus denitrificans was identified, which uses nitrite and nitrate as an electron acceptor and, as an electron donor, citrates (among others) [22,23].
In the RCA reactor, the efficiency of denitrification was 15.94(±1.53)% (Figure 3). The concentration of removed nitrogen was 7.84(±1.31) mgN/L. A higher efficiency value was noted than in the RPB and R0 reactors. The efficiency of nitrogen compound removal was 15.46(±1.82)%. The concentrations of nitrogen compounds in the effluent were 42.53(±0.79) mgNNO3/L, 0.08(±0.07) mgNNO2/L and 0.35(±0.24) mgNNH4/L (Figure 3 and Figure 4).

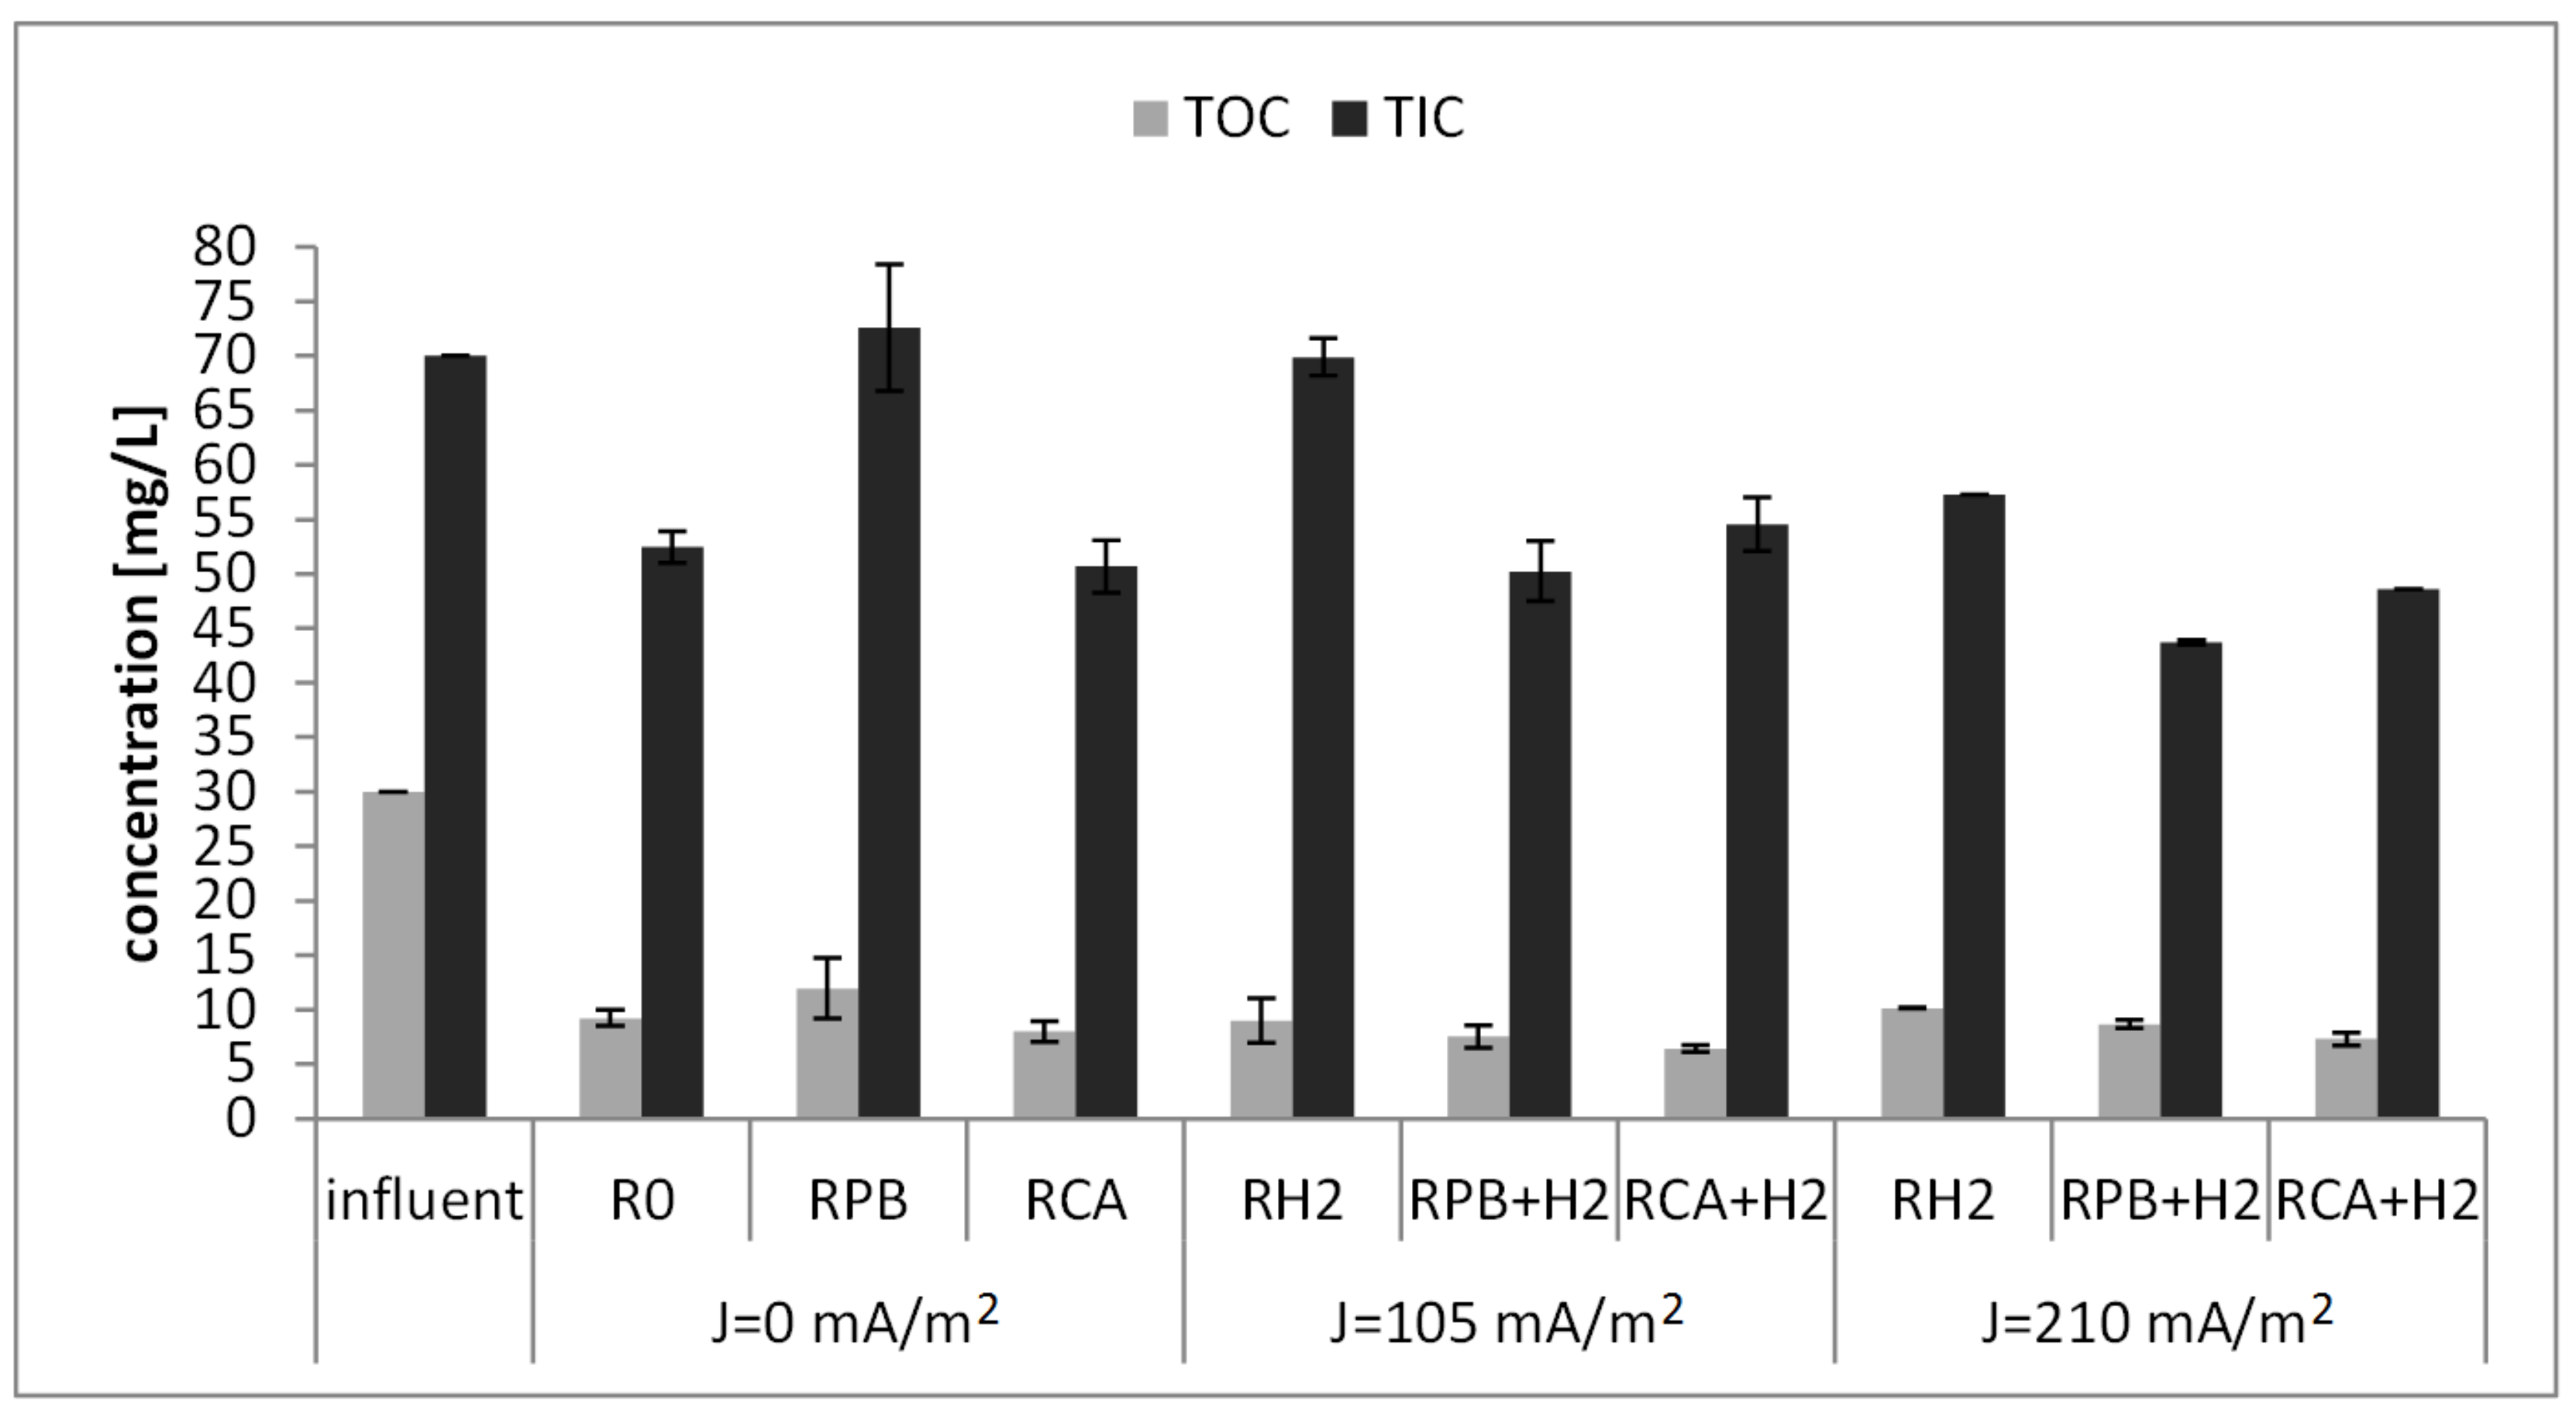
3.4. Total Organic and Total Inorganic Carbon Concentrations

In the raw wastewater, the concentration of total organic carbon was 30 mgC/L and total inorganic carbon 70 mgC/L (Figure 6). In all reactors, the TOC concentration decreased, thus probably organic carbon was used in the heterotrophic denitrification. The lowest concentration of organic carbon in the effluent was observed in the RCA+H2 reactor, with an electric current flow and an organic carbon source. Additionally, a high efficiency of nitrogen removal was observed in this reactor. Part of the organic carbon was directly used as an electron donor in nitrogen removal and part of the organic carbon was converted into inorganic carbon, leading to its increased concentration in the effluent from the reactors. The lowest concentration of inorganic carbon was noted in the effluent from the RPB+H2 reactor with an electric current density of 210 mA/m2. The lower concentrations of inorganic carbon in the effluents might be a result of its use in hydrogenotrophic denitrification.

4. Conclusions

  • The efficiency of nitrogen compound removal in the bioelectrochemical SBBR depended on the density of the electric current and the external carbon source. The highest efficiency of 84.53(±1.88)% was obtained in the reactor with the organic carbon in the form of citric acid and an electric current density of 210 mA/m2. The lowest efficiency (57.42(±2.51)%) was recorded in the reactor with inorganic carbon in the form of potassium bicarbonate and an electric current density of 210 mA/m2.
  • Citric acid, as a simple organic carbon source, was directly used by heterotrophs in heterotrophic denitrification. The produced carbon dioxide could additionally be a source of inorganic carbon for autotrophs.
  • The main factor determining the composition of the denitrifying bacteria was the electric current flow. In the reactors with an electric current flow, the determining factor of the denitrifiers’ community was the external carbon source. In all biofilms from the experimental reactors, heterotrophic facultative bacteria of the genus Alicycliphilus were identified.
  • Regardless of the electric current density, the external carbon sources in the form of citric acid and potassium bicarbonate resulted in a 4-fold and 4–7-fold increase in the abundance of full-denitrifiers in the biofilm, respectively.

Supplementary Materials

The following are available online at https://www.mdpi.com/2073-4441/10/4/393/s1, Figure S1: DGGE gel analysis of PCR amplifcations of nosZ gene of denitrifying bacteria, Table S1: Name of the sequence amplified from bands excited from DGGE gel, and its similarity with sequences from GenBank.

Acknowledgments

This study was financed under Project No. 18.610.008-300 of the University of Warmia and Mazury in Olsztyn, Poland.

Author Contributions

Izabella Kłodowska carried out the research, including collecting the input data and prepared manuscript. Joanna Rodziewicz developed the research idea and planned the research activities. Wojciech Janczukowicz supervised the research activities and reviewed the final draft of the manuscript. Agnieszka Cydzik-Kwiatkowska worked on the analysis and presentation of the results of molecular biofilm analyses. Paulina Rusanowska carried out molecular analyses of biofilm. All authors have read and approved the final manuscript.

Conflicts of Interest

The authors declare no conflict of interest.

References

  1. Hassard, F.; Biddle, J.; Cartmell, E.; Jefferson, B.; Tyrrel, S.; Stephenson, T. Rotating biological contactors for wastewater treatment—A review. Process Saf. Environ. Prot. 2015, 94, 285–306. [Google Scholar] [CrossRef] [Green Version]
  2. Ignatowicz, K.; Puchlik, M. Rotary biological contactor as alternative for small amount of wastewater treatment. Rocz. Ochr. Sr. 2011, 13, 1385–1404. [Google Scholar]
  3. Lu, C.; Yeh, A.C.; Lin, M.R. Treatment of high–strength organic wastewaters using an anaerobic rotating biological contactors. Environ. Int. 1995, 21, 313–323. [Google Scholar] [CrossRef]
  4. Cortez, S.; Teixeira, P.; Oliveira, R.; Mota, M. Rotating biological contactors: A review of main factors affecting performance. Rev. Environ. Sci. Bio/Tecnnol. 2008, 7, 155–172. [Google Scholar] [CrossRef] [Green Version]
  5. Teixeira, P.; Oliveira, R. Denitrification in a closed rotating biological contactor: Effect of disk submergence. Process Biochem. 2001, 37, 345–349. [Google Scholar] [CrossRef]
  6. Karanasios, K.A.; Vasiliadou, I.A.; Pavlou, S.; Vayenas, D.V. Hydrogenotrophic denitrification of potable water: A review. J. Hazard. Mater. 2010, 180, 20–37. [Google Scholar] [CrossRef] [PubMed]
  7. Kłodowska, I.; Rodziewicz, J.; Janczukowicz, W. Removal of nitrogen compounds in the process of autotrophic denitrification in a Sequencing Batch Biofilm Reactor (SBBR). Pol. J. Nat. Sci. 2014, 29, 359–369. [Google Scholar]
  8. Kłodowska, I.; Rodziewicz, J.; Janczukowicz, W. Effect of technological and environmental parameters on electrolytically-aided denitrification using the anaerobic rotating multi-disc reactor. Ecol. Eng. 2015, 85, 223–225. [Google Scholar] [CrossRef]
  9. Kłodowska, I.; Rodziewicz, J.; Janczukowicz, W.; Cydzik-Kwiatkowska, A.; Parszuto, K. Effect of citric acid on the efficiency of the removal of nitrogen and phosphorus compounds during simultaneous heterotrophic-autotrophic denitrification (HAD) and electrocoagulation. Ecol. Eng. 2016, 95, 30–35. [Google Scholar] [CrossRef]
  10. Kłodowska, I.; Rodziewicz, J.; Janczukowicz, W.; Gotkowska-Płachta, A.; Cydzik-Kwiatkowska, A. Hydrogenotrophic denitrification process efficiency and the number of denitrifying bacteria (MPN) in the sequencing batch biofilm reactor (SBBR) with platinum and carbon anodes. J. Environ. Sci. Health Part A 2016, 51, 389–392. [Google Scholar] [CrossRef] [PubMed]
  11. Zhao, Y.; Feng, C.; Wang, Q.; Yang, Y.; Zhang, Z.; Sugiura, N. Nitrate removal from groundwater by cooperating heterotrophic with autotrophic denitrification in a biofilm-electrode reactor. J. Hazard. Mater. 2011, 192, 1033–1039. [Google Scholar] [CrossRef] [PubMed]
  12. ISO 7890-3:1988 Determination of Nitrate—Part 3: Spectrometric Method Using Sulfosalicylic Acid; International Organization for Standardization: Geneva, Switzerland, 1988.
  13. ISO 6777:1984 Determination of Nitrite—Molecular Absorption Spectrometric Method; International Organization for Standardization: Geneva, Switzerland, 1984.
  14. PN-C-04576-04:1994 Determination of Ammonium by Spectrophotometric Method; International Organization for Standardization: Geneva, Switzerland, 1994.
  15. Kloos, K.; Mergel, A.; Rösch, C.; Bothe, H. Denitrification within the genus Azospirillum and other associative bacteria. Aust. J. Plant Physiol. 2001, 28, 991–998. [Google Scholar]
  16. Throbäck, I.N.; Enwall, K.; Jarvis, Ä.; Hallin, S. Reassessing PCR primers targeting nirS, nirK and nosZ genes for community surveys of denitrifying bacteria with DGGE. FEMS Microbiol. Ecol. 2004, 49, 401–417. [Google Scholar] [CrossRef] [PubMed]
  17. Cydzik-Kwiatkowska, A.; Rusanowska, P.; Zielińska, M.; Bernat, K.; Wojnowska-Baryła, I. Structure of nitrogen-converting communities induced by hydraulic retention time and COD/N ratio in constantly aerated granular sludge reactors treating digester supernatant. Bioresour. Technol. 2014, 154, 162–170. [Google Scholar] [CrossRef] [PubMed]
  18. Basic Local Alignment Search Tool. Available online: https://blast.ncbi.nlm.nih.gov/Blast.cgi (accessed on 12 January 2018).
  19. Van Hannen, E.J.; Mooij, W.; Van Agterveld, M.P.; Gons, H.J.; Laanbroek, H.J. Detritus–dependent development of the microbial community in an experimental system: Qualitative analysis by denaturing gradient gel electrophoresis. Appl. Environ. Microbiol. 1999, 65, 2478–2484. [Google Scholar] [PubMed]
  20. Livak, K.J.; Schmittgen, T.D. Analysis of relative gene expression data using real-time quantitative PCR and the 2−ΔΔCt method. Methods 2001, 25, 402–408. [Google Scholar] [CrossRef] [PubMed]
  21. Oosterkamp, M.J.; Veuskens, T.; Talarico Saia, F.; Weelink, S.A.B.; Goodwin, L.A.; Daligault, H.E.; Bruce, D.C.; Detter, J.C.; Tapia, R.; Han, C.S.; et al. Genome analysis and physiological comparison of Alicycliphilus denitrificans strains BC and K601T. PLoS ONE 2013, 8, e66971. [Google Scholar] [CrossRef] [PubMed]
  22. Weelink, S.A.B.; Tan, N.C.G.; Broeke, H.; Kieboom, C.; Doesburg, W.; Langenhoff, A.A.M.; Gerritse, J.; Junca, H.; Stams, A.J.M. Isolation and characterization of Alicycliphilus denitrificans strain BC which grows on benzene with chlorate as the electron acceptor. Appl. Environ. Microbiol. 2008, 74, 6672–6681. [Google Scholar] [CrossRef] [PubMed]
  23. Mechichi, T.; Stackebrandt, E.; Fuchs, G. Alicycliphilus denitrificans gen. nov., sp. nov., a cyclohexanol-degrading nitrate-reducing β-proteobacterium. Int. J. Syst. Evol. Microbiol. 2003, 53, 147–152. [Google Scholar] [CrossRef] [PubMed]
  24. Hong, X.; Zhang, X.; Liu, B.; Mao, Y.; Liu, Y.; Zhao, L. Structural differentiation of bacterial communities in indole-degrading bioreactors under denitrifying and sulfate-reducing conditions. Res. Microbiol. 2010, 161, 687–693. [Google Scholar] [CrossRef] [PubMed]
  25. Tsukuda, S.; Christianson, L.; Kolb, A.; Saito, K.; Summerfelt, S. Heterotrophic denitrification of aquaculture effluent using fluidized sand biofilters. Aquac. Eng. 2015, 64, 49–59. [Google Scholar] [CrossRef]
  26. Mao, Y.; Xia, Y.; Zhang, T. Characterization of Thauera-dominated hydrogen-oxidizing autotrophic denitrifying microbial communities by using high-throughput sequencing. Bioresour. Technol. 2013, 128, 703–710. [Google Scholar] [CrossRef] [PubMed]
  27. Van Doan, T.; Lee, T.K.; Shukla, S.K.; Tiedje, J.M.; Park, J. Increased nitrous oxide accumulation by bioelectrochemical denitrification under autotrophic conditions: Kinetics and expression of denitrification pathway genes. Water Res. 2013, 47, 7087–7097. [Google Scholar] [CrossRef] [PubMed]
  28. Lee, D.-J.; Wong, B.-T. Denitrifying sulfide removal by enriched microbial consortium: Kinetic diagram. Bioresour. Technol. 2014, 164, 386–393. [Google Scholar] [CrossRef] [PubMed]
  29. Xu, G.; Peng, J.; Feng, C.; Fang, F.; Chen, S.; Xu, Y.; Wang, X. Evaluation of simultaneous autotrophic and heterotrophic denitrification processes and bacterial community structure analysis. Appl. Microbiol. Biotechnol. 2015, 99, 6527–6536. [Google Scholar] [CrossRef] [PubMed]
  30. Jiang, K.; Sanseverino, J.; Chauhan, A.; Lucas, S.; Copeland, A.; Lapidus, A.; Del Rio, T.G.; Dalin, E.; Tice, H.; Bruce, D.; et al. Complete genome sequence of Thauera aminoaromatica strain MZ1T. Stand. Genom. Sci. 2012, 6, 325–335. [Google Scholar] [CrossRef] [PubMed]
  31. Ghafari, S.; Hasan, M.; Aroua, M.K. Effect of carbon dioxide and bicarbonate as inorganic carbon sources on growth and adaptation of autohydrogenotrophic denitrifying bacteria. J. Hazard. Mater. 2009, 162, 1507–1513. [Google Scholar] [CrossRef] [PubMed]
  32. Smith, R.L.; Buckwalter, S.P.; Repert, D.A.; Miller, D.N. Small-scale, hydrogen oxidizing denitrifying bioreactor for treatment of nitrate-contaminated drinking water. Water Res. 2005, 39, 2014–2023. [Google Scholar] [CrossRef] [PubMed]
  33. Karanasios, K.A.; Michailidis, M.K.; Vasiliadou, I.A.; Pavlou, S.; Vayenas, D.V. Potable water hydrogenotrophic denitrification in packed-bed bioreactors coupled with a solar-electrolysis hydrogen production system. Desalin. Water Treat. 2011, 33, 86–96. [Google Scholar] [CrossRef]
  34. Glass, C.; Silverstein, J. Denitrification kinetics of high nitrate concentration water: PH effect on inhibition and nitrite accumulation. Water Res. 1998, 32, 831–839. [Google Scholar] [CrossRef]
  35. Wilderer, P.; Jones, W.; Dau, U. Competition in denitrification systems affecting reduction rate and accumulation. Water Res. 1987, 21, 239–245. [Google Scholar] [CrossRef]
  36. Dhamole, P.B.; Nair, R.R.; D’Souza, S.F.; Lele, S.S. Denitrification of high strength nitrate waste. Bioresour. Technol. 2007, 98, 247–252. [Google Scholar] [CrossRef] [PubMed]
  37. Ghafari, S.; Hasan, M.; Aroua, M.K. Improvement of autohydrogenotrophic nitrite reduction rate through optimization of pH and sodium bicarbonate dose in batch experiments. J. Biosci. Bioeng. 2009, 107, 275–280. [Google Scholar] [CrossRef] [PubMed]
  38. Feng, H.; Huang, B.; Zou, Y.; Li, N.; Wang, M.; Yin, J.; Cong, Y.; Shen, D. The effect of carbon sources on nitrogen removal performance in bioelectrochemical systems. Bioresour. Technol. 2013, 128, 565–570. [Google Scholar] [CrossRef] [PubMed]
  39. Liu, H.; Tong, S.; Chen, N.; Liu, Y.; Feng, C.; Hu, Q. Effect of electro-stimulation on the activity of heterotrophic denitrifying bacteria and denitrification performance. Bioresour. Technol. 2015, 196, 123–128. [Google Scholar] [CrossRef] [PubMed]
  40. Huang, B.; Feng, H.; Ding, Y.; Zheng, X.; Wang, M.; Li, N.; Shen, D.; Zhang, H. Microbial metabolism and activity in terms of nitrate removal in bioelectrochemical systems. Electrochim. Acta 2013, 113, 29–36. [Google Scholar] [CrossRef]
  41. Szewczyk, W.K. Biological Methods of Nitrogen Compounds Removal from Wastewater; Oficyna Wydawnicza Politechniki Warszawskiej: Warszawa, Poland, 2005; ISBN 8372075131. [Google Scholar]
  42. Park, J.-H.; Choi, O.; Lee, T.-H.; Kim, H.; Sang, B.-I. Pyrosequencing analysis of microbial communities in hollow fiber-membrane biofilm reactors system for treating high-strength nitrogen wastewater. Chemosphere 2016, 163, 192–201. [Google Scholar] [CrossRef] [PubMed]
  43. Rodziewicz, J. Removal of Nitrogen and Phosphorus Compounds from Wastewater Originating from Soil-Less Cultivation of Tomatoes in a Rotating Electrobiological Contactor; Dissertations and Monographs; Wydawnictwo Uniwersytetu Warmińsko-Mazurskiego: Olsztyn, Poland, 2017; ISBN 1509-3018. [Google Scholar]
Figure 1. Scheme of the laboratory station: (1) cathode—discs with immobilized biofilm (stainless steel), (2) outflow, (3) anode (aluminum), (4) electric current source, (5) reactor: (reactor 1—R0, reactor 2—RH2, reactor 3—RCA, reactor 4—RCA+H2, reactor 5—RPB, reactor 6—RPB+H2).
Water 10 00393 g001
Figure 2. The dendrogram plotted on the basis of the zero-one matrix, based on the Denaturing Gradient Gel Electrophoresis (DGGE) pattern of amplicons obtained as a result of DNA amplification with NosZ-F/NosZ1622R primers.
Water 10 00393 g002
Figure 3. The efficiency of denitrification and nitrogen compound removal: R0—control reactor, without an electric current flow and without an external carbon source; RPB—reactor without an electric current flow and with a potassium bicarbonate dosage; RCA—reactor without an electric current flow and with an acetic acid dosage; RH2—reactor with an electric current flow and without an external carbon source; RPB+H2—reactor with an electric current flow and with a potassium bicarbonate dosage; RCA+H2—reactor with an electric current flow and with an acetic acid dosage.
Water 10 00393 g003
Figure 4. The concentration of nitrogen compounds in treated wastewater: R0—control reactor, without an electric current flow and without an external carbon source; RPB—reactor without an electric current flow and with a potassium bicarbonate dosage; RCA—reactor without an electric current flow and with an acetic acid dosage; RH2—reactor with an electric current flow and without an external carbon source; RPB+H2—reactor with an electric current flow and with a potassium bicarbonate dosage; RCA+H2—reactor with an electric current flow and with an acetic acid dosage.
Water 10 00393 g004
Figure 5. Relative abundance of denitrifying bacteria in the experimental reactors: R0—control reactor, without the electric current flow and without the external carbon source; RPB—reactor without the electric current flow and with the potassium bicarbonate dosage; RCA—reactor without the electric current flow and with the acetic acid dosage; RH2—reactor with the electric current flow and without the external carbon source; RPB+H2—reactor with the electric current flow and with the potassium bicarbonate dosage; RCA+H2—reactor with the electric current flow and with the acetic acid dosage.
Water 10 00393 g005
Figure 6. The concentration of total organic carbon (TOC) and total inorganic carbon (TIC) in the reactors with an electric current flow and without an electric current flow: R0—control reactor, without an electric current flow and without an external carbon source; RPB—reactor without an electric current flow and with a potassium bicarbonate dosage; RCA—reactor without an electric current flow and with an acetic acid dosage; RH2—reactor with an electric current flow and without an external carbon source; RPB+H2—reactor with an electric current flow and with a potassium bicarbonate dosage; RCA+H2—reactor with an electric current flow and with an acetic acid dosage.
Water 10 00393 g006

