Article

Impacts of Climate Change on the Irrigation Districts of the Rio Bravo Basin

by
Jorge Paredes-Tavares
1,2,
Miguel Angel Gómez-Albores
1,
Carlos Alberto Mastachi-Loza
1,
Carlos Díaz-Delgado
1,3,*,
Rocio Becerril-Piña
1,3,
Héctor Martínez-Valdés
1 and
Khalidou M. Bâ
1
1
Centro Interamericano de Recursos del Agua, Facultad de Ingeniería, Universidad Autónoma del Estado de México, Toluca 50100, Mexico
2
Facultad de Planeación Urbana y Regional, Universidad Autónoma del Estado de México, Toluca 50130, Mexico
3
Red Lerma—Centro Interamericano de Recursos del Agua, Facultad de Ingeniería, Universidad Autónoma del Estado de México, Toluca 50100, Mexico
*
Author to whom correspondence should be addressed.
Water 2018, 10(3), 258; https://doi.org/10.3390/w10030258
Submission received: 16 December 2017 / Revised: 9 February 2018 / Accepted: 26 February 2018 / Published: 2 March 2018

Abstract

:
This paper analyzed the evolution of climate data in the Rio Bravo Basin in Mexico from 1980–2009 and projects future climate conditions in this region. Then, the potential impacts of climate change on water resources for crops in the nine irrigation districts (IDs) of the Rio Bravo Basin were evaluated. Specifically, climate data on precipitation, maximum and minimum temperatures, and evapotranspiration from the baseline period of 1980–2009 were compared with projected climate conditions for 2015–2039, 2045–2069, and 2075–2099. The projections were based on two representative concentration pathways (RCPs) of greenhouse gases in the atmosphere (RCP4.5 and RCP8.5). Patterns in the behavior of the analyzed climate variables over the past ten decades were examined and compared to the projected evolution of these variables through to the end of the century. Overall, in the future, temperatures, rates of evapotranspiration, and crop water demand are expected to increase. Also, the future precipitation patterns of all IDs were modified under the considered scenarios. Finally, the IDs of Acuña-Falcón and Delicias will be the most impacted by climate changes, while Palestina will be the least affected.

Graphical Abstract

1. Introduction

The integration and availability of spatial-temporal series of high-resolution climate data [1] enable the study of climate variability, climate changes, or even future climate scenarios. Time series data play an important role in the assessment and monitoring of various phenomena such as desertification [2], forest fires [3], water resources [4], flooding [5], food security, and climate change [6]. Understanding the magnitude and extent to which systems will be affected by climate change is critical in order to design policies that outline effective adaptation strategies [7]. To analyze potential climate changes in the future, the Intergovernmental Panel on Climate Change (IPCC) has used models to project possible climate conditions based on different levels of greenhouse gas (GHG) concentrations in the atmosphere [8]. Most recently, in the Fifth Assessment Report (AR5), several trajectories for GHG concentrations were published. These representative concentration pathways (RCPs) describe possible scenarios for 2100 that are characterized by a total radiative forcing between 2.6 and 8.5 Wm−2 [9]. In particular, four scenarios were presented: one scenario in which mitigation efforts lead to a low radiative forcing (RCP2.6), two scenarios of GHG stabilization (RCP4.5 and RCP6.0), and one final scenario reflective of a very high GHG concentration (RCP8.5). By the end of the 21st century, the average global temperature is likely to increase 1 °C with respect to the 1850–1990 period in the RCP2.6 scenario, 1.8 °C in the RCP4.5 scenario, 2.2 °C in the RCP6.0 scenario, and 3.7 °C in the RCP8.5 scenario.
Climate change has been identified as a major socioeconomic challenge both globally and regionally. As the effects of climate change become increasingly evident, the future availability of water for human consumption and for agricultural and industrial production is increasingly uncertain [10]. The resulting changes to the water cycle will not be uniform across regions, as changes in the short term and at regional scales will likely be associated with local climate variability [8]. Additionally, climate change will likely have consequences for food security in developing countries.
Changes in temperature and precipitation related to climate change will likely threaten agricultural production and compromise food security in numerous ways. Agricultural production is directly linked with environmental conditions [11] because the production, storage, and distribution of crops, as well as agricultural markets, are sensitive to climate fluctuations, and especially, the availability of water resources [12,13]. In particular, temperature is a primary factor affecting the rate of plant development. High temperatures generally have a negative effect on plant growth, pollination, and reproductive processes and also increase soil water evaporation and crop transpiration [14], which can potentially lead to catastrophic losses in crop productivity and result in widespread famine [15]. Several studies have shown that the phenology of wild and crop plants has evolved with climate changes [16,17,18,19,20]. Even so, increased frequency of elevated temperatures and the resulting stress on plants can cause significant yield losses depending on timing (sensitive growth stages), intensity, and duration. Grain crops are generally more sensitive to elevated temperatures during the reproductive rather than vegetative stages of crop development [17]. Schlenker and Roberts [21] found that yields increase at temperatures up to 20 °C for corn, 30 °C for soybean, and 32 °C for cotton, yet temperatures above these thresholds are harmful. In face of climate changes, agricultural producers must begin to consider variations in temperature as part of their production systems to ensure food security and to meet the rising food demand of the increasing population.
The current water panorama in Mexico which could be greatly affected by several aspects, including: (1) 22.7% of surface water is heavily contaminated; (2) drinking water and sewage coverage are not universal, as coverage remains at 91.6% and 90.2%, respectively; (3) the agricultural sector consumes 77% of the water; (4) 16.2% of aquifers exhibit overdraft conditions; (5) a large portion (40%) of water is lost through system leaks; and (6) less than 50% of waste water is treated [7]. Furthermore, 75% of the national territory is arid or semi-arid, mainly in the central and northern regions, and economic and agricultural development is also concentrated in these areas. Thus, the arid and semi-arid regions have the greatest proportion of hectares destined for agricultural use; however, only one-third of Mexico’s water resources are in these regions. Therefore, the spatial and temporal distribution of water resources is a challenge because regional water availability does not match regional water demand. Agricultural production represents around 3% of GDP and encompasses 22.2 million hectares. Of this area, 15 million hectares are rainfed (67.5%), and 7.2 million hectares are irrigated (32.5%). The yield per hectare of crops such as maize, sorghum, and beans under an irrigated regime is 2.2–3.3 times higher than that of rainfed agriculture [22]. Accordingly, irrigated crops cover only 50% of the area of rainfed crops yet generate 60% of the value of agricultural production in Mexico [23].
Comparatively, irrigated fields are more vulnerable to temperature variations, while rainfed fields are vulnerable to precipitation changes and extreme weather events. Considering a temperature rise of 2.5 °C and a 10% reduction in precipitation, irrigated systems may experience losses of 26–55%. A rise of just 1 °C could reduce net revenue per hectare by USD 403 (403 USD/ha/°C) [24]. Additional factors such as crop choice, land quality, fertilizer, seeds, and irrigation practices differ in developing countries and may influence the effects of climate changes on net agricultural revenues [25].
With respect to irrigated agriculture in Mexico, 3.3 million hectares are under the jurisdiction of 86 irrigation districts (IDs), and 3.9 million hectares form part of 47,000 irrigation units (IUs, smaller public irrigation schemes). Fresh water use in these IDs and IUs represents 76% of total water use in Mexico. The IDs have been developed by the federal government since 1926 for managing and implementing irrigation infrastructure in agricultural areas. Overall, Mexico is ranks seventh worldwide in terms of irrigation infrastructure per surface area, following India, China, United States, Pakistan, Iran, and Indonesia [26].
In irrigation Region VI (Rio Bravo), precipitation is expected to reduce 5–20% over the next 70 years with respect to the current average of 438 mm/year. At the US-Mexico border region, the water quality and quantity of the Rio Grande/Rio Bravo Water Basin will be affected in numerous ways by climate change. This region will experience a water deficit by 2040, and water will be contaminated by 2028, and strongly contaminated by 2047. In this region, water quality was predicted to be more sensitive to the level of GHG in the atmosphere than water quantity [27]. Also, the effects of climate change on reference evapotranspiration (ET) in Mexico were analyzed by Mundo-Molina [28], who projected that ET will increase nearly 7% in the Rio Bravo Basin by 2030. Under this scenario, the water demand of crops may increase 2% to more than 7%. This latter finding supports the need to carry out further in-depth analyses and to store a greater volume of water in the dams or reservoirs of the IDs in the Rio Bravo Basin. Given this context, a complex analysis is required to determine the extent to which climate variability affects different crops in Mexico. Changes in temperature, rainfall, and evapotranspiration affect crops, although plant phenology, crop patterns, and the adaptation capacity of farmers are also important factors [29].
For this reason, considering that the effects of GHGs have not been fully investigated at regional scales, the present study incorporated spatial-temporal series of high-resolution climate data for the Rio Bravo Basin into the projection of future climate changes scenarios (RCP4.5 and RCP8.5) [30] to determine potential future changes in rainfall, temperature (maximum and minimum), and evapotranspiration under these scenarios. Ultimately, the goal was to analyze the possible effects of the considered climate change scenarios on the water requirements of crops in the IDs of the Rio Bravo Basin (RBB) in Mexico.

2. Materials and Methods
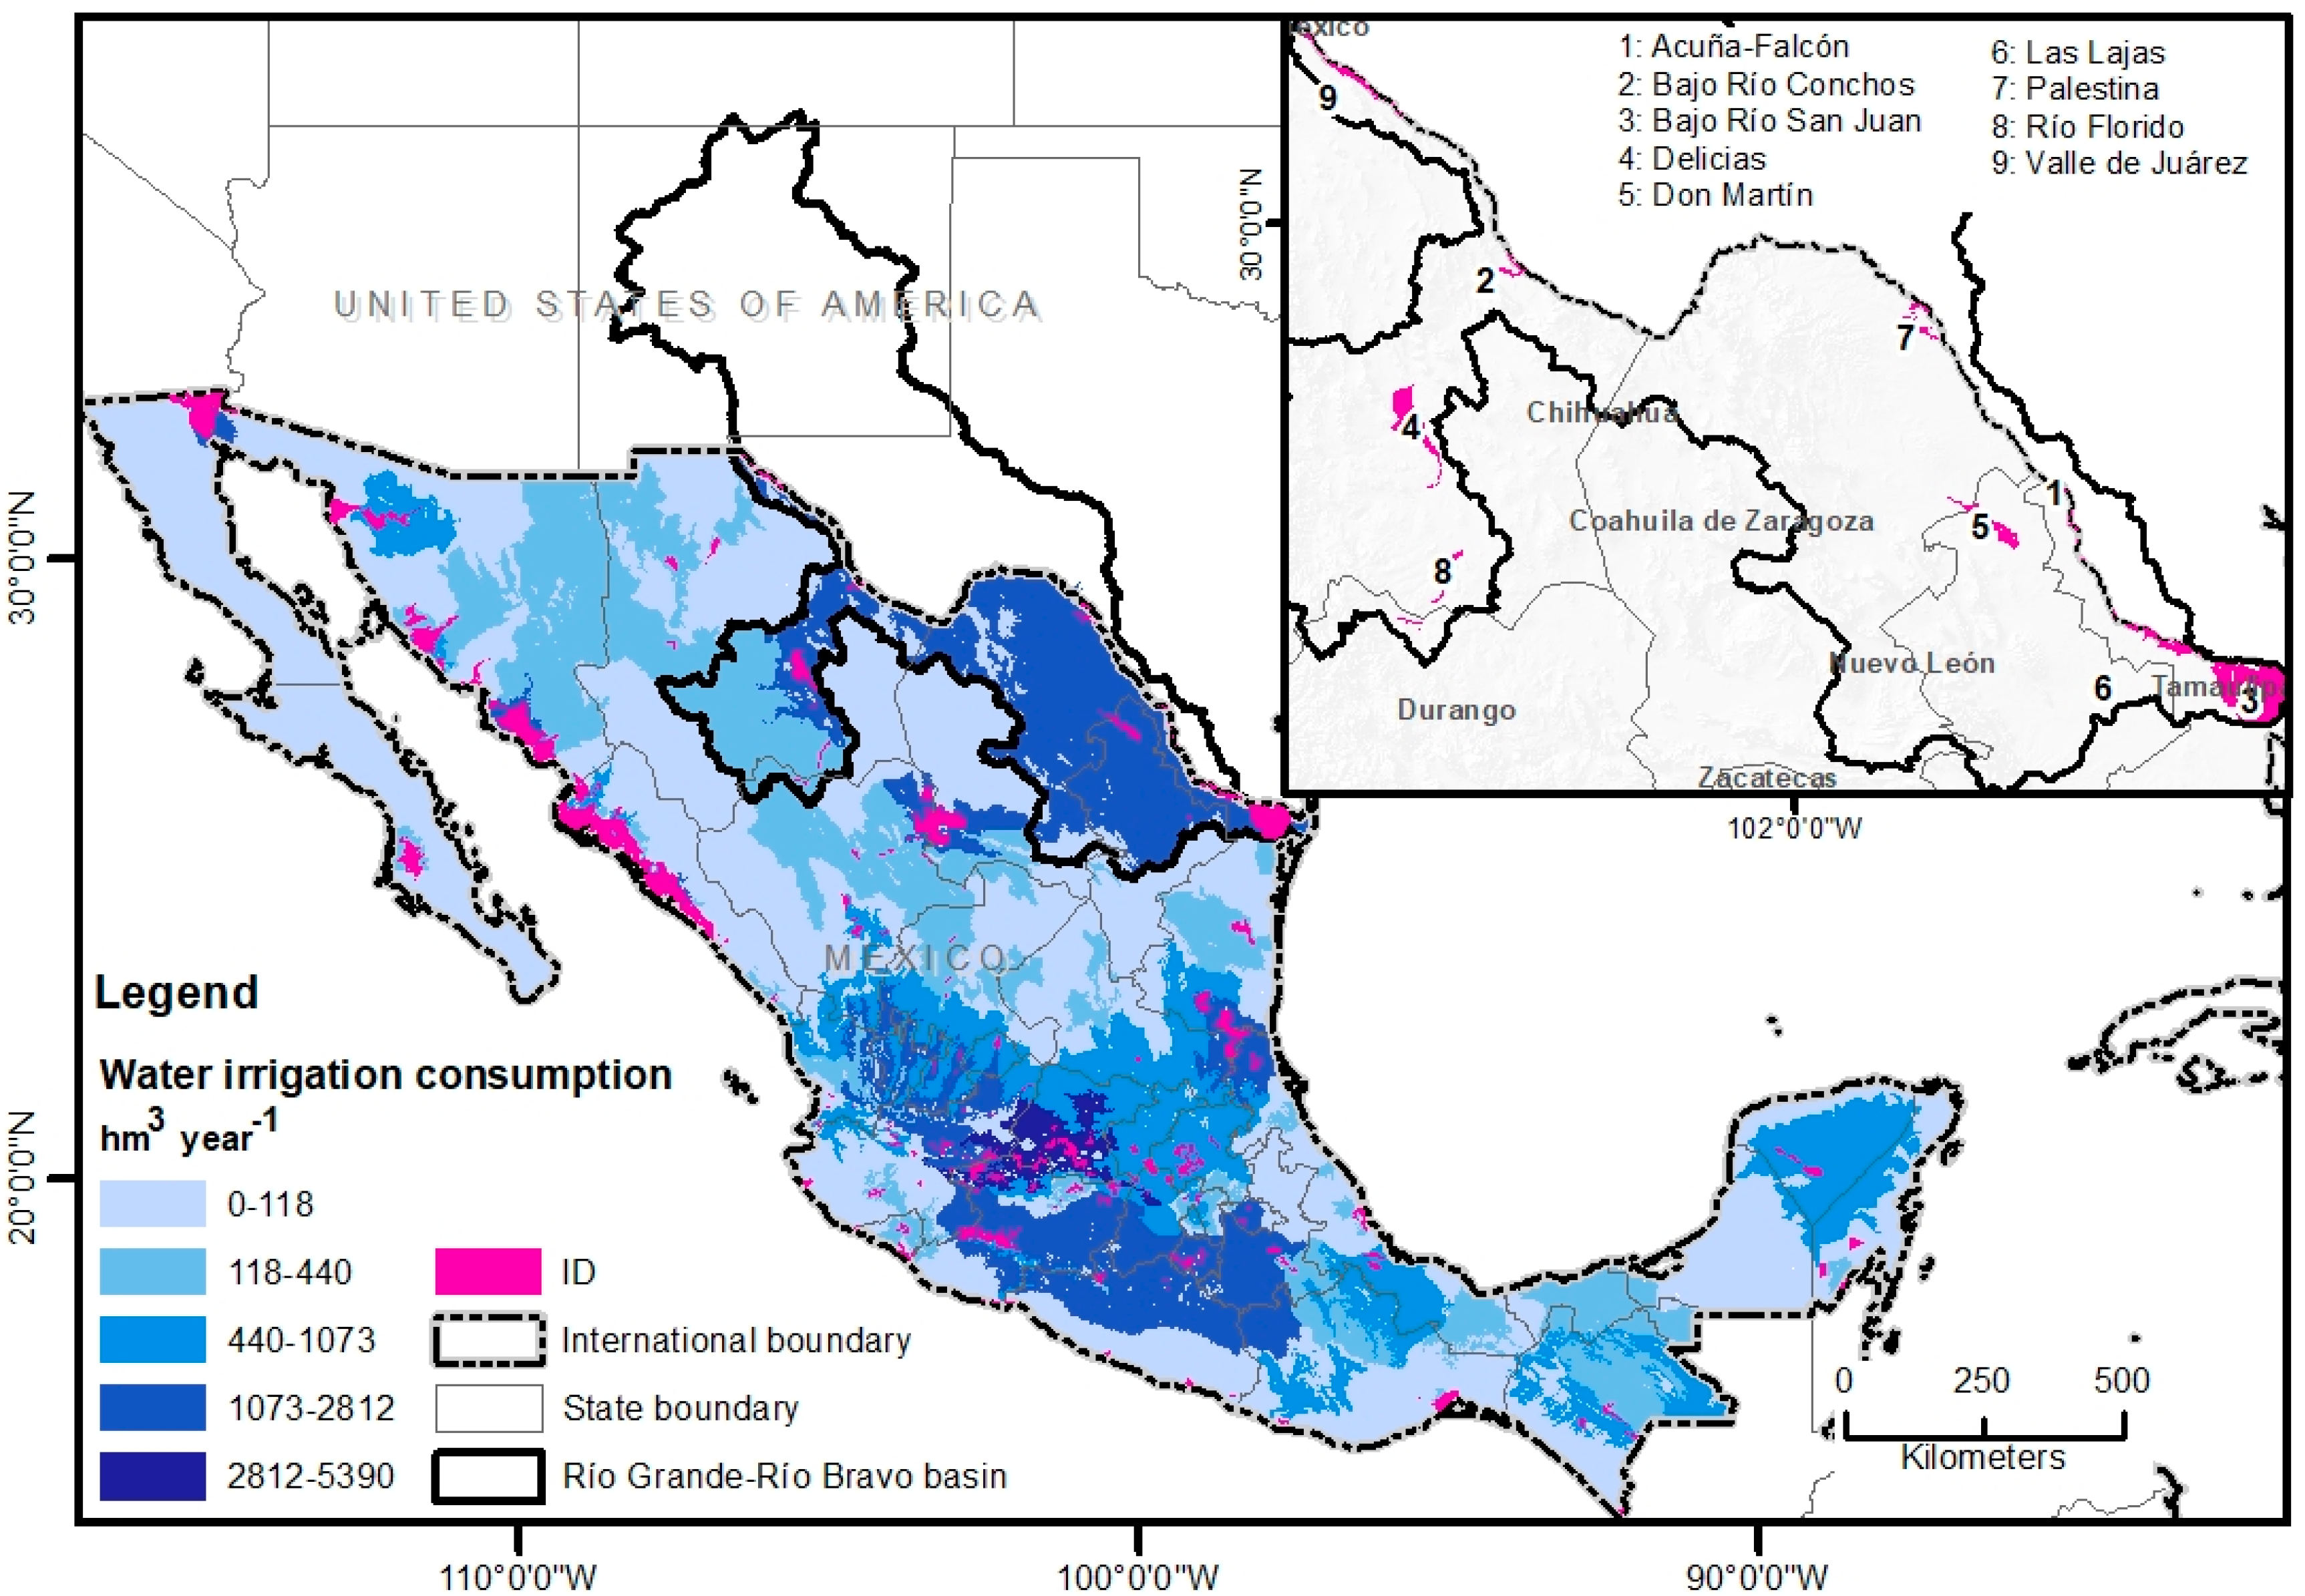
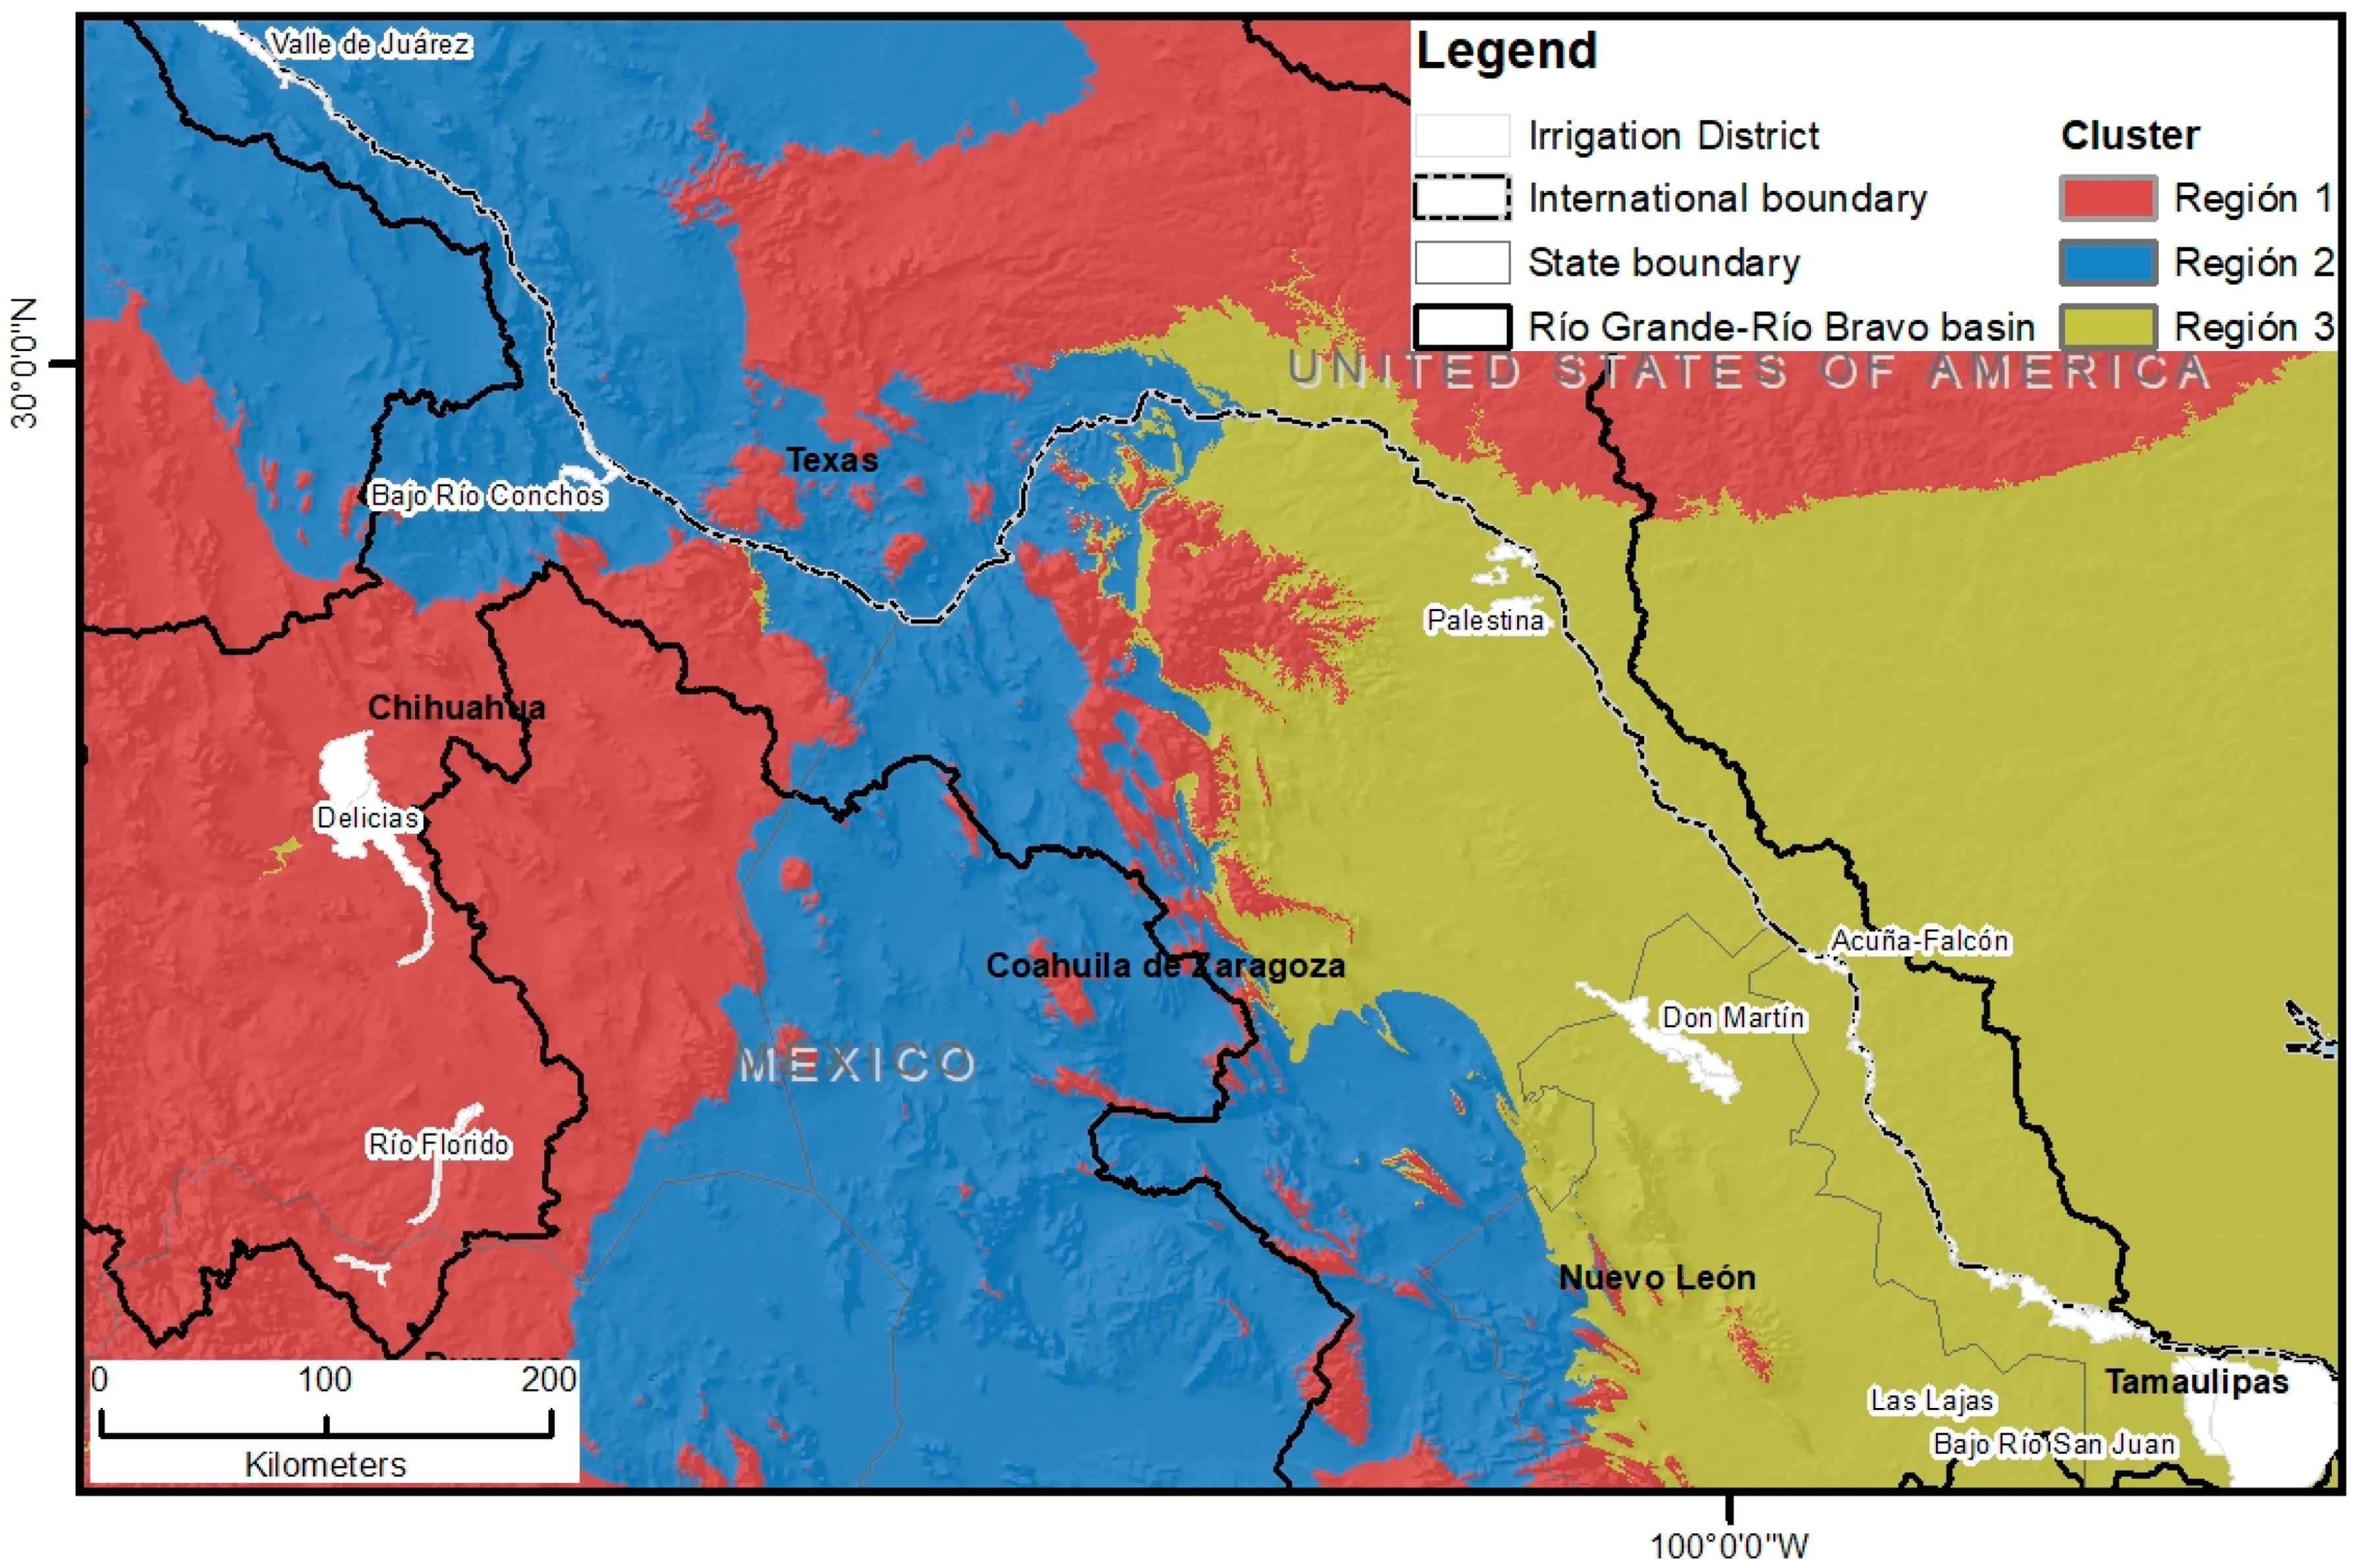
2.1. Study Area

The RBB is located within the hydrological administrative Region VI of Rio Bravo in northern Mexico along the United States border and it represents one of the largest watershed areas in Mexico. Mexico and the United States share the watershed of Rio Grande-Rio Bravo, conferring it with international status. The watershed spans an area of 455,000 km2, and 49.4% of the watershed area is in Mexico, including portions of the states of Coahuila, Durango, Chihuahua, Tamaulipas, and Nuevo León. The Mexican portion of the watershed contains a population of more than 9 million inhabitants. The average annual precipitation of the region is 480 mm, and annual evapotranspiration ranges from 2000 to 2400 mm. Two historical dry periods within the last 100 years can be identified: 1952–1957 and 1993–2002. The main land uses are xeric shrubland (56.2%), grassland (24.7%), forest (10.6%), crops (4.5%), and urban areas and bare soil (4%). Economically, this region contributed 14.29% to the gross domestic product (GDP) of Mexico in 2016, making this region the third most important economic region in the country. The tertiary sector contributed 60% of regional GDP, followed by the secondary (38%) and primary sectors (2%). Crops in this region of the country have the lowest productivity with respect to water consumed (USD 0.13 were generated per m3 of water consumed in 2009) [31].
Also, urban and industrial growth have considerably increased the demand for water in the RBB and have led to intense exploitation of the aquifers in this watershed. As a result, diverse and complex problems exist with respect to the management of regional water resources. For example, 43,439 concession titles were granted for water use, which is the largest number of concessions at the national level, including 6046 concessions for surface water and 37,393 concessions for ground water [22]. The agricultural sector consumes 82% of the water. Consequently, of the 102 aquifers in the region, 34 aquifers are depleted of groundwater, and 18 aquifers are overexploited [22].
The IDs located in the region are Don Martín (004), Las Delicias (005), Palestina (006), Valle de Juárez (009), Bajo Río San Juan (026), Las Lajas (031), Acuña-Falcón (050), Bajo Río Conchos (090), and Río Florido (103) (Figure 1).
The IDs with the largest harvested area in the 2015–2016 period are Bajo Río San Juan and Delicias (Figure 2), where more than 60,000 hectares were harvested, followed by Valle de Juárez, where slightly more than 10,000 hectares were harvested. In the remaining IDs, less than 5000 hectares were harvested. Although Bajo Río San Juan had the largest harvested area, the value of crops produced in Delicias was three times greater; this is due to differences in the dominant crops and the output of each district (Appendix A).

2.2. Database of Past Climate Data

To determine changes in the climate conditions of the RBB over time, the monthly averages for precipitation (P), maximum temperature (Tmax), and minimum temperature (Tmin) for the baseline period (1980–2009) were downloaded from Daymet Version 3 (https://daymet.ornl.gov/). This data set provides gridded estimates of monthly precipitation for Mexico over a continuous surface at a spatial resolution of 1 × 1 km [1].

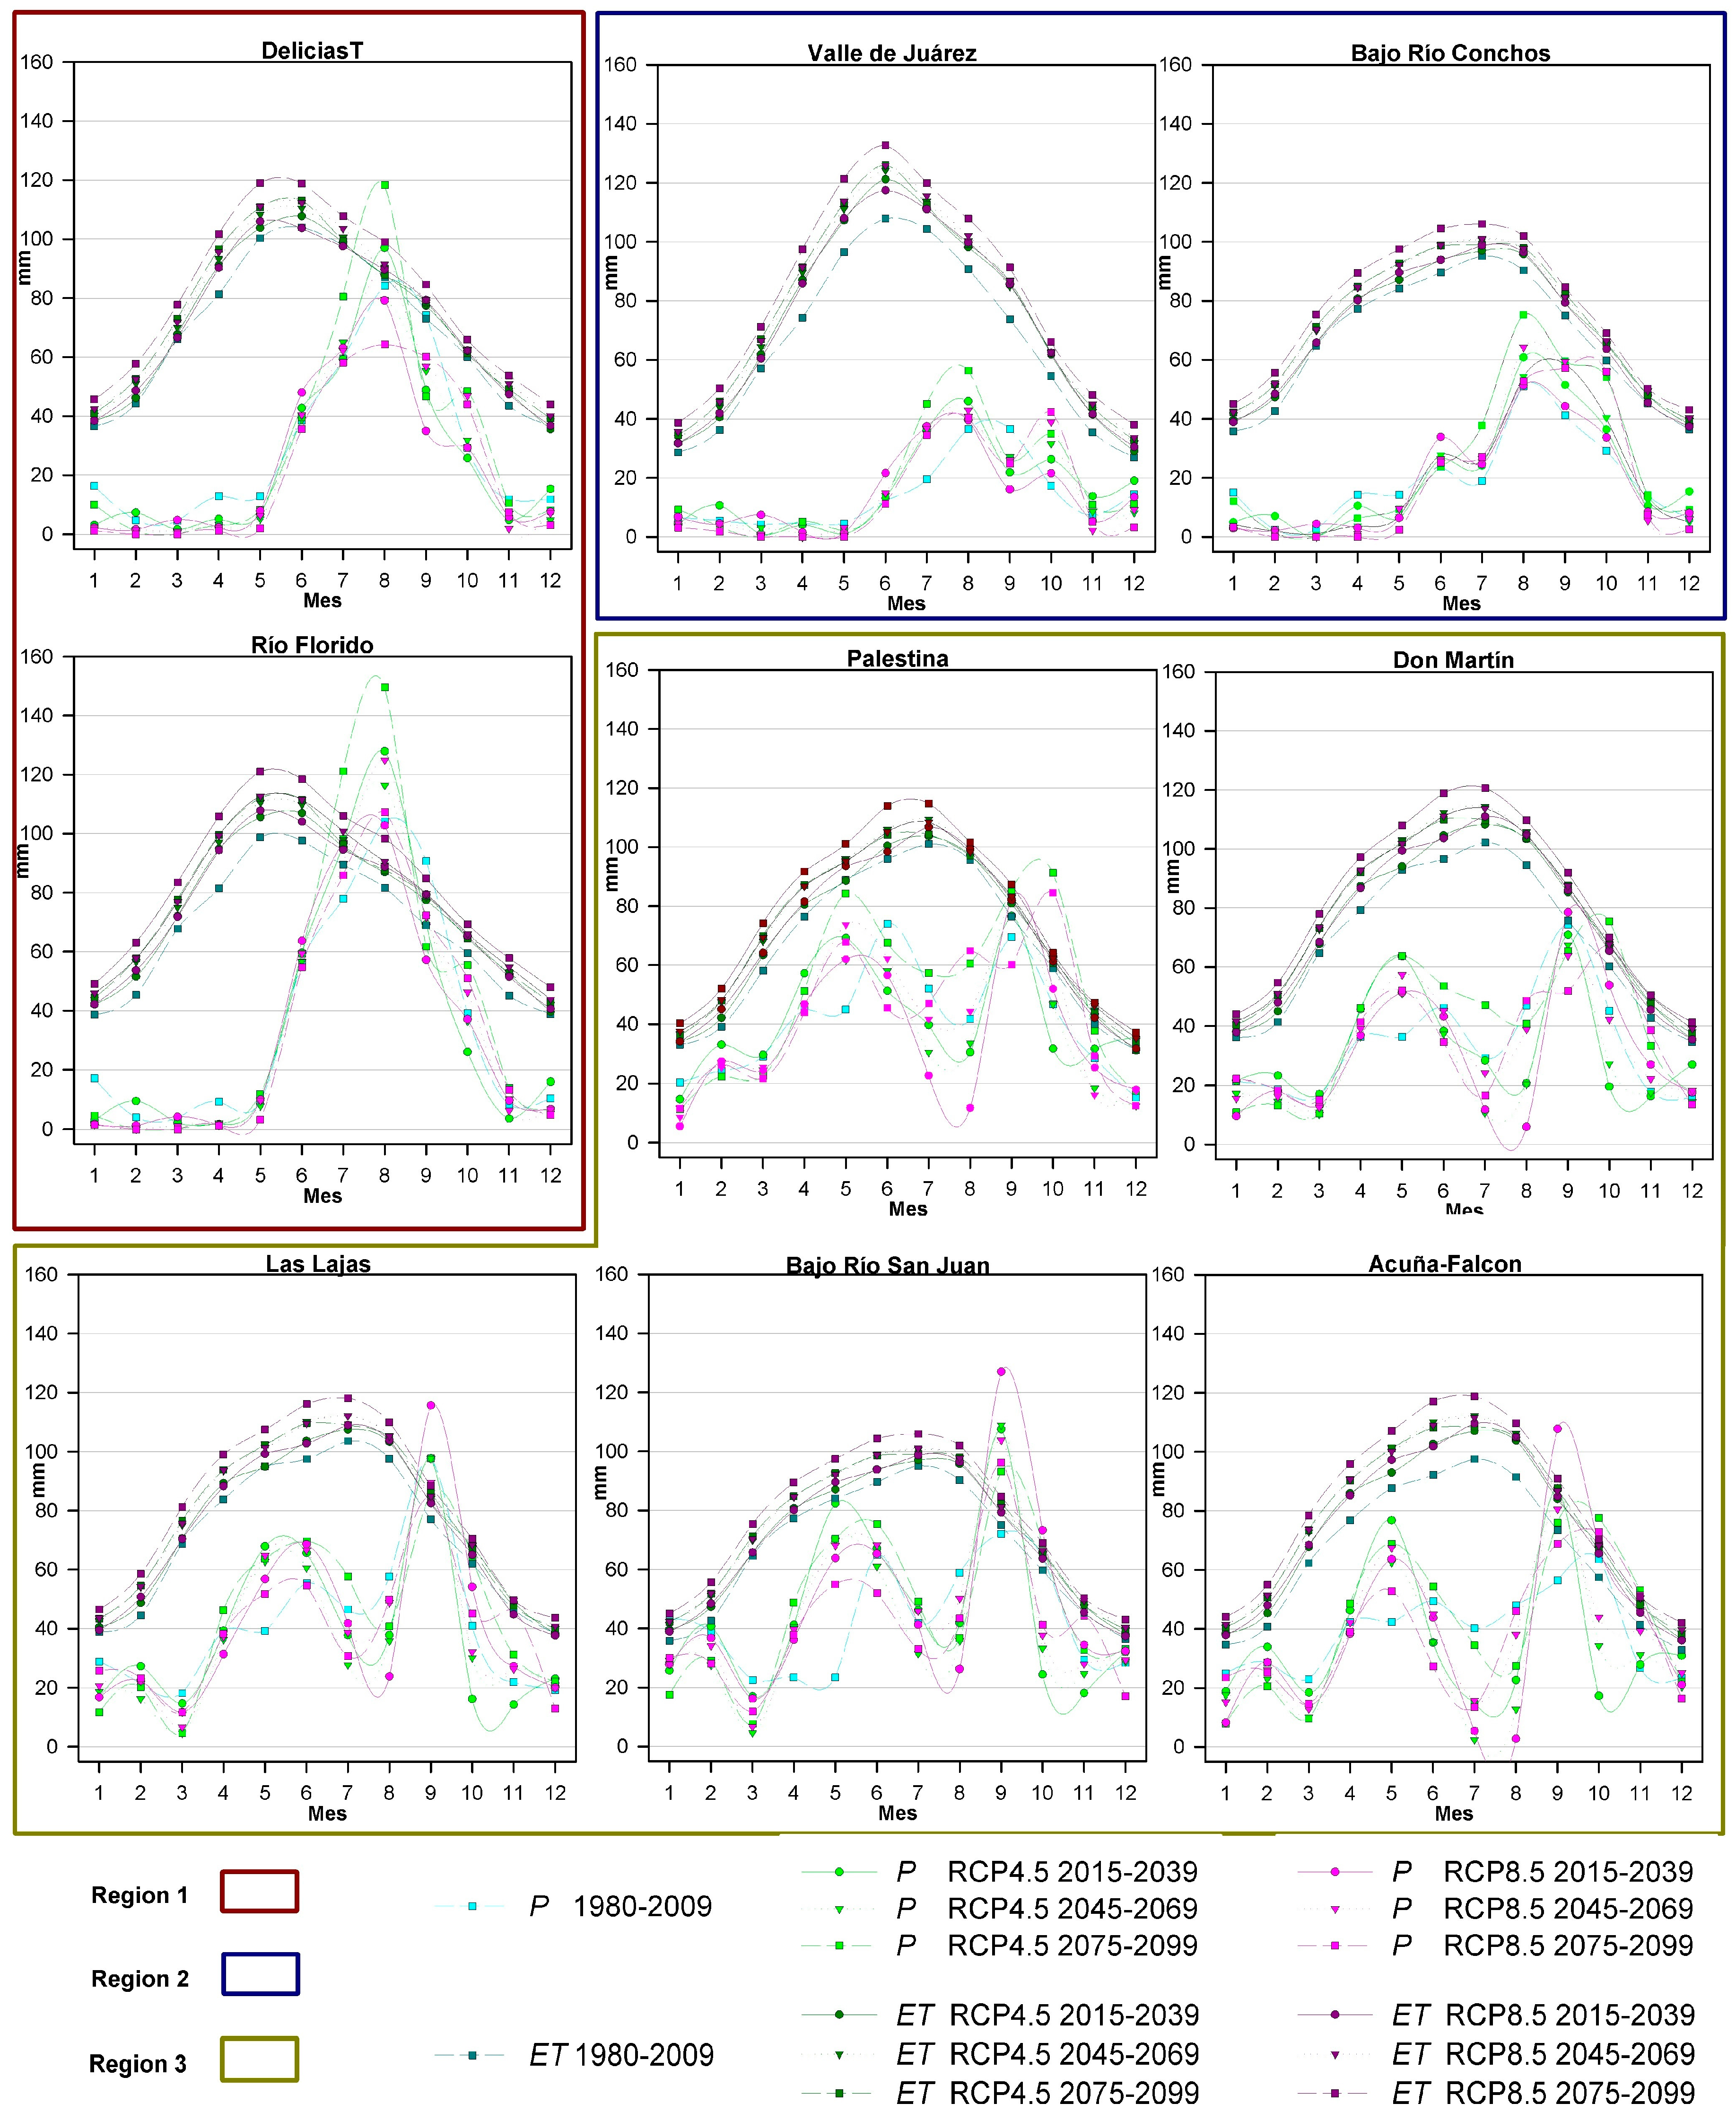
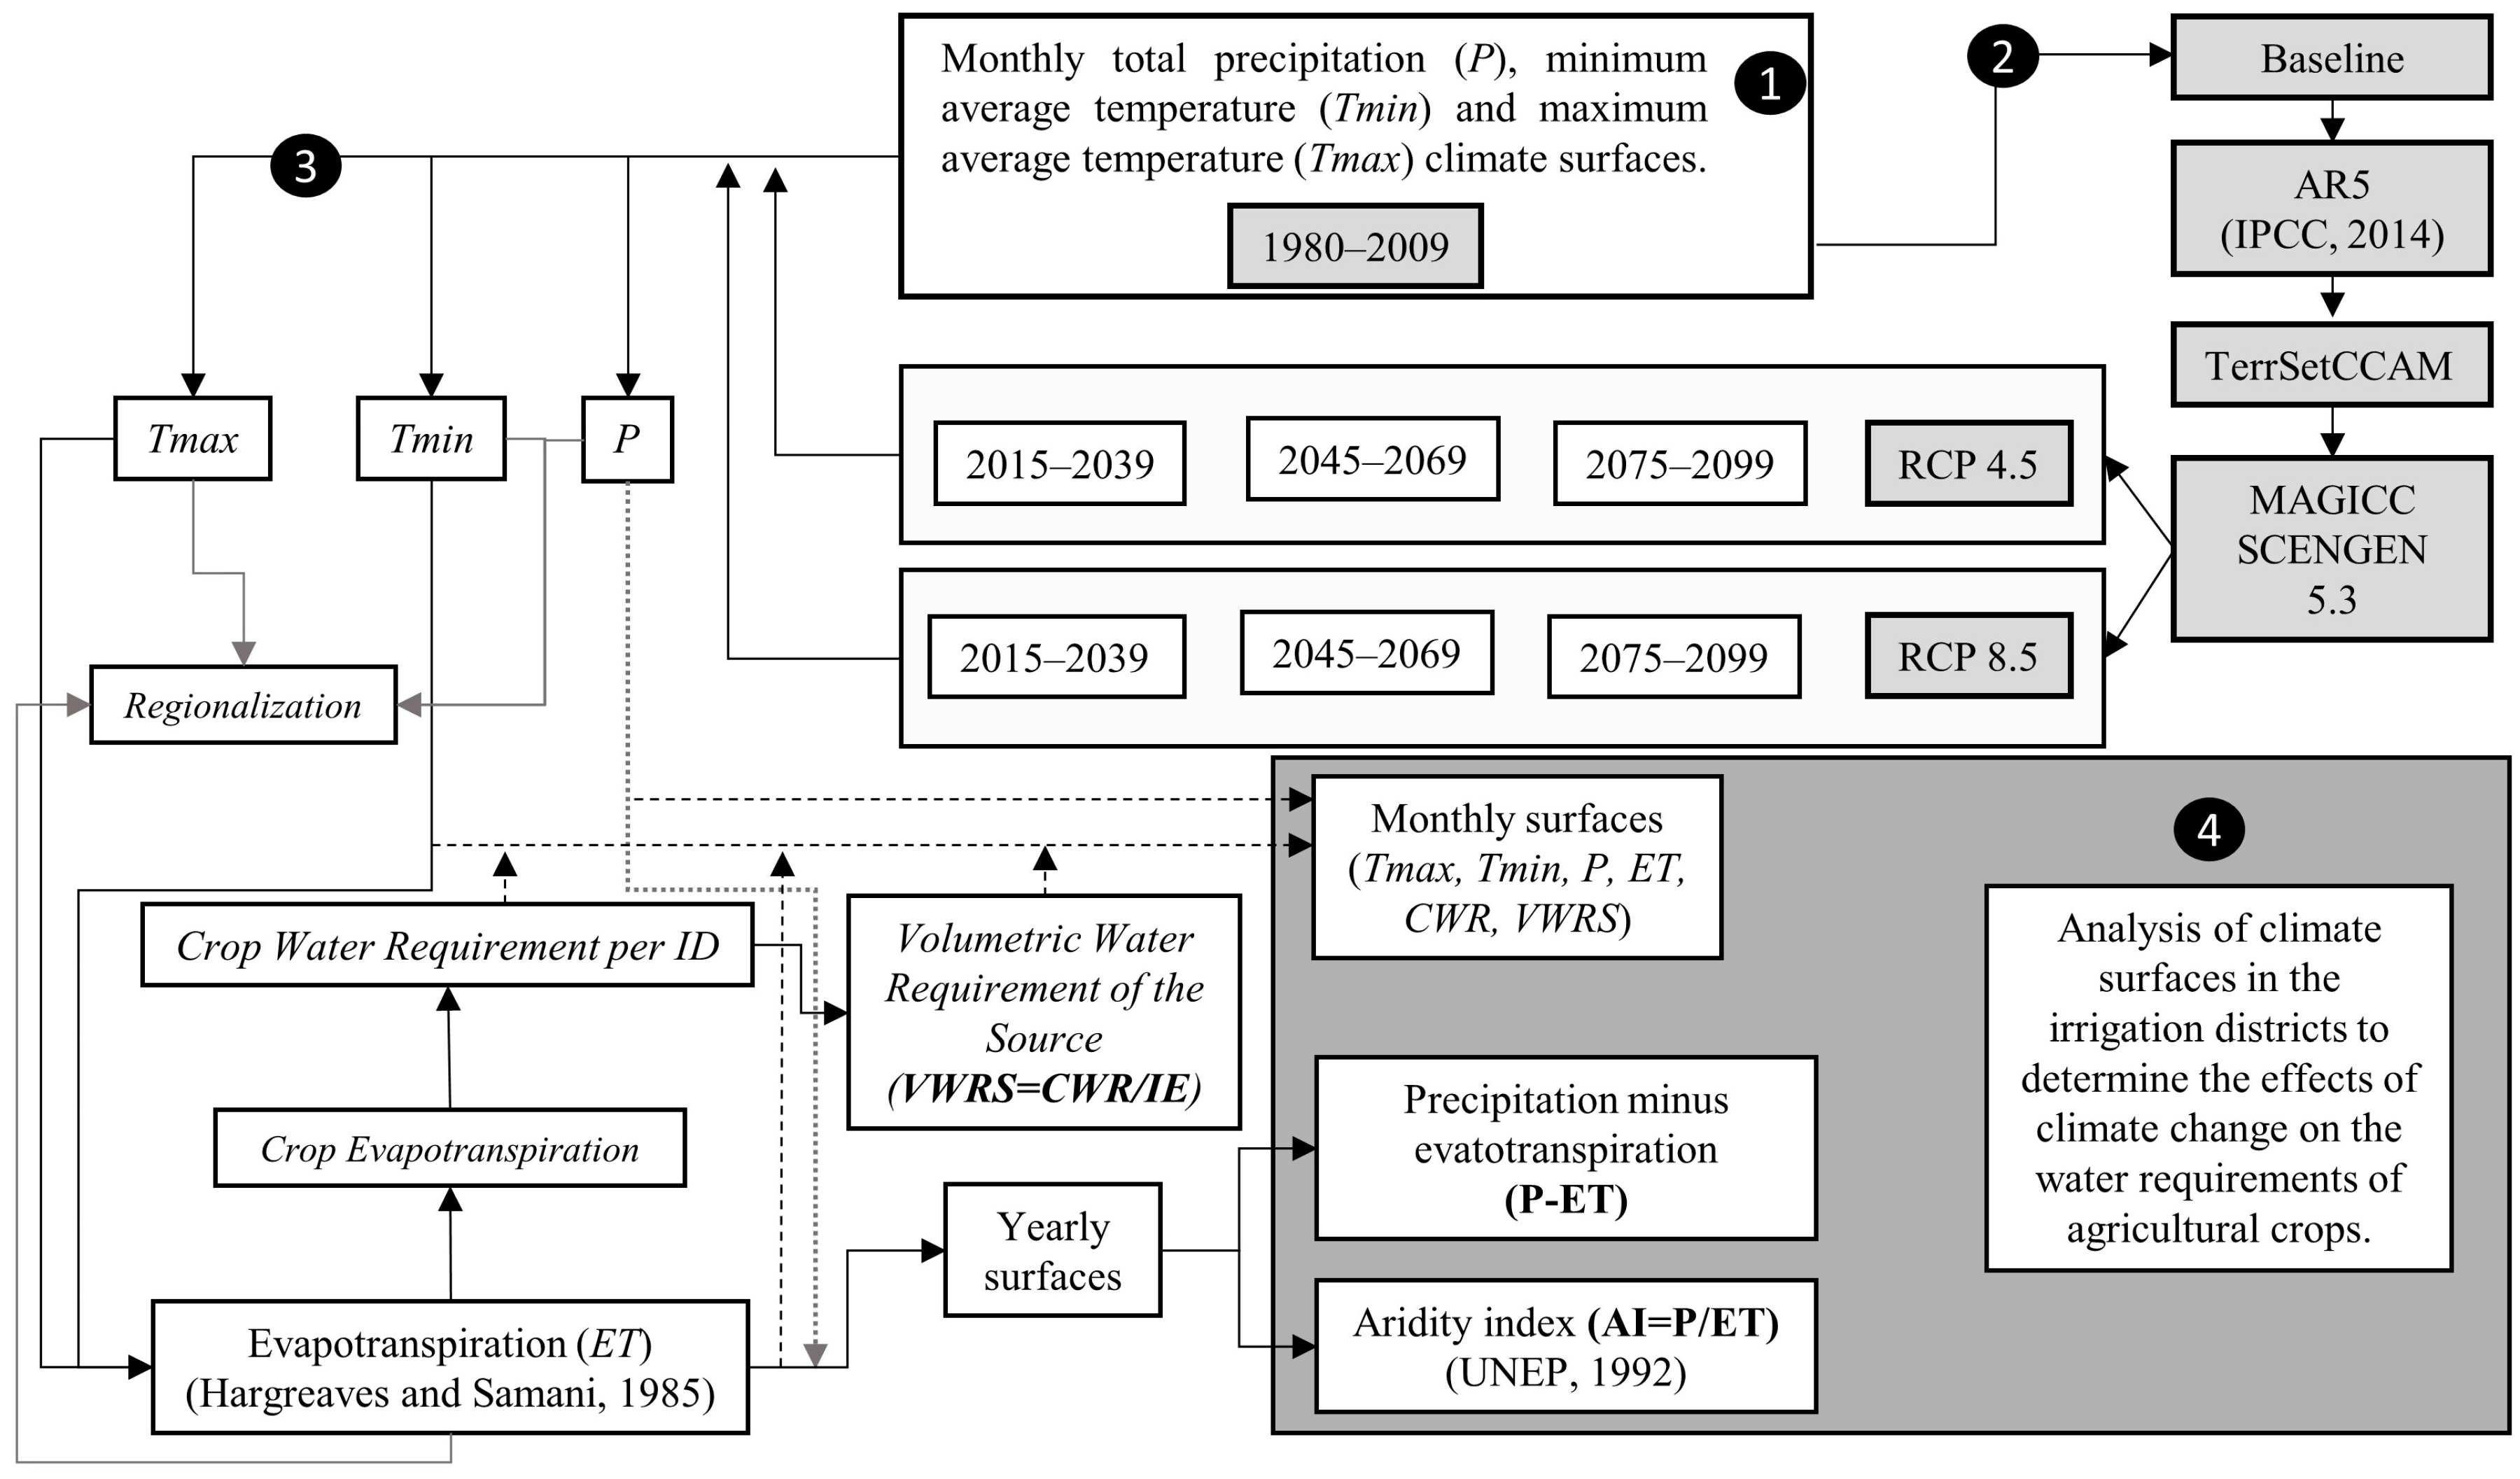
2.3. Analysis and Projection of Climate Data
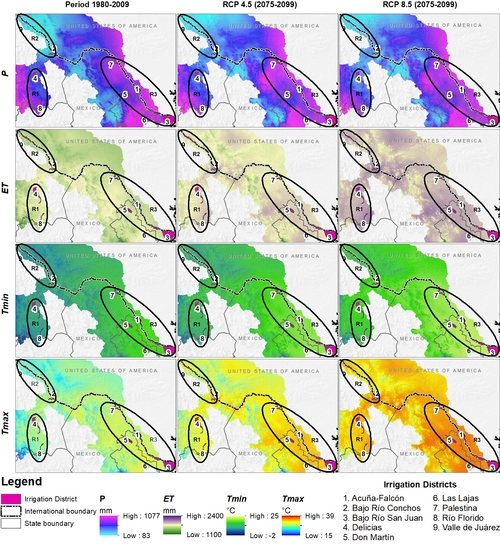
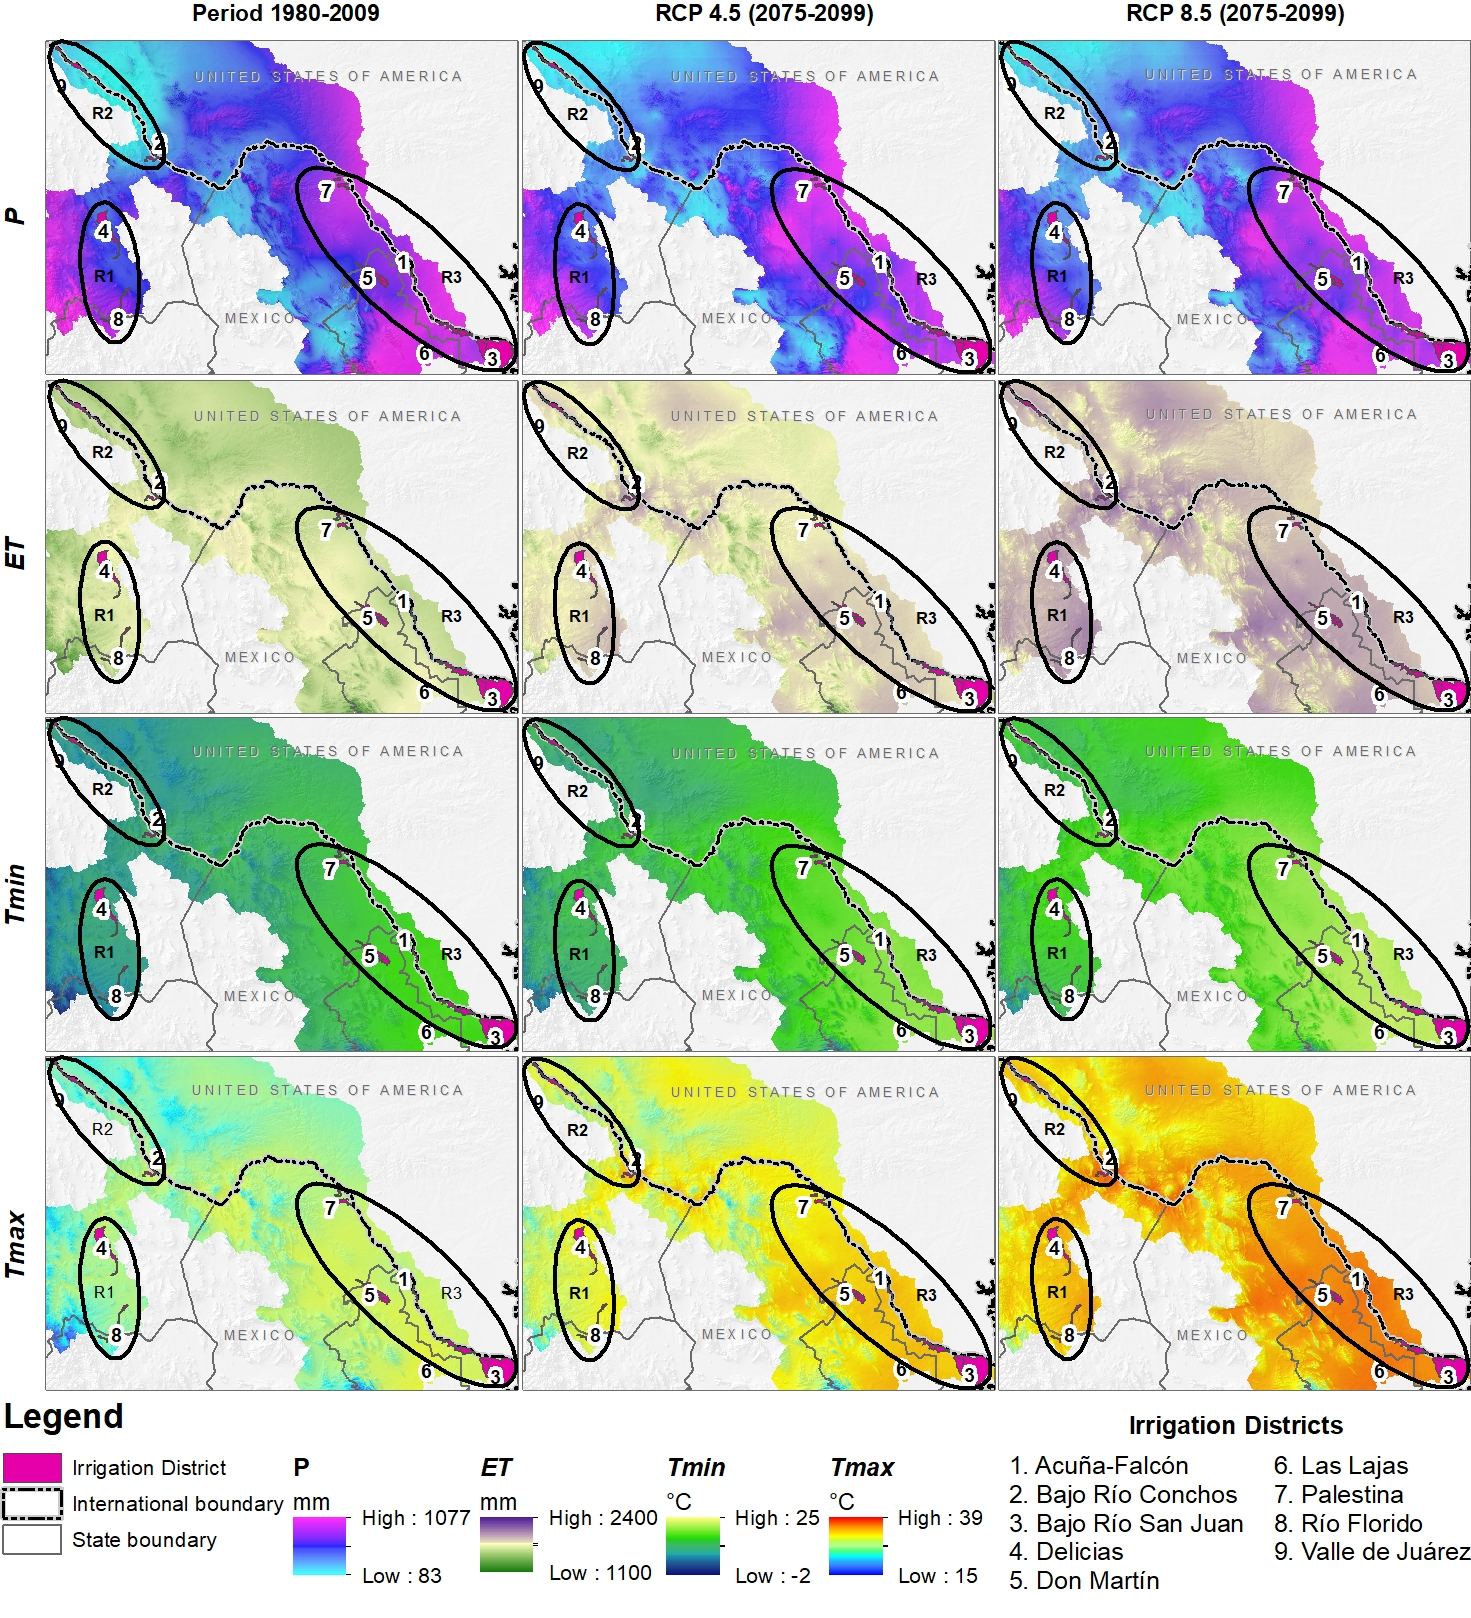
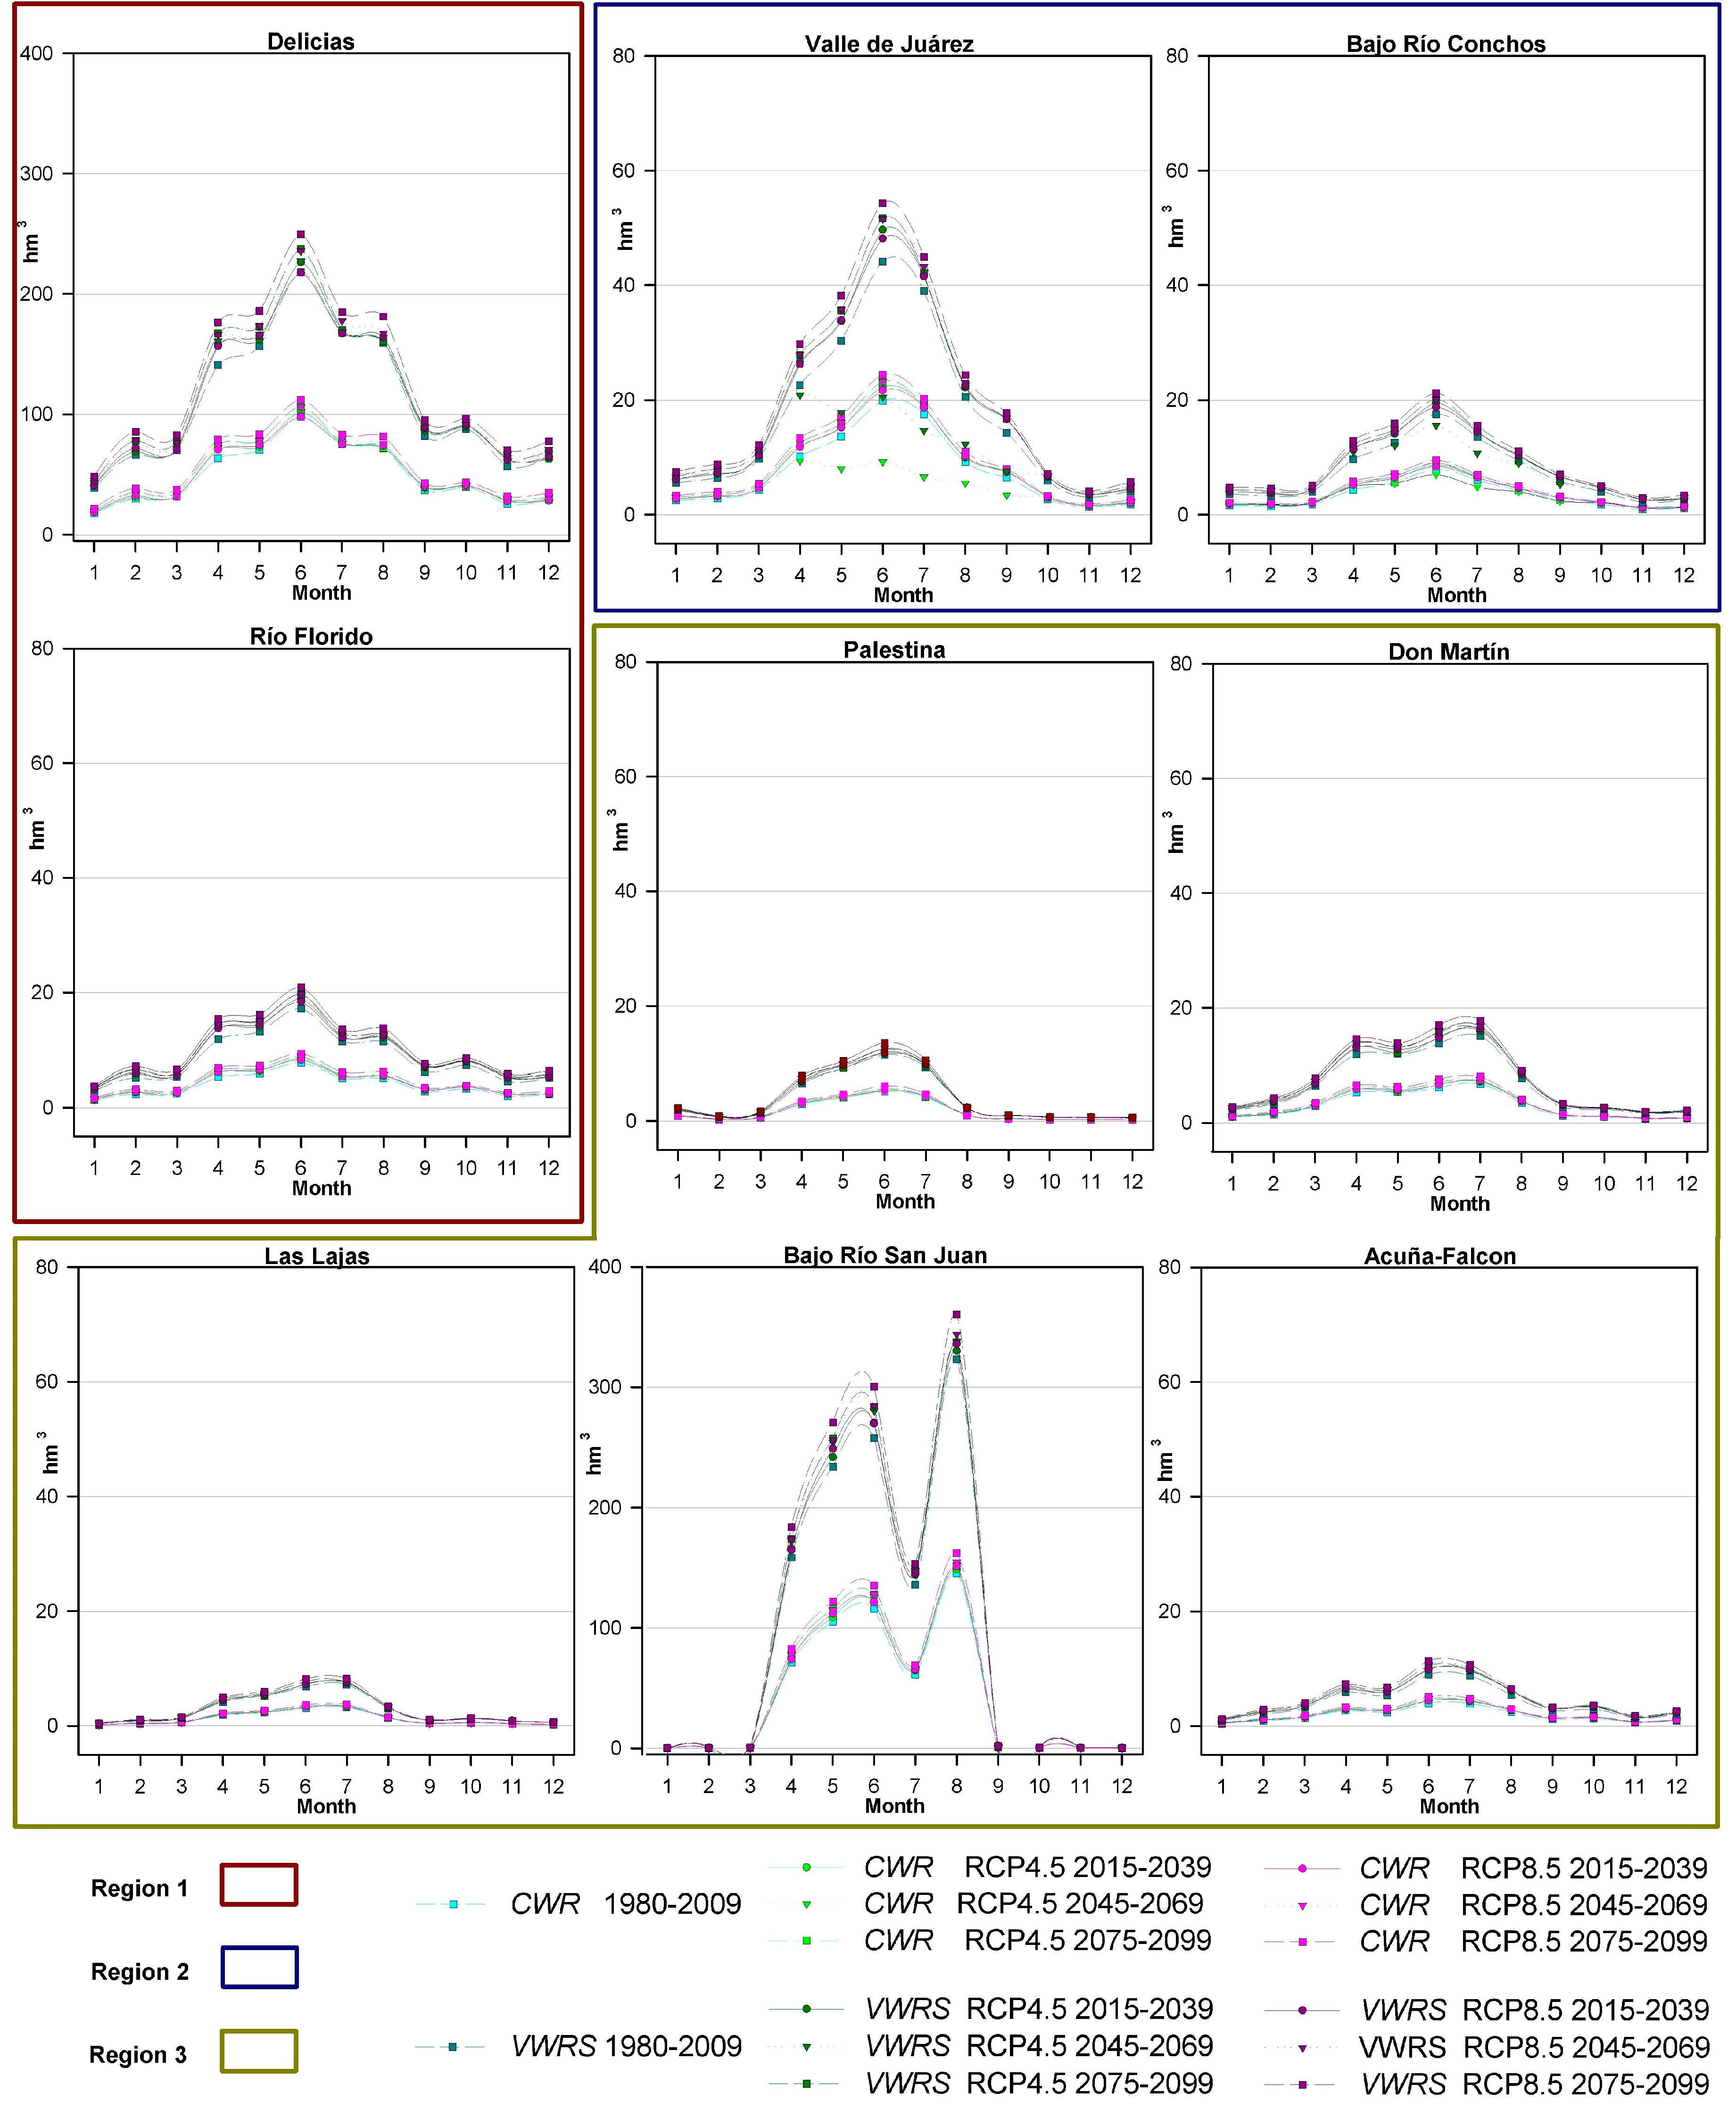
The monthly climate surfaces of P, Tmax, and Tmin for the 1980–2009 period were used as a basis for generating the RCP4.5 and RCP8.5 emission scenarios in the AR5 of the IPCC for the three analysis periods (2015–2039, 2045–2069, and 2075–2099) (Figure 3: Step 2) [30].
Scenarios of climate change induced by different GHG concentrations (RCP4.5 and RCP8.5) were generated using the climate change adaptation modeler (CCAM) in the TerrSet software [32]. A model for generating regional climate change scenarios (MAGICC/SCENGEN) was also incorporated [33]. In this study, the RCP2.6 scenario was not considered because it is optimistic and therefore improbable [34]; in addition, RCP6.0 was not considered because it represents an intermediate scenario between RCP4.5 and RCP8.5.
First, the climate conditions for each scenario were obtained. Then, evapotranspiration (mm/month) was calculated according to the following formula (Figure 3, Step 3 [35]):
E T = ( 0.0135 ( T m e d + 17.78 ) R s ) × # days   in   the   month
where Tmed is the average daily temperature in °C (Tmed = [Tmax + Tmin]/2), and Rs is the incident solar radiation on day 15 of the month in mm/day, which was calculated using the formula proposed by Zomer et al. [36]:
R s = 0.16   R a   R T 0.5
where Ra is the extraterrestrial solar radiation in mm/day obtained from the Consortium for Spatial Information (http://www.cgiar-csi.org/) [36], and RT is the daily temperature range in °C (RT = TmaxTmin).
Then, the monthly crop coefficients (Kc) [37] were calculated for the distinct crop types reported in the study area for the 2015–2016 agricultural period (Appendix B). These values were then used to obtained crop evapotranspiration under standard conditions (ETc) according to the following equation:
E T c = E T × K c
The ETc values for each crop were used to obtain the respective crop water requirements (CWR) for each irrigation district as follows:
C W R = i N E T c i × H a r v e s t e d   a r e a i
where N is the sum of the different crops (i) reported for the 2015–2016 agricultural period for each irrigation district (Appendix A). The data reported for the 2015–2016 agricultural period were also used as a basis for projecting the RCP4.5 and RCP8.5 scenarios. Based on these results, the volumetric water requirement of the source (VWRS) was calculated by dividing the CWR by the irrigation efficiency (IE); according to Magaña [38], the average IE for Mexico is 0.45. In this case, the IE was assumed to remain constant through 2100.
To identify climate similarities between IDs, a spatial cluster analysis [39] was performed using the P, Tmax, Tmin, and ET of the baseline period. Also, to analyze changes in climate conditions, the average monthly behavior of Tmax, Tmin, P, ET, CWR, and VWRS was extracted from the polygons of the IDs, and monthly changes in the variables per projected scenario and time period were compared to the baseline scenario (Figure 3: Step 4). For all scenarios, the aridity index (AI = P/ET) proposed by the United Nations Environment Programme (UNEP) [40] and the difference between precipitation and evapotranspiration (P-ET) were also calculated on an annual basis. Both parameters were considered to be important indicators of the interaction between the atmosphere and the land surface and to be representative of any overall changes in the regional water balance. Likewise, in the case of semi-arid regions, such as those of the study area, these parameters can be used to confirm the presence of water deficits [41,42,43].

3. Results

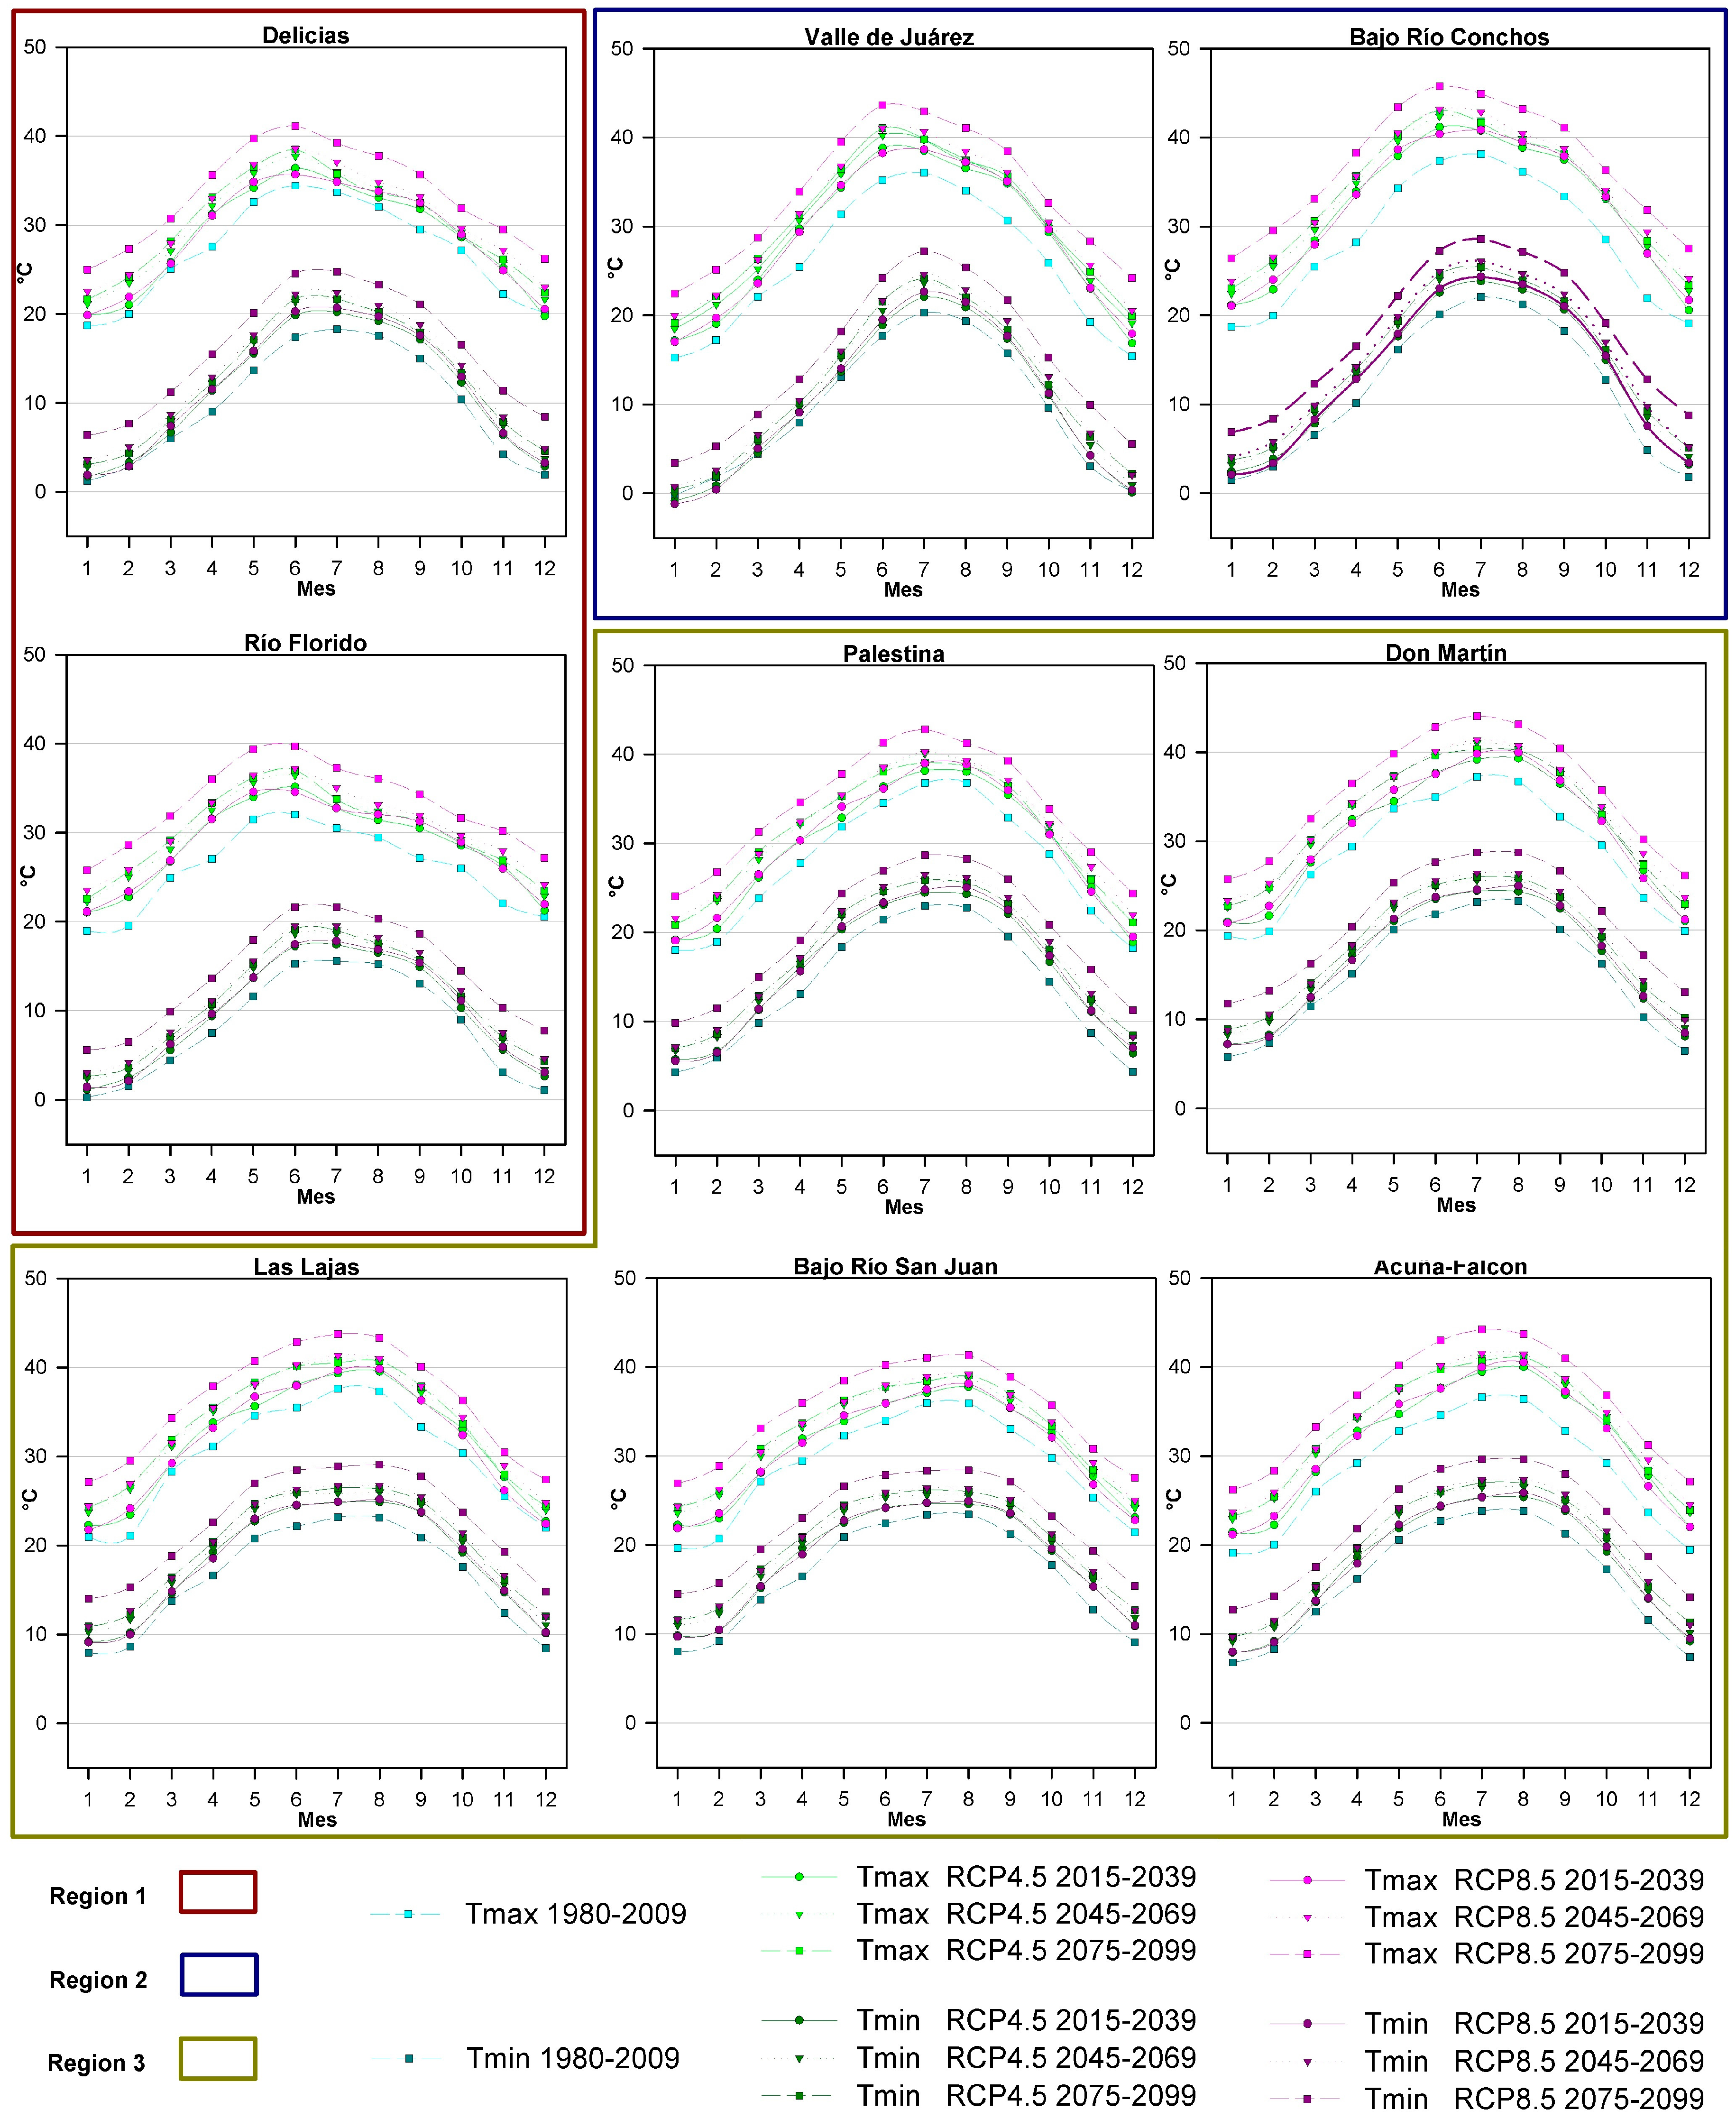
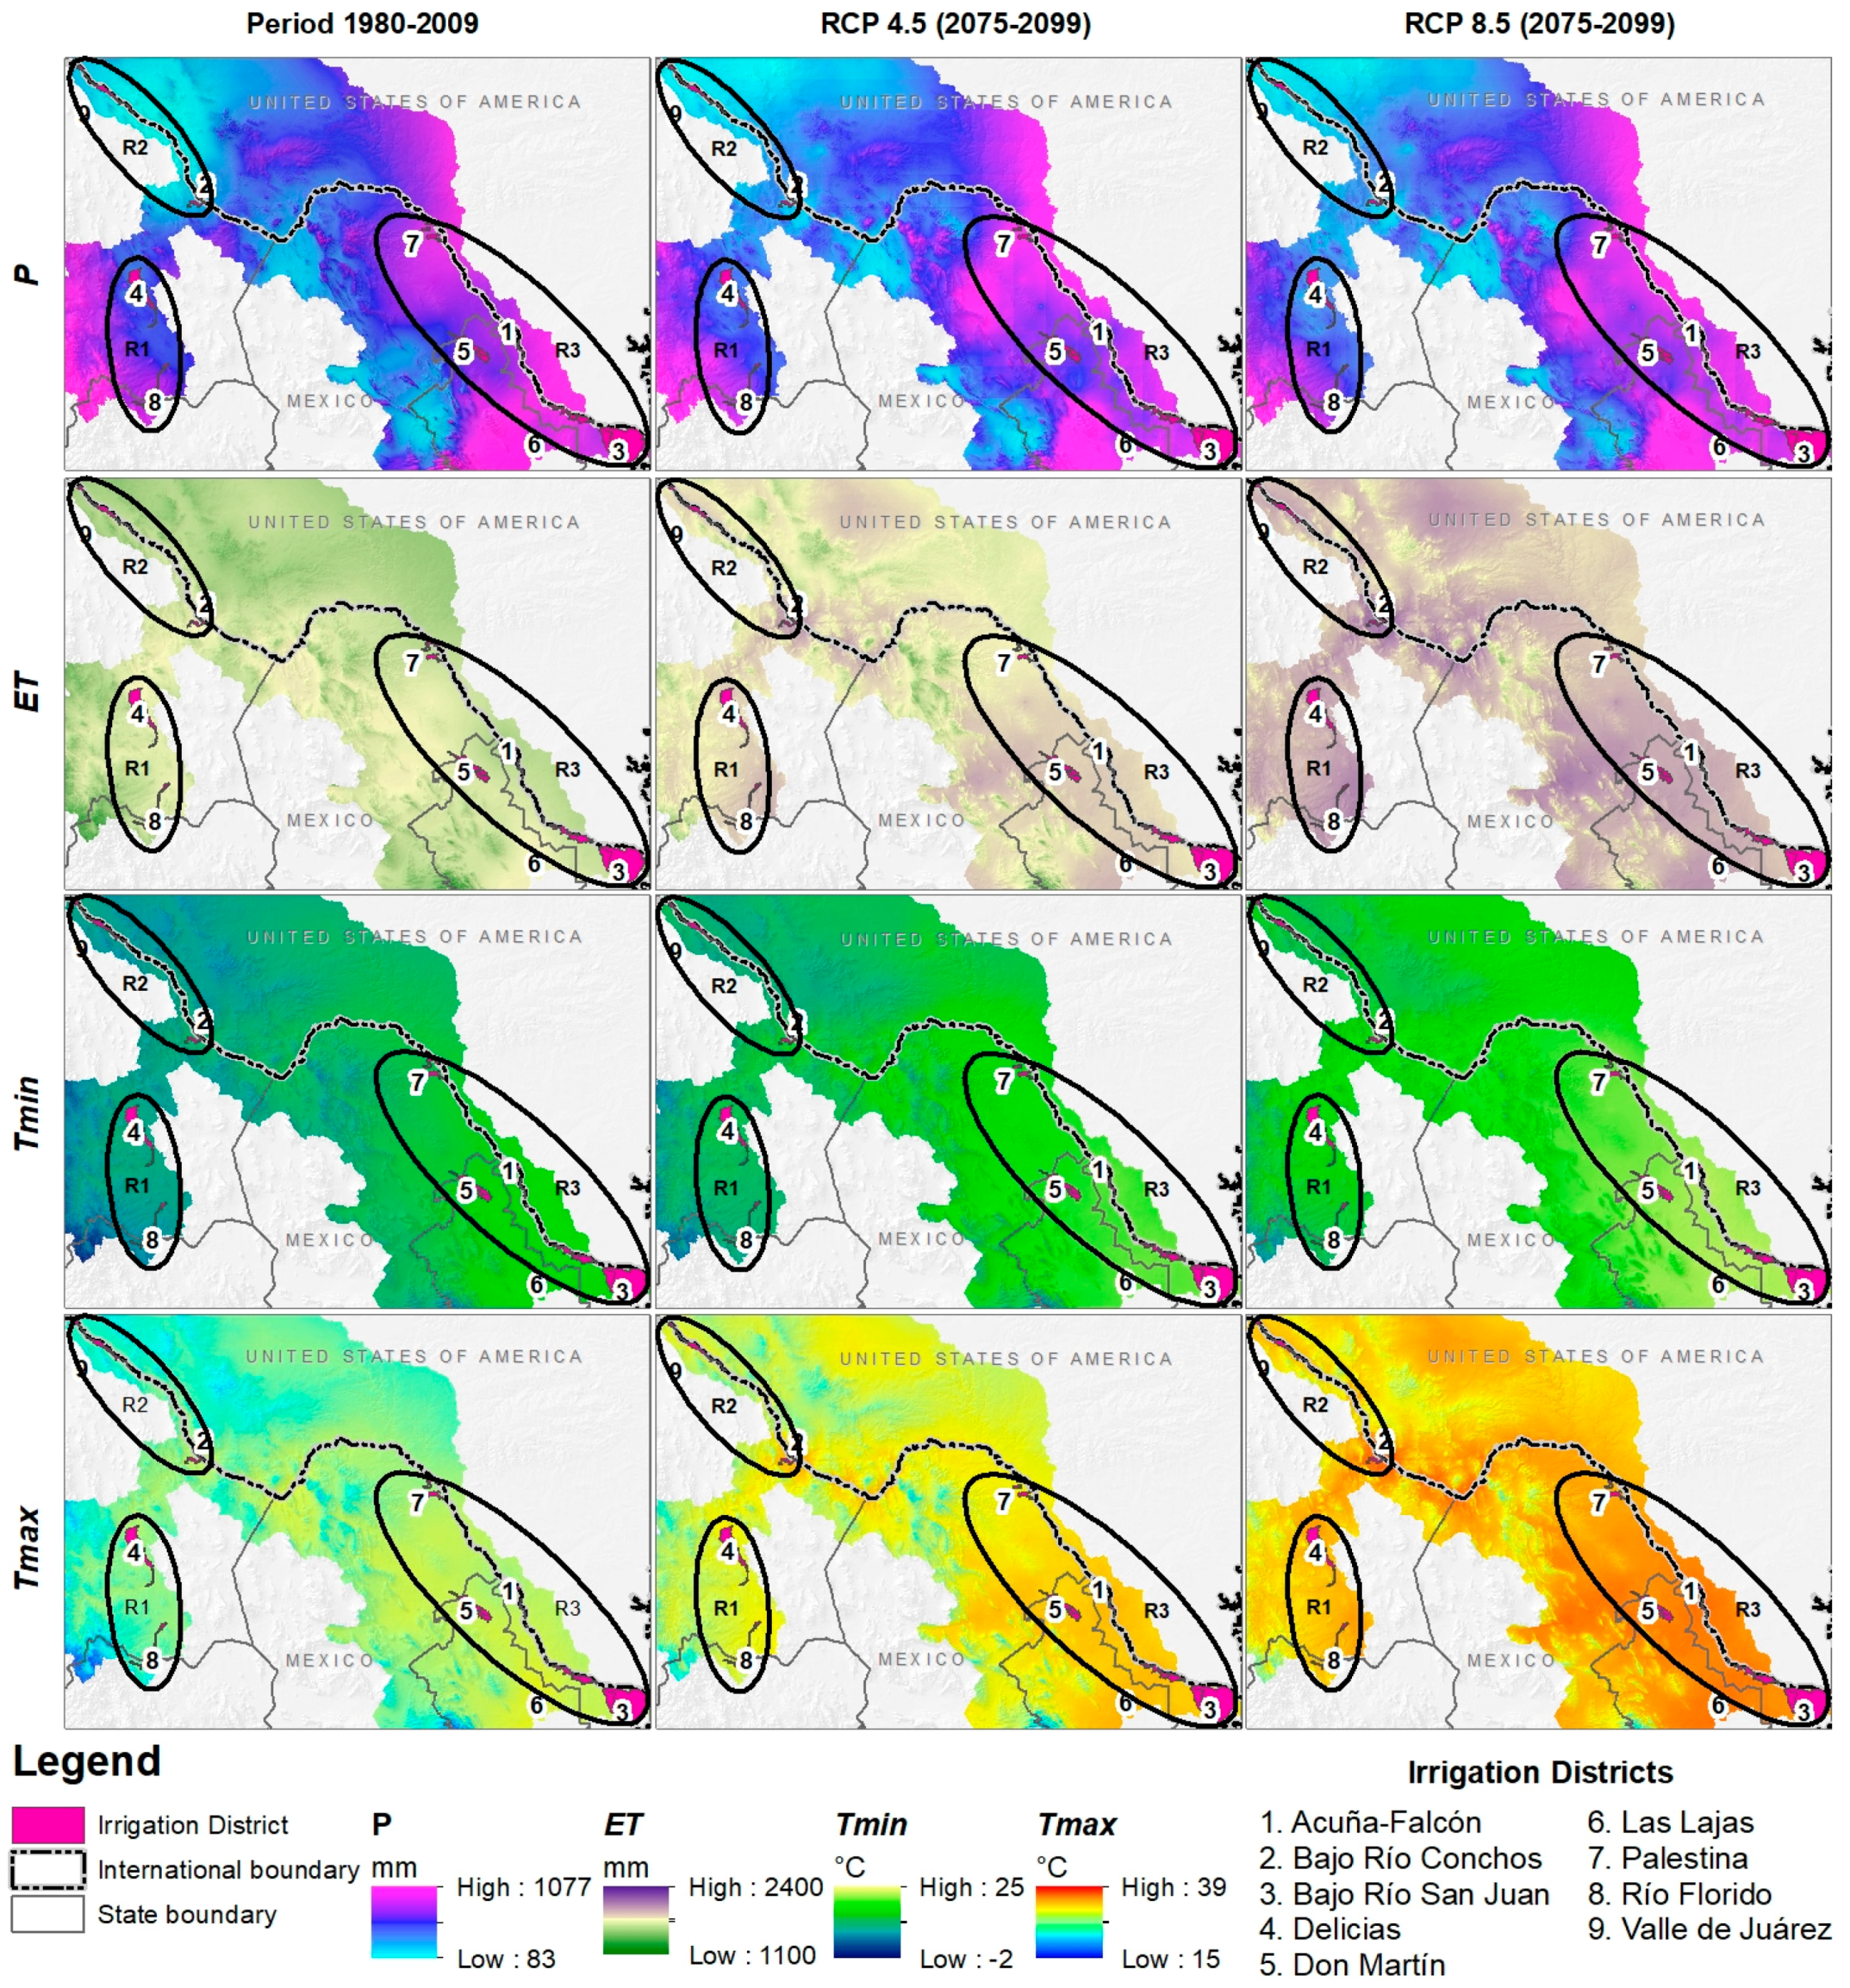
3.1. Changes in Climate Conditions

Three main regions can be identified according to climate behavior (Figure 4). The maximum temperature (Tmax), minimum temperature (Tmin), precipitation (P), and evapotranspiration (ET) behaved distinctly across the study region during the analyzed time periods (Figure 5, Figure 6 and Figure 7).
Region 1 contains the IDs of Delicias and Río Florido. This region presents a marked rainy (June–October) and dry season (November–May). The average annual conditions for 1980–2009 correspond with a P = 367 mm, ET = 1626 mm, Tmin = 8.9 °C, and Tmax = 26.2 °C. Under the RCP4.5 scenario, P is expected to decrease 35 mm by 2069 but return to the baseline average by 2100. The ET is expected to increase 182 mm by 2100. Under the RCP8.5 scenario, average annual P is expected to decrease 83 mm and average annual ET to increase 334 mm by 2100. The annual average Tmin and Tmax are expected to increase 2.9 °C and 3.2 °C, respectively, by 2100 under the RCP4.5 scenario and 5.9 °C and 6.3 °C, respectively, under the RCP8.5 scenario.
Region 2 contains the IDs of Valle de Juárez and Bajo Río Conchos. This region receives the least amount of P per year (barely 215 mm). The average annual conditions for 1980–2009 correspond with an ET = 1676 mm, Tmin = 10 °C, and Tmax = 27 °C. This is the only region where an increase in precipitation is expected by 2100 under the RCP4.5 scenario; meanwhile, under the RCP8.5 scenario, changes in baseline P are not observed. The ET is expected to rise to 274 mm by 2100 in the RCP4.5 scenario and to 419 mm in the RCP8.5 scenario. The Tmin is expected to reach 2.8 °C in the RCP4.5 scenario and 5.9 °C in the RCP8.5 scenario. The Tmax is expected to increase by an annual average of 4.9 °C and 8.0 °C in the RCP4.5 and RCP8.5 scenarios, respectively. Under these scenarios, this region demonstrates the greatest increases in the average maximum and minimum temperatures of the daily temperature range (TmaxTmin); these values increased by approximately 1.6 in both scenarios.
Region 3 contains five IDs: Palestina, Don Martín, Las Lajas, Bajo Río San Juan, and Acuña Falcón. This region experiences a rainy season that begins in April or May and ends in October and also presents the highest average annual P (485 mm). This region has a period of heat-wave during the months of June and July that is characterized by a marked decreased in P, an increase in Tmin and Tmax, and, consequently, an increase in ET. This region is also the warmest and has an annual average Tmin = 15 °C, Tmax = 28.5 °C, and ET = 1603 mm. Under the RCP4.5 scenario, P is expected to decrease 55 mm by 2069 yet to once again increase 60 mm by 2100. However, under the RCP8.5 scenario, the current average P is expected to remain constant. Undoubtedly, the greatest impact in this region by 2100 will be related to the expected increases in Tmin (RCP4.5 = 3.3 °C and RCP8.5 = 6 °C) and Tmax (RCP4.5 = 3.8 °C and RCP8.5 = 6.6 °C). Finally, by 2100, the ET is expected to increase 181 mm and 297 mm for the RCP4.5 and RCP8.5 scenarios, respectively.

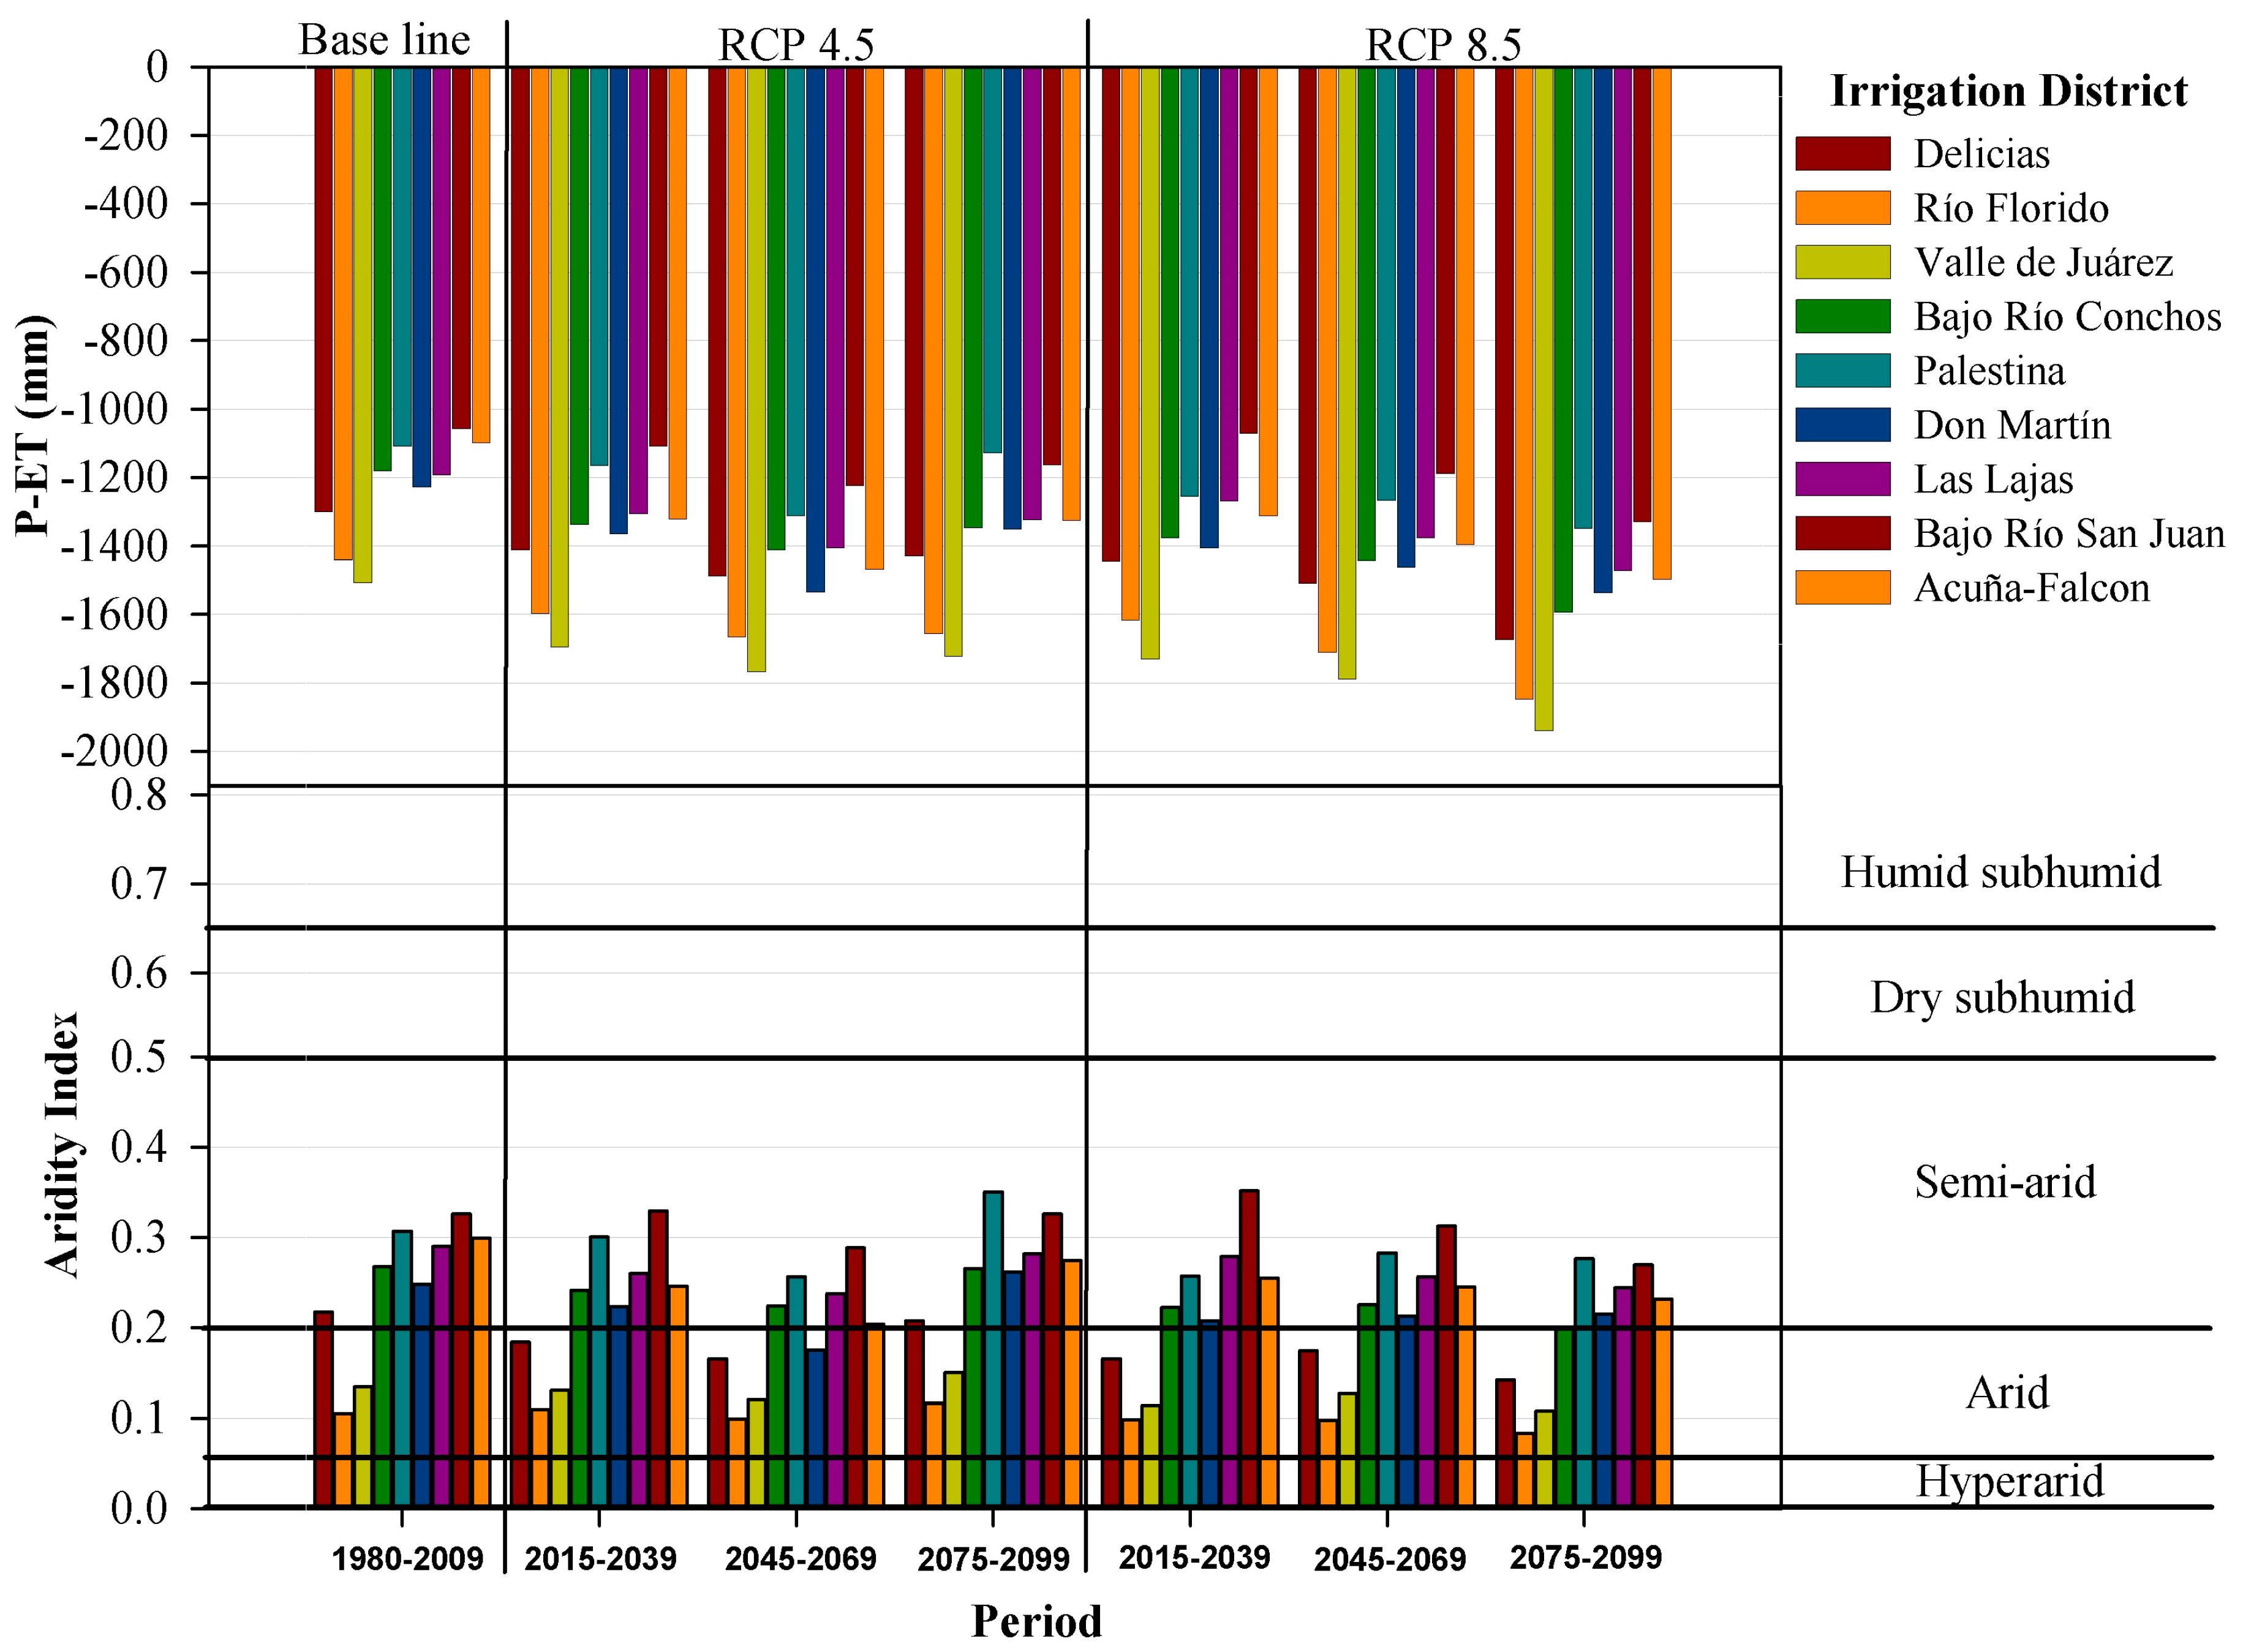
3.2. Aridity Index and Precipitation Minus Evapotranspiration

The projected changes to the aridity index (AI) and the difference between precipitation and evapotranspiration (P-ET) provide a general overview of the future water balance in the IDs. As observed in Figure 7, some IDs in regions 1 and 2 are classified as arid and others as semi-arid according to the baseline conditions (1980–2009). Meanwhile, all IDs in region 3 currently present semi-arid conditions. Under the RCP4.5 scenario, the IDs will experience changes in the AI, yet these will not vary significantly from the baseline conditions. However, under the RCP8.5 scenario, all IDs of regions 1 and 2 will be classified as arid, and Delicias will experience the most drastic change. Also, all IDs in region 3 are expected to have lower AI values but will continue to be semi-arid.
According to baseline conditions, the annual average P-ET in all IDs is negative, indicating that surface water is unavailable. As observed in Figure 8, monthly ET is always higher than monthly P. Under the RCP4.5 scenario, by 2100, the annual average water deficit will increase proportionally for regions 1 and 3 by approximately 140 mm, and will increase by more than 200 mm for region 2. Finally, under the RCP8.5 scenario, the P-ET indicator demonstrates the greatest water deficit (420 mm) in region 2; while the water deficits in regions 1 and 3 will be 393 mm and 299 mm, respectively.

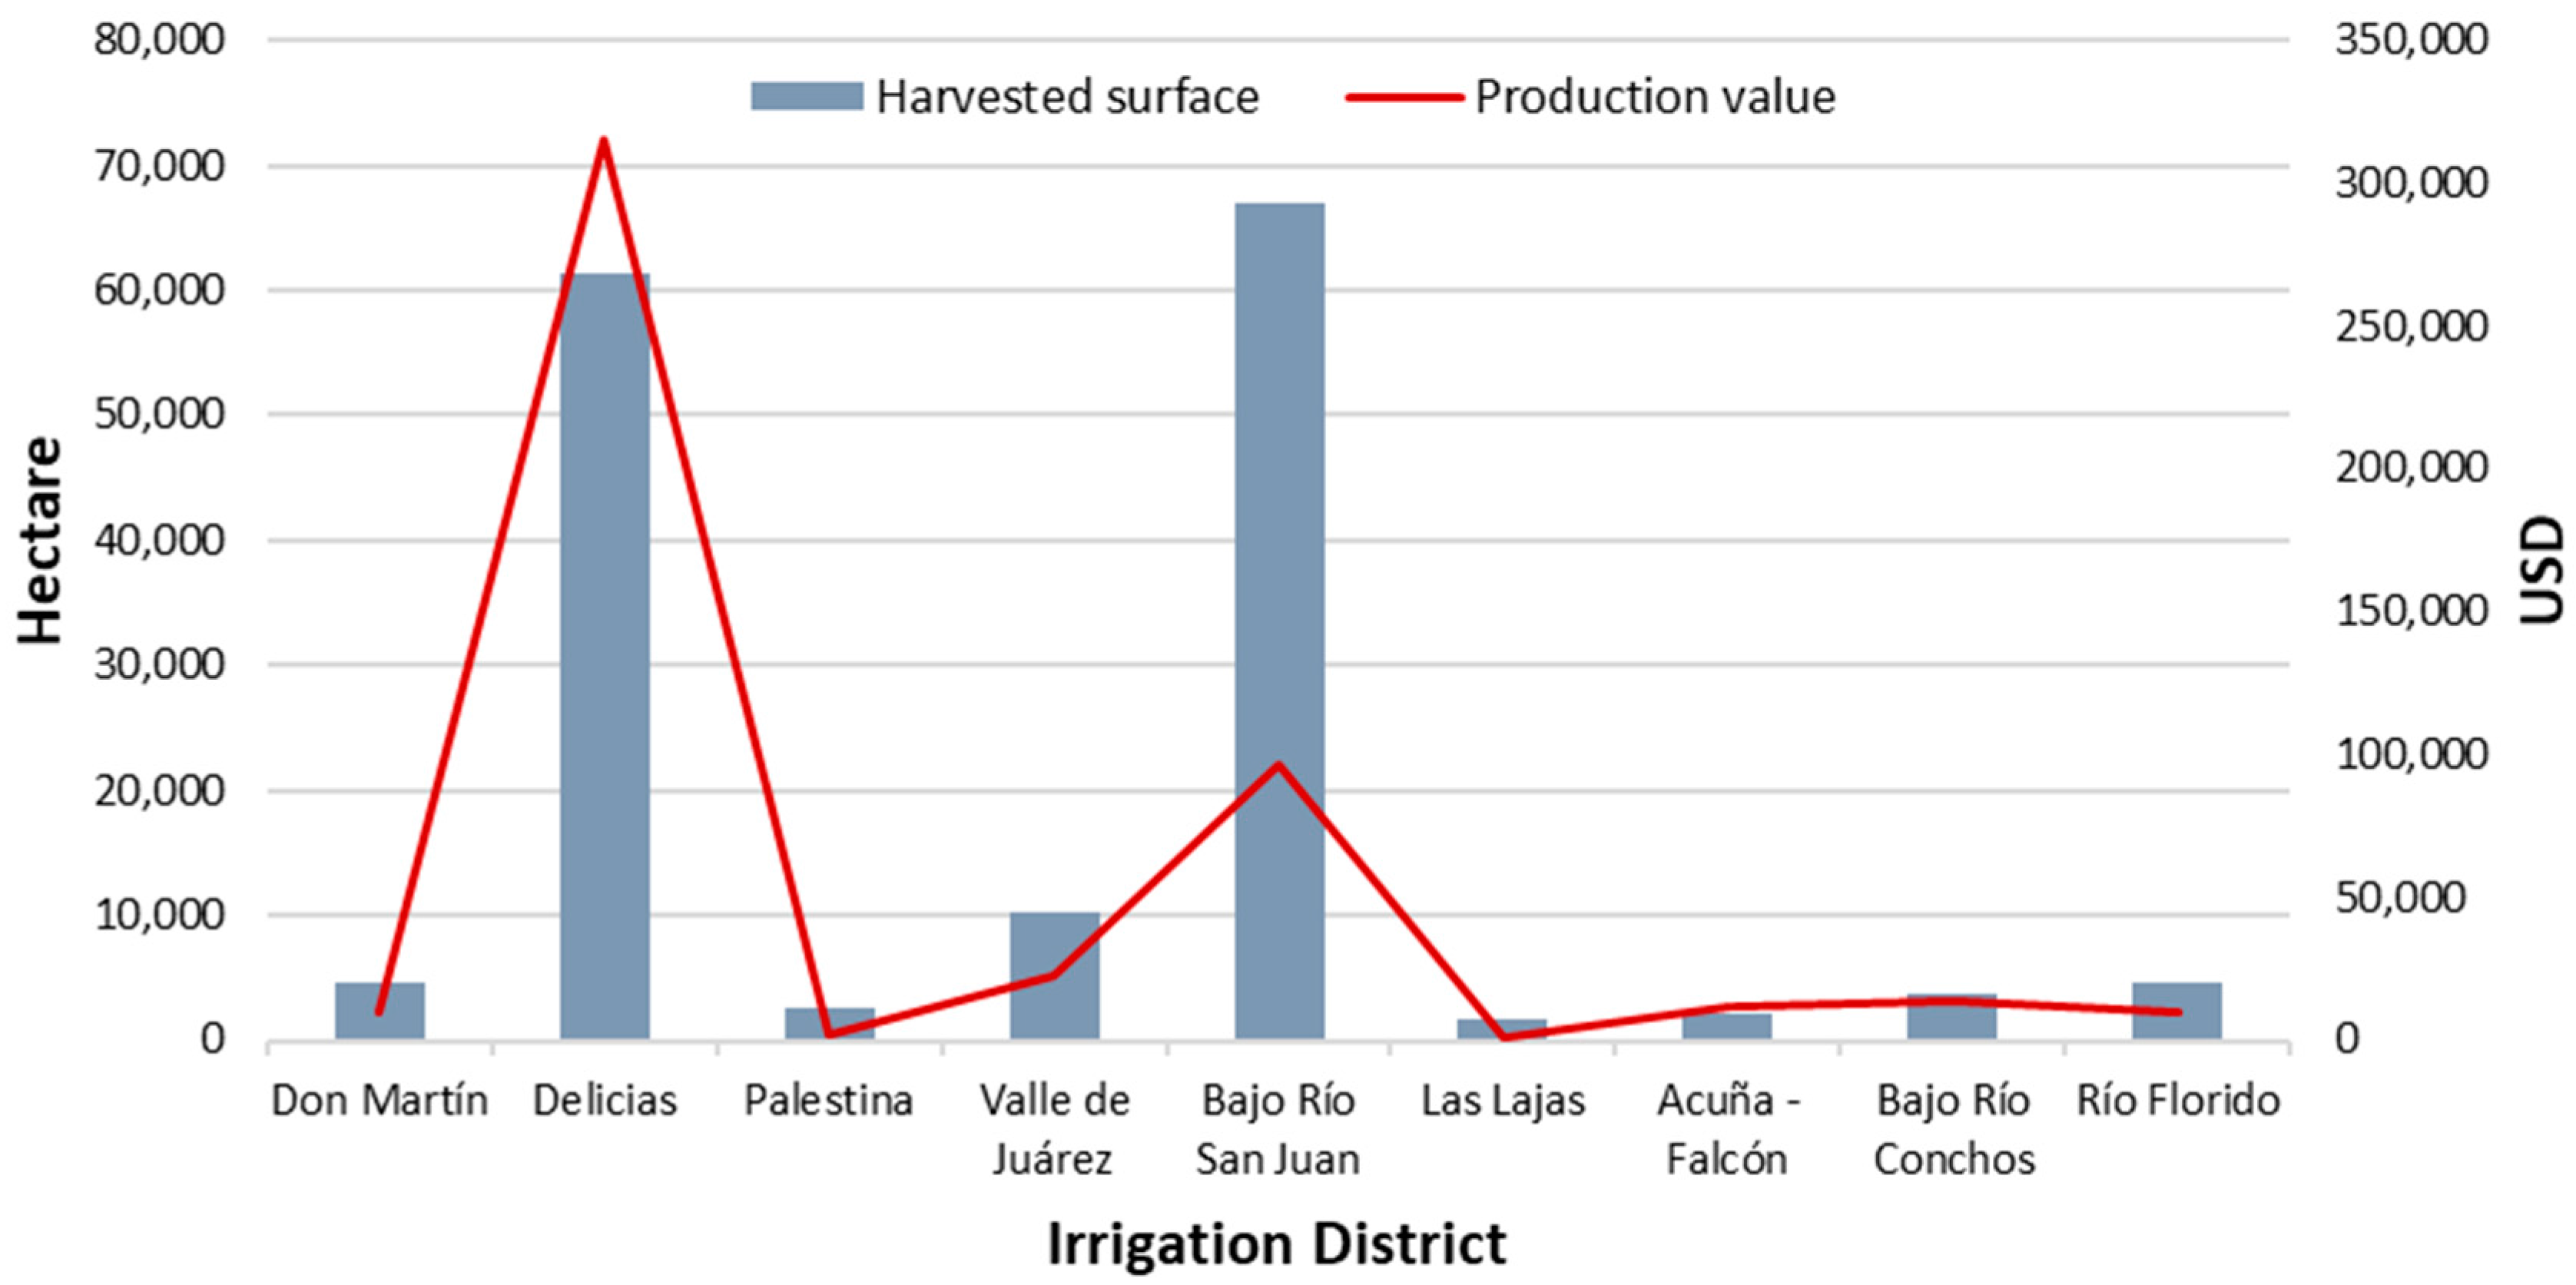
3.3. Potential Impact on the Irrigation Districts

According to Prasad [17], temperature increases will negatively impact crop production to the greatest extent when such increases coincide with critical crop periods, such as flowering and grain formation. As a result of high temperatures, crops experience stress and have less time to absorb nutrients, intercept solar energy, and carry out metabolic activities. In the harvested area in the RBB (Table A1), maize, sorghum, and alfalfa are the principal crops. These crops are most sensitive to high temperatures during their reproductive stage. However, crop phenology is simultaneously affected by crop management, including cultivar shift and date of sowing, which can also be adjusted to cope with climate variability. In fact, the planting of shorter-duration crops could be an effective means of adapting to climate change, as crops with earlier anthesis or sowing dates can avoid extreme heat stress [44] and be less exposed to drought [45] during the grain-filling period, which consequently benefits yield. Cammarano and Tian [46] found that for each 1 °C increase in air temperature, maize yield decreases on average by 4.6%. Moreover, Liu et al. [20] found that the relative contribution of different climate factors to phenological changes varied given the phenological stage and growing period. In this respect, different phenological stages had distinct sensitivities to climate factors, and distinct climate trends during the analyzed periods also differentially affected crops. Among the three analyzed climatic factors, average air temperature had the greatest impact (>50%) on most phenological stages and growing periods. Our results also support that changes in air temperatures are the main driver of impacts on crop phenology, as similarly found in earlier studies [47,48]. Additionally, cumulative sunshine hours are the greatest driver of changes to the length of the vegetative growth period. The impacts of cumulative precipitation on plant phenology seemed very slight when compared to average daily air temperature over the upper threshold and cumulative sunshine hours.
Also, crop production in the IDs is dependent on availability of water for satisfying the CWRs. The effects of climate change on the IDs of the study area will likely be reflected as changes in the variables analyzed herein, including P, ET, Tmin, and Tmax, and in the indicators of water balance such as the AI and P-ET (Figure 7). Ultimately, the resulting effects on crops will depend on the tolerance of specific crops to such climate changes.
Based on this information, the monthly changes in the CWR and the VWRS in the IDs were analyzed and compared between the baseline period and the projected scenarios (Figure 9). The projections through to 2100 show that region 1 will have the greatest CWR, which will increase 27.9 hm3 under scenario RCP4.5 and 55.8 hm3 under scenario RCP8.5, with respect to the 1980–2009 baseline period. The estimated CWR for region 1 will be nearly three times greater than that of regions 2 and 3, which will both have a CWR of 10.5 hm3 under scenario RCP4.5 and a CWR of 16 and 18 hm3, respectively, under scenario RCP8.5. The changes in the VWRS also indicate increased future water demand for crop production. Under scenario RCP4.5, region 1 will require 62 hm3 more water by 2100 compared to the 1980–2009 period, whereas regions 2 and 3 will require a water increase of 23 hm3. Under scenario RCP8.5, the VWRS will increase by 124 hm3 in region 1 and by 35 and 40 hm3 in regions 2 and 3, respectively.
The IDs that experience the greatest changes per variable and RCP scenario between the 1980–2009 base period and the projected 2075–2099 period, can be observed in Table 1. Under the RCP4.5 scenario, Acuña-Falcón will be the most affected ID; under the RCP8.5 scenario, Delicias will be the most affected. On the other hand, the least affected ID under both scenarios will be Palestina.
Notably, the VWRs of all IDs are fulfilled from different sources. Some water is supplied from the surface water ceded by the U.S. portion of the Rio Grande Watershed to Mexico. Additional water is supplied by local aquifers, national surface waters, and reservoirs. Therefore, the projected increases in VWRs will undoubtedly impact the production and output of crops and this will be reflected in the national GDP. Additionally, increasing demand for water could potentially lead to conflicts between Mexico and the United States with respect to the Treaty of 1949, which determines the water volumes allocated to each country, and could lead to an even greater depletion of aquifers that are currently experiencing deficits.

4. Conclusions

The present study shows that temperature and precipitation patterns in the RBB have changed over the last 30 years and will continue to change incrementally under the RCP4.5 and RCP8.5 climate change scenarios (Table 2). Distinct patterns in the analyzed climate variables were observed among the IDs, yet the IDs were able to be grouped into three regions of similar climate behavior: region 1 (Delicias and Río Florido), region 2 (Valle de Juárez and Bajo Río Conchos), and region 3 (Palestina, Don Martín, Las Lajas, Bajo Río San Juan, and Acuña Falcón).
Agriculture is extremely sensitive to both climate variability and changes. Therefore, climate changes will likely exert adverse impacts on agriculture and will increase the vulnerability of agricultural production [46]. Projected future climate changes will increase the severity of dry periods and heat stress during summer months, and such extreme climate events will likely impact crops in the RBB. In this context, producers will have to consider variations in temperature as part of their production system to ensure food security and to meet the food demands of an ever-increasing population. Undoubtedly, most future production will come from irrigated agriculture, which requires improved seeds, adequate inputs, and water and fertilizer at appropriate times for local climate conditions. Therefore, to develop new policies in the face of climate uncertainty, different factors involved in agricultural production should be examined given potential climate changes; there are numerous opportunities for further research on this topic. Also, to build sustainable agricultural policies, several key actions [7] must be considered, including (a) the development of clear national food and nutrition policies and strategies that consider water and energy consumption (i.e., virtual trade of natural resources); (b) the removal of subsidies for water, food, and energy, as these reduce resource use efficiency and result in adverse impacts on the environment; (c) the development, implementation, and dissemination of efficient technology (particularly technology that is affordable for poor people as well as the monitoring of climate variates); (d) the strengthening of water and land tenure systems; (e) continued agricultural research on crops that are tolerant to frequent drought and periods of heat stress; (f) the simulation of the effects of climate change on crops using crop growth and water allocation models [13] that consider different variants such as daily crop growth, development, and final yield, which can be affected by water availability, weather, soil, crop characteristics, legal water rights, and agronomic practices and management; and (g) the creation of markets and trade solutions to ensure least-cost input flow for farmers and consumers.
The problems facing the IDs of the RBB as a result of climate change are far from being solved. The formulation of new policies to address such challenges will require creativity and further knowledge generation via scientific studies. However, the rates of change in the climate variables analyzed herein and the effects of these changes on crop production and crop water requirements constitute a useful reference for vital future research projects and public policy proposals oriented toward reducing the vulnerability of the IDs in the RBB. Likewise, the design of climate adaptation strategies and measures should consider the negative impacts on irrigated agriculture that will likely result from climate change. Finally, based on future climate scenarios and related challenges, this study establishes the need to form think tanks on climate change, hydro-meteorological disasters, and food security in Mexico in order to build regional resilience strategies.

Acknowledgments

This study was carried out with the financial support provided by CONACYT (248498 and 248553) and UAEM-SIEA-Quebec-Canadá 4212/2016E.

Author Contributions

Jorge Paredes-Tavares and Miguel Angel Gómez-Albores analyzed the climatic variables and scenarios; Carlos Alberto Mastachi-Loza and Carlos Díaz-Delgado coordinated the work and provided guidance regarding the methodology; Rocio Becerril-Piña, Héctor Martínez-Valdés and Khalidou M. Bâ collected and analyzed data about Irrigation Districts and crops, and all authors contributed to the final draft of the manuscript.

Conflicts of Interest

The Authors declare no conflict of interest.

Appendix A

Table A1. Crops reported for the 2015–2016 period in the IDs of the Rio Bravo Basin according to harvested area, crop output, and production value in USD.
IDCropHarvested SurfaceYield (Ton/ha)Production Value
ha% 1Thousand USD 2% 3
Acuña-FalcónGreen buffel1168.054.35%41.96117.1153.67%
Acuña-FalcónSweet sorghum540.025.13%34.52328.5720.43%
Acuña-FalcónWalnut287.013.36%1.72386.3620.94%
Acuña-FalcónGreen oat64.02.98%25.0161.721.42%
Acuña-FalcónField corn60.02.79%4.355.710.49%
Acuña-FalcónWatermelon30.01.40%46.0348.703.06%
Bajo Río ConchosGreen alfalfa1428.538.66%84.04191.8330.30%
Bajo Río ConchosCotton649.317.57%4.82276.3516.45%
Bajo Río ConchosSweet sorghum513.213.89%71.2810.445.86%
Bajo Río ConchosGreen oat366.69.92%31.0503.983.64%
Bajo Río ConchosWalnut248.66.73%2.84749.0034.33%
Bajo Río ConchosRye grass239.36.48%75.01009.057.29%
Bajo Río ConchosWheat175.54.75%4.3171.611.24%
Bajo Río ConchosSmall vegetables59.31.60%8.5111.450.81%
Bajo Río ConchosField corn14.00.38%1.43.820.03%
Bajo Río ConchosMelon1.00.03%27.56.510.05%
Bajo Río San JuanField corn55,493.382.75%7.485,395.3688.63%
Bajo Río San JuanGrain sorghum10,351.915.44%4.18048.748.35%
Bajo Río San JuanCotton893.21.33%2.71951.072.02%
Bajo Río San JuanGreen buffel145.00.22%5.560.580.06%
Bajo Río San JuanPopcorn maize59.00.09%4.095.670.10%
Bajo Río San JuanSoy41.10.06%3.160.040.06%
Bajo Río San JuanBermuda for hay24.00.04%6.511.830.01%
Bajo Río San JuanSweet sorghum15.00.02%20.018.570.02%
Bajo Río San JuanGreen alfalfa14.00.02%17.353.390.06%
Bajo Río San JuanWatermelon9.00.01%20.039.800.04%
Bajo Río San JuanCucumber6.00.01%50.0180.990.19%
Bajo Río San JuanMelon5.00.01%20.023.250.02%
Bajo Río San JuanEggplant3.00.00%80.0333.540.35%
Bajo Río San JuanGreen chile3.00.00%20.026.530.03%
Bajo Río San JuanGreen tomato2.40.00%36.052.400.05%
DeliciasGreen alfalfa28,657.746.64%58.779,700.2125.31%
DeliciasWalnut9809.815.97%1.784,278.6826.76%
DeliciasGreen chile5370.48.74%40.071,922.1022.84%
DeliciasField corn5290.78.61%48.010,427.723.31%
DeliciasGroundnut (peanut)4642.27.56%2.57441.352.36%
DeliciasWatermelon3874.06.31%50.023,273.377.39%
DeliciasOnion1775.52.89%70.021,198.686.73%
DeliciasOther crops1225.01.99%35.014,896.564.73%
DeliciasCotton796.61.30%3.51773.490.56%
Don MartínWheat1198.026.16%4.51359.1613.56%
Don MartínGreen buffel875.119.11%40.74454.8444.43%
Don MartínGrain sorghum836.218.26%4.2713.657.12%
Don MartínSoy684.514.95%3.11190.9411.88%
Don MartínCorn517.511.30%4.3481.234.80%
Don MartínSweet sorghum376.78.22%34.51625.4116.21%
Don MartínSorghum foy hay51.01.11%1.184.340.84%
Don MartínGreen oat21.00.46%24.151.170.51%
Don MartínRye grass20.00.44%29.166.180.66%
Las LajasGrain sorghum594.036.86%3.8417.8439.65%
Las LajasGreen buffel446.327.69%3.9131.9612.52%
Las LajasCorn388.724.12%4.0324.1130.76%
Las LajasSweet sorghum105.26.53%4.473.616.99%
Las LajasSoy77.34.80%2.9106.1810.08%
PalestinaSweet sorghum1511.451.77%26.21358.4054.29%
PalestinaGreen oat450.815.44%21.6385.2615.40%
PalestinaCorn281.09.63%3.0175.857.03%
PalestinaKlein grass171.55.87%31.2185.917.43%
PalestinaWheat162.05.55%3.0107.684.30%
PalestinaOat101.03.46%2.235.091.40%
PalestinaBermuda for hay79.52.72%33.784.643.38%
PalestinaRye grass47.51.63%24.247.221.89%
PalestinaBean25.50.87%0.818.480.74%
PalestinaGreen alfalfa25.00.86%35.141.601.66%
PalestinaWalnut22.50.77%0.828.431.14%
PalestinaWatermelon13.00.45%8.815.650.63%
PalestinaGreen buffel11.00.38%24.58.510.34%
PalestinaGreen triticale for hay11.00.38%16.15.920.24%
PalestinaHay3.50.12%18.01.990.08%
PalestinaSorghum for hay3.00.10%3.01.420.06%
Río FloridoGreen alfalfa2578.055.20%40.03752.1936.75%
Río FloridoWalnut594.012.72%1.03805.4337.27%
Río FloridoField corn539.011.54%45.0766.117.50%
Río FloridoSweet sorghum444.09.51%38.0532.915.22%
Río FloridoGreen oat284.06.08%38.0340.873.34%
Río FloridoGreen chile128.02.74%24.7898.298.80%
Río FloridoCorn93.01.99%6.0109.271.07%
Río FloridoBean10.00.21%0.86.060.06%
Valle de JuárezGreen alfalfa2578.055.20%40.03752.1936.75%
Valle de JuárezWalnut594.012.72%1.03805.4337.27%
Valle de JuárezField corn539.011.54%45.0766.117.50%
Valle de JuárezSweet sorghum444.09.51%38.0532.915.22%
Valle de JuárezGreen oat284.06.08%38.0340.873.34%
Valle de JuárezGreen chile128.02.74%24.7898.298.80%
Valle de JuárezCorn93.01.99%6.0109.271.07%
Valle de JuárezBean10.00.21%0.86.060.06%
1 Percentage of total harvested area per ID; 2 Exchange rate = 15.83 pesos per dollar (average for the year 2015); 3 Percentage of total production value per ID.

Appendix B

Table A2. Average values of Kc per crop in the IDs of the Rio Bravo Basin [38].
CropMonth
123456789101112
Green alfalfa0.650.950.650.950.650.950.650.950.650.950.650.95
Cotton0000.350.751.21.20.50.5000
Green oat0000.250.751.150.2500000
Eggplant0.9000000000.60.81.05
Green bermuda0.55110.850.55110.850.55110.85
Green buffel0.55110.850.55110.850.55110.85
Groundnut (peanut)00000.40.751.150.60000
Onion0000000000.711
Green chile1110.8000000.150.61
Bean000000.41.150.350000
Green corn0000000000.71.151.05
Corn0000.70.950.951.20.60000
Popcorn maize0000000000.71.151.05
Melon000.50.751.051.050.7500000
Walnut0000.51.11.11.11.10.65000
Small vegetables0000.70.8510.8500000
Other crops0000.71.050.8000000
Grass0.750.750.750.750.750.750.750.750.750.750.750.75
Cucumber00.60.810.750000000
Rye grass50.55110.850.55110.850.5511
Watermelon0000.40.5210.7500000
Sorghum for hay0000.70.8510.800000
Green sorghum0000.70.8510.800000
Grain sorghum0000.70.8510.800000
Soy00000.50.81.151.150.5000
Green sudan0.70.70.70.70.70.70.70.70.70.70.70.7
Green tomato0.60.851.151.150.90000000
Wheat0.750.751.151.150.40000000.4

References

  1. Thornton, P.; Thornton, M.; Mayer, B.; Wei, Y.; Devarakonda, R.; Vose, R.; Cook, R. Daymet: Daily Surface Weather Data on a 1-km Grid for North America, Version 3; ORNL DAAC: Oak Ridge, TN, USA, 2017. [Google Scholar]
  2. Becerril-Piña, R.; Díaz-Delgado, C.; Mastachi-Loza, C.A.; González-Sosa, E. Integration of remote sensing techniques for monitoring desertification in Mexico. Hum. Ecol. Risk Assess. Int. J. 2016, 22, 1323–1340. [Google Scholar] [CrossRef]
  3. Vilchis-Francés, A.Y.; Díaz-Delgado, C.; Magaña-Lona, D.; Bâ, K.M.; Gómez-Albores, M.Á. Modelado espacial para peligro de incendios forestales con predicción diaria en la cuenca del río Balsas. Agrociencia 2015, 49, 803–820. [Google Scholar]
  4. Cervantes-Jiménez, M.; Mastachi-Loza, C.A.; Díaz-Delgado, C.; Gómez-Albores, M.Á.; González-Sosa, E. Socio-Ecological regionalization of the urban sub-casins in Mexico. Water 2017, 9, 14. [Google Scholar] [CrossRef]
  5. Ouarda, T.; Bâ, K.; Diaz-Delgado, C.; Cârsteanu, A.; Chokmani, K.; Gingras, H.; Quentin, E.; Trujillo, E.; Bobée, B. Intercomparison of regional flood frequency estimation methods at ungauged sites for a Mexican case study. J. Hydrol. 2008, 348, 40–58. [Google Scholar] [CrossRef]
  6. Mastachi-Loza, C.A.; Becerril-Piña, R.; Gómez-Albores, M.A.; Díaz-Delgado, C.; Romero-Contreras, A.T.; Garcia-Aragon, J.A.; Vizcarra-Bordi, I. Regional analysis of climate variability at three time scales and its effect on rainfed maize production in the Upper Lerma River Basin, Mexico. Agric. Ecosyst. Environ. 2016, 225, 1–11. [Google Scholar] [CrossRef]
  7. Ortiz-Partida, J.P.; Sandoval-Solis, S.; Arellano González, J.; Medellín-Azuara, J.; Taylor, J.E. Managing Water Differently: Integrated Water Resources Management as a Framework for Adaptation to Climate Change in Mexico; University of California: Oakland, CA, USA, 2017. [Google Scholar]
  8. Stocker, T.F.; Qin, D.; Plattner, G.-K.; Tignor, M.; Allen, S.K.; Boschung, J.; Nauels, A.; Xia, Y.; Bex, V.; Midgley, P.M. Climate Change 2013: The Physical Science Basis. Intergovernmental. Panel Climate Change Working Group Contribution IPCC Fifth Assessment Report AR5; Cambridge University Press: New York, NY, USA, 2013. [Google Scholar]
  9. Arreguín, F.; López, M.; Rodríguez, O.; Montero, M. Atlas de Vulnerabilidad Hídrica en México ante el Cambio Climático; IMTA: Jiutepec, Mexico, 2015; ISBN 978-607-9368-07-4. [Google Scholar]
  10. Woznicki, S.A.; Nejadhashemi, A.P.; Parsinejad, M. Climate change and irrigation demand: Uncertainty and adaptation. J. Hydrol. Reg. Stud. 2015, 3, 247–264. [Google Scholar] [CrossRef]
  11. Kang, Y.; Khan, S.; Ma, X. Climate change impacts on crop yield, crop water productivity and food security—A review. Prog. Nat. Sci. 2009, 19, 1665–1674. [Google Scholar] [CrossRef]
  12. Ringler, C.; Karelina, Z.; Pandya-Lorch, R. Emerging country strategies for improving food security: Linkages and trade-offs for water and energy security. In Proceedings of the Bonn 2011 Conference, Bonn, Germany, 16–18 November 2011; Volume 17. [Google Scholar]
  13. Nematian, J. An Extended Two-stage stochastic programming approach for water resources management under uncertainty. J. Environ. Inform. 2016, 27, 72–84. [Google Scholar] [CrossRef]
  14. Hatfield, J.L.; Boote, K.J.; Kimball, B.A.; Ziska, L.H.; Izaurralde, R.C.; Ort, D.; Thomson, A.M.; Wolfe, D. Climate impacts on agriculture: Implications for crop production. Agron. J. 2011, 103, 351–370. [Google Scholar] [CrossRef]
  15. Bita, C.; Gerats, T. Plant tolerance to high temperature in a changing environment: Scientific fundamentals and production of heat stress-tolerant crops. Front. Plant Sci. 2013, 4, 273. [Google Scholar] [CrossRef] [PubMed] [Green Version]
  16. Clark, J.S.; Melillo, J.; Mohan, J.; Salk, C. The seasonal timing of warming that controls onset of the growing Season. Glob. Chang. Biol. 2014, 20, 1136–1145. [Google Scholar] [CrossRef] [PubMed]
  17. Prasad, P.; Djanaguiraman, M.; Perumal, R.; Ciampitti, I.A. Impact of high temperature stress on floret fertility and individual grain weight of grain sorghum: Sensitive stages and thresholds for temperature and duration. Front. Plant Sci. 2015, 6, 820. [Google Scholar] [CrossRef] [PubMed] [Green Version]
  18. Anwar, M.R.; Liu, D.L.; Farquharson, R.; Macadam, I.; Abadi, A.; Finlayson, J.; Wang, B.; Ramilan, T. Climate change impacts on phenology and yields of five broadacre crops at four climatologically distinct locations in Australia. Agric. Syst. 2015, 132, 133–144. [Google Scholar] [CrossRef]
  19. Li, Z.; Yang, P.; Tang, H.; Wu, W.; Yin, H.; Liu, Z.; Zhang, L. Response of maize phenology to climate warming in Northeast China between 1990 and 2012. Reg. Environ. Chang. 2014, 14, 39–48. [Google Scholar] [CrossRef]
  20. Liu, Y.; Chen, Q.; Ge, Q.; Dai, J.; Qin, Y.; Dai, L.; Zou, X.; Chen, J. Modelling the impacts of climate change and crop management on phenological trends of spring and winter wheat in China. Agric. For. Meteorol. 2018, 248, 518–526. [Google Scholar] [CrossRef]
  21. Schlenker, W.; Roberts, M.J. Nonlinear temperature effects indicate severe damages to US crop yields under climate change. Proc. Natl. Acad. Sci. USA 2009, 106, 15594–15598. [Google Scholar] [CrossRef] [PubMed]
  22. Comisión Nacional del Agua (CONAGUA). Estadísticas del Agua en México 2016; Comisión Nacional del Agua-Secretaría del Medio Ambiente y Recursos Naturales: Mexico City, Mexico, 2016. [Google Scholar]
  23. Diario Oficial de la Federación (DOF). Plan Nacional de Desarrollo 2013–2018; Gobierno de la República: Mexico City, Mexico, 2013. [Google Scholar]
  24. Galindo, L.M.; Reyes, O. Climate change, irrigation and agricultural activities in Mexico: A Ricardian analysis with panel data. J. Dev. Agric. Econ. 2015, 7, 262–273. [Google Scholar]
  25. Mendelsohn, R.; Wang, J. The impact of climate on farm inputs in developing countries agriculture. Atmósfera 2017, 30, 77–86. [Google Scholar] [CrossRef]
  26. Food and Agriculture Organization (FAO). AQUASTAT Website. Available online: http://www.fao.org/nr/water/aquastat/main/indexesp.stm (accessed on 5 November 2017).
  27. Duran-Encalada, J.A.; Paucar-Caceres, A.; Bandala, E.; Wright, G. The impact of global climate change on water quantity and quality: A system dynamics approach to the US–Mexican transborder region. Eur. J. Oper. Res. 2017, 256, 567–581. [Google Scholar] [CrossRef]
  28. Mundo-Molina, M. Estandarización de las ecuaciones para estimar la evapotranspiración del cultivo de referencia. Ing. Investig. Tecnol. 2009, 10, 125–135. [Google Scholar]
  29. Wood, S.A.; Jina, A.S.; Jain, M.; Kristjanson, P.; DeFries, R.S. Smallholder farmer cropping decisions related to climate variability across multiple regions. Glob. Environ. Chang. 2014, 25, 163–172. [Google Scholar] [CrossRef]
  30. Pachauri, R.K.; Allen, M.R.; Barros, V.R.; Broome, J.; Cramer, W.; Christ, R.; Church, J.A.; Clarke, L.; Dahe, Q.; Dasgupta, P. Climate Change 2014: Synthesis Report. Contribution of Working Groups I, II and III to the Fifth Assessment Report of the Intergovernmental Panel on Climate Change; IPCC: Geneva, Switzerland, 2014; ISBN 92-9169-143-7. [Google Scholar]
  31. Comisión Nacional del Agua (CONAGUA). Estadísticas del Agua en México 2013; Comisión Nacional del Agua-Secretaría del Medio Ambiente y Recursos Naturales: Mexico City, Mexico, 2013. [Google Scholar]
  32. Eastman, J. TerrSet Tutorial; Clark Labs Clark University: Worcester, MA, USA, 2015. [Google Scholar]
  33. Wigley, T.M. MAGICC/SCENGEN 5.3: User Manual (Version 2); NCAR: Boulder, CO, USA, 2008; Volume 80. [Google Scholar]
  34. Demiroglu, O.C.; Turp, M.T.; Ozturk, T.; An, N.; Kurnaz, M.L. Technical climate change adaptation options of the major ski resorts in Bulgaria. In Sustainable Mountain Regions: Challenges and Perspectives in Southeastern Europe; Springer: Berlin, Germany, 2016; pp. 77–88. [Google Scholar]
  35. Hargreaves, G.H.; Samani, Z.A. Estimating potential evapotranspiration. J. Irrig. Drain. Div. 1982, 108, 225–230. [Google Scholar]
  36. Zomer, R.J.; Trabucco, A.; Bossio, D.A.; Verchot, L.V. Climate change mitigation: A spatial analysis of global land suitability for clean development mechanism afforestation and reforestation. Agric. Ecosyst. Environ. 2008, 126, 67–80. [Google Scholar] [CrossRef]
  37. Allen, R.G.; Pereira, L.S.; Raes, D.; Smith, M. Crop Evapotranspiration-Guidelines for Computing Crop Water Requirements-FAO Irrigation and Drainage Paper 56; FAO: Rome, Italy, 1998; Volume 300, p. D05109. [Google Scholar]
  38. Magaña, V. Informe Sobre Escenarios Futuros del Sector Agua en México Bajo Cambio Climático Para Las Climatologías del 2020, 2050 y 2080; Instituto Nacional de Ecología, Como Parte de los Trabajos de la 3a Comunicación Nacional: Mexico City, Mexico, 2006. [Google Scholar]
  39. Richards, J. Remote Sensing Digital Image Analysis; Springer: Berlin, Germany, 1999; Volume 3, ISBN 3-642-30061-8. [Google Scholar]
  40. Middleton, N.J.; Thomas, D.S. World atlas of Desertification; Wiley: Hoboken, NJ, USA, 1992. [Google Scholar]
  41. Byrne, M.P.; O’Gorman, P.A. The response of precipitation minus evapotranspiration to climate warming: Why the “wet-get-wetter, dry-get-drier” scaling does not hold over land. J. Clim. 2015, 28, 8078–8092. [Google Scholar] [CrossRef]
  42. Moorhead, J.E.; Gowda, P.H.; Singh, V.P.; Porter, D.O.; Marek, T.H.; Howell, T.A.; Stewart, B. Identifying and evaluating a suitable index for agricultural drought monitoring in the Texas high plains. JAWRA J. Am. Water Resour. Assoc. 2015, 51, 807–820. [Google Scholar] [CrossRef]
  43. Swenson, S.; Wahr, J. Estimating large-scale precipitation minus evapotranspiration from GRACE satellite gravity measurements. J. Hydrometeorol. 2006, 7, 252–270. [Google Scholar] [CrossRef]
  44. Nagarajan, S.; Jagadish, S.; Prasad, A.H.; Thomar, A.; Anand, A.; Pal, M.; Agarwal, P. Local climate affects growth, yield and grain quality of aromatic and non-aromatic rice in northwestern India. Agric. Ecosyst. Environ. 2010, 138, 274–281. [Google Scholar] [CrossRef]
  45. Jagadish, S.; Septiningsih, E.; Kohli, A.; Thomson, M.; Ye, C.; Redona, E.; Kumar, A.; Gregorio, G.; Wassmann, R.; Ismail, A. Genetic advances in adapting rice to a rapidly changing climate. J. Agron. Crop Sci. 2012, 198, 360–373. [Google Scholar] [CrossRef]
  46. Cammarano, D.; Tian, D. The effects of projected climate and climate extremes on a winter and summer crop in the southeast USA. Agric. For. Meteorol. 2018, 248, 109–118. [Google Scholar] [CrossRef]
  47. Estrella, N.; Sparks, T.H.; Menzel, A. Trends and temperature response in the phenology of crops in Germany. Glob. Chang. Biol. 2007, 13, 1737–1747. [Google Scholar] [CrossRef]
  48. Wang, J.; Wang, E.; Feng, L.; Yin, H.; Yu, W. Phenological trends of winter wheat in response to varietal and temperature changes in the North China Plain. Field Crop. Res. 2013, 144, 135–144. [Google Scholar] [CrossRef]
Figure 1. Location of the study area.
Water 10 00258 g001
Figure 2. Harvested area in hectares per irrigation district of the Rio Bravo Basin for the 2001–2016 crop years.
Water 10 00258 g002
Figure 3. Methodological diagram.
Water 10 00258 g003
Figure 4. Regions resulting from the cluster analysis.
Water 10 00258 g004
Figure 5. Monthly changes across the ID regions in average maximum temperatures (Tmax) and minimum temperatures (Tmin) for 1980–2009 in comparison to the RCP4.5 and RCP8.5 climate change scenarios projected for 2015–2039, 2045–2069, and 2075–2099 in the Rio Bravo Basin.
Water 10 00258 g005
Figure 6. Monthly changes across the ID regions in average precipitation (P) and evapotranspiration (ET) for 1980–2009 in comparison to the RCP4.5 and RCP8.5 climate change scenarios projected for 2015–2039, 2045–2069, and 2075–2099 in the Rio Bravo Basin.
Water 10 00258 g006
Figure 7. Spatial changes of average annual precipitation (P), evapotranspiration (ET), minimum temperature (Tmin), and maximum temperature (Tmax) for the 1980–2009 base scenario and for the 2075–2099 period under the RCP4.5 and RCP8.5 climate change scenarios in the Rio Bravo Basin.
Water 10 00258 g007
Figure 8. Changes in the aridity index (AI) and the difference between precipitation and evapotranspiration (P-ET) under the RCP4.5 and RCP8.5 climate change scenarios in the irrigation districts of the Rio Bravo Basin.
Water 10 00258 g008
Figure 9. Monthly changes across the ID regions in crop water requirements (CWRs) and volumetric water requirements of the sources (VWRS) for the 1980–2009 baseline period in comparison to the RCP4.5 and RCP8.5 climate change scenarios projected for 2015–2039, 2045–2069, and 2075–2099 periods based on the harvested crop areas of the 2015–2016 agricultural cycle.
Water 10 00258 g009
Table 1. Extent of climate change effects on the IDs between the 1980–2009 base period and the 2075–2099 period projected according to the RCP 4.5 and RCP8.5 climate change scenarios.
Irrigation DistrictPETTminTmaxCWRP-ETAITotal
Diff. mmR.Diff. mmR.Diff. °CR.Diff. °CR.Diff. hm3R.Base2100Diff. mmR.Base2100Diff.R.SumR.
RCP 4.5Delicias13.549143.022.9123.18149.449−1300.2−1429.7129.4650.220.21−0.018364
Valle de Juárez48.566264.082.3414.69714.527−1440.6−1656.1215.5180.110.120.014417
Bajo Río Conchos70.313284.593.3065.1696.336−1507.3−1721.6214.2470.130.150.022428
Río Florido55.474222.063.0034.2166.295−1179.7−1346.3166.5360.270.270.006365
Palestina117.411137.113.3453.4321.662−1108.8−1128.519.6910.310.350.041131
Don Martín73.252196.553.1343.9254.374−1228.1−1351.3123.2930.250.260.013262
Las Lajas31.308160.543.4993.6931.361−1193.1−1322.4129.2940.290.28−0.017366
Bajo Río San Juan50.835155.833.4573.76441.098−1057.7−1162.7104.9720.330.330.005343
Acuña-Falcon31.637258.773.3684.8483.623−1098.6−1325.7227.0990.300.27−0.039519
RCP 8.5Delicias−83.609289.146.1176.394100.829−1300.2−1673.0372.7250.220.14−0.089479
Valle de Juárez−2.704404.685.3917.76822.047−1440.6−1847.9407.3170.110.08−0.021365
Bajo Río Conchos1.093434.096.3898.3499.615−1507.3−1940.3432.9990.130.11−0.032468
Río Florido−35.018378.865.9047.35610.726−1179.7−1593.6413.8680.270.20−0.078467
Palestina23.971264.125.9956.3023.392−1108.8−1349.0240.1510.310.28−0.033161
Don Martín15.882324.355.8426.7857.334−1228.1−1536.5308.4240.250.21−0.034262
Las Lajas−11.705266.936.1886.3432.341−1193.1−1471.7278.6830.290.24−0.055284
Bajo Río San Juan−21.577249.315.8836.19172.198−1057.7−1328.6270.9120.330.27−0.066283
Acuña-Falcon−17.716381.176.0667.6775.453−1098.6−1497.5398.8160.300.23−0.077426
Diff. = Difference between the baseline period (1980–2009) and the 2075–2099 period; R. = Ranking of the effects on variables per irrigation district; 1 = less affected; 9 = more affected.
Table 2. Current and projected changes per ID in climatic variables and water requirements.
RegionP (mm/decade)ET (mm/decade)Tmin (°C/decade)Tmax (°C/decade)CWR (hm3)VWRS (hm3)
1980–200917.101.75−0.020.02317.83706.29
20.232.530.030.0466.21147.14
3−0.92−0.97−0.02−0.02119.11264.68
RCP 4.513.418.250.290.37345.70 (8.8%) *768.21
25.927.430.280.4976.63 (15.7%) *170.30
36.0918.170.330.39129.53 (8.7%) *287.84
RCP 8.51−5.9333.390.600.69373.60 (17.5%) *830.23
2−0.0841.930.590.8082.03 (23.9%) *182.30
3−0.2229.710.600.67137.25 (15.2%) *304.99
* Percentage with respect to the baseline period.

