Quantification of Submarine Groundwater Discharge in the Gaza Strip


Abstract
1. Introduction
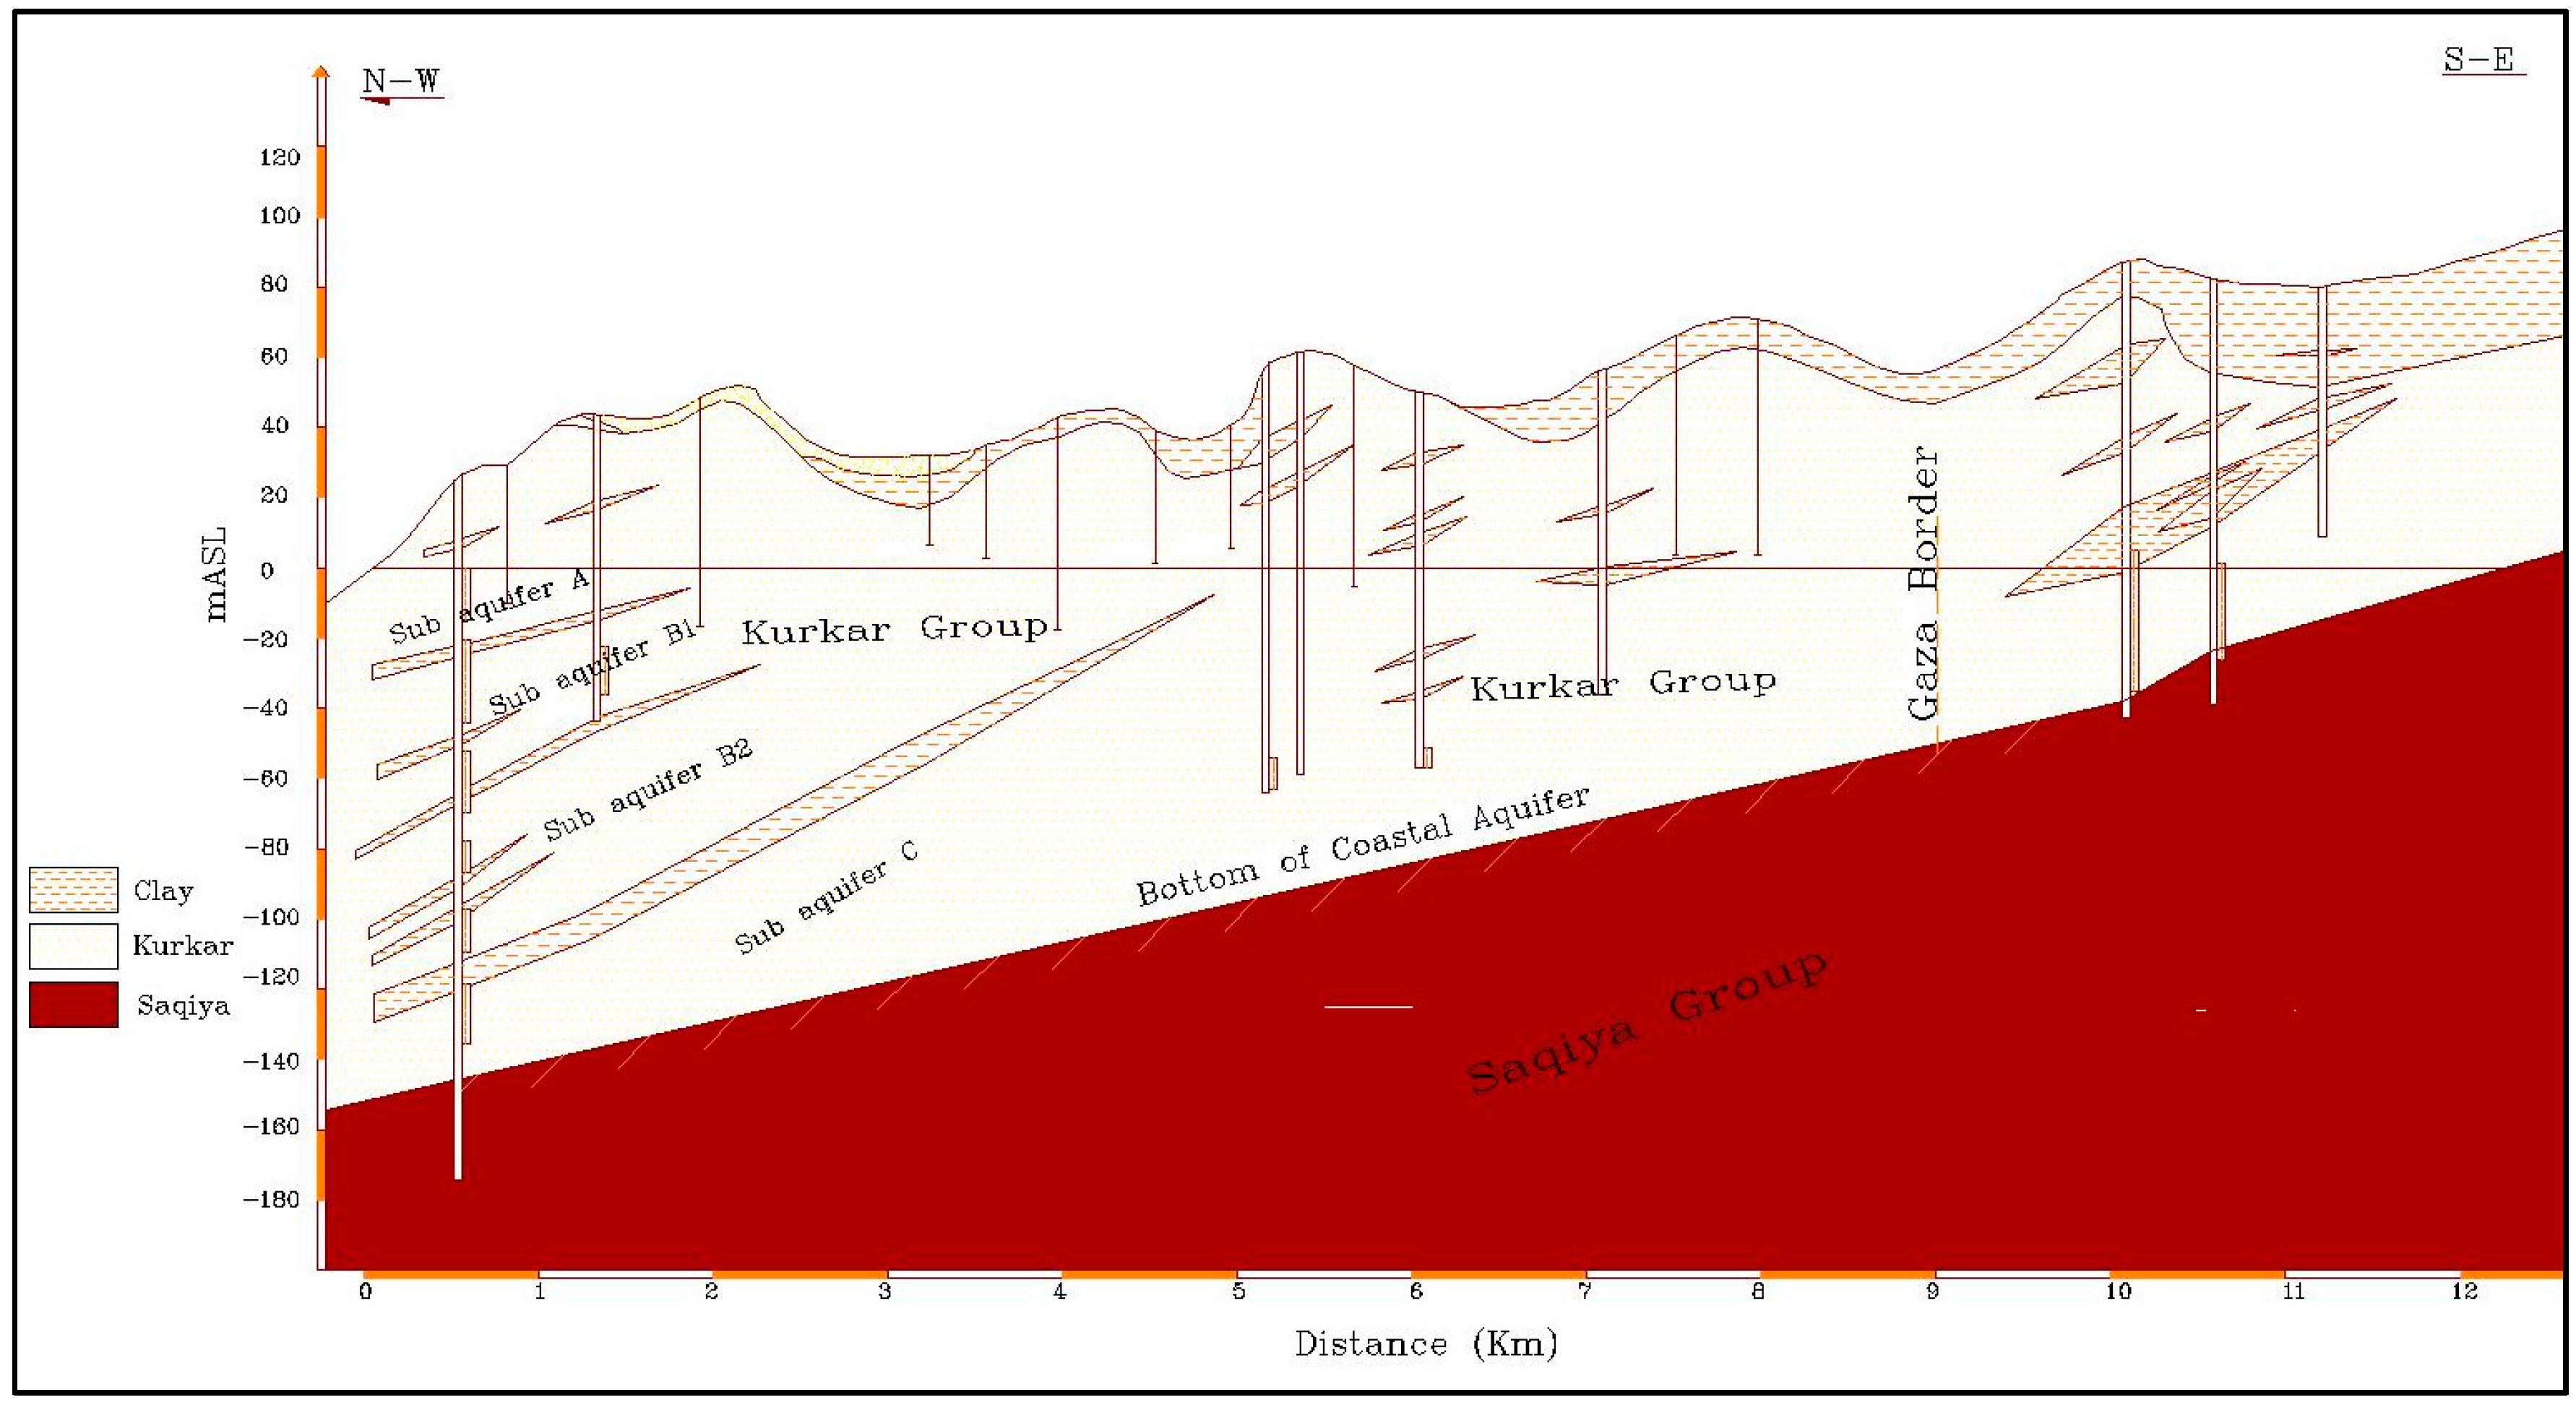
2. Hydrogeological Background
3. Materials and Methods
3.1. Measurement of Nutrients in Groundwater
3.2. Measurement of Radon Concentrations in Groundwater
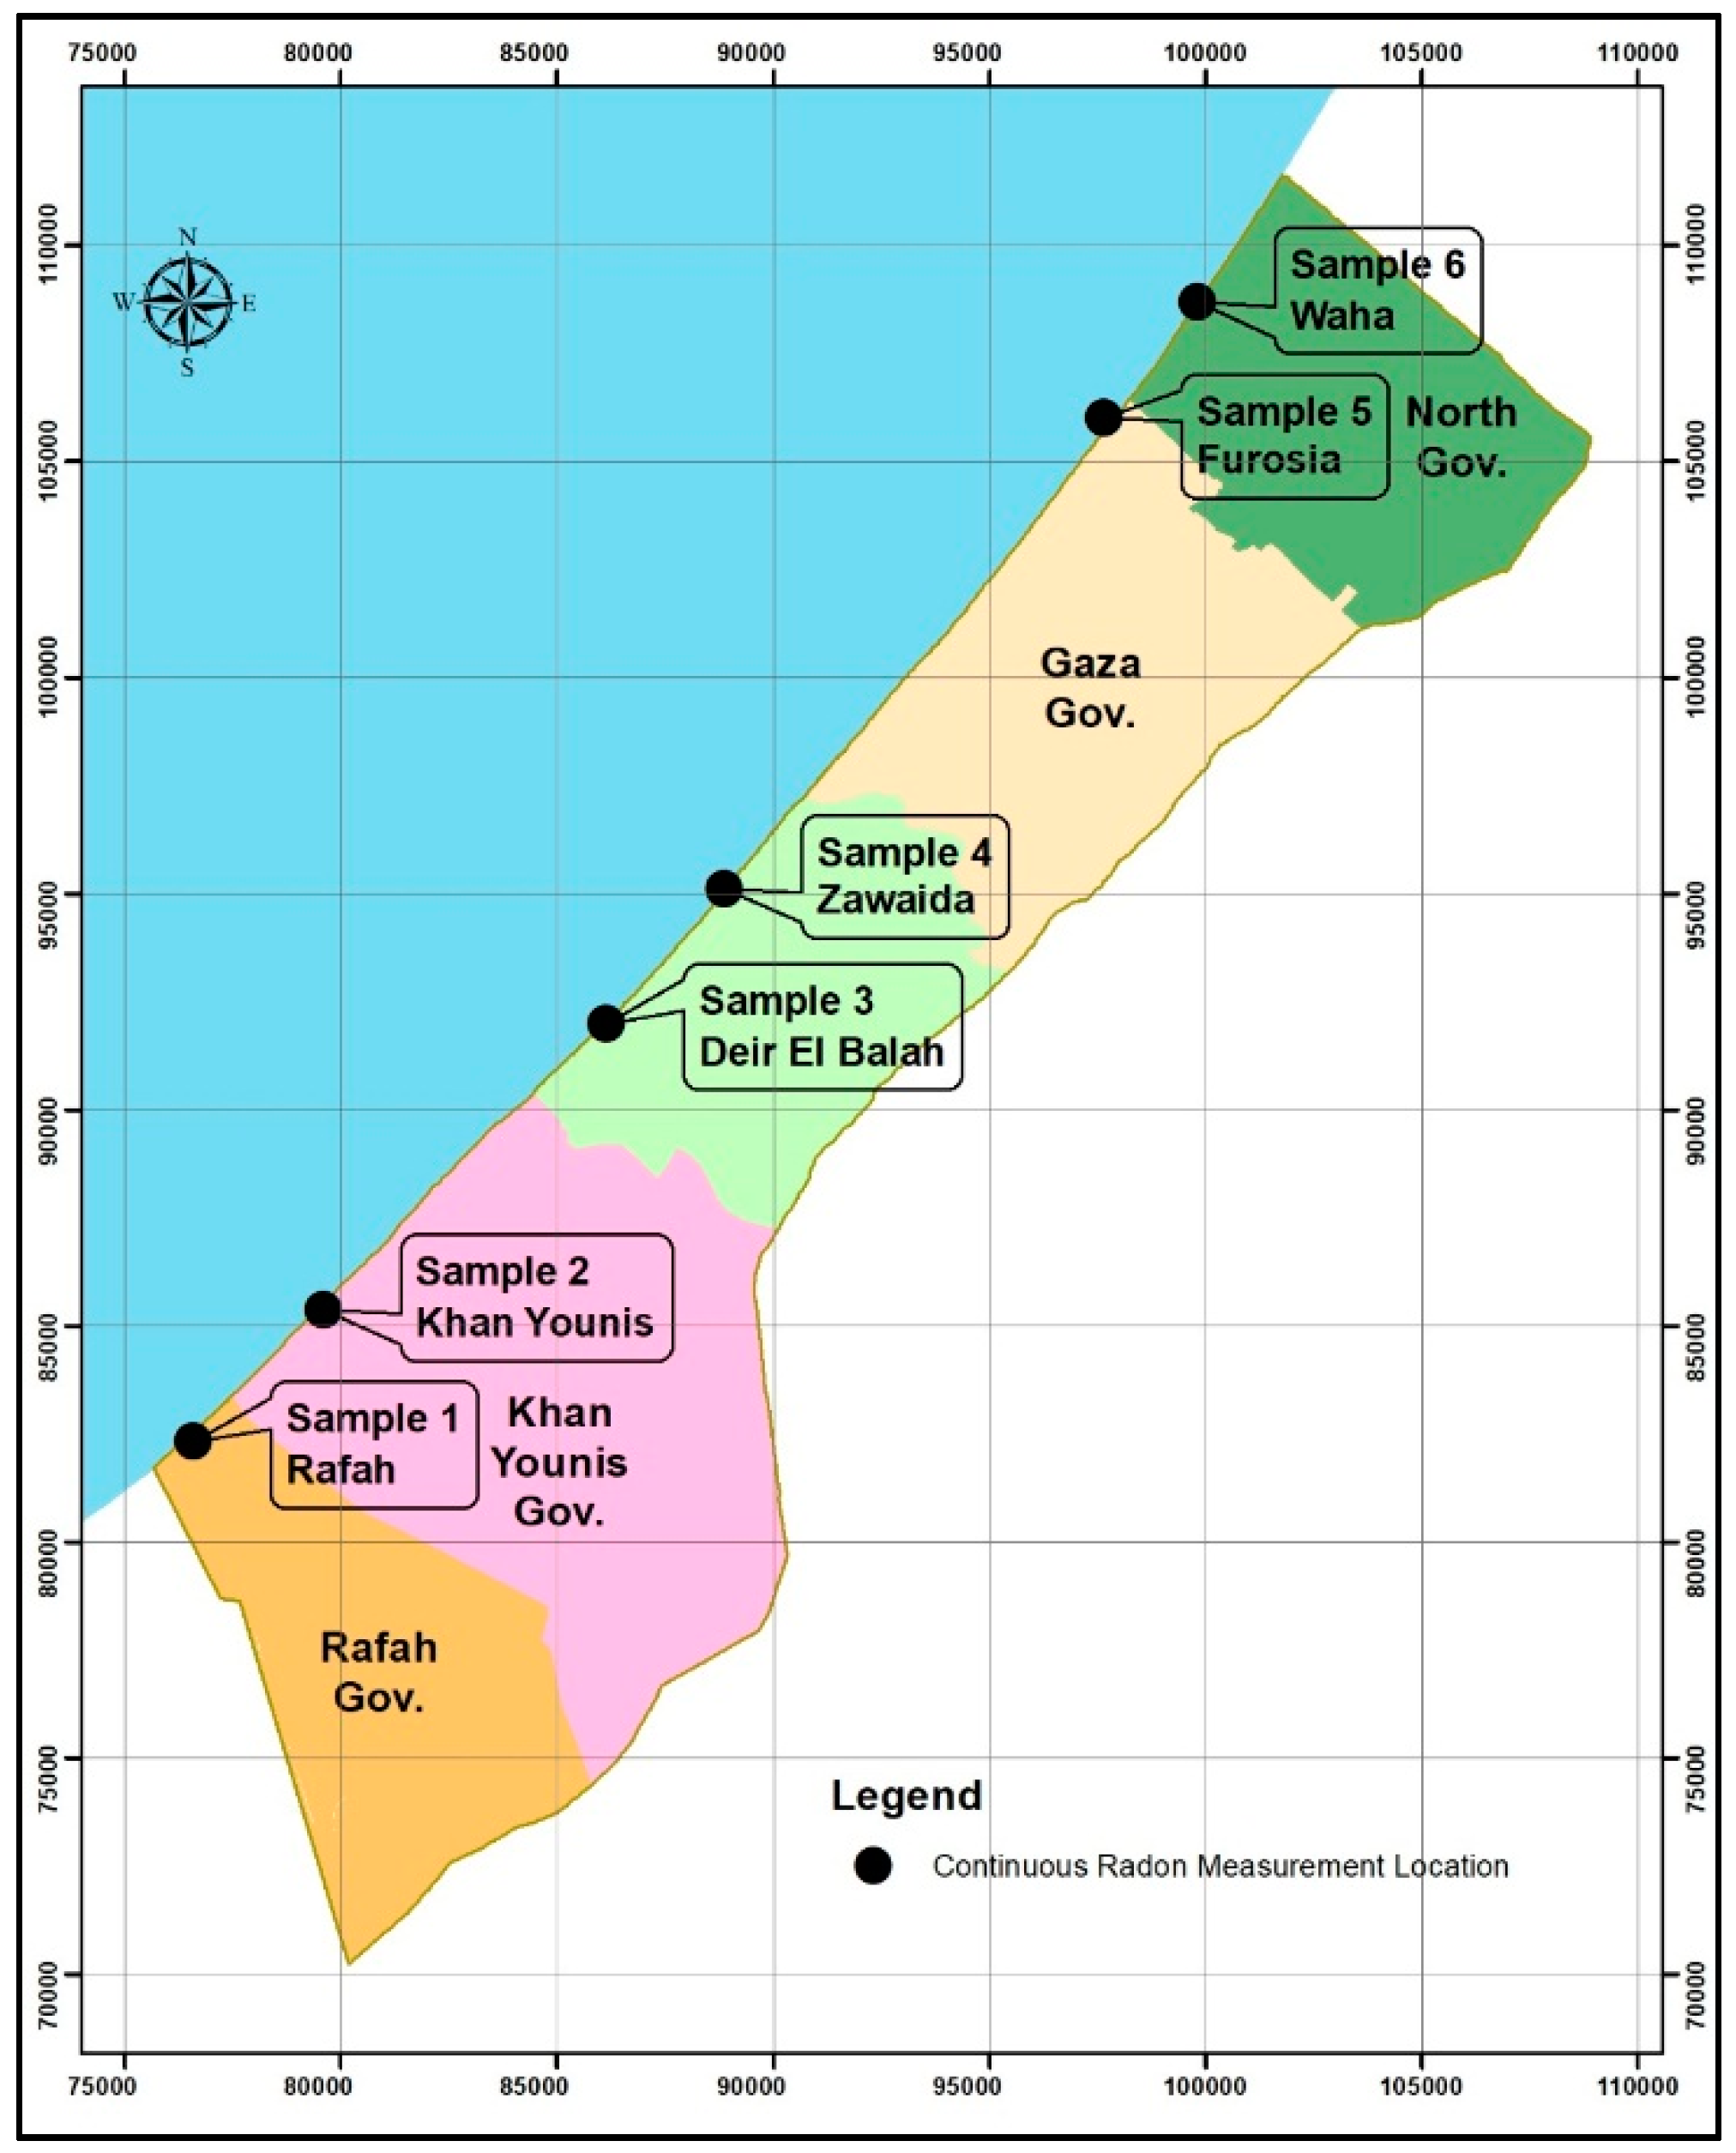
3.3. Field Work
3.4. SGD Model from Radon Tracing
4. Results
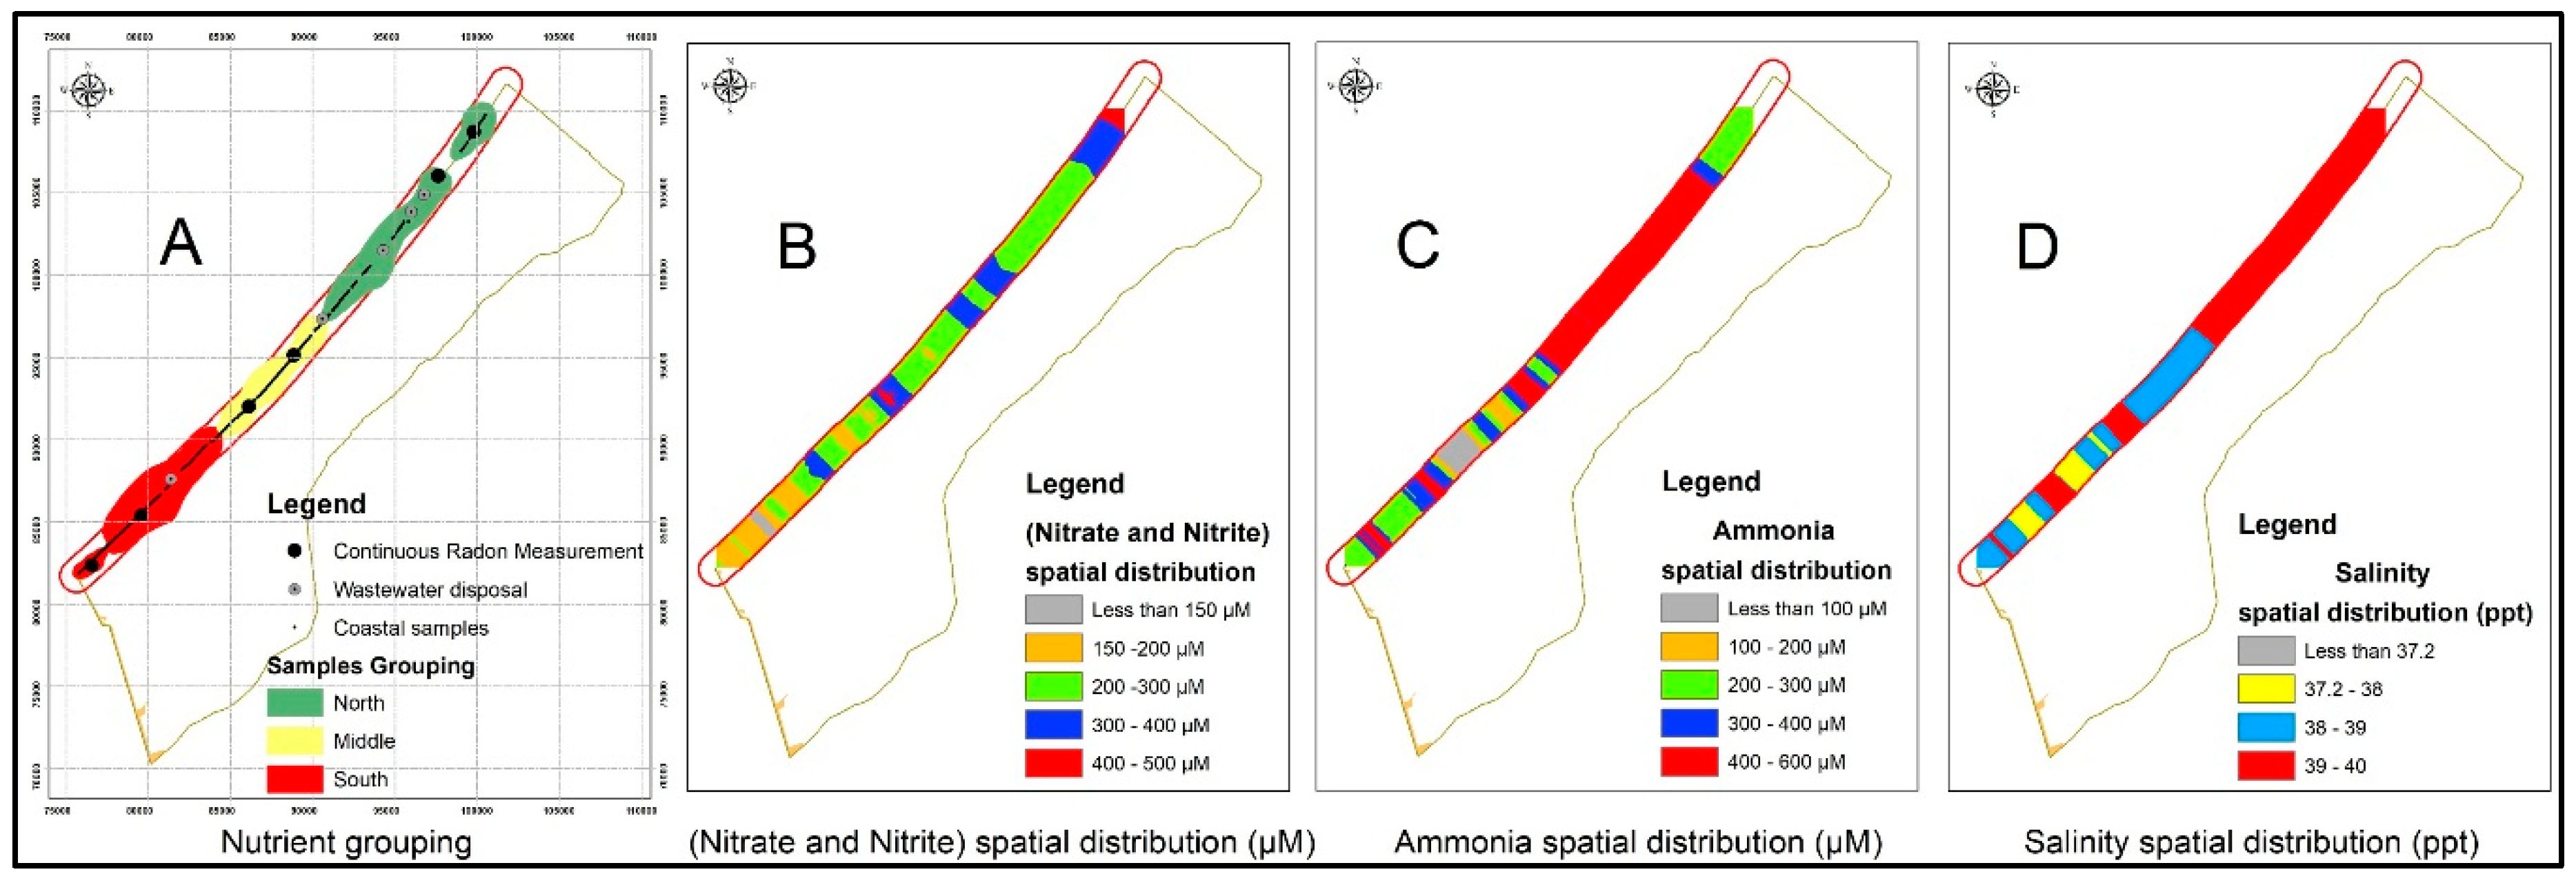
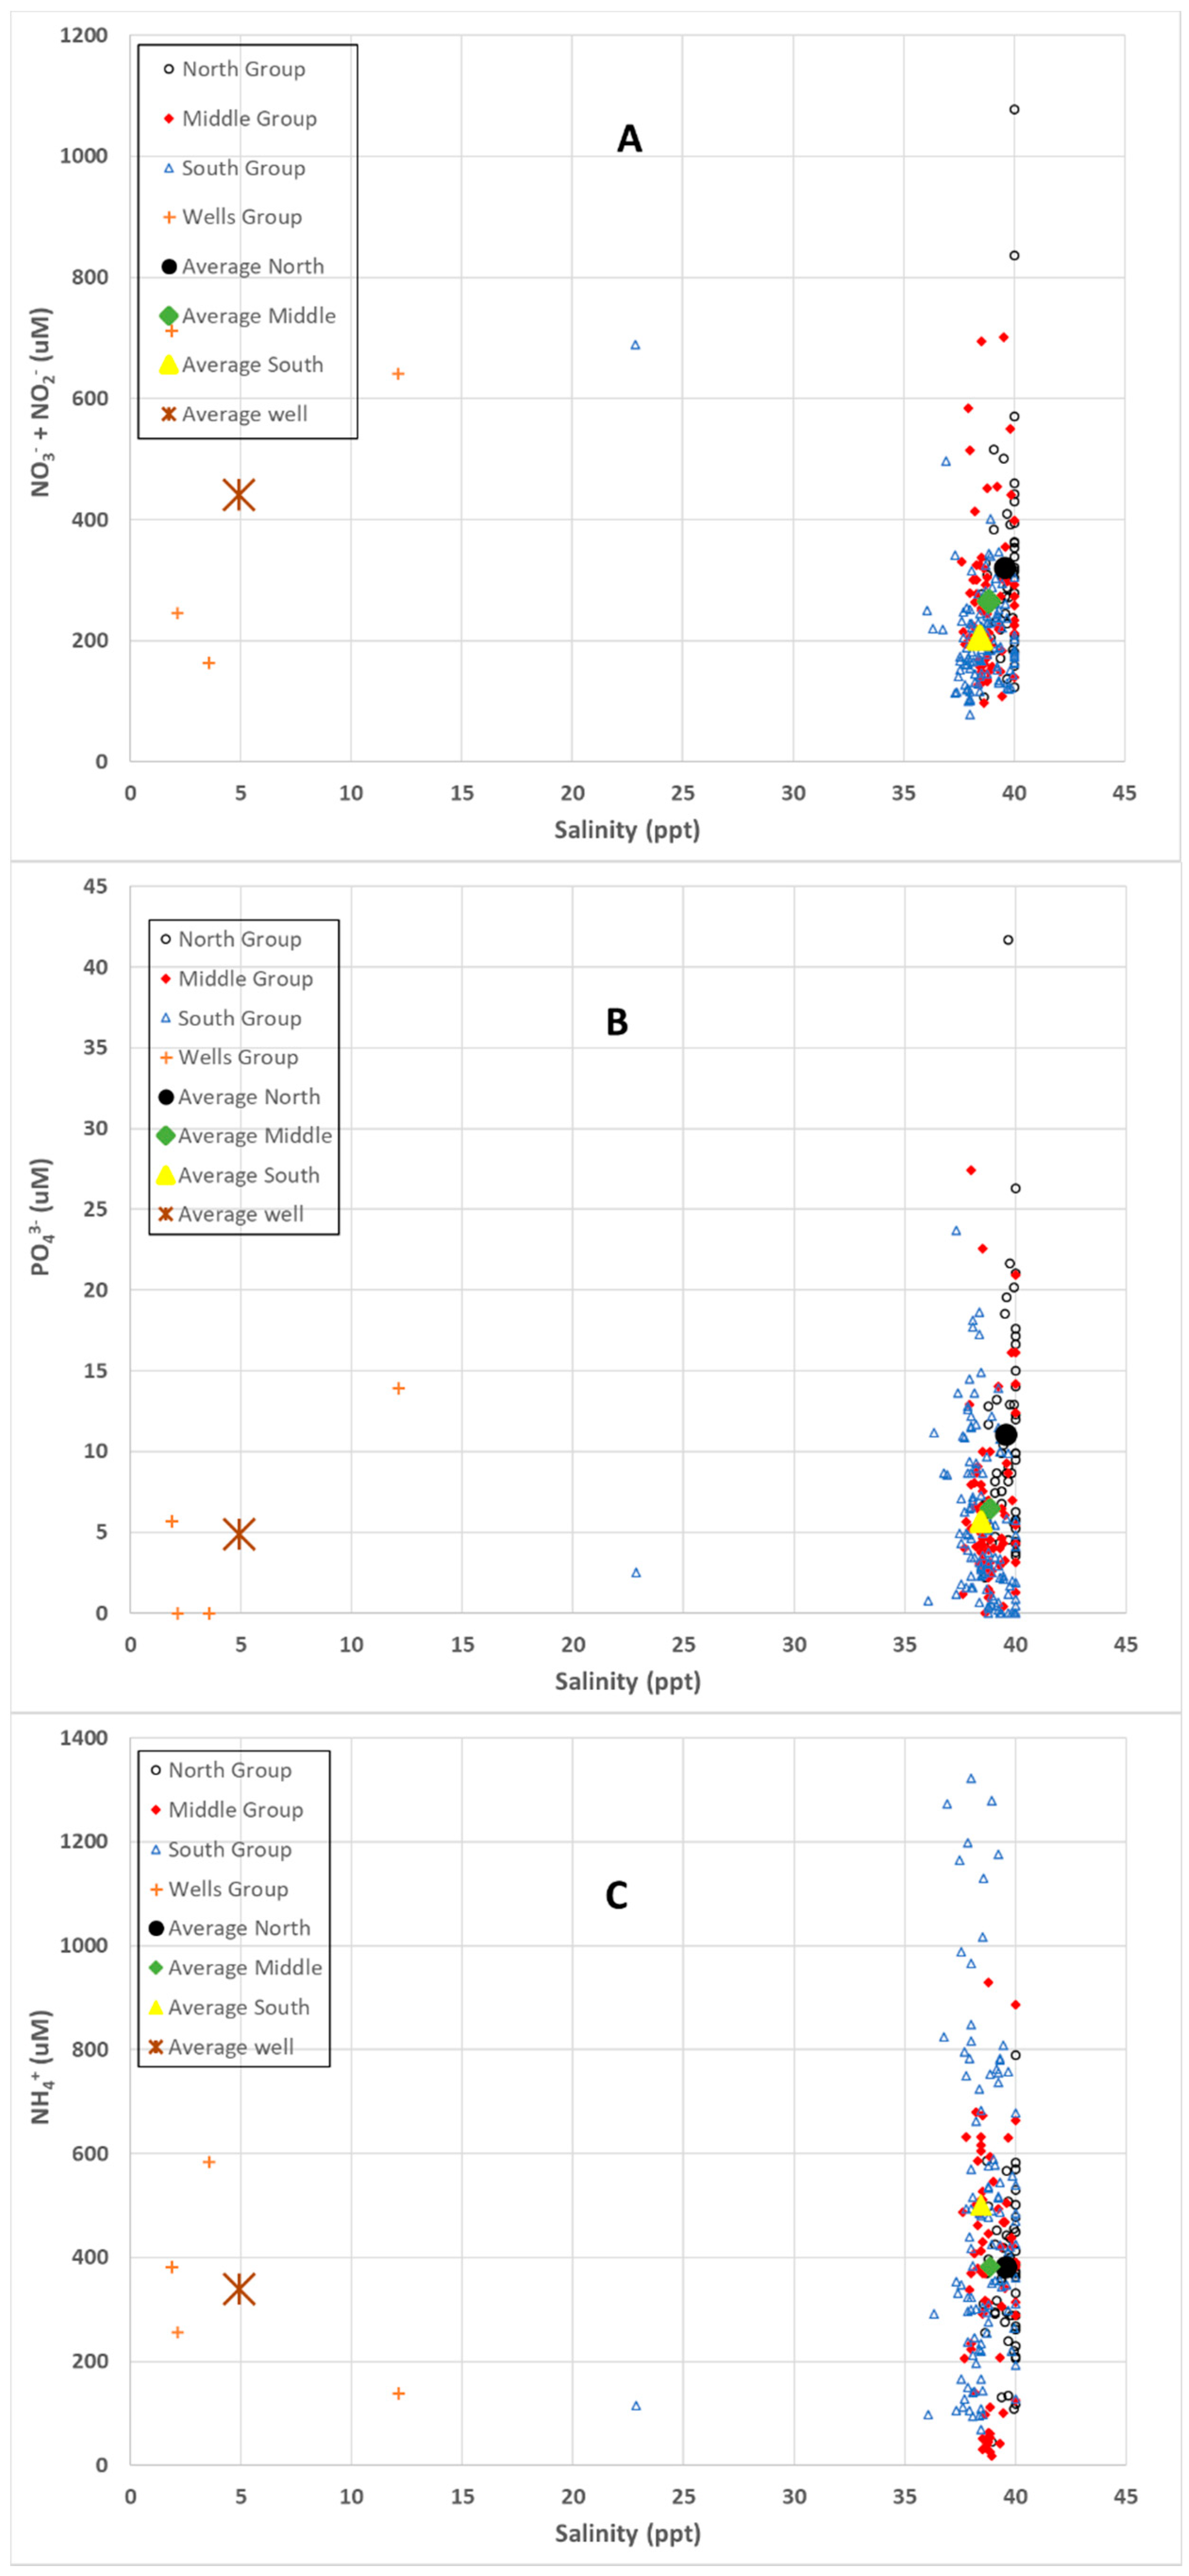
4.1. Nutrients
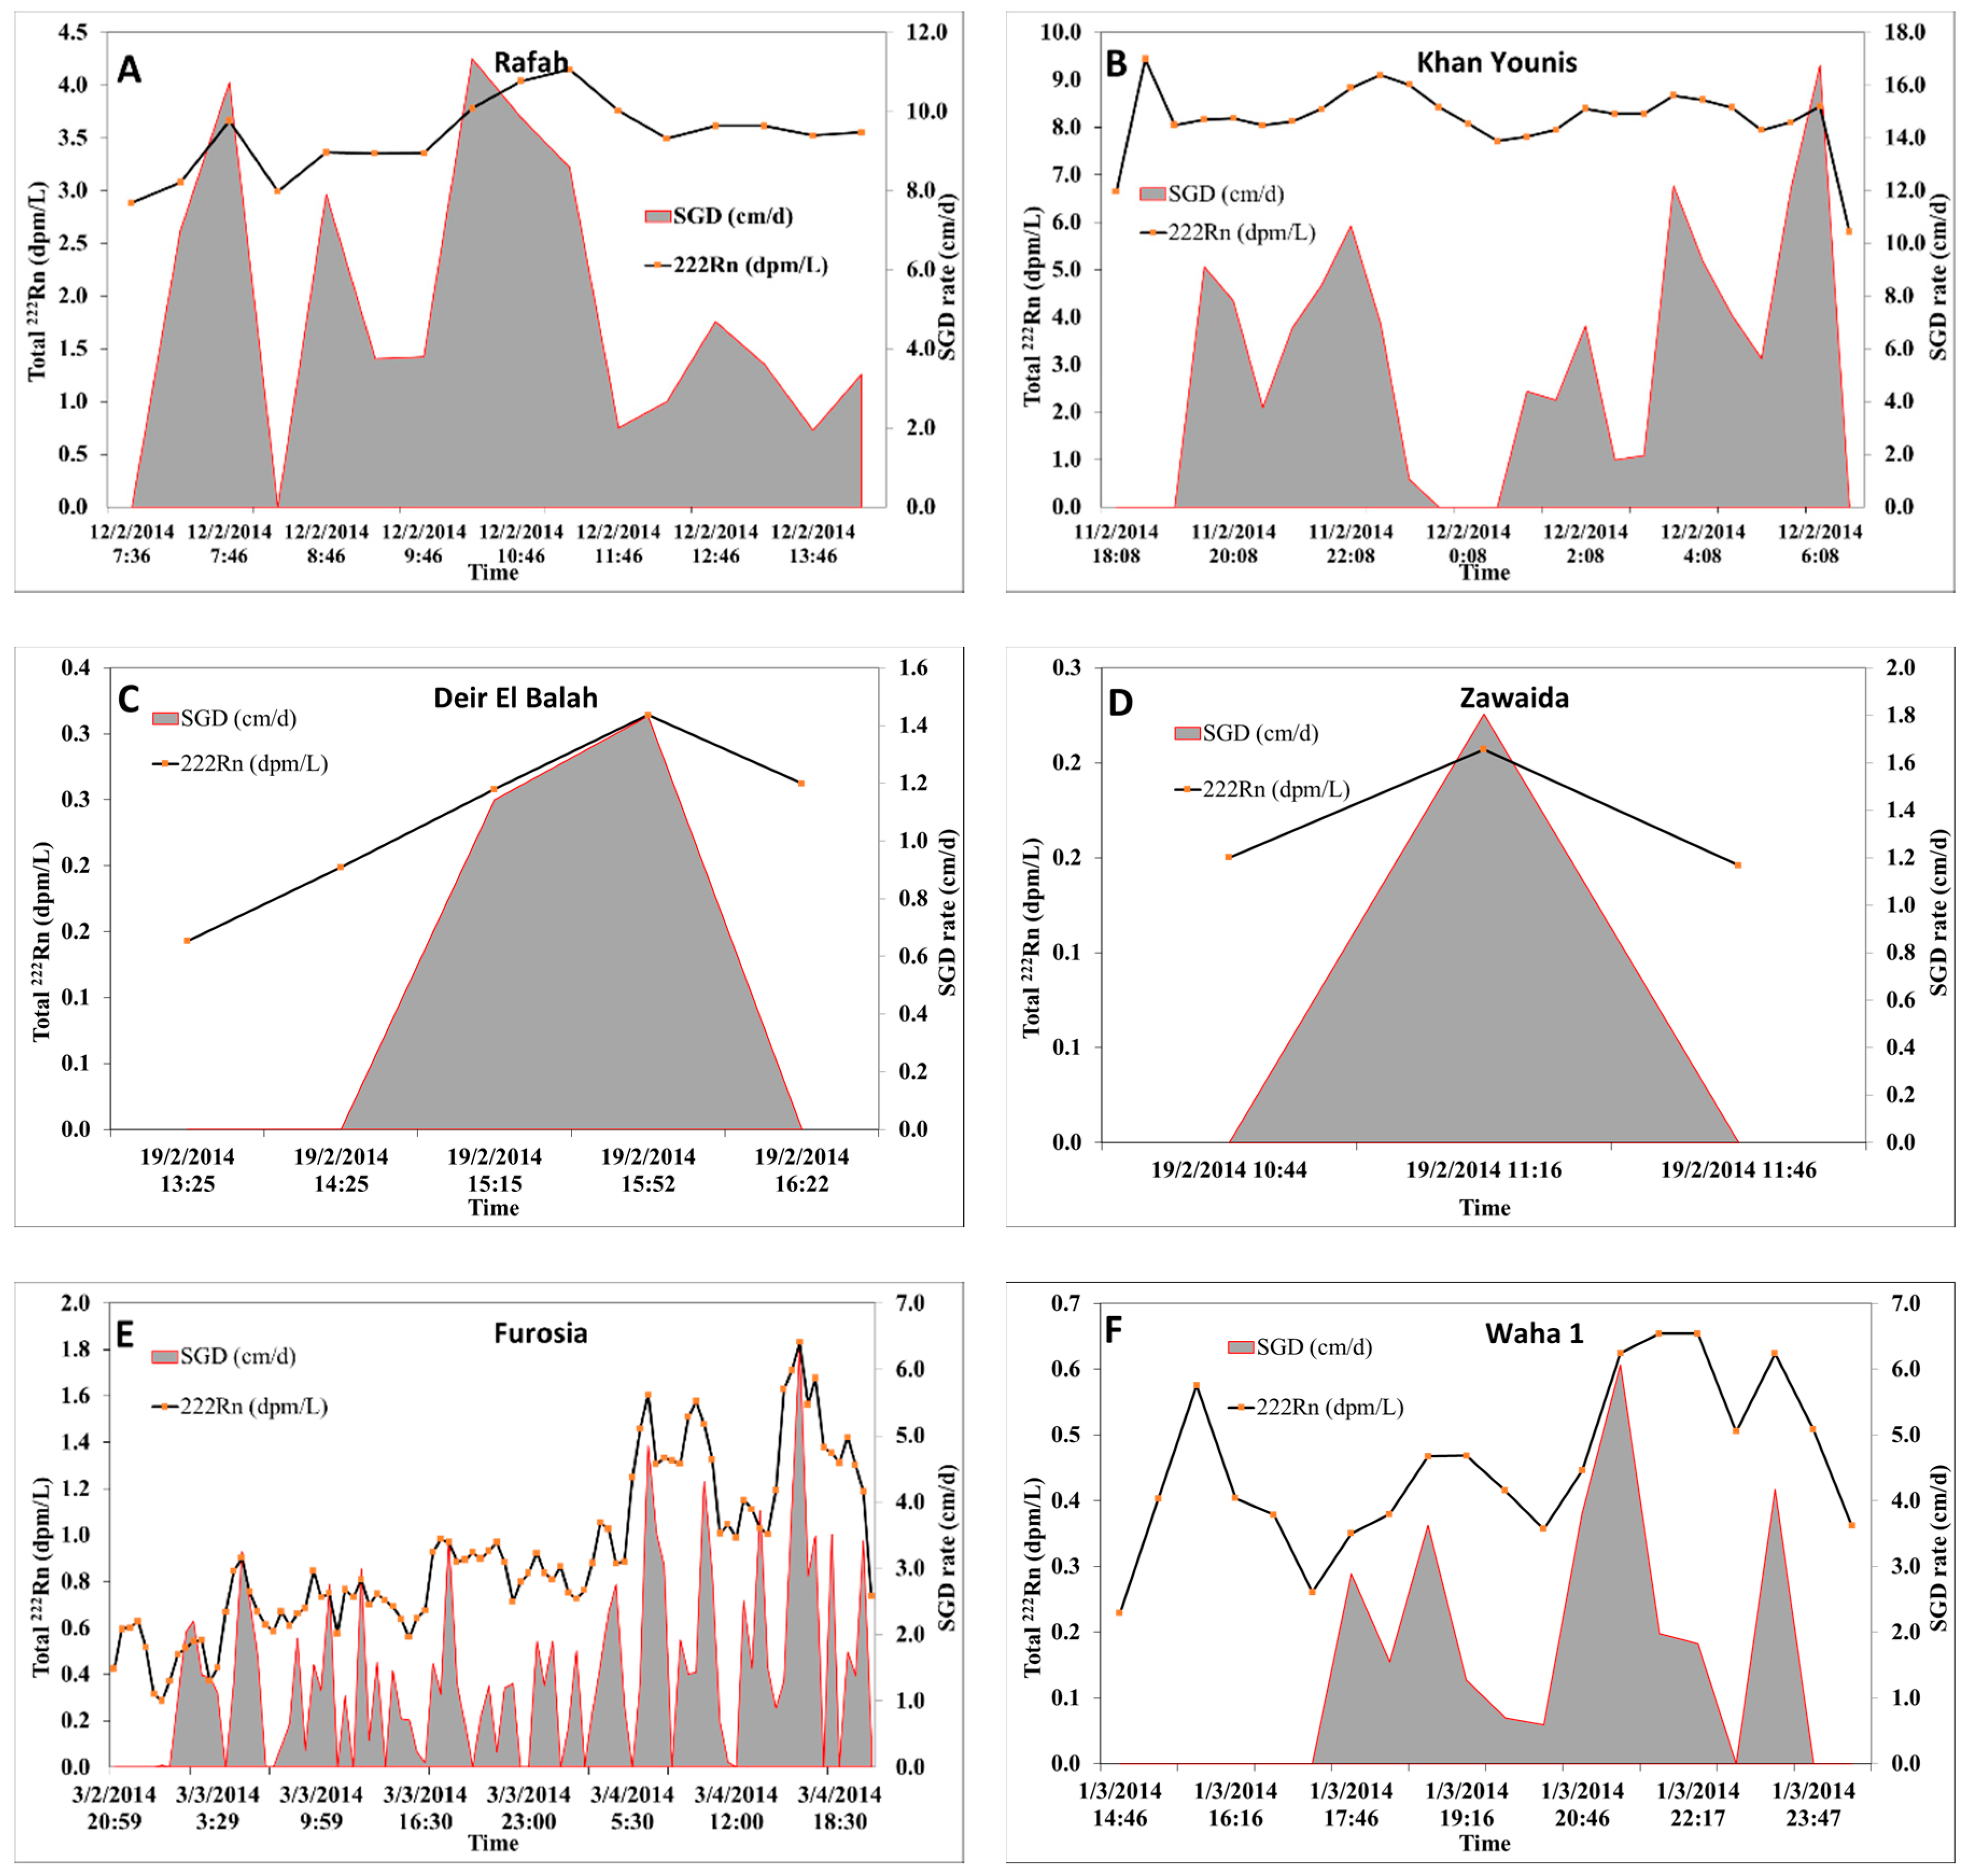
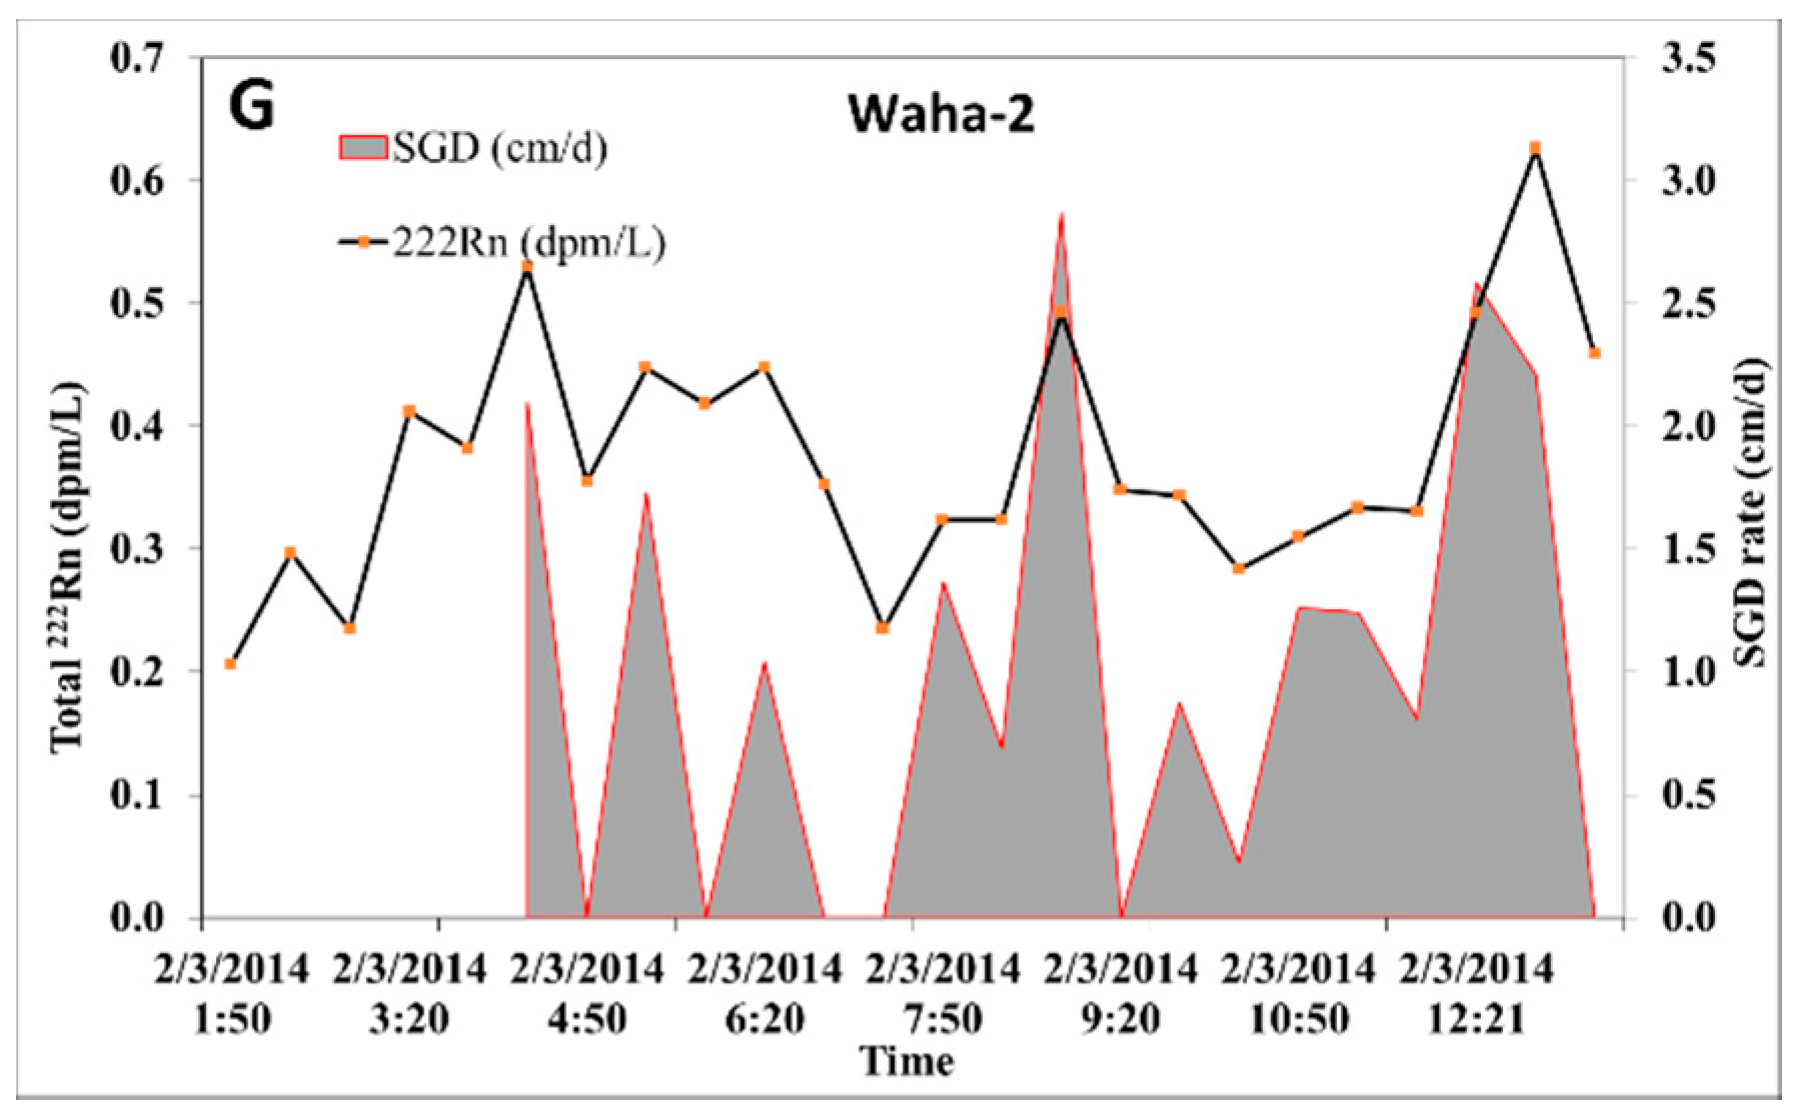
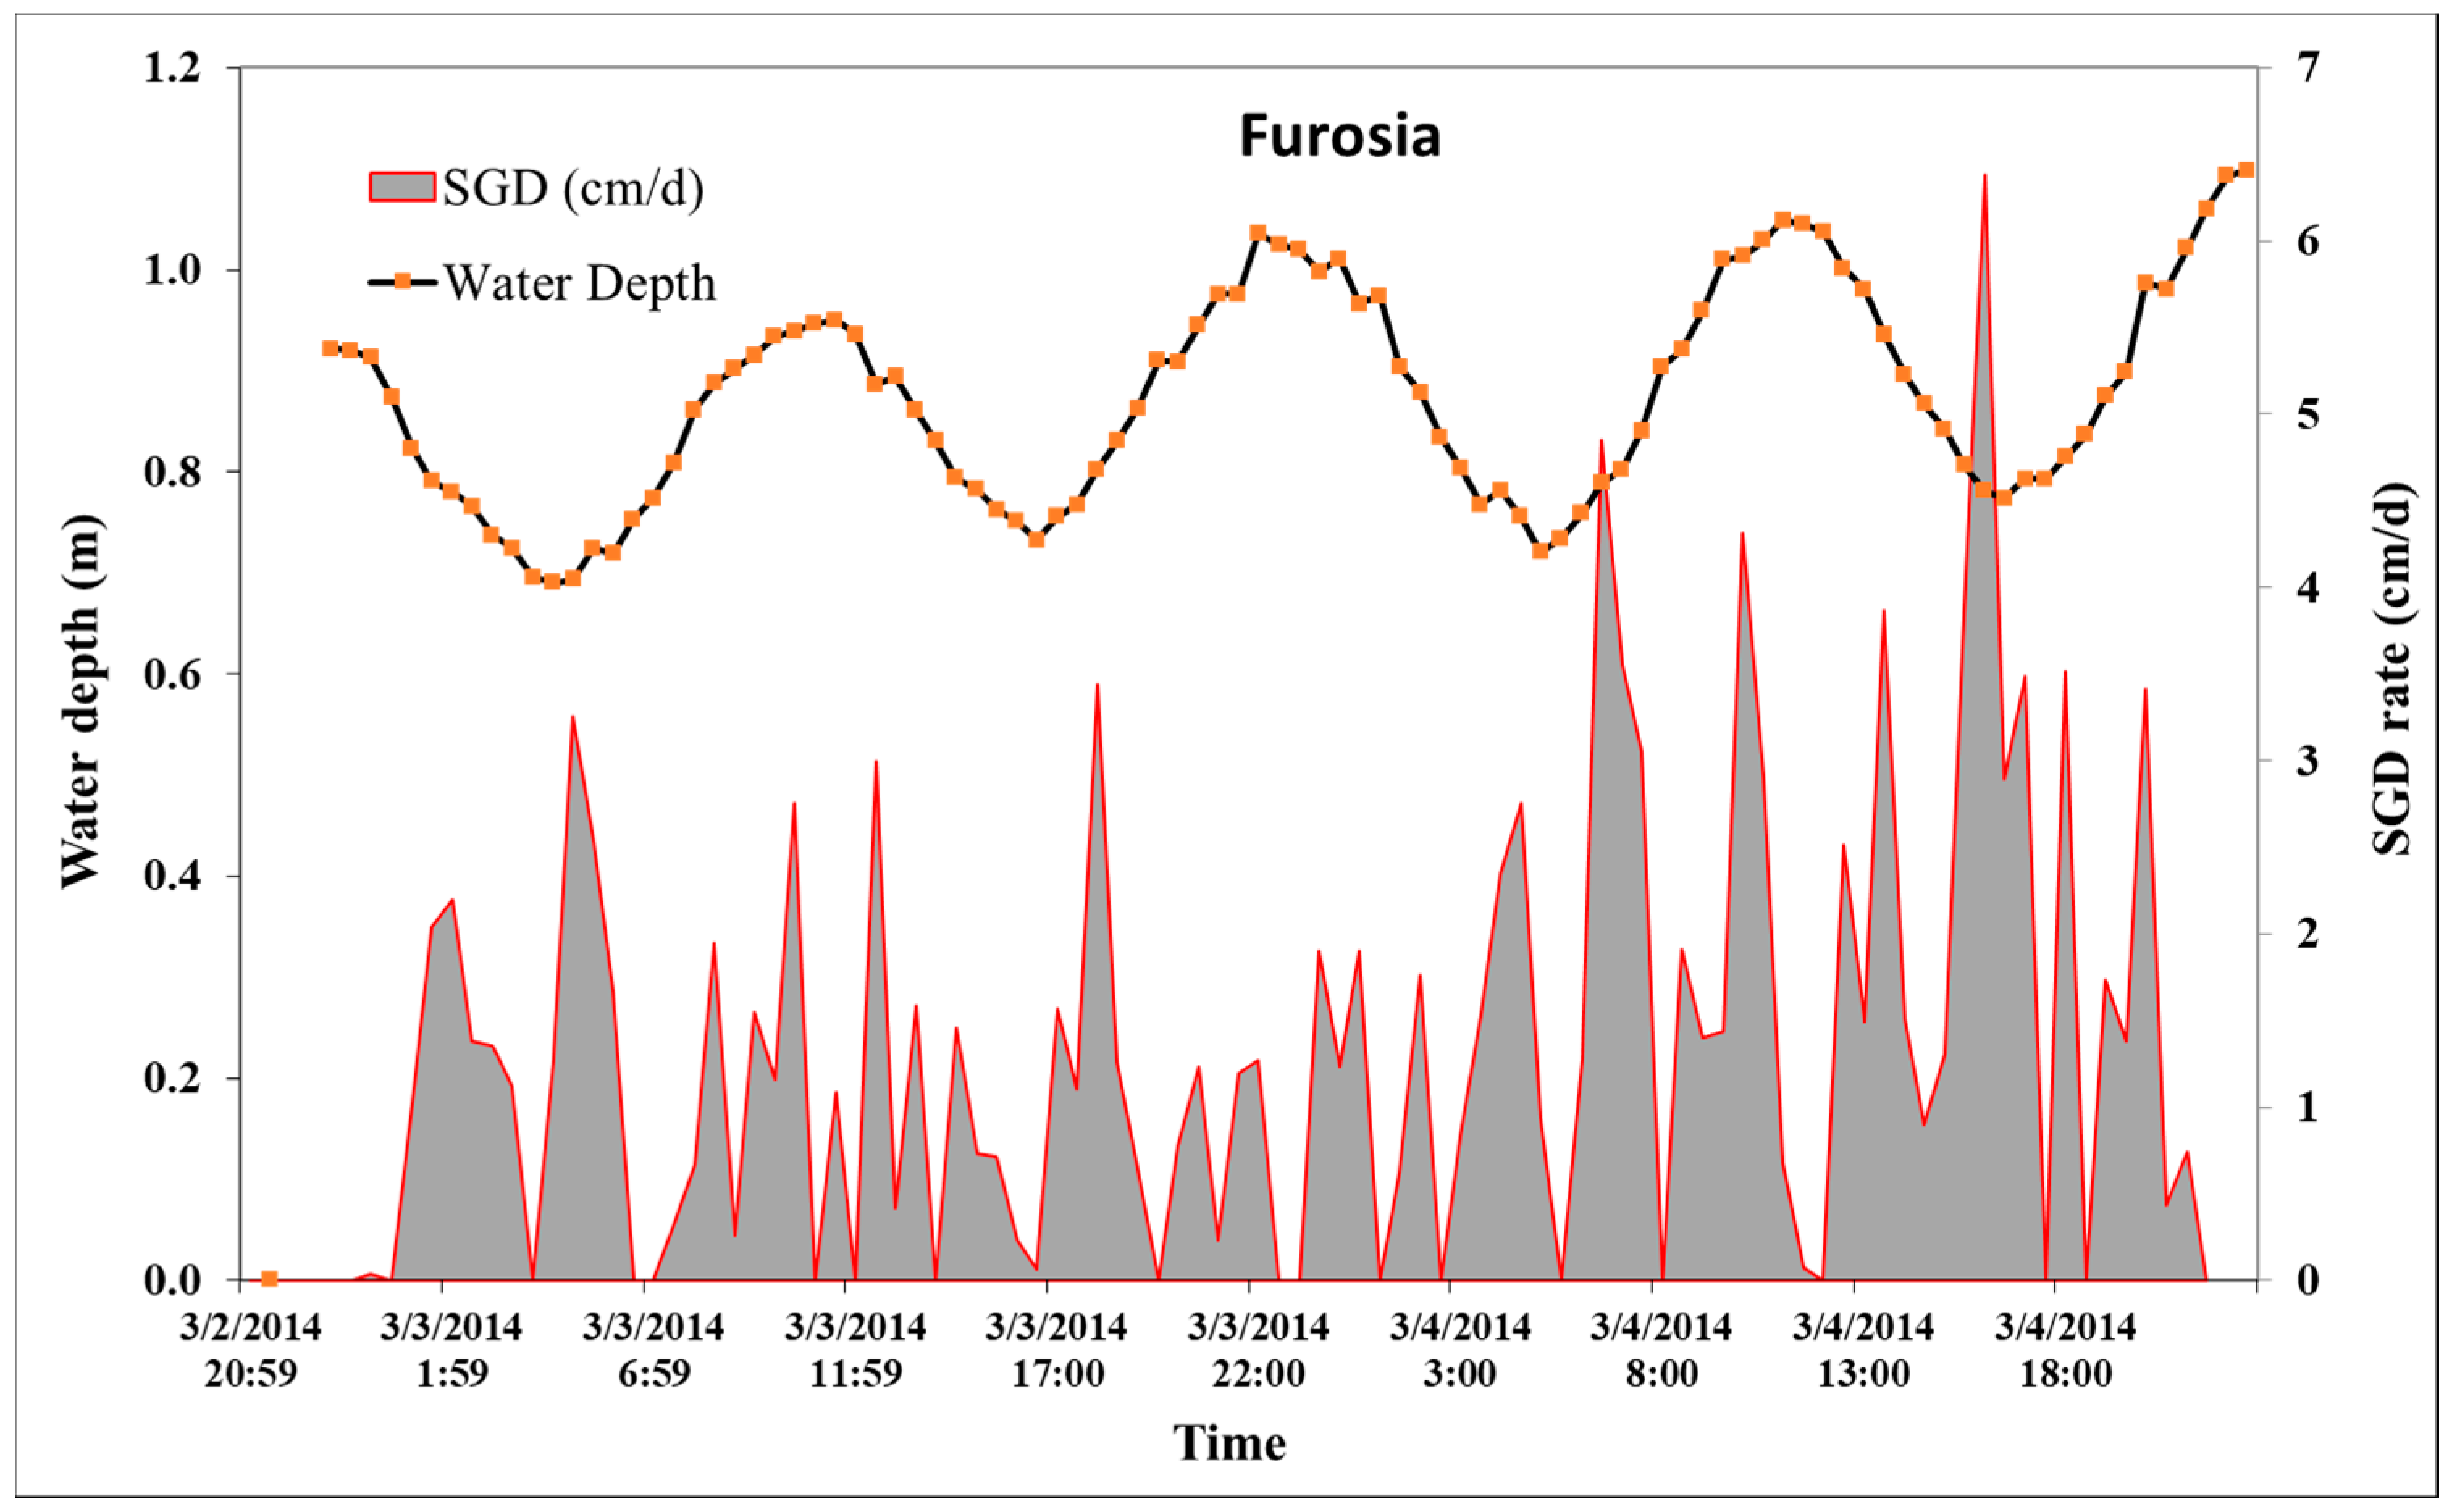
4.2. Radon
5. Discussion
6. Conclusions
Author Contributions
Funding
Acknowledgments
Conflicts of Interest
References
- Zektzer, I.S.; Ivanov, V.A.; Meskheteli, A.V. The problem of direct groundwater discharge to the seas. J. Hydrol. 1973, 20, 1–36. [Google Scholar] [CrossRef]
- Moore, W.S. The subterranean estuary: A reaction zone of ground water and sea water. Mar. Chem. 1999, 65, 111–125. [Google Scholar] [CrossRef]
- Burnett, W.C.; Dulaiova, H. Estimating the dynamics of groundwater input into the coastal zone via continuous radon-222 measurements. J. Environ. Radioact. 2003, 69, 21–35. [Google Scholar] [CrossRef]
- Buddemeier, R.W. Groundwater flux to the ocean: Definitions, data, applications, uncertainties. In Groundwater Discharge in the Coastal Zone: Proceedings of an International Symposium; Buddemeier, R.W., Ed.; IGBP: Texel, The Netherlands, 1996; pp. 16–21. [Google Scholar]
- Dollar, S.J.; Atkinson, M.J. Effects of nutrient subsidies from groundwater to nearshore marine ecosystems off the island of Hawaii. Estuar. Coast. Shelf Sci. 1992, 35, 409–424. [Google Scholar] [CrossRef]
- Paerl, H.W. Coastal eutrophication and harmful algal blooms: Importance of atmospheric deposition and groundwater as “new” nitrogen and other nutrient sources. Limnol. Oceanogr. 1997, 42, 1154–1165. [Google Scholar] [CrossRef]
- Miller, D.C.; Ullman, W.J. Ecological consequences of ground water discharge to Delaware Bay, United States. Groundwater 2004, 42, 959–970. [Google Scholar] [CrossRef]
- Dailer, M.L.; Ramey, H.L.; Saephan, S.; Smith, C.M. Algal δ15N values detect a wastewater effluent plume in nearshore and offshore surface waters and three dimensionally model the plume across a coral reef on Maui, Hawai‘i, USA. Mar. Pollut. Bull. 2012, 64, 207–213. [Google Scholar] [CrossRef]
- Amato, D.W.; Bishop, J.M.; Glenn, C.R.; Dulai, H.; Smith, C.M. Impact of submarine groundwater discharge on marine water quality and reef biota of Maui. PLoS ONE 2016, 11, e0165825. [Google Scholar] [CrossRef]
- Kelly, J.L.; Dulai, H.; Glenn, C.R.; Lucey, P.G. Integration of aerial infrared thermography and in situ radon-222 to investigate submarine groundwater discharge to Pearl Harbor, Hawaii, USA. Limnol. Oceanogr. 2018, 9999, 1–20. [Google Scholar] [CrossRef]
- Weinstein, Y.; Yechieli, Y.; Shalem, Y.; Burnett, W.C.; Swarzenski, P.W.; Herut, B. What Is the Role of Fresh Groundwater and Recirculated Seawater in Conveying Nutrients to the Coastal Ocean? Environ. Sci. Technol. 2011. [Google Scholar] [CrossRef]
- Lebbe, L.C. The subterranean flow of fresh and salt water underneath the western Belgian beach. Proceedings of the Seventh Salt Water Intrusion Meeting, Uppsala. Sver. Geol. Unders. Rap. Medd. 1981, 27, 193–219. [Google Scholar]
- Werner, A.D.; Lockington, D.A. Tidal impacts on riparian salinities near estuaries. J. Hydrol. 2006, 328, 511–522. [Google Scholar] [CrossRef]
- Bishop, J.M.; Glenn, C.R.; Amato, D.W.; Dulai, H. Effect of land use and groundwater flow path on submarine groundwater discharge nutrient flux. J. Hydrol. Reg. Stud. 2017, 11, 194–218. [Google Scholar] [CrossRef]
- Burnett, W.C.; Cable, J.E.; Corbett, D.R.; Chanton, J.P. Tracing groundwater flow into surface waters using natural 222Rn. In Groundwater Discharge in the Coastal Zone: Proceedings of an International Symposium; Buddemeier, R.W., Ed.; IGBP: Texel, The Netherlands, 1996; pp. 22–28. [Google Scholar]
- Cable, J.E.; Burnett, W.C.; Chanton, J.P.; Weatherly, G. Modeling groundwater flow into the ocean based on 222Rn. Earth Planet. Sci. Lett. 1996, 144, 591–604. [Google Scholar] [CrossRef]
- Corbett, D.R.; Burnett, W.C.; Cable, P.H. Tracing of groundwater input into Par Pond, Savannah River Site by Rn-222. J. Hydrol. 1997, 203, 209–227. [Google Scholar] [CrossRef]
- Burnett, W.; Chariton, J.; Christoff, J.; Kontar, E.; Krupa, S.; Lambert, M.; Moore, W.; O’Rourke, D.; Paulsen, R.; Smith, C.; et al. Assessing methodologies for measuring groundwater discharge to the ocean. EOS 2002, 83, 117, 122–123. [Google Scholar] [CrossRef]
- Lane-Smith, D.R.; Burnett, W.C.; Dulaiova, H. Continuous radon-222 measurements in the coastal zone. Sea Technol. 2002, 43, 37–45. [Google Scholar]
- Burnett, W.C.; Kim, G.; Lane-Smith, D. A continuous radon monitor for assessment of radon in coastal ocean waters. J. Radioanal. Nucl. Chem. 2001, 249, 167–172. [Google Scholar]
- Mushtaha, A.; Van Camp, M.; Walraevens, K. Evolution of runoff and groundwater recharge in the Gaza Strip over the four decades. Environ. Earth Sci. 2018. under review. [Google Scholar]
- PWA/USAID. Integrated Aquifer Management Plan; PWA: Gaza Strip, Palestine, 2000.
- Mushtaha, A.; Aliewi, A.; Mackay, R. The Use of Scavenger Wells to Control Saltwater Upconing in Gaza, Palestine. In Proceedings of the 16th Salt Water Intrusion Meeting, Miedzyzdroje–Wolin Island, Poland, 12–15 June 2000; pp. 109–116. [Google Scholar]
- PWA. Water Resources Status Summary Report/Gaza Strip; Water Resources Directorate: Palestinian Water Authority, Palestine, 2017.
- PWA. Water Resources Status Report for Year 2014/Gaza Strip; Water Resources Directorate: Palestinian Water Authority, Palestine, 2015.
- Greitzer, Y.; Dan, J. The Effect of Soil Landscape and Quaternary Geology on the Distribution of Saline and Fresh Water Aquifers in the Coastal Plain of Israel; Tahal Water Planning for Israel, Ltd.: Tel Aviv, Israel, 1967. [Google Scholar]
- Kress, N.; Herut, B. Spatial and seasonal evolution of dissolved oxygen and nutrients in the Southern Levantine Basin (Eastern Mediterranean Sea): Chemical characterization of the water masses and inferences on the high N:P ratio. Deep Sea Res. 2001, 48, 2347–2372. [Google Scholar] [CrossRef]
- Dulaiova, H.; Gonneea, M.E.; Henderson, P.B.; Charette, M.A. Geochemical and physical sources of radon variation in a subterranean estuary—Implications for groundwater radon activities in submarine groundwater discharge studies. Mar. Chem. 2008, 110, 120–127. [Google Scholar] [CrossRef]
- Dulaiova, H.; Burnett, W.C. Radon loss across the water-air interface (Gulf of Thailand) estimated experimentally from 222Rn-224Ra. Geophys. Res. Lett. 2006, 33. [Google Scholar] [CrossRef]
- Dulaiova, H.; Burnett, W.C.; Chanton, J.P.; Moore, W.S.; Bokuniewicz, H.J.; Charette, M.A.; Sholkovitz, E. Assessment of Submarine Groundwater Discharges into West Neck Bay, New York, via Natural Tracers. Cont. Shelf Res. 2006, 26, 1971–1983. [Google Scholar] [CrossRef]
- Christoff, J.L. Quantifying Groundwater Seepage into a Shallow Near-Shore Coastal Zone by Two Techniques. Master’s. Thesis, Florida State University, Tallahassee, FL, USA, 2001. [Google Scholar]
- Dulaiova, H.; Burnett, W.C.; Wattayakorn, G.; Sojisuporn, P. Are Groundwater Inputs into River-Dominated Areas Important? The Chao Phraya River—Gulf of Thailand. Limnol. Oceanogr. 2006, 51, 2232–2247. [Google Scholar] [CrossRef]
- Mulligan, A.E.; Charette, M.A. Intercomparison of submarine groundwater discharge estimates from a sandy unconfined aquifer. J. Hydrol. 2006, 327, 411–425. [Google Scholar] [CrossRef]
- Chidambaram, S.; Nepoliana, M.; Ramanathan, A.L.; Sarathidasan, J.; Thilagavathi, R.; Thivya, C.; Prasanna, M.V.; Srinivasamoorthy, K.; Jacob, N.; Mohokar, H. An attempt to identify and estimate the subsurface groundwater discharge in the south east coast of India. Int. J. Sustain. Built Environ. 2017, 6, 421–433. [Google Scholar] [CrossRef]
- Broecker, W.S. An application of natural radon to problems in oceanic circulation. In Symposium on Diffusion in the Oceans and Fresh Waters; Ichiye, D.T., Ed.; Lamont Geological Observatory: New York, NY, USA, 1965; pp. 116–145. [Google Scholar]
- Mathieu, G.; Biscayne, P.; Lupton, R.; Hammond, D. System for measurements of 222Rn at low levels in natural waters. Health Phys. 1988, 55, 989–992. [Google Scholar] [CrossRef]
- Ray, R.L.; Dogan, A. Contemporary Methods for Quantifying Submarine Groundwater Discharge to Coastal Areas. In Emerging Issues in Groundwater Resources. Advances in Water Security; Fares, A., Ed.; Springer: Cham, Switzerland, 2016. [Google Scholar] [CrossRef]
- Burnett, W.C.; Santos, I.R.; Weinstein, Y.; Swarzenski, P.W.; Herut, B. Remaining uncertainties in the use of Rn-222 as a quantitative tracer of submarine groundwater discharge. In Proceedings of the International Symposium: A New Focus on Groundwater-Seawater Interactions, Perugia, Italy, 2–13 July 2007; pp. 109–118. [Google Scholar]
- Weinstein, Y.; Burnett, W.C.; Swarzenski, P.W.; Shalem, Y.; Yechieli, Y.; Herut, B. Role of aquifer heterogeneity in fresh groundwater discharge and seawater recycling: An example from the Carmel coast, Israel. J. Geophys. Res. 2007, 112, C12016. [Google Scholar] [CrossRef]
- Peterson, N.R.; Burnett, W.C.; Taniguchi, M.; Chen, J.; Santos, I.R.; Ishitobi, T. Radon and radium isotope assessment of submarine groundwater discharge in the Yellow River delta, China. J. Geophys. Res. 2008, 113, C09021. [Google Scholar] [CrossRef]
- Hampson, B.L. The Analysis of Ammonia in Polluted sea water. Water Res. 1977, 11, 305–308. [Google Scholar] [CrossRef]
- CMWU. Water Resource Status in the Gaza Strip; Coastal Municipalities Water Utility: Al-Zahraa City, Palestine, 2013. [Google Scholar]


| Area | Site Name | Coordinates (Palestinian Grid System 1923) | Continuous Radon Measurement Time Duration (Hours:Minutes) | Date of Measurement | |
|---|---|---|---|---|---|
| X | Y | ||||
| South | Rafah | 76,581.88 | 82,326.76 | 7:15 | 12 February 2014 |
| Khan Younis | 79,585.25 | 85,385.75 | 12:30 | 11–12 February 2014 | |
| Middle | Deir El Balah | 86,148.19 | 92,004.30 | 3:00 | 19 February 2014 |
| Zawaida | 88,873.47 | 95,118.91 | 1:30 | 19 February 2014 | |
| North | Furosia | 97,661.13 | 106,020.06 | 47:30 | 2–4 March 2014 |
| Waha (two tests) | 99,830.23 | 108,689.72 | 9:30 11:30 | 1 March 2014 2 March 2014 | |
| Area (Group) | Number of Samples | Statistical Parameter | NO3− (µM) | NO2− (µM) | NO3− + NO2− (µM) | NH4+ (µM) | PO43− (µM) | Salinity (ppt) |
|---|---|---|---|---|---|---|---|---|
| North | 51 | Average | 316.2 | 3.9 | 320.1 | 380.8 | 11.0 | 39.6 |
| Standard deviation | 167.4 | 4.3 | 167.1 | 152.4 | 7.0 | 0.5 | ||
| Middle | 68 | Average | 254.7 | 9.9 | 264.6 | 373.3 | 6.5 | 38.8 |
| Standard deviation | 117.3 | 17.7 | 130.4 | 223.3 | 5.2 | 0.7 | ||
| South | 109 | Average | 201.4 | 3.2 | 204.6 | 362.5 | 5.6 | 38.4 |
| Standard deviation | 80.9 | 6.8 | 83.5 | 198.5 | 5.1 | 1.7 | ||
| Wells (600 m from the coastline) | 4 | Average | 424.7 | 15.6 | 440.3 | 360 | 4.9 | 4.9 |
| Standard deviation | 262.0 | 30.0 | 276.0 | 201.8 | 6.6 | 4.9 |
| Sample No. | Area (Group) | LOCATION NAME | No. of Records | Average Measured 222Rn (dpm·L−1) | Average Depth (m) | Average Water Temperature (°C) | Calculated SGD Rate (cm·day−1) | ||
|---|---|---|---|---|---|---|---|---|---|
| Average | Standard Deviation | ||||||||
| 1 | North | Waha-1 | 20 | 0.45 ± 0.18 | 0.85 | 20.3 | 2.0 | 1.5 | 1.8 |
| Waha-2 | 24 | 0.37 ± 0.17 | 0.83 | 20.6 | 1.0 | 0.9 | |||
| 2 | Furosia | 96 | 0.92 ± 0.27 | 0.87 | 21.6 | 1.4 | 1.3 | ||
| 3 | Middle | Zawaida | 3 | 0.17 ± 0.08 | 1.05 | 20.0 | 0.9 | 0.9 | 1.3 |
| 4 | Deir El Balah | 5 | 0.24 ± 0.11 | 0.88 | 21.2 | 0.9 | 0.8 | ||
| 5 | South | Khan Younis | 26 | 8.20 ± 1.20 | 0.89 | 18.5 | 5.9 | 5.5 | 4.6 |
| 6 | Rafah | 15 | 3.51 ± 0.67 | 0.93 | 19.0 | 5.1 | 3.7 | ||
| Location Name | Final SGD Rate (cm·day−1) with 222Rn Offshore (dpm·m−3) | ||
|---|---|---|---|
| 500 | 1000 | 2000 | |
| Waha-1 | 2.2 | 2.0 | 1.9 |
| Waha-2 | 1.0 | 1.0 | 1.0 |
| Furosia | 1.4 | 1.4 | 1.3 |
| Zawaida | 0.8 | 0.9 | 1.0 |
| Deir El Balah | 0.8 | 0.9 | 1.1 |
| Khan Younis | 6.7 | 5.9 | 6.0 |
| Rafah | 5.1 | 5.1 | 5.1 |
| Area (Group) | Coastline Length (km) | SGD | NO3− | NO2− | NH4+ | PO43− | |
|---|---|---|---|---|---|---|---|
| Rate cm/day | Quantity m3/year | ||||||
| North | 18.1 | 1.5 | 97,116 | 316.2 µM | 3.9 µM | 380.8 µM | 11 µM |
| 1412.6 kg/year | 23.5 kg/year | 665.7 kg/year | 101.5 kg/year | ||||
| Middle | 9.5 | 0.9 | 31,208 | 254.7 µM | 9.9 µM | 373.3 µM | 6.5 µM |
| 365.6 kg/year | 19.2 kg/year | 209.7 kg/year | 19.3 kg/year | ||||
| South | 12.3 | 5.5 | 246,923 | 201.4 µM | 3.2 µM | 362.5 µM | 5.6 µM |
| 2287.6 kg/year | 49.0 kg/year | 1611.2 kg/year | 131.4 kg/year | ||||
| Total for all Gaza Strip coastline (1 m wide strip) | 375,246 | 4066 kg/year | 92 kg/year | 2487 kg/year | 252 kg/year | ||
© 2018 by the authors. Licensee MDPI, Basel, Switzerland. This article is an open access article distributed under the terms and conditions of the Creative Commons Attribution (CC BY) license (http://creativecommons.org/licenses/by/4.0/).
Share and Cite
Mushtaha, A.M.; Walraevens, K. Quantification of Submarine Groundwater Discharge in the Gaza Strip. Water 2018, 10, 1818. https://doi.org/10.3390/w10121818
Mushtaha AM, Walraevens K. Quantification of Submarine Groundwater Discharge in the Gaza Strip. Water. 2018; 10(12):1818. https://doi.org/10.3390/w10121818
Chicago/Turabian StyleMushtaha, Ashraf M., and Kristine Walraevens. 2018. "Quantification of Submarine Groundwater Discharge in the Gaza Strip" Water 10, no. 12: 1818. https://doi.org/10.3390/w10121818
APA StyleMushtaha, A. M., & Walraevens, K. (2018). Quantification of Submarine Groundwater Discharge in the Gaza Strip. Water, 10(12), 1818. https://doi.org/10.3390/w10121818