Evaluation of Various Probability Distributions for Deriving Design Flood Featuring Right-Tail Events in Pakistan


Abstract
:1. Introduction
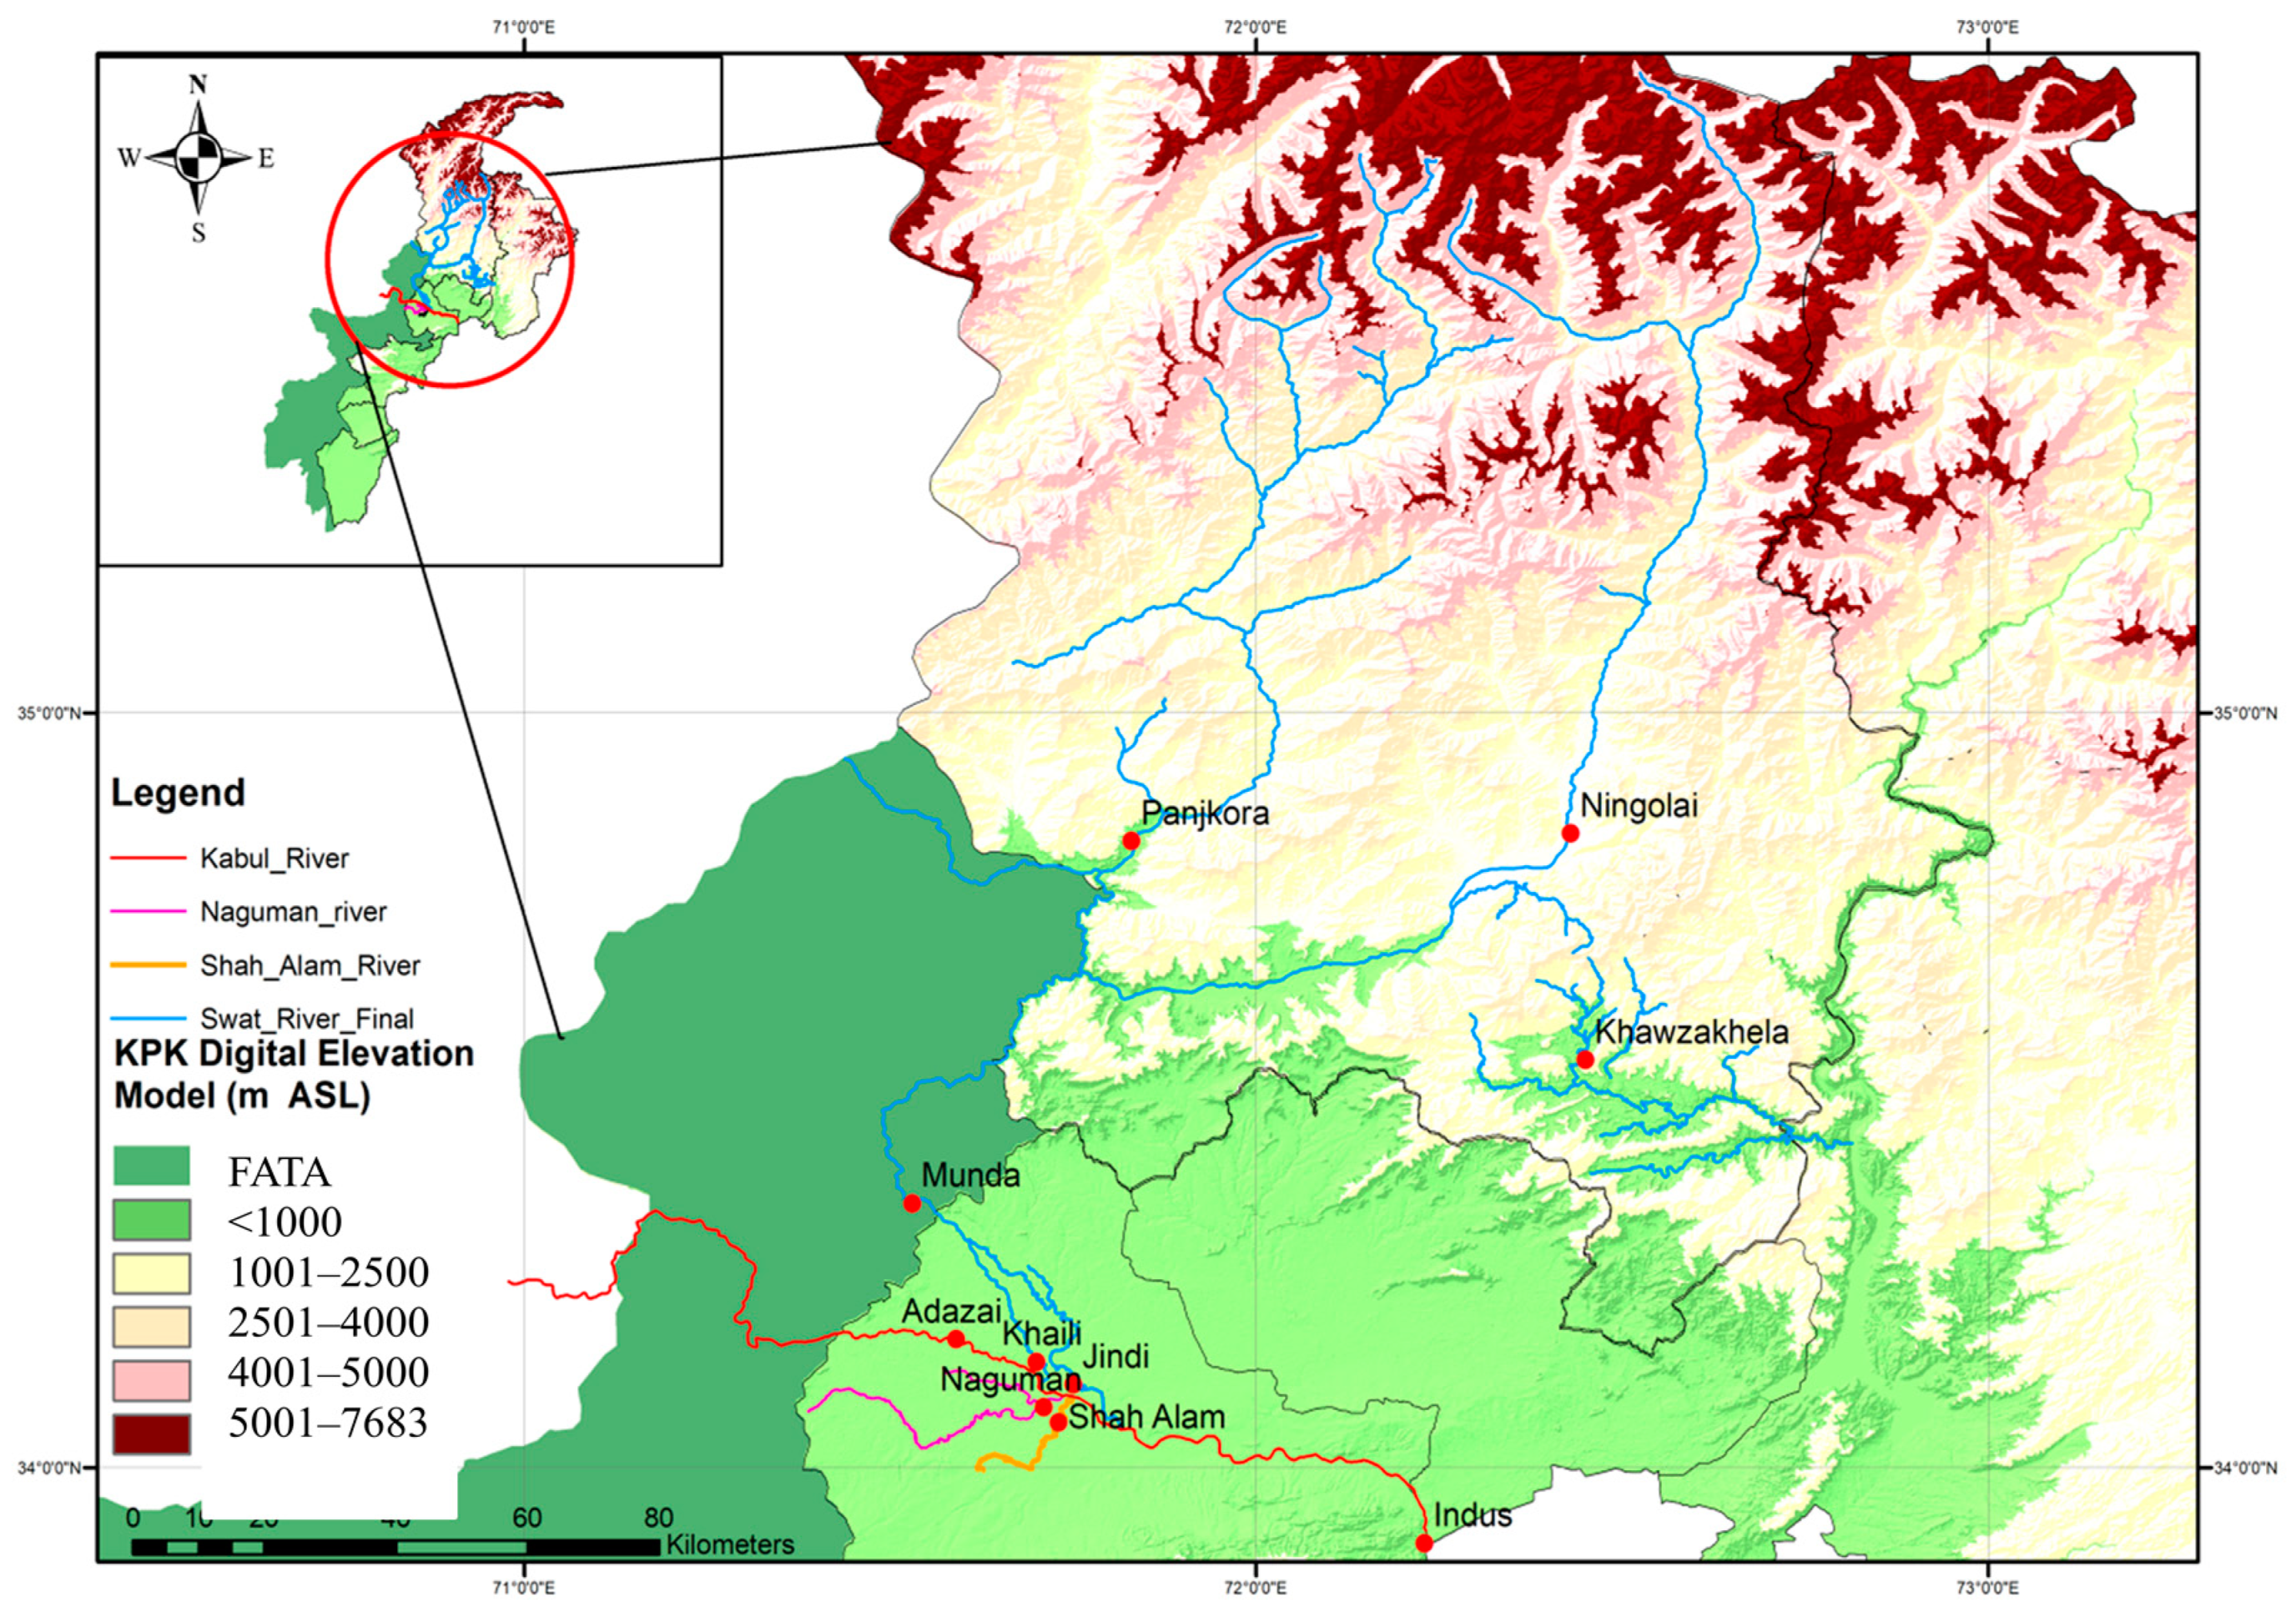
2. Study Basin and Data
3. Methods
3.1. Probability Distributions
3.2. Parameter Estimation Method
3.3. The Goodness-of-Fit and Selection Criteria
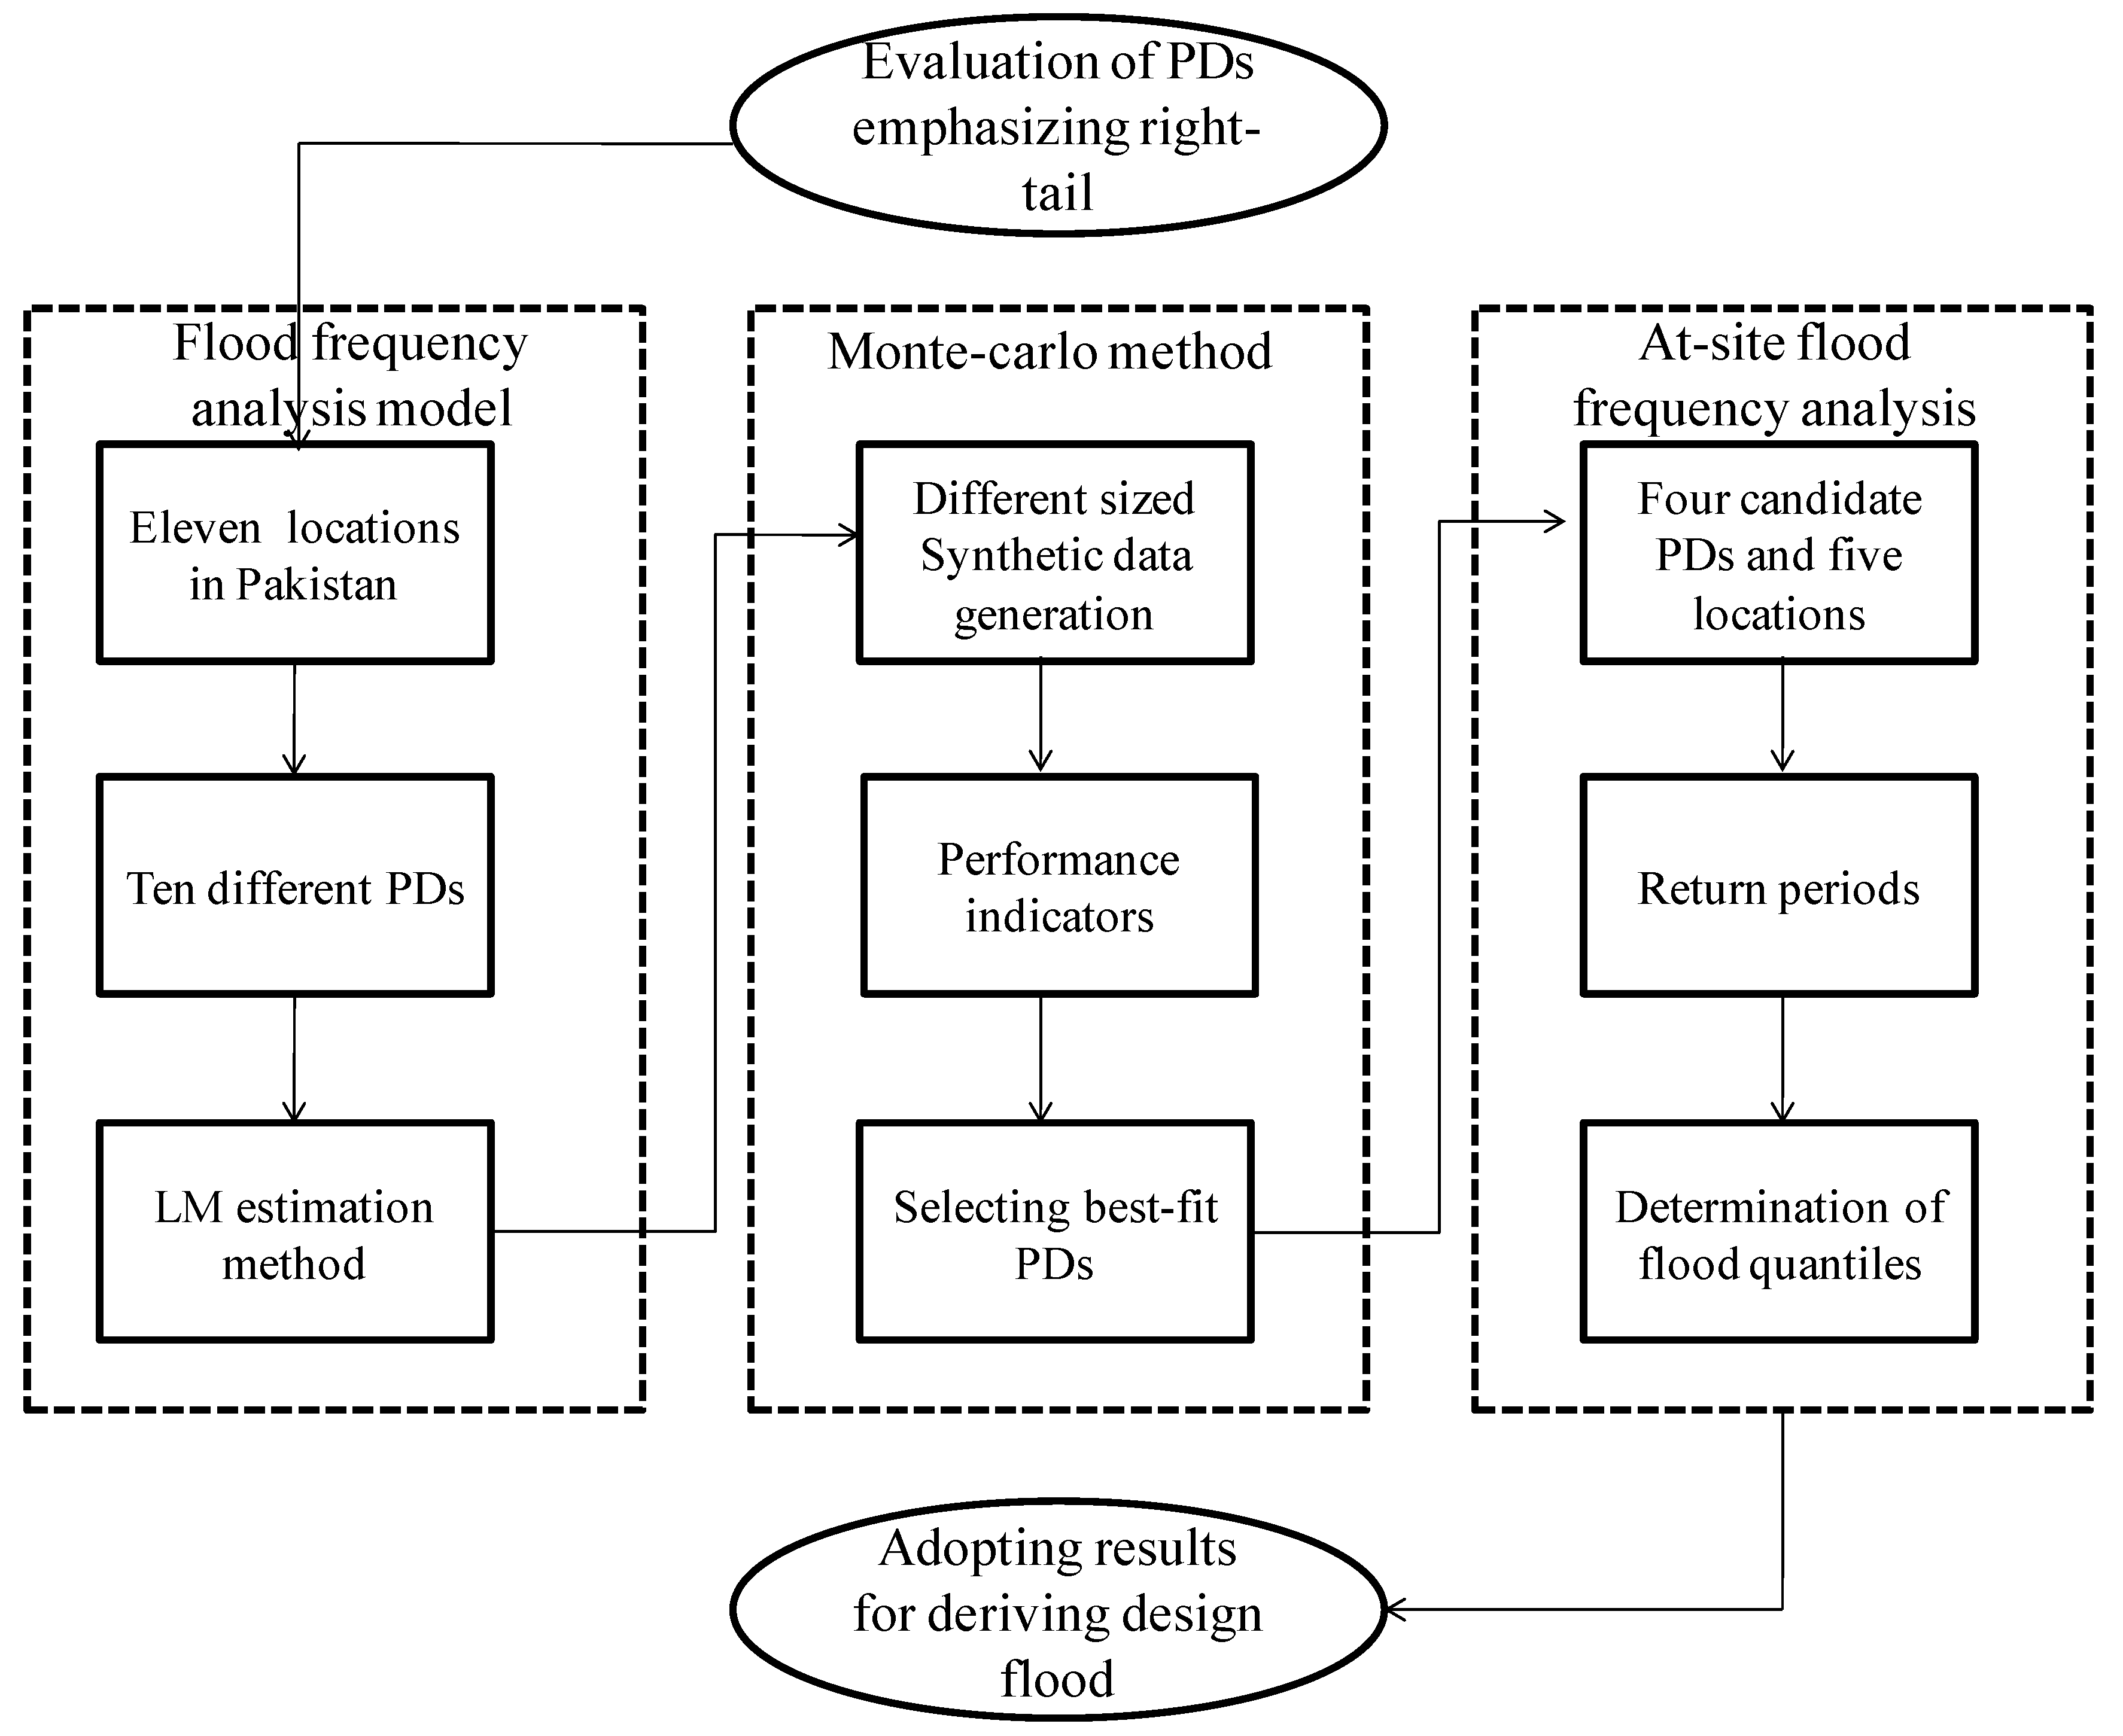
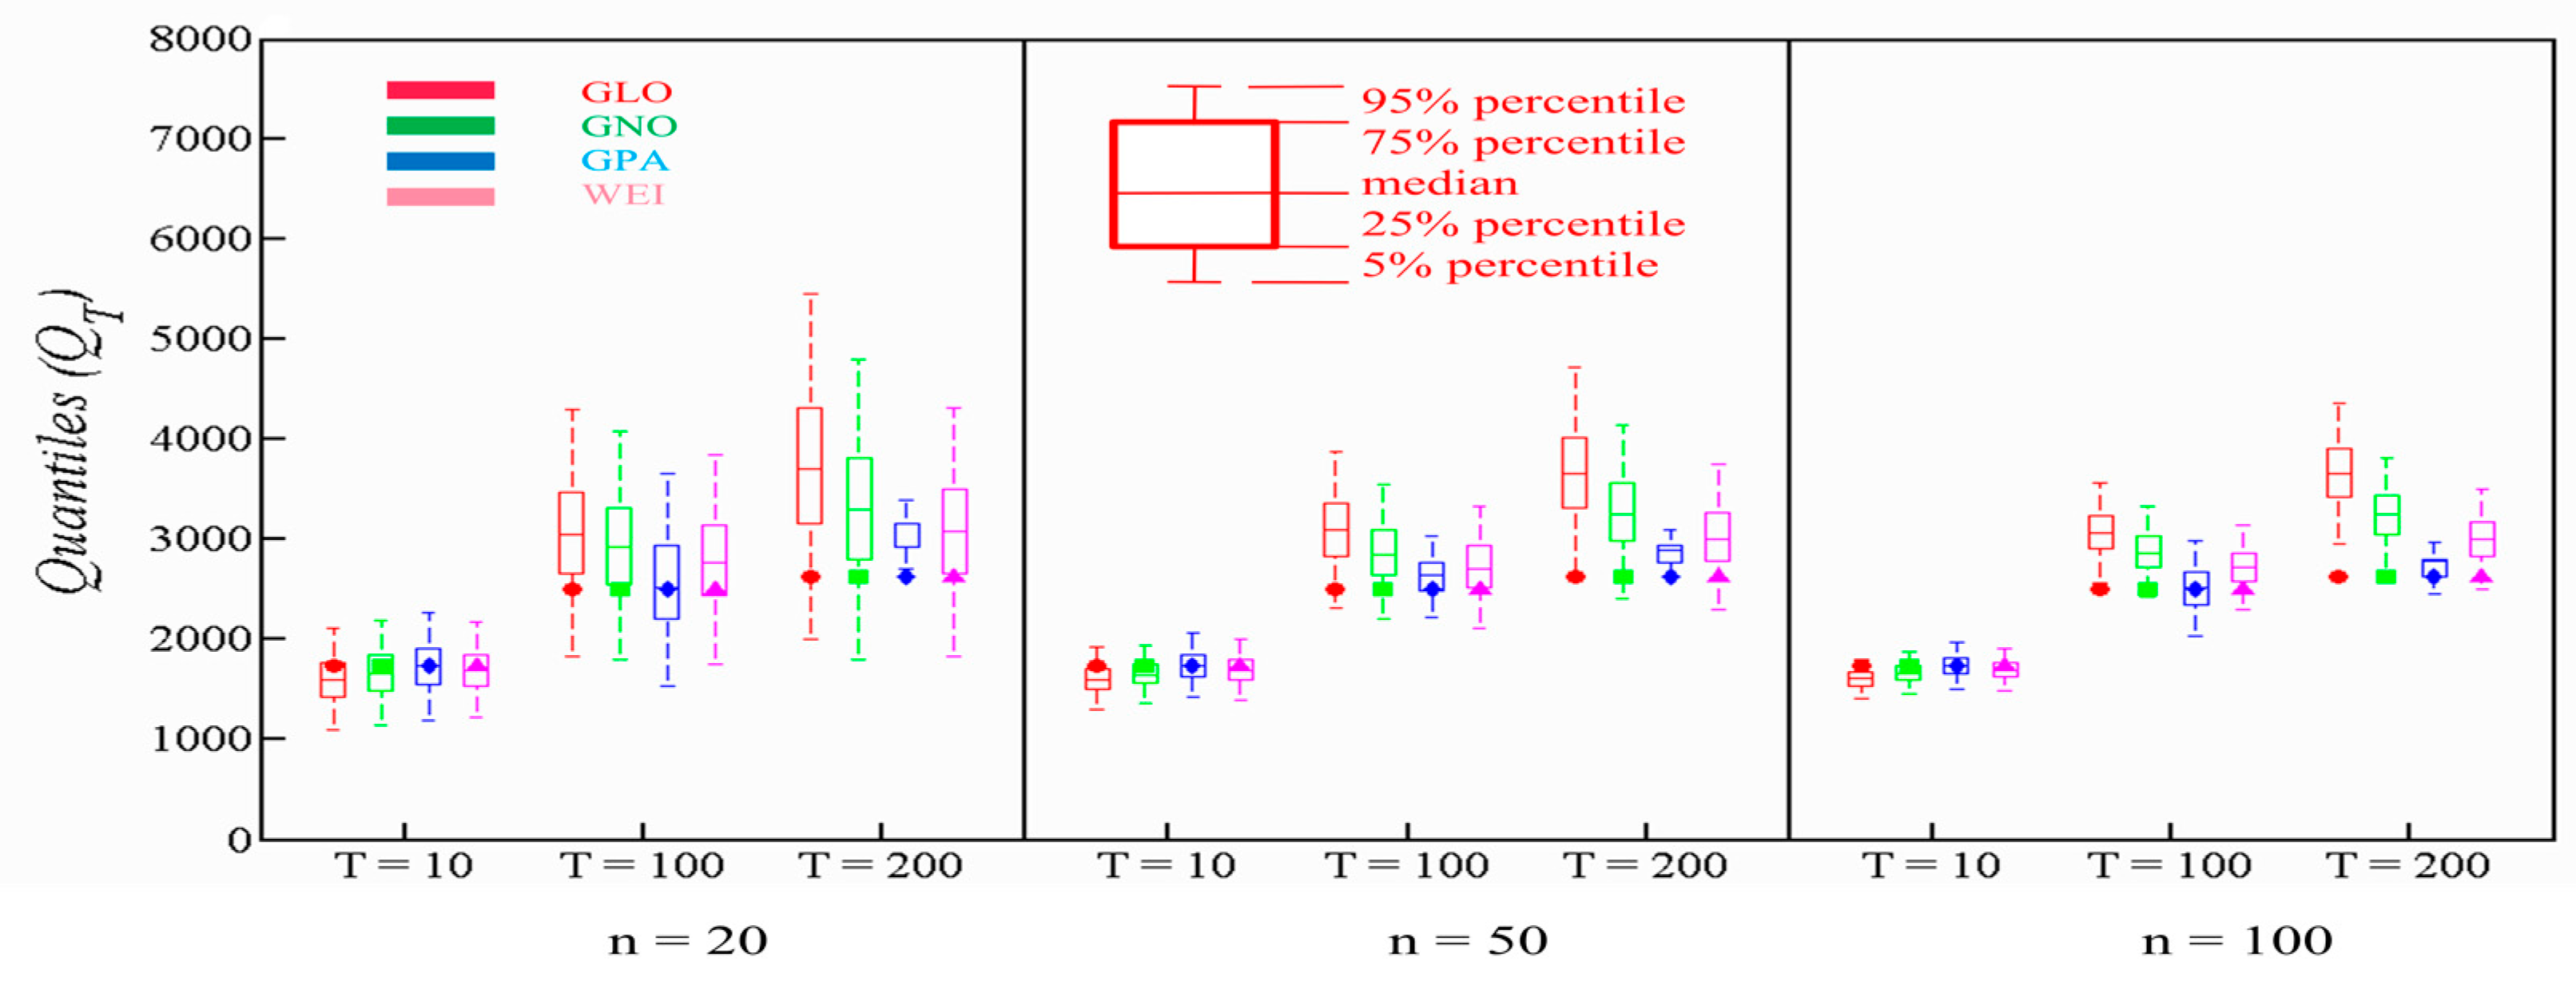
3.4. Monte Carlo Simulation
4. Results
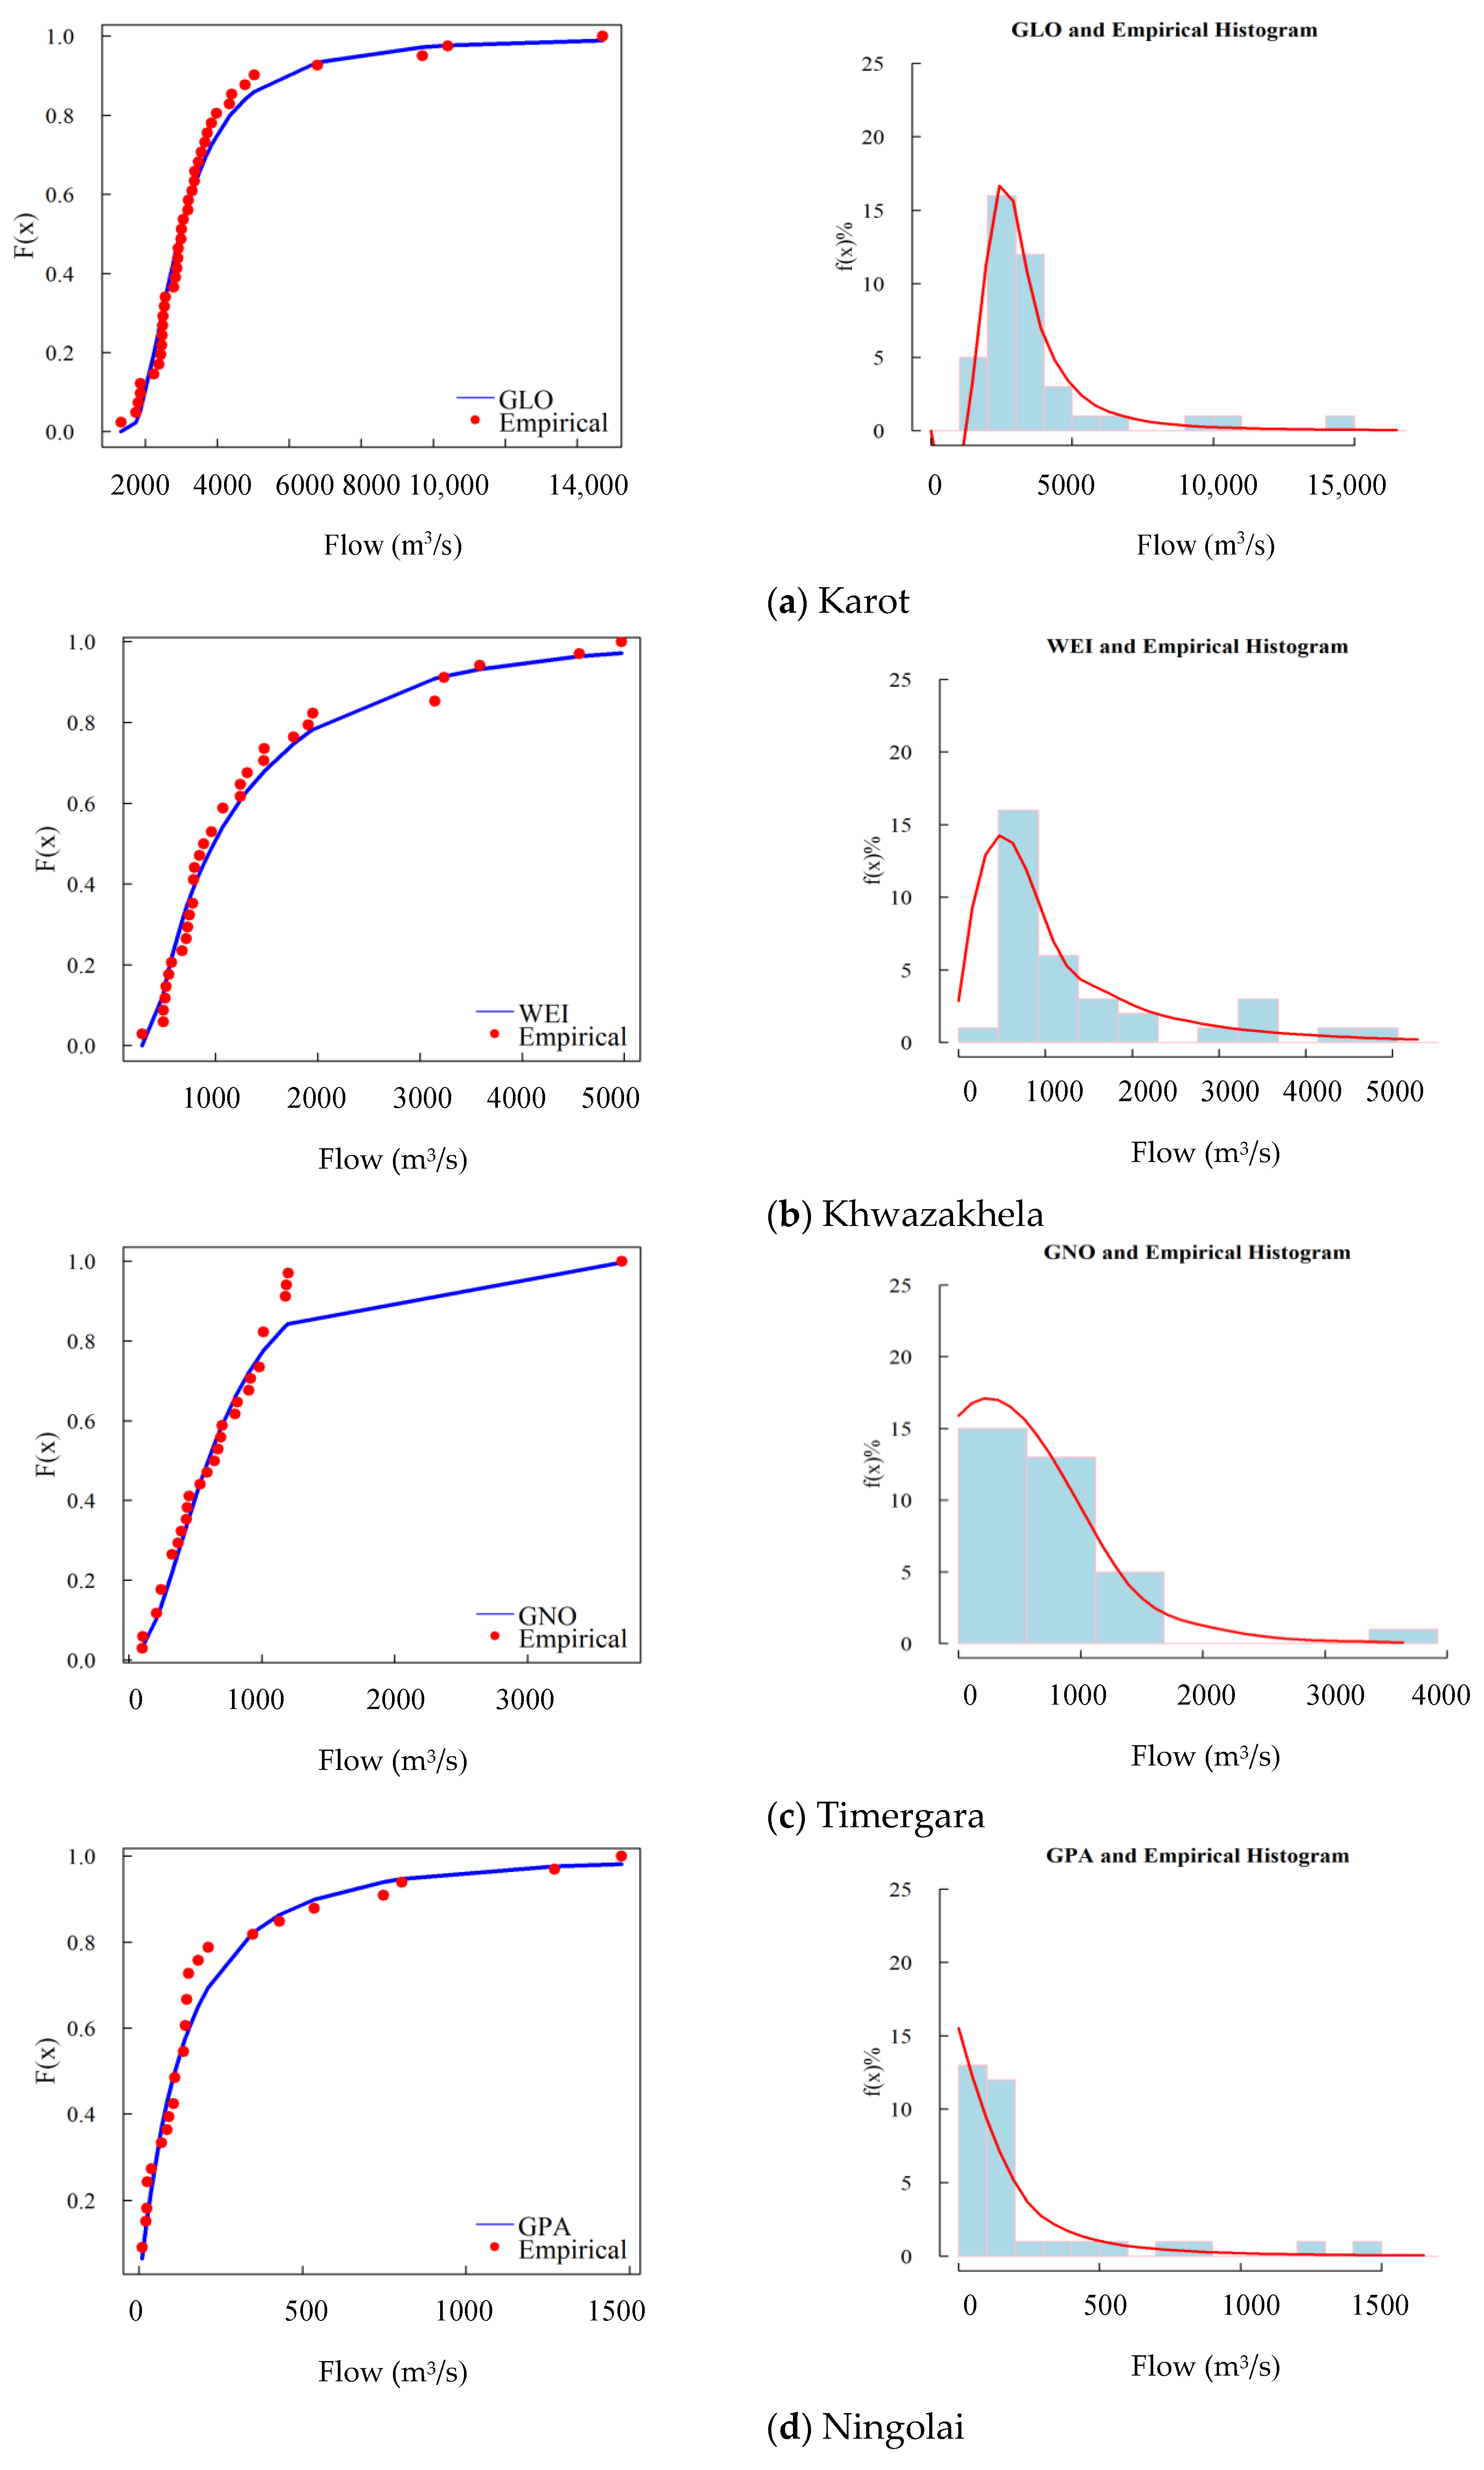
4.1. The Goodness-of-Fit and Selection of PDs
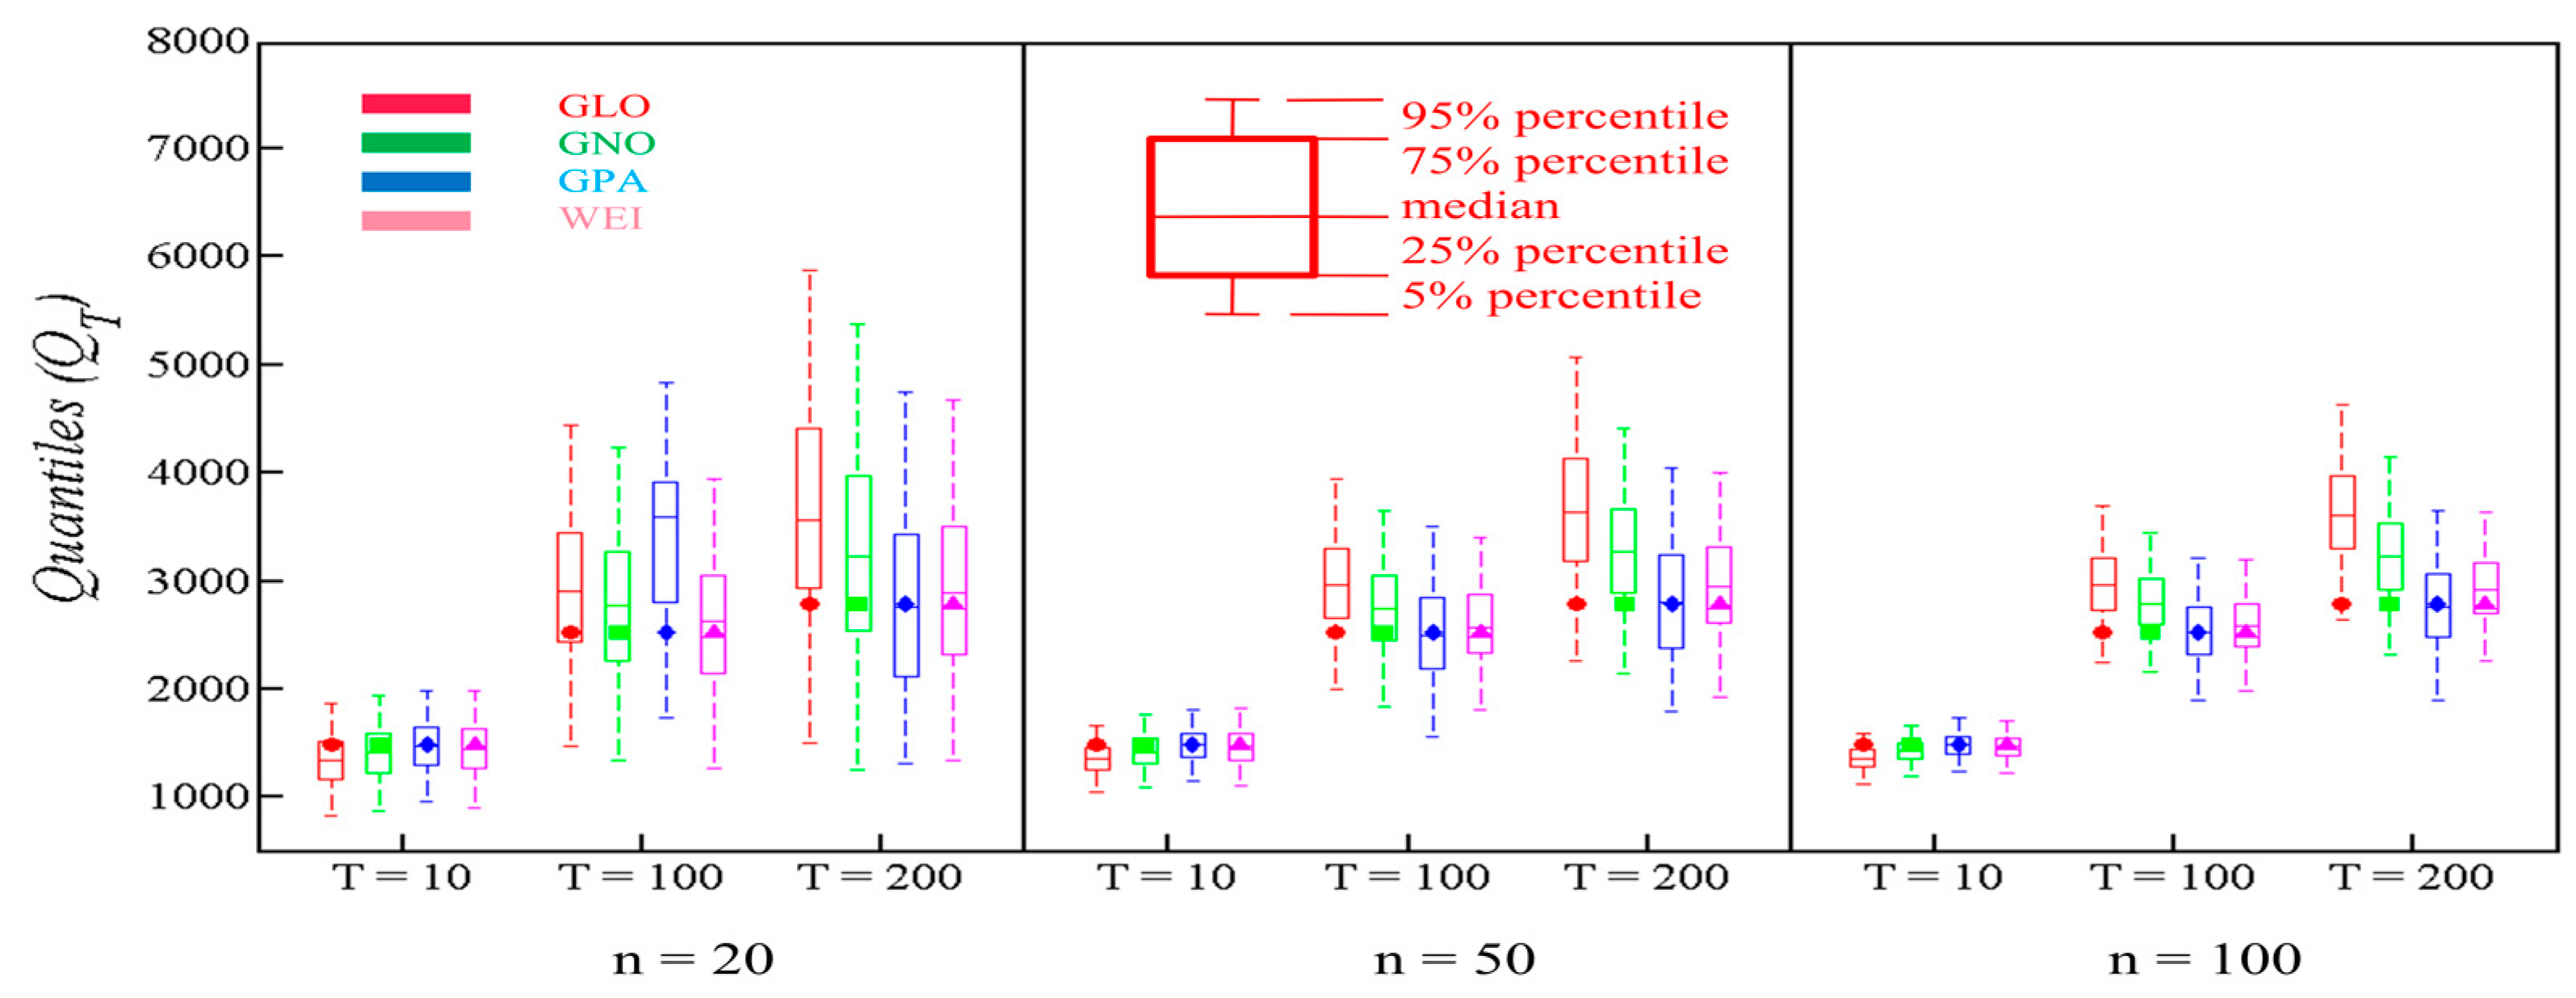
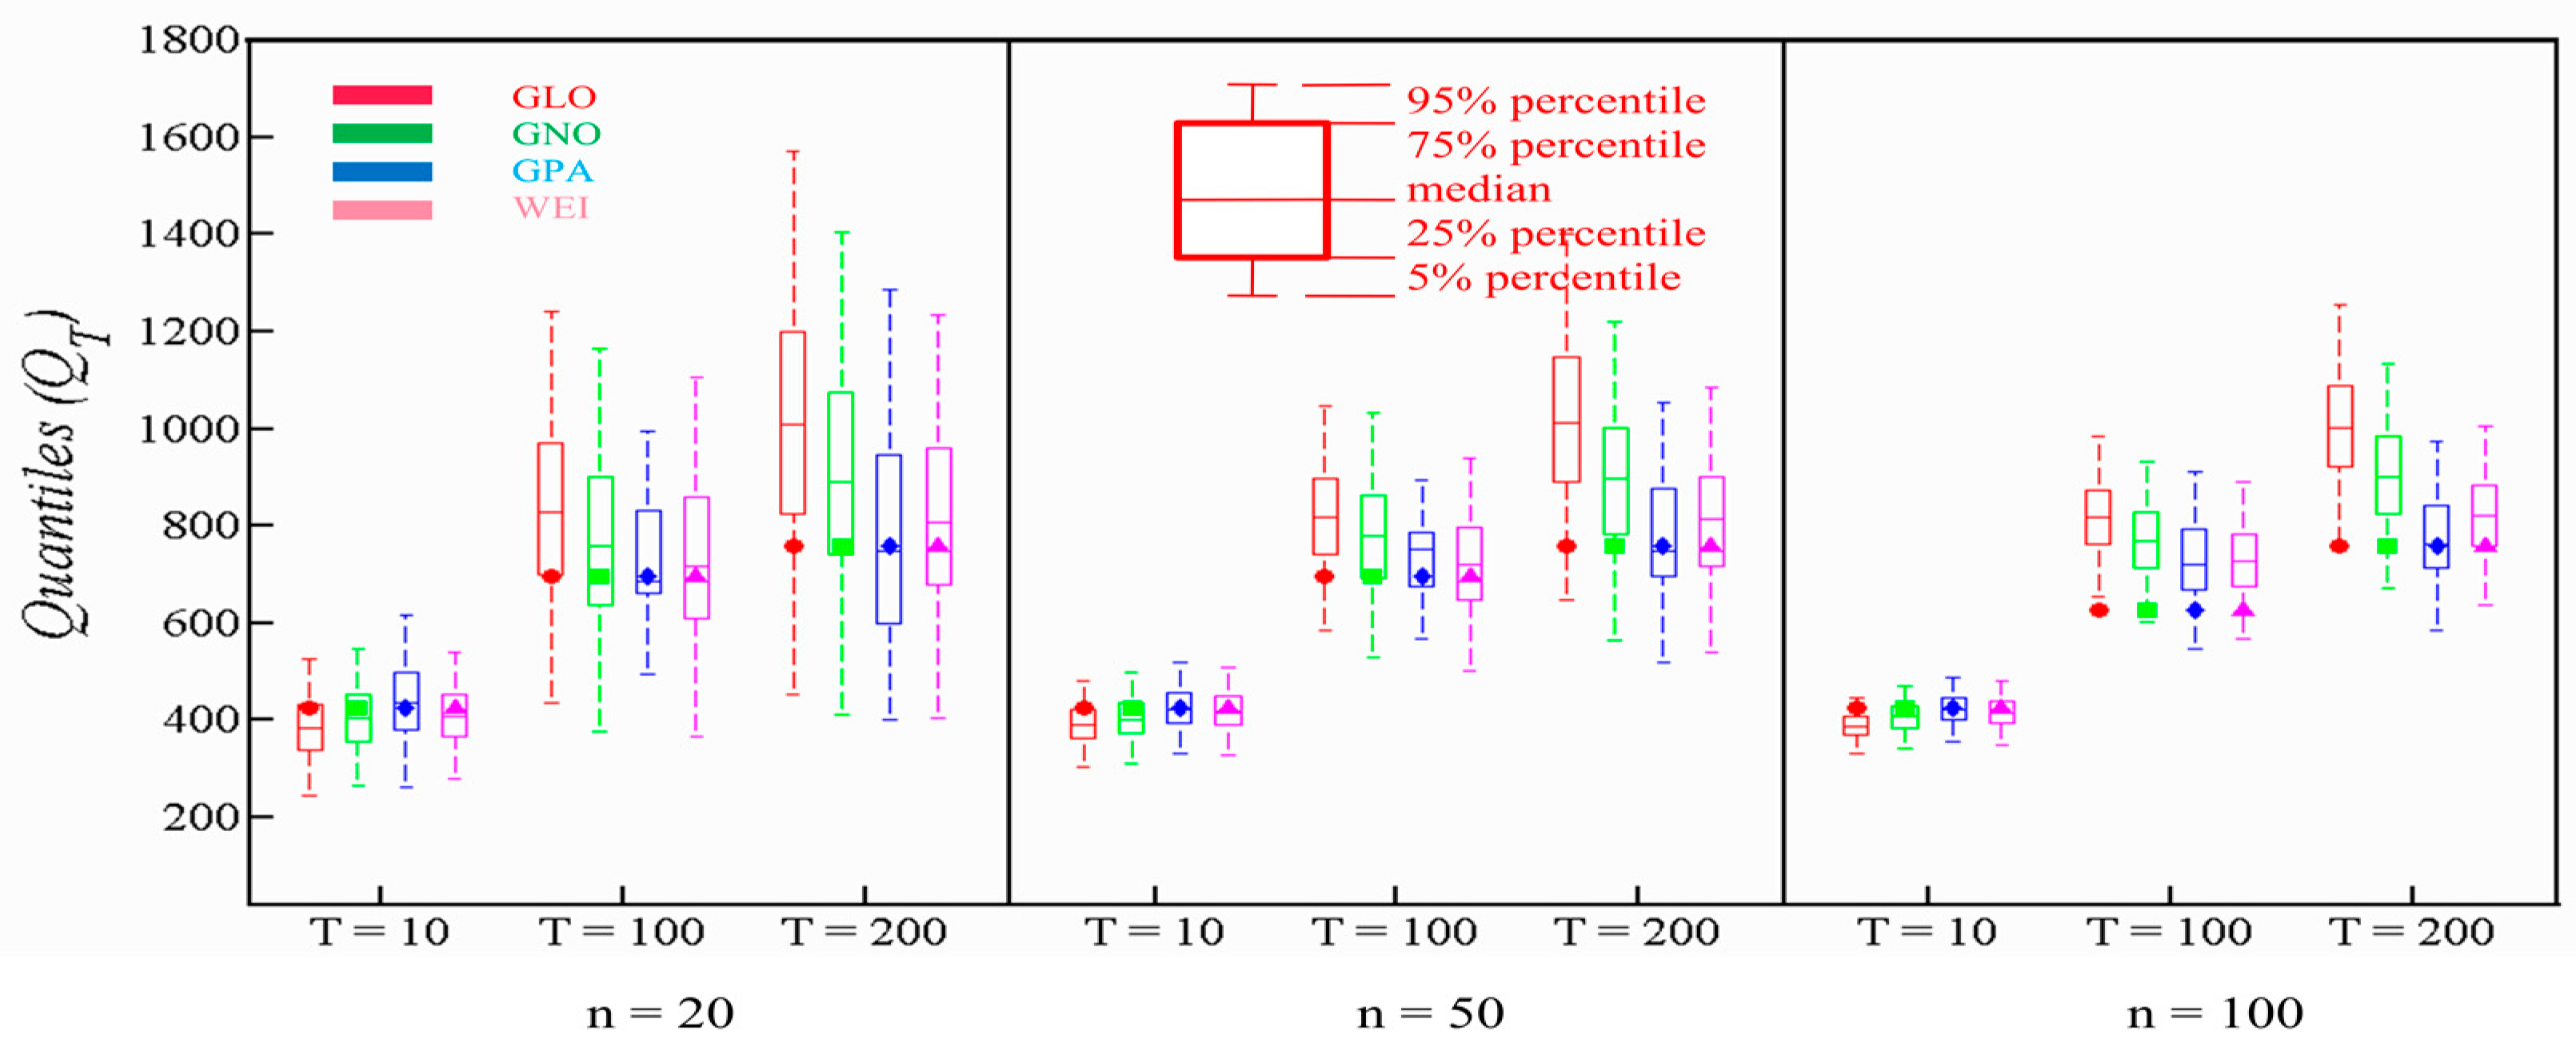
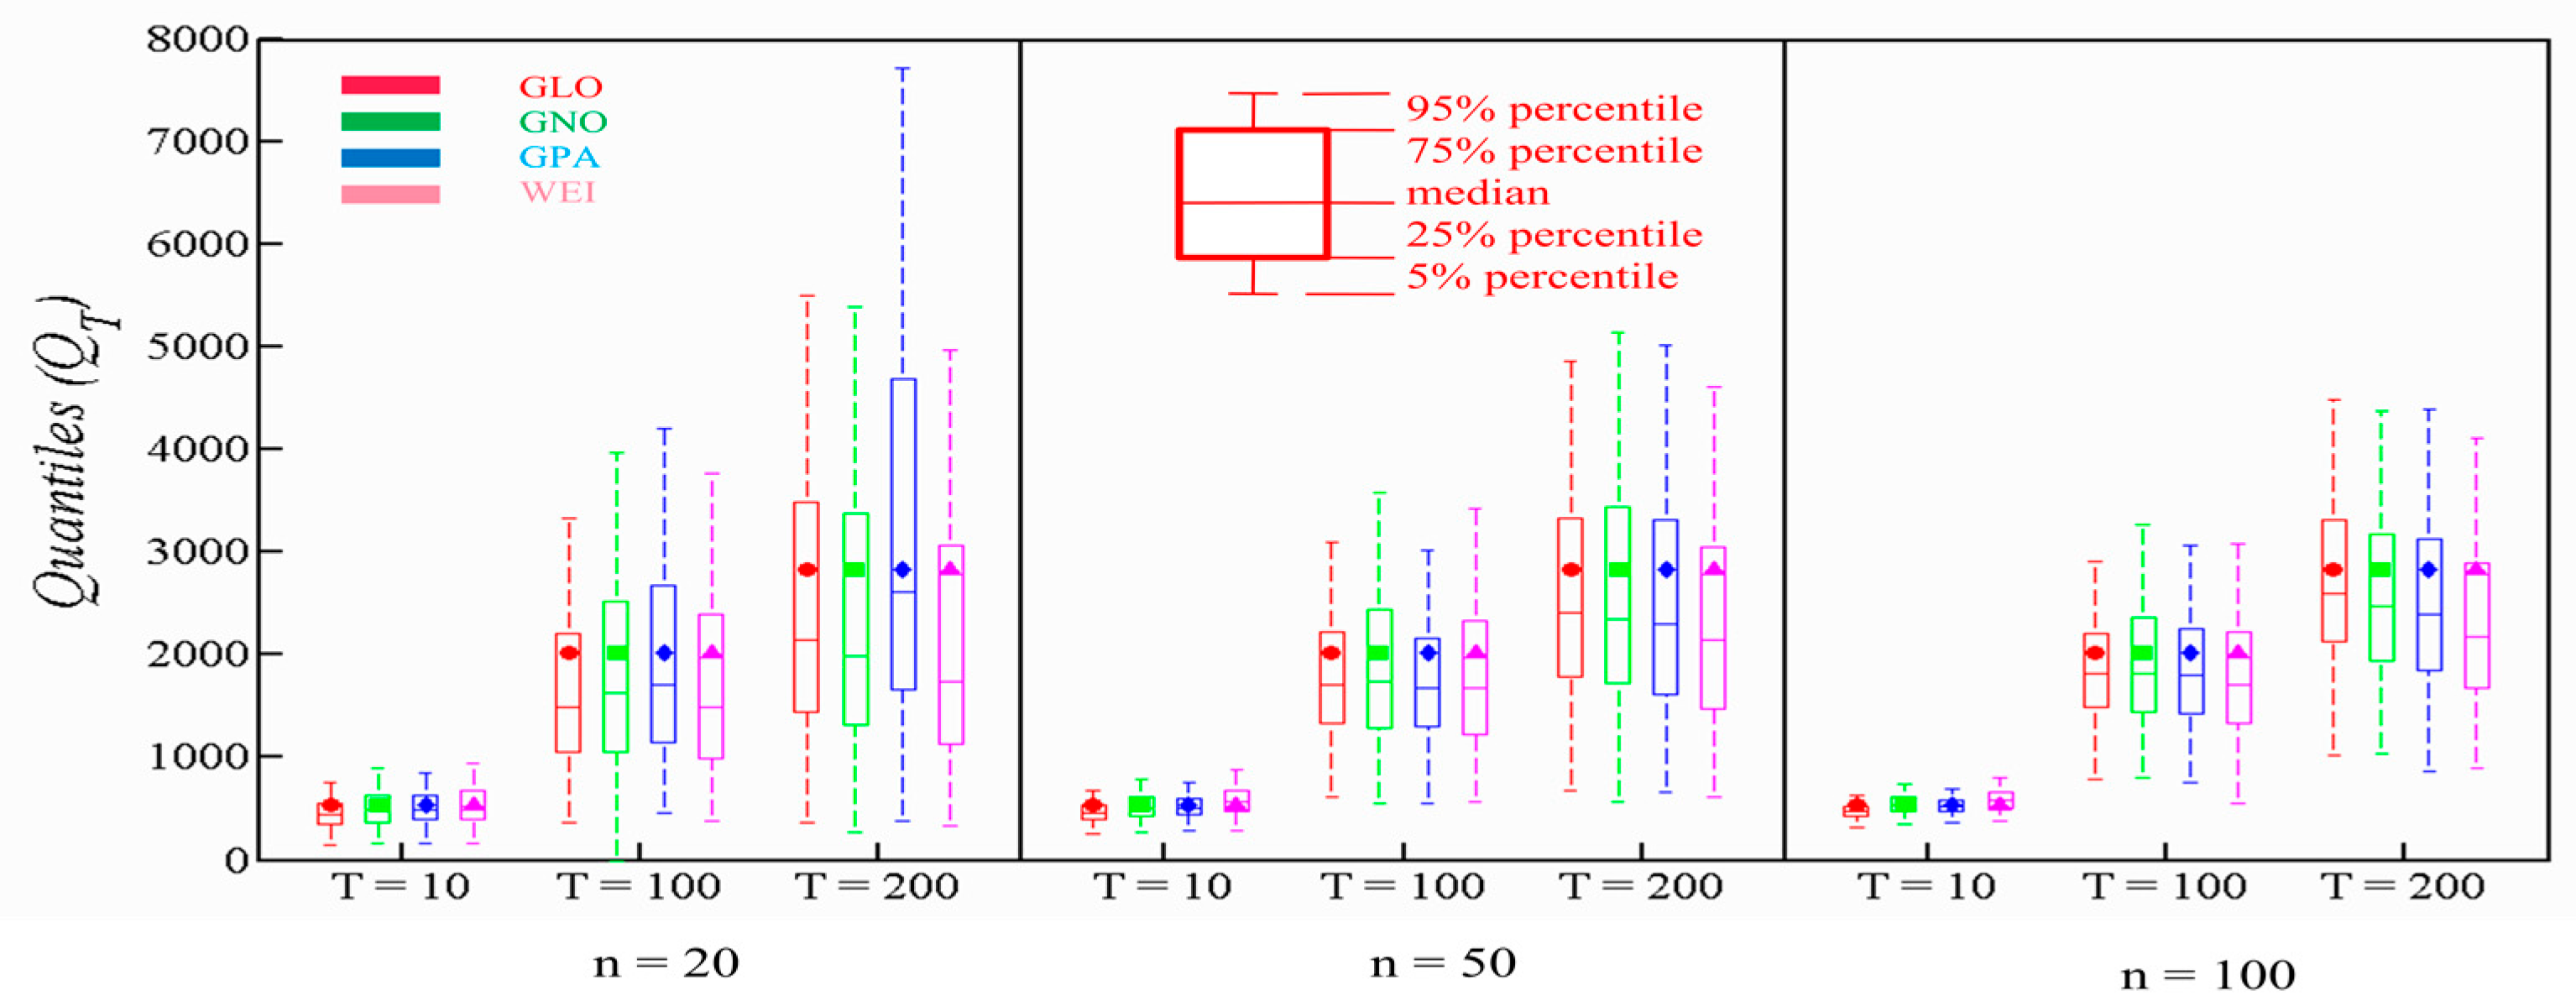
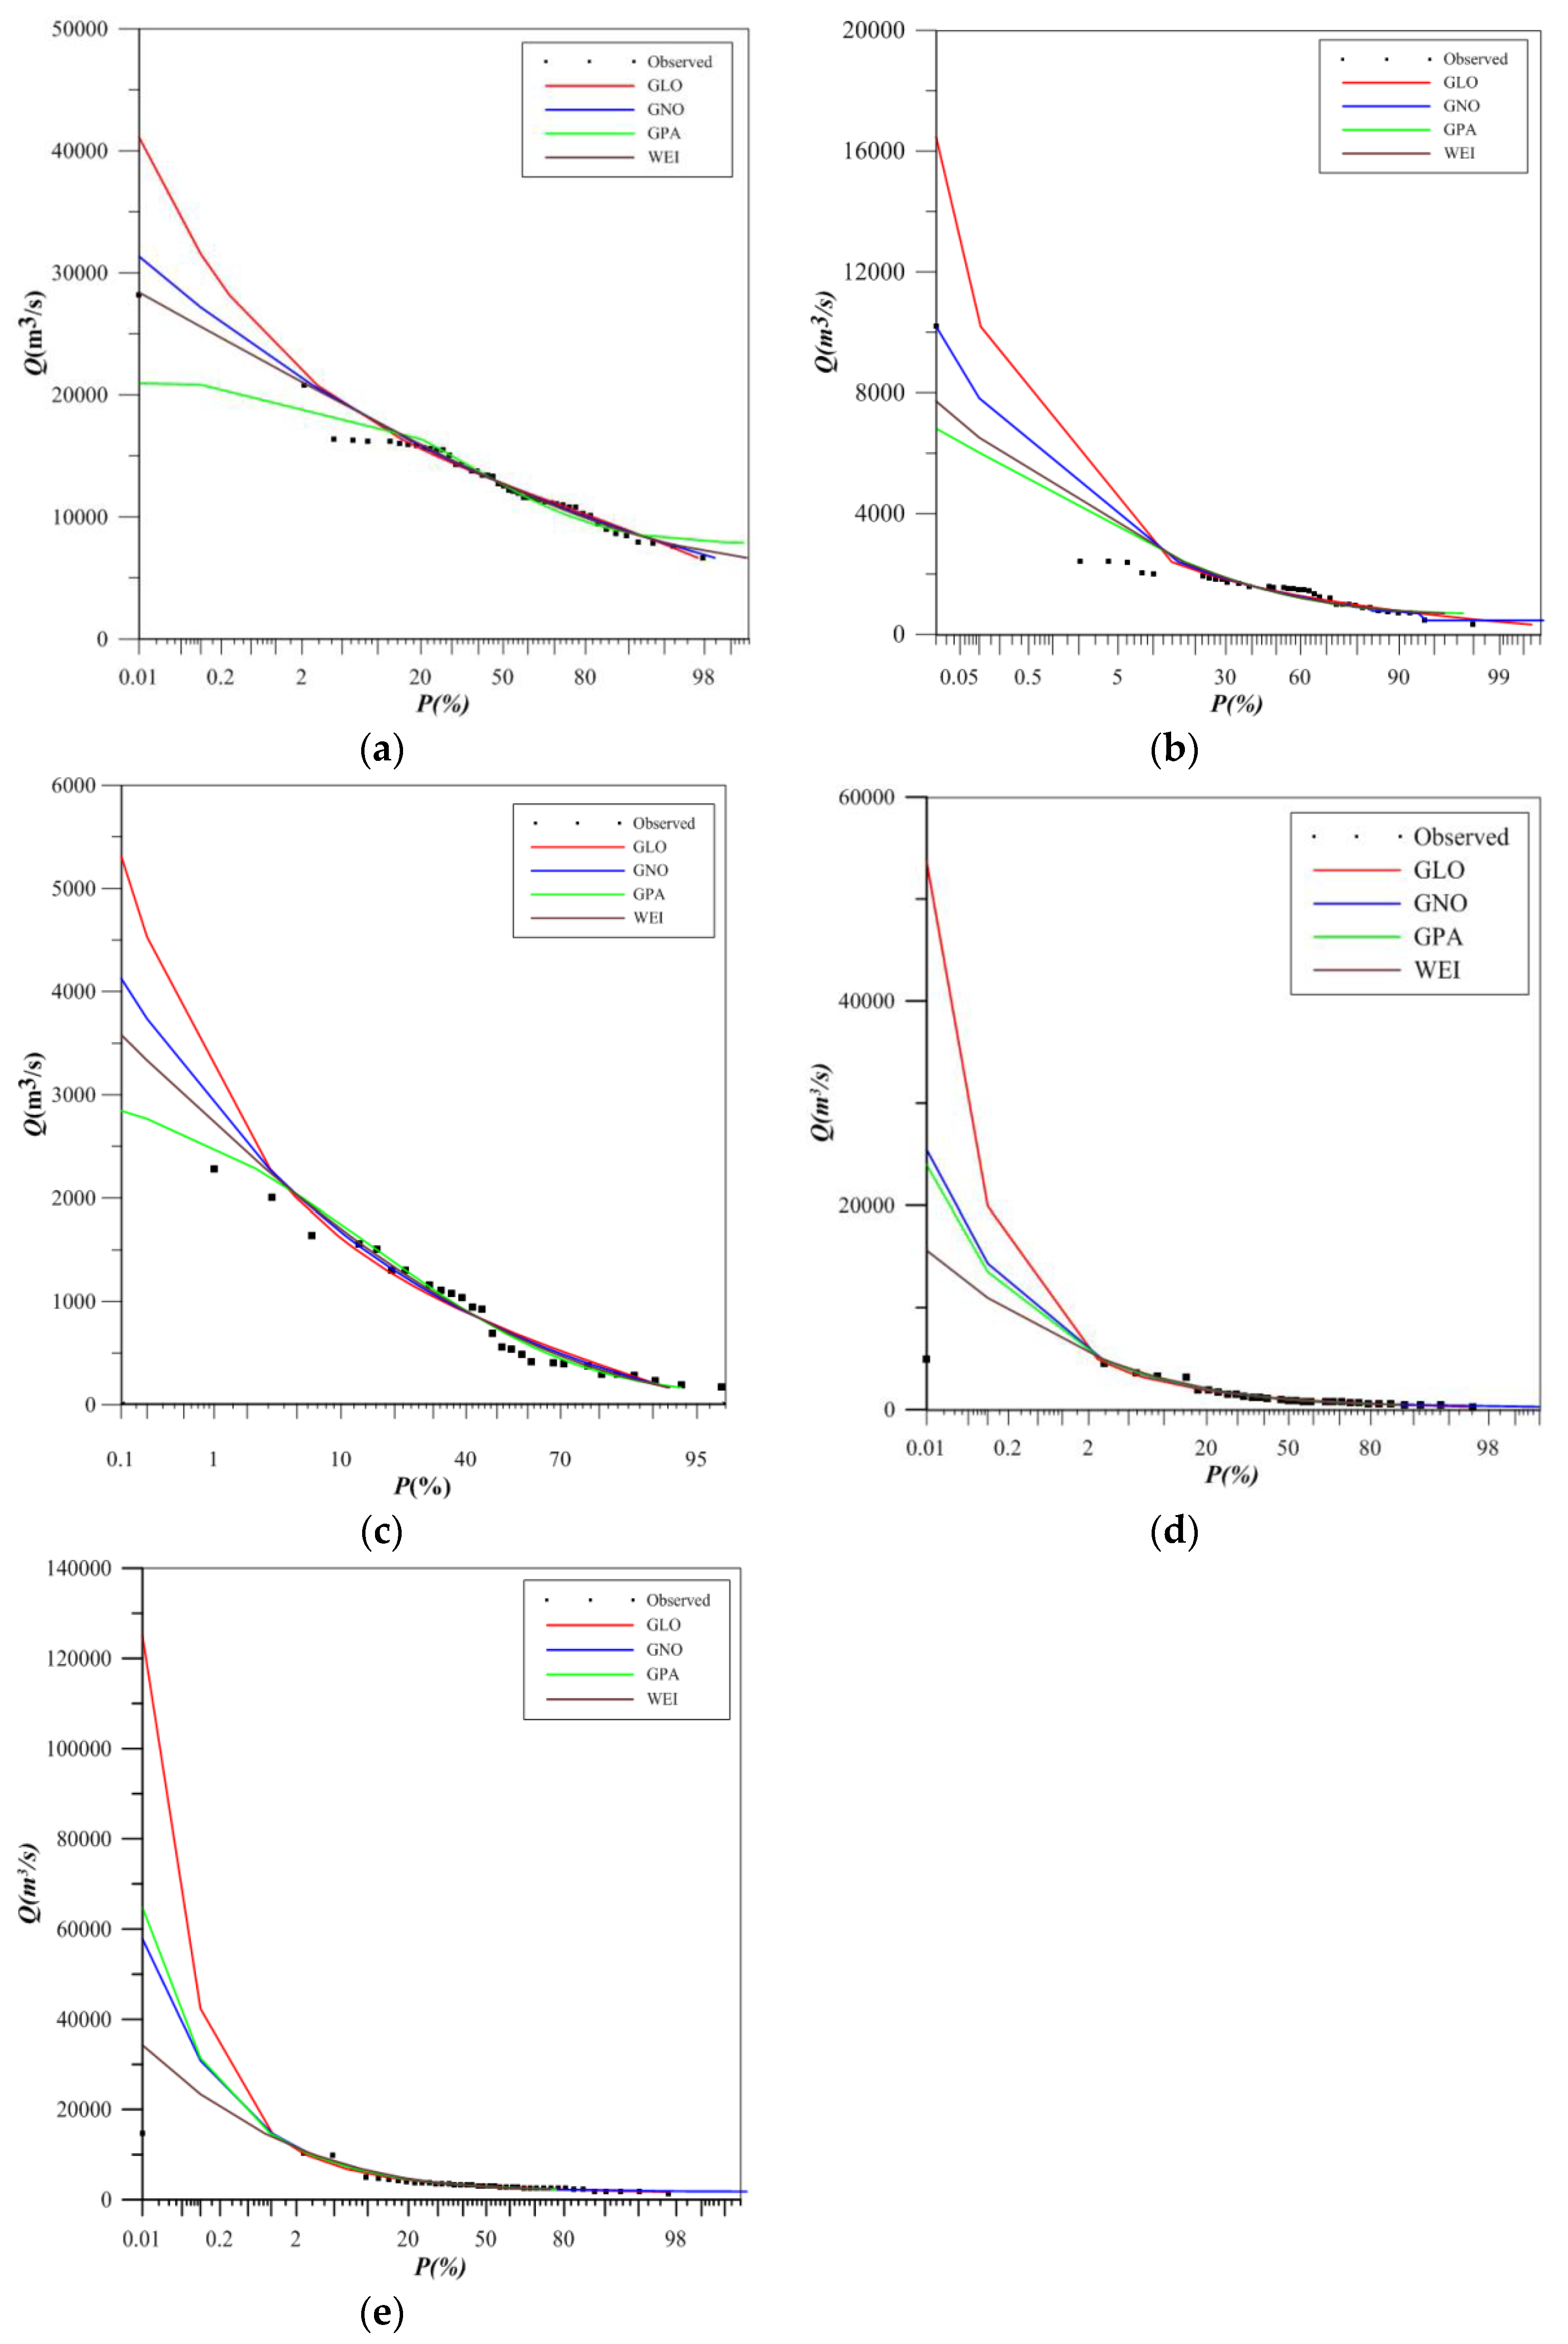
4.2. Performance at Right-Tail of PDs
4.3. Comparison of Flood Quantiles
5. Discussions
6. Conclusions
Author Contributions
Funding
Acknowledgments
Conflicts of Interest
References
- Chérif, R.; Bargaoui, Z. Regionalization of maximum annual runoff using hierarchical and trellis methods with topographic information. Water Resour. Manag. 2013, 27, 2947–2963. [Google Scholar] [CrossRef]
- Yin, J.; Gentine, P.; Zhou, S.; Sullivan, C.S.; Wang, R.; Zhang, Y.; Guo, S. Large increase in global storm runoff extremes driven by climate and anthropogenic changes. Nat. Commun. 2018, 9, 4389. [Google Scholar] [CrossRef] [PubMed]
- Hirabayashi, Y.; Mahendran, R.; Koirala, S.; Konoshima, L.; Yamazaki, D.; Watanabe, S.; Kanae, S. Global flood risk under climate change. Nat. Clim. Chang. 2013, 3, 816–821. [Google Scholar] [CrossRef]
- Selenica, A.; Kuriqi, A.; Ardicioglu, M. Risk Assessment from Flooding in the Rivers of Albania. In Proceedings of the International Balkans Conference on Challenges of Civil Engineering, Tirana, Albania, 15 July 2013. [Google Scholar]
- Kuriqi, A.; Ardiçlioǧlu, M. Investigation of hydraulic regime at middle part of the Loire River in context of floods and low flow events. Pollack Period. 2018, 13, 145–156. [Google Scholar] [CrossRef]
- Chow, V.T.; Midment, D.R.; Mays, L.W. Applied Hydrology; Tata McGraw-Hill Education: New York, NY, USA, 1988. [Google Scholar]
- Xiong, F.; Guo, S.; Chen, L.; Yin, J.; Liu, P. Flood frequency analysis using halphen distribution and maximum entropy. J. Hydrol. Eng. 2018, 23. [Google Scholar] [CrossRef]
- Shiau, J.T. Fitting drought duration and severity with two-dimensional copulas. Water Resour. Manag. 2006, 20, 795–815. [Google Scholar] [CrossRef]
- Vivekanandan, N. Flood frequency analysis using method of moments and L-moments of probability distributions. Cog. Eng. 2015, 2. [Google Scholar] [CrossRef]
- Shao, Q.; Wong, H.; Xia, J.; Ip, W.C. Models for extremes using the extended three-parameter Burr XII system with application to flood frequency analysis/Modèlesd’extrêmesutilisant le système Burr XII étendu à troisparamètres et application à l’analysefréquentielle des crues. Hydrol. Sci. J. 2004, 49, 702. [Google Scholar] [CrossRef]
- Ji, X.W.; Jing, D.; Shen, H.W.; Salas, J.D. Plotting positions for Pearson type-III distribution. J. Hydrol. 1984, 74, 1–29. [Google Scholar]
- Chen, L.; Guo, S.; Yan, B.; Liu, P.; Fang, B. A new seasonal design flood method based on bivariate joint distribution of flood magnitude and date of occurrence. Hydrol. Sci. J. 2010, 55, 1264–1280. [Google Scholar] [CrossRef] [Green Version]
- Chen, L.; Singh, V.P.; Guo, S.; Hao, Z.; Li, T. Flood coincidence risk analysis using multivariate copula functions. J. Hydrol. Eng. 2011, 17, 742–755. [Google Scholar] [CrossRef]
- Stedinger, J.R.; Griffis, V.W. Flood frequency analysis in the United States: Time to update. J. Hydrol. Eng. 2008, 13. [Google Scholar] [CrossRef]
- Kjeldsen, T.; Szolgay, J.; Lang, M.; Castellarin, A.; Blazkova, S.; Madsen, H. European Procedures for Flood Frequency Estimation (Flood Freq, COST Action ES0901); European Geophysical Union: Munich, Germany, 2011. [Google Scholar]
- Salinas, J.L.; Castellarin, A.; Viglione, A.; Kohnova, S.; Kjeldsen, T. Regional parent flood frequency distributions in Europe—Part 1: Is the GEV model suitable as a Pan-European parent? Hydrol. Earth Syst. Sci. 2014, 18, 4381–4389. [Google Scholar] [CrossRef] [Green Version]
- Perreault, L.; Bobée, B.; Rasmussen, P. Halphen distribution system. I: Mathematical and statistical properties. J. Hydrol. Eng. 1999, 4, 189–199. [Google Scholar] [CrossRef]
- Chen, X.; Shao, Q.; Xu, C.Y.; Zhang, J.; Zhang, L.; Ye, C. Comparative study on the selection criteria for fitting flood frequency distribution models with emphasis on upper-tail behavior. Water 2017, 9, 320. [Google Scholar] [CrossRef]
- Yin, J.; Guo, S.; Liu, Z.; Chen, K.; Chang, F.J.; Xiong, F. Bivariate seasonal design flood estimation based on copulas. J. Hydrol. Eng. 2017, 22, 05017028. [Google Scholar] [CrossRef]
- Haktanir, T.; Horlacher, H.B. Evaluation of various distributions for flood frequency analysis. Hydrol. Sci. J. 1993, 38, 15–32. [Google Scholar] [CrossRef] [Green Version]
- Karim, M.A.; Chowdhury, J.U. A comparison of four distributions used in flood frequency analysis in Bangladesh. Hydrol. Sci. J. 1995, 40, 55–66. [Google Scholar] [CrossRef] [Green Version]
- Kumar, R.; Chatterjee, C.; Kumar, S.; Lohani, A.; Singh, R. Development of regional flood frequency relationships using L-moments for Middle Ganga Plains Subzone 1 (f) of India. Water Resour. Manag. 2003, 17, 243–257. [Google Scholar] [CrossRef]
- Yue, S.; Wang, C.Y. Possible regional probability distribution type of Canadian annual streamflow by L-moments. Water Resour. Manag. 2004, 18, 425–438. [Google Scholar] [CrossRef]
- Saf, B. Regional flood frequency analysis using L-moments for the West Mediterranean region of Turkey. Water Resour. Manag. 2009, 23, 531–551. [Google Scholar] [CrossRef]
- Haberlandt, U.; Radtke, I. Hydrological model calibration for derived flood frequency analysis using stochastic rainfall and probability distributions of peak flows. Hydrol. Earth Syst. Sci. 2014, 18, 353–365. [Google Scholar] [CrossRef] [Green Version]
- Malekinezhad, H.; Nachtnebel, H.; Klik, A. Regionalization approach for extreme flood analysis using L-moments. J. Agric. Sci. Technol. 2011, 13, 1183–1196. [Google Scholar]
- Hosking, J.; Wallis, J. The value of historical data in flood frequency analysis. Water Resour. Res. 1986, 22, 1606–1612. [Google Scholar] [CrossRef]
- Hosking, J.; Wallis, J. Paleoflood hydrology and flood frequency analysis. Water Resour. Res. 1986, 22, 543–550. [Google Scholar] [CrossRef]
- House, P.K.; Baker, V.R. Paleohydrology of flash floods in small desert watersheds in western Arizona. Water Resour. Res. 2001, 37, 1825–1839. [Google Scholar] [CrossRef] [Green Version]
- Luo, P.; He, B.; Takara, K.; Nover, D.; Kobayashi, K.; Yamashiki, Y. Paleo-hydrology and Paleo-flow Reconstruction in the Yodo River Basin. Disaster Prev. Res. Inst. Kyoto Univ. 2011, 54, 119–128. [Google Scholar]
- Rojas, O.; Mardones, M.; Rojas, C.; Martinez, C.; Flores, L. Urban growth and flood disasters in the coastal river basin of south-central Chile (1943–2011). Sustainability 2017, 9, 195. [Google Scholar] [CrossRef]
- Wang, Y.; Liu, R.; Guo, L.; Tian, J.; Zhang, X.; Ding, L.; Shang, Y. Forecasting and providing warnings of flash floods for ungauged mountainous areas based on a distributed hydrological model. Water 2017, 9, 776. [Google Scholar] [CrossRef]
- Zhang, L.; Singh, V.P. Bivariate rainfall frequency distributions using Archimedean copulas. J. Hydrol. 2007, 332, 93–109. [Google Scholar] [CrossRef]
- Hosking, J.R. L-moments: Analysis and estimation of distributions using linear combinations of order statistics. J. R. Stat. Soc. Ser. B Methodol. 1990, 52, 105–124. [Google Scholar]
- Di Baldassarre, G.; Laio, F.; Montanari, A. Design flood estimation using model selection criteria. Phys. Chem. Earth Parts A/B/C 2009, 34, 606–611. [Google Scholar] [CrossRef]
- Haddad, K.; Rahman, A.; Stedinger, J.R. Regional flood frequency analysis using Bayesian generalized least squares: A comparison between quantile and parameter regression techniques. Hydrol. Proc. 2012, 26, 1008–1021. [Google Scholar] [CrossRef]
- Chen, L.; Zhang, Y.; Zhou, J.; Singh, V.P.; Guo, S.; Zhang, J. Real-time error correction method combined with combination flood forecasting technique for improving the accuracy of flood forecasting. J. Hydrol. 2015, 521, 157–169. [Google Scholar] [CrossRef]
- Guo, S. A discussion on unbiased plotting positions for the general extreme value distribution. J. Hydrol. 1990, 121, 33–44. [Google Scholar] [CrossRef]
- Houghton, J.C. Birth of a parent: The Wakeby distribution for modeling flood flows. Water Resour. Res. 1978, 14, 1105–1109. [Google Scholar] [CrossRef]
- Basu, B.; Srinivas, V. Formulation of a mathematical approach to regional frequency analysis. Water Resour. Res. 2013, 49, 6810–6833. [Google Scholar] [CrossRef] [Green Version]
- Yin, J.; Guo, S.; He, S.; Guo, J.; Hong, X.; Liu, Z. A copula-based analysis of projected climate changes to bivariate flood quantiles. J. Hydrol. 2018, 566, 23–42. [Google Scholar] [CrossRef]
- Hussain, Z.; Pasha, G. Regional flood frequency analysis of the seven sites of Punjab, Pakistan, using L-moments. Water Resour. Manag. 2009, 23, 1917–1933. [Google Scholar] [CrossRef]
- Batool, Z. Flood Frequency Analysis of Stream Flow in Pakistan Using L-moments and TL-moments. Int. J. Adv. Res. Ideas Innov. Technol. 2017, 3, 136–142. [Google Scholar]
- Zakaullah, U.; Saeed, M.; Ahmad, I. Flood frequency analysis of homogeneous regions of Jhelum River Basin. Int. J. Water Resour. Environ. Eng. 2012, 4, 144–149. [Google Scholar]
- Ahmad, I.; Fawad, M.; Mahmood, I. At-Site flood frequency analysis of annual maximum stream flows in Pakistan using robust estimation methods. Pol. J. Environ. Stud. 2015, 24. [Google Scholar] [CrossRef]
- Ahmad, I.; Abbas, A.; Aslam, M.; Ahmed, I. Total annual rainfall frequency analysis in Pakistan using methods of L-moments and TL-moment. Sci. Int. 2015, 27, 2331–2337. [Google Scholar]


| Gauging Station | Period | Mean (m3/s) | Cv | Cs | Ck |
|---|---|---|---|---|---|
| Attock | 1970–2017 | 13,028 | 0.29 | 1.33 | 4.73 |
| Jindi | 1969–2017 | 300 | 0.67 | 1.85 | 6.81 |
| Munda Headworks | 1962–2017 | 1748 | 0.73 | 4.81 | 31.33 |
| Khwazakhela | 1983–2016 | 1451 | 0.83 | 1.56 | 1.89 |
| Ningolai | 1984–2016 | 242 | 1.45 | 2.30 | 5.61 |
| Khiali | 1969–2017 | 1648 | 0.82 | 5.26 | 34.87 |
| Shah Alam | 1987–2017 | 207 | 0.71 | 0.86 | −0.13 |
| Naguman | 1987–2017 | 533 | 0.84 | 1.74 | 4.39 |
| Adezai | 1987–2017 | 868 | 0.67 | 0.65 | −0.44 |
| Timergara | 1984–2017 | 736 | 0.85 | 3.09 | 14.77 |
| Karot | 1969–2010 | 3725 | 0.67 | 2.82 | 9.59 |
| Number | Distribution | Probability Density Function | Parameters |
|---|---|---|---|
| 1 | EXP | ||
| 2 | GAM | Γ is the gamma function | |
| 3 | GEV | ||
| 4 | GLO | ||
| 5 | GNO | ||
| 6 | GPA | ||
| 7 | GUM | ||
| 8 | NOR | ||
| 9 | P3 | If , then let ,, and | |
| 10 | WEI |
| Gauging Stations | EXP | GUM | GPA | GNO | GLO | GEV | GAM | P3 | WEI | NOR |
|---|---|---|---|---|---|---|---|---|---|---|
| Attock | 0.032 | 0.015 | 0.048 | 0.015 | 0.015 | 0.031 | 0.016 | 0.015 | 0.032 | 0.038 |
| Jindi | 0.046 | 0.004 | 0.034 | 0.010 | 0.009 | 0.014 | 0.024 | 0.032 | 0.016 | 0.019 |
| Munda Headworks | 0.038 | 0.085 | 0.038 | 0.027 | 0.022 | 0.025 | 0.965 | 0.049 | 0.051 | 0.989 |
| Khwazakhela | 0.014 | 0.051 | 0.002 | 0.002 | 0.014 | 0.014 | 0.014 | 0.002 | 0.001 | 0.061 |
| Ningolai | 0.071 | 0.049 | 0.035 | 0.035 | 0.035 | 0.035 | 0.035 | 0.070 | 0.015 | 0.075 |
| Khiali | 0.072 | 0.072 | 0.041 | 0.045 | 0.042 | 0.049 | 0.045 | 0.045 | 0.046 | 0.037 |
| Shah Alamriver | 0.018 | 0.073 | 0.018 | 0.039 | 0.071 | 0.050 | 0.018 | 0.018 | 0.018 | 0.054 |
| Naguman | 0.002 | 0.018 | 0.002 | 0.002 | 0.002 | 0.002 | 0.002 | 0.002 | 0.002 | 0.051 |
| Adezai | 0.080 | 0.039 | 0.018 | 0.018 | 0.039 | 0.039 | 0.018 | 0.018 | 0.018 | 0.052 |
| Timergara | 0.013 | 0.014 | 0.053 | 0.014 | 0.014 | 0.019 | 0.016 | 0.016 | 0.014 | 0.061 |
| Karot | 0.029 | 0.051 | 0.029 | 0.007 | 0.0009 | 0.0009 | 0.050 | 0.050 | 0.041 | 0.082 |
| Distributions | Criteria | Attock | Jindi | Adezai | Naguman | Timergara | Khiali | Khwazakhela | Munda | Ningolai | Shah Alam | Karot |
|---|---|---|---|---|---|---|---|---|---|---|---|---|
| NOR | RMSE | 0.0457 | 0.0566 | 0.0823 | 0.0989 | 0.0854 | 0.1187 | 0.1385 | 0.1177 | 0.179 | 0.986 | 0.1471 |
| AIC | −290.16 | −275.33 | −148.77 | −137.43 | −161.29 | −202.77 | −128.39 | −223.58 | −107.52 | 137.61 | −161.13 | |
| WEI | RMSE | 0.0404 | 0.0404 | 0.0601 | 0.0319 | 0.0494 | 0.092 | 0.0393 | 0.0671 | 0.0732 | 0.056 | 0.0755 |
| AIC | −301.98 | −308.33 | −168.28 | −207.58 | −198.4 | −227.73 | −214 | −296.47 | −166.47 | −172.7 | −201.55 | |
| P3 | RMSE | 0.0385 | 0.0394 | 0.0644 | 0.0318 | 0.0486 | 0.0909 | 0.0407 | 0.068 | 0.1045 | 0.0584 | 0.0893 |
| AIC | −306.65 | −310.77 | −163.97 | −207.7 | −199.51 | −228.98 | −211.55 | −294.99 | −143.01 | −170.1 | −192.08 | |
| GAM | RMSE | 0.0385 | 0.0422 | 0.062 | 0.0357 | 0.0487 | 0.0921 | 0.0792 | 0.082 | 0.0741 | 0.0606 | 0.1053 |
| AIC | −306.48 | −304.15 | −166.3 | −200.46 | −199.49 | −227.65 | −166.38 | −274.04 | −165.69 | −167.76 | −178.55 | |
| GEV | RMSE | 0.0387 | 0.0392 | 0.0712 | 0.0301 | 0.0477 | 0.0813 | 0.0489 | 0.0472 | 0.0587 | 0.0711 | 0.0446 |
| AIC | −306.18 | −311.37 | −157.74 | −211.13 | −200.81 | −239.85 | −199.15 | −335.73 | −181.03 | −157.87 | −248.84 | |
| GLO | RMSE | 0.0374 | 0.0393 | 0.0804 | 0.0337 | 0.0486 | 0.0759 | 0.0535 | 0.0424 | 0.0596 | 0.0801 | 0.0414 |
| AIC | −309.45 | −310.95 | −150.27 | −204.02 | −199.63 | −246.59 | −193.08 | −347.81 | −180.07 | −150.5 | −255.08 | |
| GNO | RMSE | 0.0382 | 0.039 | 0.0689 | 0.0281 | 0.0474 | 0.0848 | 0.0414 | 0.054 | 0.0572 | 0.0663 | 0.0603 |
| AIC | −307.44 | −311.77 | −159.79 | −215.33 | −201.24 | −235.72 | −210.45 | −320.7 | −182.75 | −162.18 | −224.25 | |
| GPA | RMSE | 0.0569 | 0.0486 | 0.0511 | 0.032 | 0.0514 | 0.0949 | 0.0408 | 0.0655 | 0.0566 | 0.0512 | 0.0655 |
| AIC | −269.03 | −290.11 | −178.26 | −207.37 | −195.22 | −224.73 | −211.39 | −299.16 | −183.42 | −178.26 | −217.39 | |
| GUM | RMSE | 0.0417 | 0.0391 | 0.0711 | 0.0597 | 0.0556 | 0.0888 | 0.1018 | 0.0783 | 0.1425 | 0.0772 | 0.1049 |
| AIC | −298.95 | −311.44 | −157.9 | −168.67 | −190.48 | −231.25 | −149.33 | −279.22 | −122.58 | −152.78 | −178.84 | |
| EXP | RMSE | 0.0786 | 0.066 | 0.064 | 0.0317 | 0.053 | 0.096 | 0.0638 | 0.67 | 0.104 | 0.0515 | 0.0779 |
| AIC | −238.13 | −260.41 | −163.87 | −207.96 | −193.66 | −223.64 | −181.12 | −296.73 | −143.07 | −177.89 | −203.25 |
| Parameter | ξ | α | β | ϒ | δ |
|---|---|---|---|---|---|
| Panjkora river | 130.97 | 677.34 | 0.12 | 0.00 | 0.00 |
| Khiali | 293.02 | 4122.62 | 2.87 | 52.32 | 0.82 |
| Shah Alamriver | 30.11 | 206.28 | 0.164 | 0.00 | 0.00 |
| Ningolai | 0.83 | 0.00 | 0.00 | 135.22 | 0.44 |
| Adezai | 97.43 | 1032.69 | 0.34 | 0.00 | 0.00 |
| Title | Sample Size | Return Period | GLO | GNO | GPA | WEI | ||||||||
|---|---|---|---|---|---|---|---|---|---|---|---|---|---|---|
| RB | ARB | RRMSE | RB | ARB | RRMSE | RB | ARB | RRMSE | RB | ARB | RRMSE | |||
| Panjkora | n = 20 | T = 100 | 18.24 | 27.07 | 35.31 | 11.75 | 24.30 | 31.43 | 33.38 | 36.73 | 42.78 | 4.46 | 21.05 | 26.52 |
| T = 200 | 33.69 | 40.16 | 52.11 | 18.36 | 31.63 | 41.03 | 3.90 | 28.14 | 36.20 | 7.17 | 25.08 | 32.30 | ||
| n = 50 | T = 100 | 17.76 | 20.98 | 25.82 | 9.57 | 16.10 | 20.55 | 1.18 | 14.93 | 18.84 | 3.61 | 13.23 | 17.03 | |
| T = 200 | 31.92 | 33.43 | 40.26 | 18.65 | 22.72 | 28.38 | 3.59 | 16.88 | 21.70 | 7.09 | 15.53 | 19.85 | ||
| n = 100 | T = 100 | 17.58 | 18.69 | 22.31 | 11.16 | 13.61 | 16.74 | 1.36 | 10.03 | 12.68 | 2.95 | 9.56 | 12.31 | |
| T = 200 | 30.72 | 31.03 | 35.18 | 16.79 | 18.58 | 23.18 | 0.43 | 12.37 | 15.47 | 5.69 | 10.92 | 14.08 | ||
| Adezai | n = 20 | T = 100 | 22.74 | 27.00 | 33.19 | 17.47 | 22.80 | 28.46 | 5.09 | 15.21 | 19.55 | 11.69 | 18.31 | 23.19 |
| T = 200 | 42.36 | 43.84 | 52.62 | 25.90 | 30.09 | 37.36 | 16.44 | 17.59 | 23.54 | 17.91 | 22.70 | 28.57 | ||
| n = 50 | T = 100 | 24.13 | 24.78 | 28.56 | 14.83 | 16.47 | 19.82 | 6.19 | 8.70 | 11.49 | 9.03 | 12.25 | 15.19 | |
| T = 200 | 39.41 | 39.59 | 44.00 | 24.22 | 25.02 | 29.22 | 9.63 | 10.76 | 13.28 | 15.16 | 16.81 | 20.74 | ||
| n = 100 | T = 100 | 22.67 | 22.72 | 24.76 | 14.89 | 15.25 | 17.44 | 0.47 | 7.53 | 9.33 | 9.03 | 10.43 | 12.54 | |
| T = 200 | 38.87 | 38.88 | 41.09 | 23.49 | 23.55 | 25.98 | 4.69 | 6.58 | 8.70 | 14.02 | 14.49 | 16.82 | ||
| Shah Alam | n = 20 | T = 100 | 21.21 | 27.75 | 35.79 | 12.13 | 23.50 | 30.79 | 7.55 | 16.54 | 23.97 | 6.29 | 20.94 | 26.77 |
| T = 200 | 35.70 | 40.98 | 52.12 | 21.77 | 30.43 | 40.00 | 6.09 | 26.19 | 34.67 | 9.85 | 22.94 | 30.35 | ||
| n = 50 | T = 100 | 18.41 | 20.67 | 25.47 | 12.23 | 17.14 | 21.39 | 6.43 | 11.99 | 15.54 | 4.30 | 12.63 | 15.94 | |
| T = 200 | 34.92 | 35.68 | 42.24 | 18.94 | 22.13 | 28.02 | 3.87 | 14.57 | 19.21 | 7.62 | 15.26 | 19.26 | ||
| n = 100 | T = 100 | 17.98 | 18.45 | 21.62 | 10.92 | 12.89 | 16.00 | 4.12 | 9.32 | 11.52 | 4.91 | 9.80 | 12.26 | |
| T = 200 | 32.74 | 32.87 | 36.43 | 19.28 | 20.38 | 24.31 | 2.62 | 9.81 | 12.86 | 8.00 | 11.40 | 14.10 | ||
| Ningolai | n = 20 | T = 100 | −8.75 | 44.99 | 58.65 | 3.37 | 53.79 | 84.19 | −1.14 | 42.05 | 55.51 | 5.13 | 60.97 | 117.79 |
| T = 200 | −2.94 | 51.54 | 70.27 | −1.16 | 58.74 | 97.14 | 14.45 | 55.43 | 77.57 | −8.95 | 60.81 | 92.93 | ||
| n = 50 | T = 100 | −7.46 | 30.21 | 37.94 | 1.41 | 40.17 | 62.79 | −7.45 | 32.66 | 43.03 | 0.83 | 43.18 | 79.70 | |
| T = 200 | −3.60 | 36.65 | 49.91 | 1.80 | 45.10 | 70.49 | −3.33 | 42.80 | 57.98 | −4.84 | 47.76 | 79.09 | ||
| n = 100 | T = 100 | −4.49 | 24.39 | 31.87 | −0.24 | 29.81 | 41.78 | −4.43 | 26.49 | 34.33 | −2.26 | 34.32 | 58.51 | |
| T = 200 | 1.18 | 28.16 | 39.73 | −0.17 | 35.33 | 61.11 | −5.77 | 32.47 | 43.63 | −9.64 | 37.68 | 63.03 | ||
| Location | Distribution | Return Period | ||||
|---|---|---|---|---|---|---|
| 20 | 50 | 80 | 100 | 200 | ||
| Attock | GLO | 19,284 | 21,813 | 23,177 | 23,843 | 25,995 |
| GNO | 19,322 | 21,324 | 22,298 | 22,750 | 24,122 | |
| GPA | 19,128 | 19,163 | 20,232 | 20,333 | 20,568 | |
| WEI | 19,284 | 21,042 | 21,858 | 22,229 | 23,322 | |
| Khiali | GLO | 3306 | 4337 | 4975 | 5308 | 6490 |
| GNO | 3402 | 4289 | 4776 | 5016 | 5794 | |
| GPA | 3447 | 4142 | 4475 | 4628 | 5081 | |
| WEI | 3431 | 4181 | 4558 | 4735 | 5280 | |
| Adezai | GLO | 1995 | 2570 | 2904 | 3073 | 3646 |
| GNO | 2028 | 2503 | 2748 | 2866 | 3235 | |
| GPA | 2037 | 2331 | 2425 | 2500 | 2633 | |
| WEI | 2031 | 2435 | 2630 | 2720 | 2991 | |
| Karot | GLO | 7567 | 11,071 | 13,545 | 14,926 | 20,287 |
| GNO | 8156 | 11,579 | 13,711 | 15,823 | 18,721 | |
| GPA | 8099 | 11,401 | 13,480 | 14,575 | 18,479 | |
| WEI | 8484 | 11,490 | 13,160 | 13,980 | 16,638 | |
| Khwazakhela | GLO | 3647 | 5462 | 6701 | 7381 | 9956 |
| GNO | 3915 | 5619 | 6645 | 7171 | 8979 | |
| GPA | 3934 | 5542 | 6491 | 6975 | 8627 | |
| WEI | 4050 | 5521 | 6314 | 6700 | 7928 | |
© 2018 by the authors. Licensee MDPI, Basel, Switzerland. This article is an open access article distributed under the terms and conditions of the Creative Commons Attribution (CC BY) license (http://creativecommons.org/licenses/by/4.0/).
Share and Cite
Rizwan, M.; Guo, S.; Xiong, F.; Yin, J. Evaluation of Various Probability Distributions for Deriving Design Flood Featuring Right-Tail Events in Pakistan. Water 2018, 10, 1603. https://doi.org/10.3390/w10111603
Rizwan M, Guo S, Xiong F, Yin J. Evaluation of Various Probability Distributions for Deriving Design Flood Featuring Right-Tail Events in Pakistan. Water. 2018; 10(11):1603. https://doi.org/10.3390/w10111603
Chicago/Turabian StyleRizwan, Muhammad, Shenglian Guo, Feng Xiong, and Jiabo Yin. 2018. "Evaluation of Various Probability Distributions for Deriving Design Flood Featuring Right-Tail Events in Pakistan" Water 10, no. 11: 1603. https://doi.org/10.3390/w10111603
APA StyleRizwan, M., Guo, S., Xiong, F., & Yin, J. (2018). Evaluation of Various Probability Distributions for Deriving Design Flood Featuring Right-Tail Events in Pakistan. Water, 10(11), 1603. https://doi.org/10.3390/w10111603