Article

Evaluation of Decentralized, Closely-Spaced Precipitation Water and Treated Wastewater Infiltration

1
Institute of Groundwater Management, Technische Universität Dresden, Bergstraße 66, 01069 Dresden, Germany
2
Department Monitoring and Exploration Technologies, Helmholtz-Centre for Environmental Research-UFZ, Permoserstraße 15, 04318 Leipzig, Germany
*
Author to whom correspondence should be addressed.
Water 2018, 10(10), 1460; https://doi.org/10.3390/w10101460
Submission received: 26 September 2018 / Revised: 11 October 2018 / Accepted: 13 October 2018 / Published: 16 October 2018
(This article belongs to the Section Wastewater Treatment and Reuse)

Abstract

:
Decentralized water management requires innovative technical solutions due to restricted operational and economic resources. In this study, a combined, decentralized infiltration system in the form of closely-spaced sub-systems for precipitation water and treated wastewater has been numerically analyzed. Flow and transport simulation shows that a closely-spaced system, by arranging the infiltration pipes closely in a longitudinal manner, is feasible under the consideration of German national guidelines for both infiltration methods. Precipitation events up to a recurrence interval of five years can be infiltrated alongside with treated wastewater of a one-family house without significant reduction of the wastewaters’ residence time. Scenario analyses highlight that harmless wastewater infiltration remains mainly undisturbed for a broad bandwidth of hydrological, subsurface, and technical conditions.

1. Introduction

Traditional and historically developed centralized water infrastructures in urban regions worldwide typically consist of a combination of storm water drainage and water distribution, as well as wastewater treatment and discharge systems that are designed for large water quantities (e.g., Reference [1]). However, changes in population density (especially population growth and rural depopulation), rising living standards, land development trends, and various impacts on site hydrology (e.g., effects induced by climate change, but also effects arising from urbanization such as soil sealing) can have a detrimental effect on the sustainability and economic efficiency of these centralized infrastructures (e.g., References [2,3,4]).
Alongside the aging of existing water infrastructure (e.g., References [5,6,7]), more sustainable systems for an adaptive and future-proof water resource management concept are required. Here, decentralized systems that are designed especially for storm water infiltration, as well as for wastewater on-site treatment, have become increasingly relevant for building owners and operators (e.g., Reference [8]). For example, between 20% and 25% of existing and one third of all newly built private resident buildings in the USA are equipped with decentralized systems [9,10]. Besides, various legal frameworks worldwide also address this trend towards decentralized systems (e.g., EU91/271/EEC [11], as well as corresponding national implementations). This is particularly true for residential areas without conventional full-scale sewer systems, where decentralized approaches may represent a sufficient alternative. Other application areas are regions with low population densities, regions in developing countries, and isolated settlements, i.e., regions where a full-scale centralized system is not economically and/or technically realizable (e.g., References [12,13,14]).
Mostly constructed in the early 20th century, storm water management infrastructure in most cities still relies on the collection of storm water runoff in combined or separated sewer networks (often alongside with water retention using rain water tanks and basins), followed by a discharge to appropriate receiving water bodies (e.g., References [15,16]). Nowadays, for new constructions, decentralized onside precipitation water infiltration to the subsurface is increasingly used as an alternative (e.g., Reference [17]), especially when receiving surface water bodies are far away. Common infiltration systems include rain gardens, infiltration ditches, trenches, shafts, and, in some cases, especially for clean water, recharge wells [18,19,20]. Such recharge systems may be applied to single houses or neighborhoods.
While conventional, mostly centralized wastewater treatment systems in urban areas are typically designed to convey water over large distances from various disposal sources towards a treatment plant (e.g., References [21,22]), the aim of decentralized systems is to clearly reduce this collection component to a minimum [23]. Here, treatment and, if appropriate, the disposal, is realized at the respective site or in the vicinity of the sources. This option is relevant not only for developing countries [24,25], but also for rising mega-cities, where costs for the extension or new construction of centralized sewer systems are almost beyond imagination [26]. Until now, decentralized disposal of treated wastewater originating from single houses or grouped infrastructures is realized by conveying the water preferably into rivers and streams, although such kinds of measures may not be ecologically, economically, or technically viable for all conditions (e.g., References [27,28,29,30]). As for storm water discharge, on-site infiltration of treated wastewater into the subsurface can be an alternative (see Reference [31]).
However, for the infiltration of such low-quality waters, aspects of subsurface purification and groundwater protection have to be taken into account. Various field and laboratory studies (e.g., References [32,33,34,35,36]) indicate that wastewater treatment based on soil infiltration can remove organic compounds, nitrogen, phosphorus, suspended solids, trace metals, bacteria, and viruses [37]. Biodegradation of organics was experimentally determined to occur within the first 15 cm to 30 cm of the soil being infiltrated [38,39]. Nitrification and denitrification processes were observed within the first 0.7 m and 1.5 m, respectively [31]. Water temperature and operation-specific hydraulic loading, keeping a balance in respect to biological active clogging zone genesis [38], seem to be the main contributors to removal efficiency [31,37].
To date, the aforementioned systems for precipitation water (e.g., rain) and treated sewage effluent infiltration have been used separately. However, it can be assumed that a combined usage may be advantageous for applications with limited available space, but may be also favorable for logistical and economic reasons.
This work intends to encourage the consideration, assessment, and appropriate use of closely-spaced, decentralized precipitation water, and treated wastewater infiltration systems, but also aims to highlight the capability of numerical methods to consider local hydrogeological characteristics possibly affecting those systems. The combined system being evaluated is exemplary, but it follows rules defined by German regulation guidelines (DWA-A 138, 2005; DIN 4261-1, 2010; DIN 4261-5, 2012) [40,41,42]. Please note that regulations in other countries may differ.
A first step was to delineate minimum requirements for such systems and to identify feasible technical solutions. Secondly, numerical simulations of infiltration processes have been realized for an exemplary system using the software code HYDRUS 2D/3D (Co. PC-Progress, Prague, Czech Republic) as well as PCSiWaPro® (developed by TU Dresden, Dresden, Germany and Co. Ingenieurbüro für Grundwasser GmbH, Leipzig, Germany). Together with a large set of potential field-scale scenarios affecting infiltration and wastewater retention times, the principal suitability of closely-spaced systems is illustrated.

2. Materials and Methods

2.1. Delineation of Operational Criteria

The closely-spaced infiltration of liquid precipitation (e.g., rain or snowmelt) and treated sewage effluent (TSE), i.e., treated wastewater via decentralized systems requires essential operational criteria that have to be considered:
I. TSE retention time must not be significantly reduced
Percolation through the unsaturated zone includes the potential of further improvement of TSE quality (see Introduction and references therein). To support the degradation processes during wastewater percolation, a relatively long retention time together with a sufficient oxygen supply is envisaged. The processes of TSE purification in the unsaturated zone have been investigated in the literature by, e.g., soil column experiments (see Section 2.2.2: Dimensioning of TSE Infiltration).
II. TSE infiltration must not be impeded
Heavy precipitation events have the potential to hydraulically influence TSE percolation within a combined or closely-spaced system. In this context, most critical would be backwater pressure affecting the technical treatment system. To ensure a system operation free of interference by backwater, technical design, and dimensioning of the infiltration system has to be adapted carefully.
III. Ability of the precipitation water infiltration to harmlessly infiltrate precipitation events up to statistical recurrence interval of 5 years
A block precipitation event with 5-year recurrence interval (i.e., 20% chance of occurrence within a year; German guideline [40]) shall not prevent harmless retention and infiltration. For a subsurface infiltration element, the precipitation water volume has to be stored within the system’s free pore volume [40].
The aforementioned restrictions have been considered throughout this study, which focuses on the numerical simulation of a continuous TSE infiltration together with a 5-year precipitation event. Water content changes as well as the migration behavior of a synthetic (conservative) TSE tracer have been observed at selected locations. Exemplarily, standard German guidelines were employed for the dimensioning of each infiltration ditch/trench (see next section).

2.2. Description of the Exemplary System and Parameter Definition for the Reference Case

Infiltration ditches or trenches are often equipped with infiltration pipes located in a gravel pack of comparably high conductivity (e.g., Reference [40]). Here, two general designs for a closely-spaced precipitation water and TSE infiltration system appear to be feasible: Pipes can be located in a longitudinal direction (Figure 1, upper design) or in a parallel layout (Figure 1, lower design). Hereby, locating the pipes in longitudinal direction is more preferable as hydraulic interaction between both infiltration ditches is reduced. Therefore, the focus of this study is on the longitudinal pipe location design. However, the specific design may depend on site-specific and technical parameters such as available land space or connection to the treatment and water collection structures.

2.2.1. Dimensioning of Precipitation Infiltration

To illustrate the dimensioning process, an average German one-family house with an approximate housing space of 150 m2 [43], a roof area of 100 m2 (assumption), and a surrounding area of 850 m2 [43] was chosen. Hereby, a sealing rate of approximately 25% was assumed for the latter, which leads to a total sealed area including the roof of approximately 315 m2. The precipitation water originating from this area has to be infiltrated by the infiltration system. A shallow depth to groundwater of 5 m below infiltration ditch bottom was assumed (8.7 m below surface elevation).
According to German guidelines [40], precipitation events of 5-year recurrence interval have been acquired by using KOSTRA-DWD data (Koordinierte Starkniederschlagsregionalisierung und -auswertung des Deutschen Wetterdienstes (coordinated heavy precipitation regionalization and evaluation by German Weather Forecast), [44]). This dataset is based on measured values of corrected precipitation for a period between 1951 and 2010 and is valid for the reference site “Schöneck im Vogtland”, Saxony, Germany. For this site, precipitation intensities of selected event durations are given (Table 1). After recalculation into values that represent intensities per ditch area, this data is used for delineating the influx boundary conditions for later modeling (see Section 2.3: Numerical Model).
The dimensioning of the precipitation infiltration ditch/trench is based on German guidelines [40]. Total retention space is assumed to be located below a slotted distribution pipe. The input parameters for dimensioning are listed in Table 2.
Based on the determined input data for the location of Schöneck i.V. (Table 1 and Table 2), a 5-year precipitation event yielded an event period length of 360 min and a rate of approximately 22.5 L·s−1 ha−1. The infiltration ditch width was calculated to be 2.02 m. Please note that, due to the numerical set-up in Section 2.3: Numerical Model, the calculation method for effective infiltration area [40] (DWA-A 138, 2005) had to be slightly adapted here. The guideline considers base area added by a quarter of the wall area of the longer sides of the infiltration ditch respectively to calculate the effective infiltration area. This flow component is however not considered in the two-dimensional set-up of this study, but rather the flow from the shorter sides (see Figure 2 for detailed conceptual model). Therefore, dimensioning based on Reference [40] was rotated by 90°.

2.2.2. Dimensioning of TSE Infiltration

Previous Works on TSE Infiltration Experiments

For dimensioning TSE infiltration ditches, it is necessary to understand relevant reactive transport processes occurring below the infiltration system, i.e., within the unsaturated soil zone. These processes are primarily influenced by the biochemical composition of TSE as well as the supply of pollutant degrading bacteria with water, nutrients, and oxygen that is mainly influenced by the soil matrix properties, the infiltration rate, and the employed infiltration cycle [47,48]. Besides this, Reference [49] observed that the transition to acidic conditions in soils might potentially negatively affect purification. With knowledge about these processes and the parameters influencing them, it should be possible to estimate the minimum vertical infiltration length in the unsaturated soil zone to ensure optimal conditions for biodegradation processes (sufficient oxygen availability combined with a sufficient, not too high soil moisture content, and sufficient supply with nutrients), resulting in an acceptable reduction of residual TSE contents.
The infiltration of TSE from decentralized treatment systems into the unsaturated zone had been investigated by Reference [50] using four approximately 1.5 m long, variably water-saturated columns filled with sandy soils. The infiltration rate and its temporal scheme in Reference [50] was set-up according to DIN EN 12556-3 [51]. Chemical analysis of pore water samples taken in these works indicate that under the conditions studied here (time-variable flow rates and sediment characteristics lead to determined average residence times from 2.4 days to 3.7 days), the infiltrated COD (Chemical Oxygen Demand) values decreased to at least 50% on the way through the columns. The degradation took place over the entire column length. Almost 100% degradation for the infiltrated NH4-N was detected in all four columns [50]. Due to the reduction of ammonium in the course of nitrification processes, an increase in nitrate concentrations in the effluent was observed. Lastly, denitrification was hardly noticed in Reference [50], as oxygen was sufficiently available in the soil. Based on these results, a minimum vertical infiltration zone of 1.5 m appears to be sufficient for considerable biodegradation of the previously mentioned residual TSE contents.
Based on References [41,42], the required wall area for TSE infiltration ditches depends on population equivalents (PE) per household. Here, a sewage equivalent of 150 L·PE−1·day−1 and a minimum infiltration area of 1 m2·PE−1 was assumed. However, previous results [49], as well as DIN 12556-2 [52], indicate a strong relationship between the required infiltration area of a system of arbitrary design and the water-saturated hydraulic conductivity of the native subsurface material. Besides this, keeping TSE infiltration dimensioning unaffected from native sediment type may lead to high water contents and, therefore, may also affect retention times [53] and purification potential as well (among others, by oxygen availability [49]). Based on Reference [49], the wall area for the water-saturated hydraulic conductivity estimated in this study (see Table 2) had to be increased by a factor of 2, i.e., the rate per wall square area decreases to 75 L·m−2·day−1 (as compared to 150 L·m−2·day−1 defined by References [41,42]).

Geometric Dimensioning of the TSE Infiltration and Closely-Spaced System

In agreement with a one-family house concept, a wastewater effluent for four persons (4 × 150 L·day−1) was assumed for the TSE infiltration ditch. According to References [41,49], and by assuming a width of 0.5 m, it led to a TSE infiltration ditch volume of 8.0 m × 0.5 m × 0.5 m with a total wall area of 8.5 m2. The base wall area was increased by a factor of 2 due to the lower water-saturated hydraulic conductivity of 2 × 10⁻⁵ m·s−1. As mentioned previously, both infiltration ditches were placed in a longitudinal direction to reduce the interaction (see Figure 2). The depth of the TSE infiltration ditch was assumed to be 0.5 m below the distribution pipe, filled with gravel (see Reference [49] and references therein, [45]). The dimensions of both infiltration ditches can be found in Table 3.
Note that in the numerical model (see next section) vertical infiltration from the TSE infiltration was dominant due to the two-dimensional set-up. However, conventional dimensioning of TSE infiltration ditches only considers wall areas to be effective for infiltration. However, it can be assumed that the bottom of the TSE infiltration ditch will become less permeable after only a period of years, depending on the TSE water quality and possible transport of fine particles into the gravel pack [45]. Additionally, TSE infiltration is generally smaller in width than precipitation infiltration [45]. Due to gravity, horizontal flow from the side walls was assumed to eventually transform primarily into a vertical flow before the water finally reached the lateral extents of the precipitation ditch. Therefore, a vertical, two-dimensional set-up, aligned alongside the longitudinal axis of the ditches, appeared to be appropriate.

2.3. Numerical Model

2.3.1. Model Set-Up

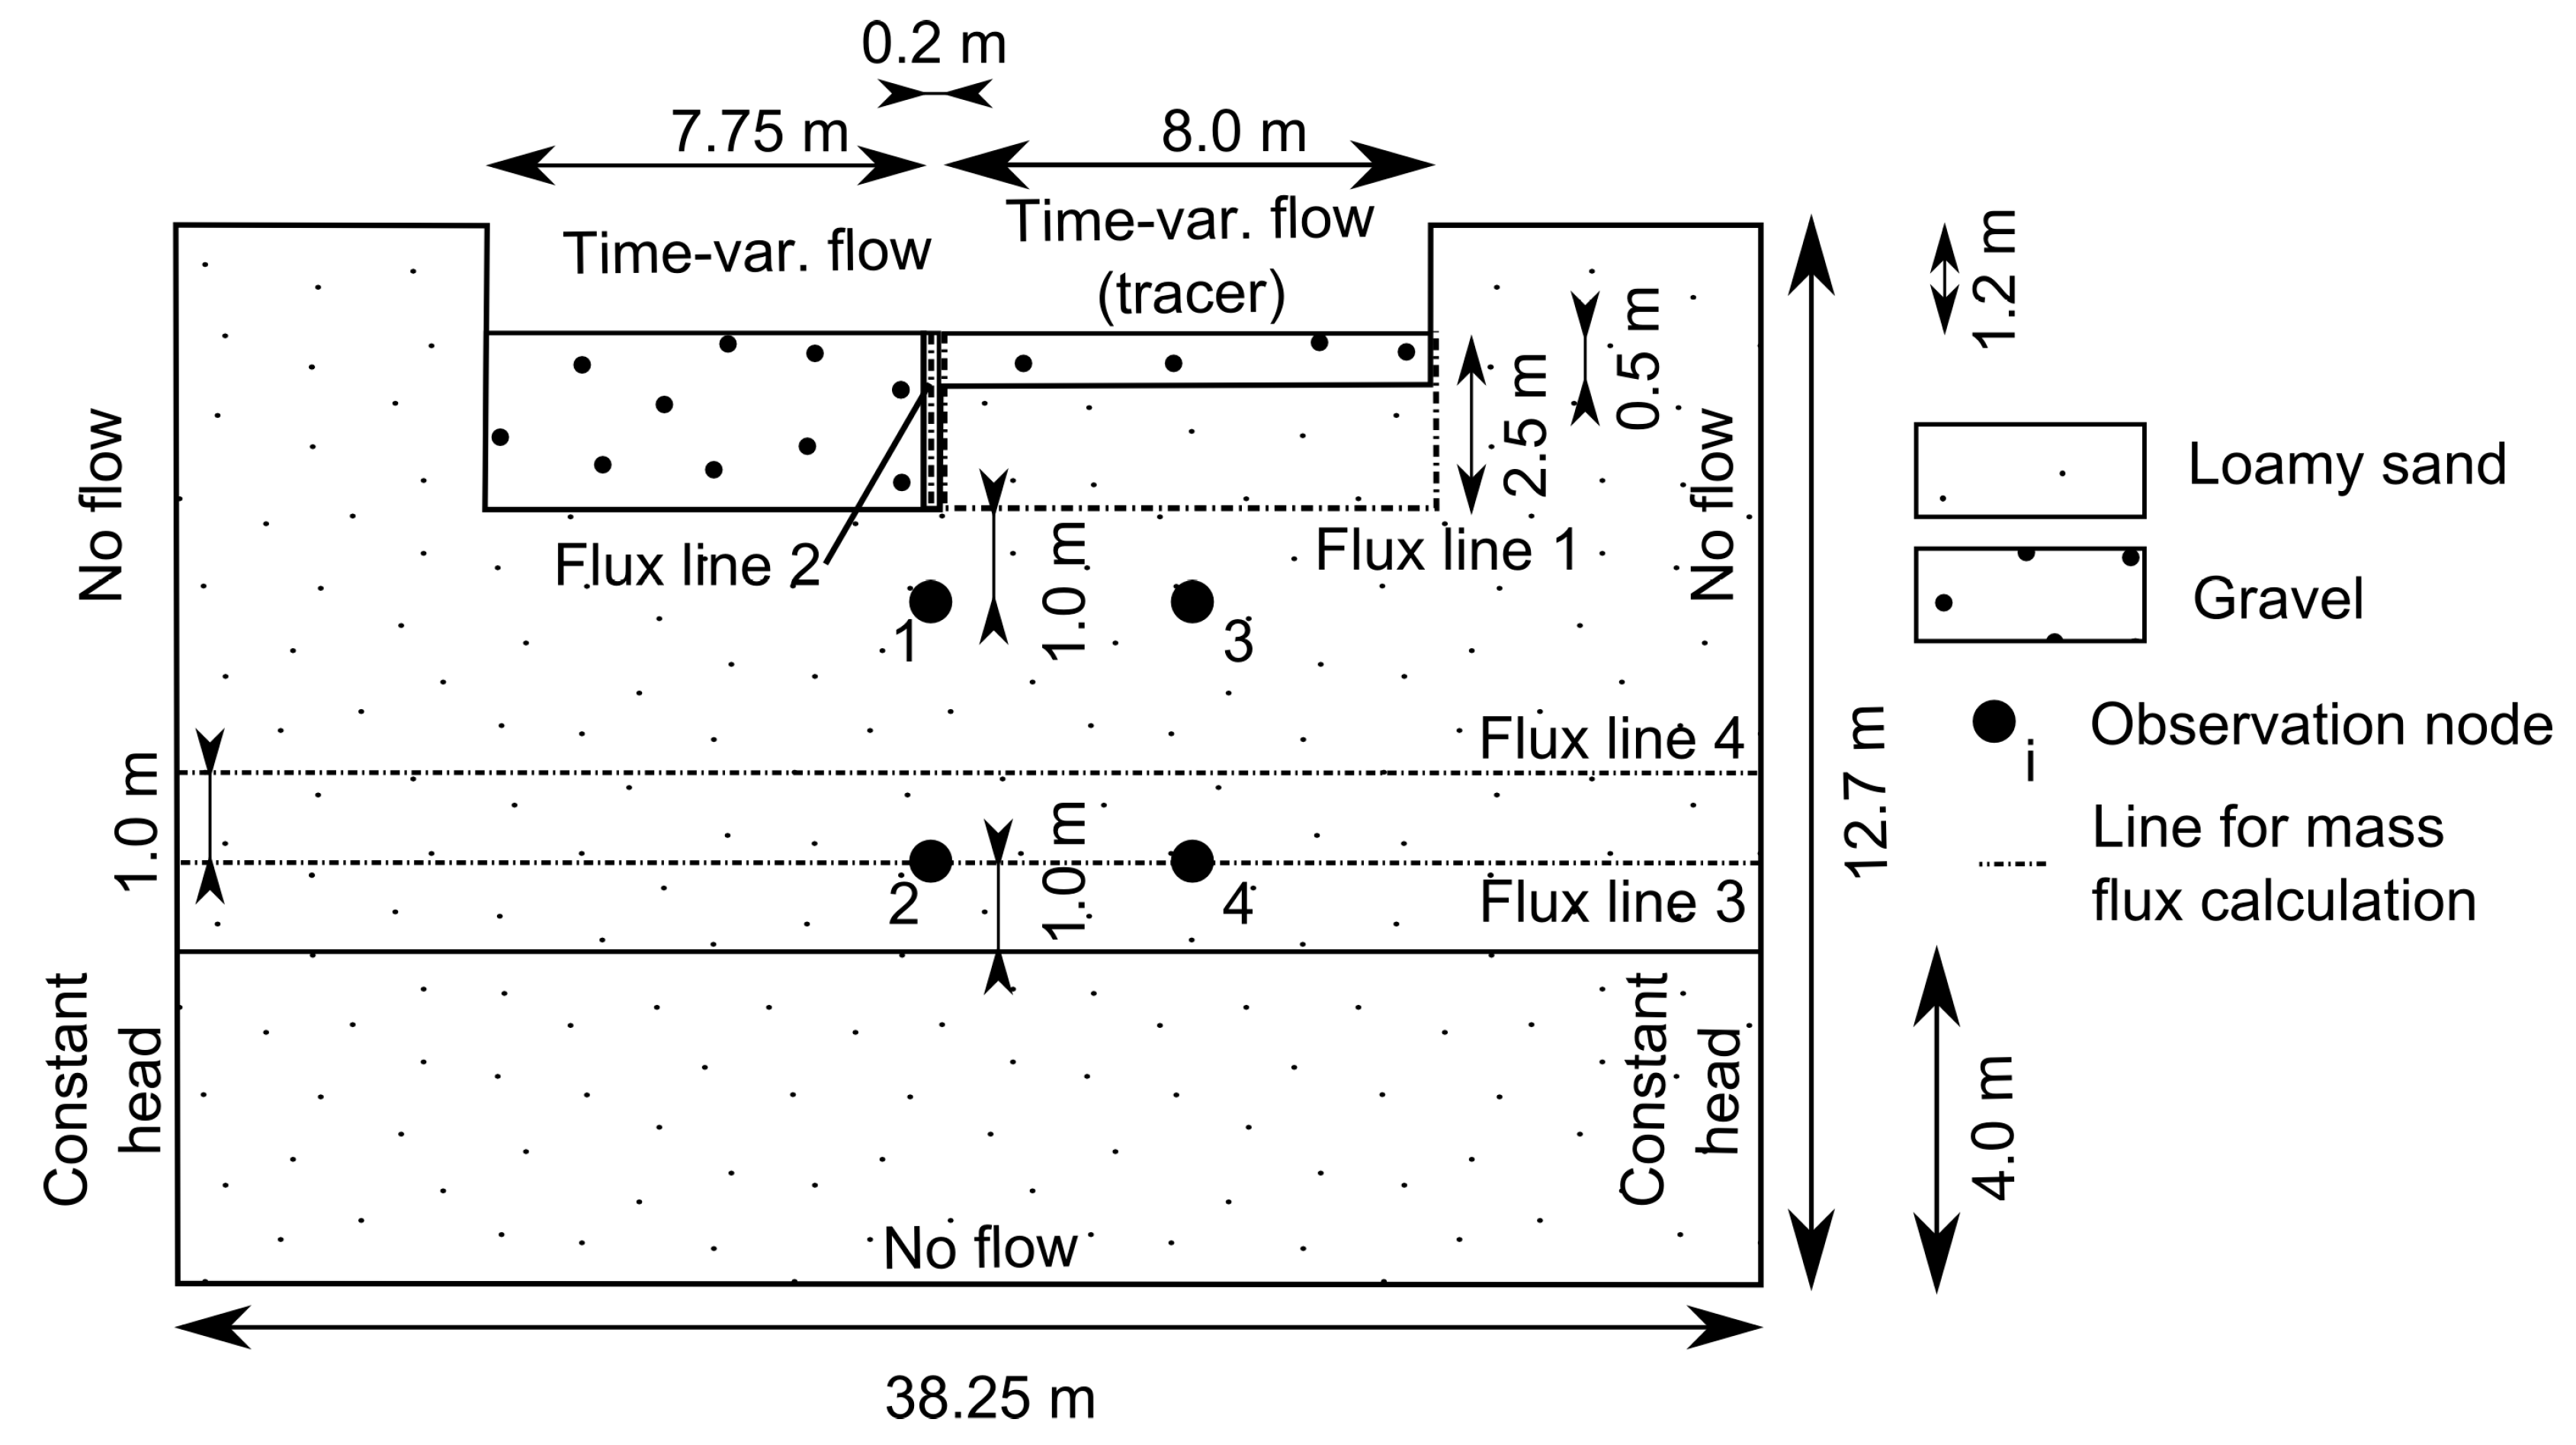
The software code HYDRUS 2D/3D (Co. PC-Progress [54,55]) was used for the numerical simulation of the postulated closely-spaced infiltration system. Here Richards’ equation [56] and the van Genuchten retention function [57], together with the Mualem equation [58], was selected to consider the dependency between the water content and relative hydraulic conductivity (no hysteresis assumed). For the reference case, a cross-sectional model of 38.25 m × 12.7 m (L × H) including both infiltration ditches was set up to meet the real-world geometry specifications. Both infiltration ditches were located close to each other, being separated by a 0.2 m thin vertical clay barrier with a water-saturated hydraulic conductivity of 1.16 × 10⁻⁸ m·s−1 (assumption, see model setup in Figure 2). The numerical fitness of the flow and transport model has been proven by transferring the geometries, parameters, and boundary conditions of the basic reference model to the scientific model code PCSiWaPro® (e.g., Reference [59]), providing a good agreement to the results presented here.
Time-variable flow boundaries have been used to mimic the infiltration from slotted pipes into the gravel-filled ditches. The ground water table was considered using fixed-head boundaries along the lower 4 m of the vertical model boundaries. All other hydraulic boundaries were set to be no-flow. For simplification, the retention space for the precipitation water infiltration was assumed to be located below the elevation of a hypothetical distribution pipe (flow within the pipe and related pressure losses as well as storage within pipe were not simulated). Initial pressure heads and water contents were calculated by assuming saturation equilibrium from the groundwater table. The temporal TSE infiltration scheme was based on Reference [51] and divided the daily infiltration volume into six sub periods with interval lengths ranging from 2 to 7 h. Length and intensity of the precipitation water infiltration was based on Reference [40] (slight adaptation for numerical reasons), with values representing the study site in Schöneck i.V. (see Table 1).
Simulation time before the precipitation event was 30 days, enabling quasi-stable conditions below the TSE infiltration ditch. Total simulation time for all model runs was set to 75 days (+45 days), which was seen as sufficient for observing the most relevant processes of infiltration interaction.
Hydraulic parameters for the native subsurface material were estimated using Table 2 and the HYDRUS 2D/3D soil catalog assuming loamy sand (which is in agreement with soil properties at the infiltration site in Schöneck i.V.; for data, see Electronic Supplementary Materials S1). Please note that the groundwater table and location of the impervious bottom was changed in comparison to conditions at Schöneck i.V. to get a more representative, unconsolidated aquifer, thus providing a suitable base for the scenario assessment. Retention parameters of the clayish hydraulic barrier were estimated using the HYDRUS 2D/3D soil catalog assuming loam data (see Electronic Supplementary Materials S1). Hydraulic and retention parameters for gravel (water-saturated hydraulic conductivity assumed to be 0.00165 m·s−1) were based on typical values for sand (gravel is not defined in Hydrus 2-D/3-D soil catalogue), where a slight adaption for shape parameter α, shape parameter n, and porosity have been made to fit the gravel criteria (see also Electronic Supplementary Materials S1) used in the design guideline [40].
The reference model includes approximately 137,000 computational elements and 69,000 nodes. The finest spatial discretization was realized for the infiltration ditches (0.05 m), enlarging to the maximum element size of approximately 0.15 m at the outer fringes of the model. A broad bandwidth of different scenarios based on the reference case as previously described have been investigated (see Table 4). Some scenarios required a re-meshing and an adaption of the automatic time stepping procedure.
To investigate TSE retention times, the transport of a conservative solute tracer was simulated. Although the organic content and other substances were subject to biodegradation along the vertical TSE pathway within the unsaturated zone (see Section 2.2.2: Dimensioning of TSE Infiltration) and within the saturated portion of the aquifer, the conservative transport simulation allowed to investigate solute tracer mass fluxes and relative concentrations as a worst case. To trace the movement and, more precisely, the change in TSE transport due to a precipitation event, a specific period of TSE infiltration was labelled (approximately 7 days before the onset of precipitation infiltration, except scenarios Kup and Klow), with a relative concentration Crel of 1 (background was 0). Therefore, the water was significantly marked with the tracer until an approximate depth of 6.0 m below the theoretical TSE distribution pipe. Dispersion had already led to spreading at the lower fringe of the tracer plume. The dispersivity value was assumed to be 0.25 m, with an anisotropy of 1/10 into the lateral direction. Diffusion in water was considered with an assumed diffusion rate of 1.728 cm2·day−1. Sorption was neglected to consider conservative transport.
The temporal breakthrough of relative concentration was printed at four observation nodes located in the center of the closely-spaced system (below the hydraulic barrier) and centered below the TSE infiltration ditch (see Figure 2). In addition, cumulated solute mass flux rates were printed across four flux lines [54,55] (see Figure 2). In this cross-sectional model, infiltration led to a significant groundwater mounding and, therefore, a lateral flow component above the initial groundwater table. Hence, the lowest flux line was located within the uppermost part of the elevated groundwater surface in the reference model. Since the model extents may also influence groundwater mounding due to infiltration processes depending on the hydraulic conductivity, a second horizontal flux line located 2 m above the initial groundwater level (flux line 4) was introduced to support the results.

2.3.2. Evaluation of Model Scenario Sensitivity

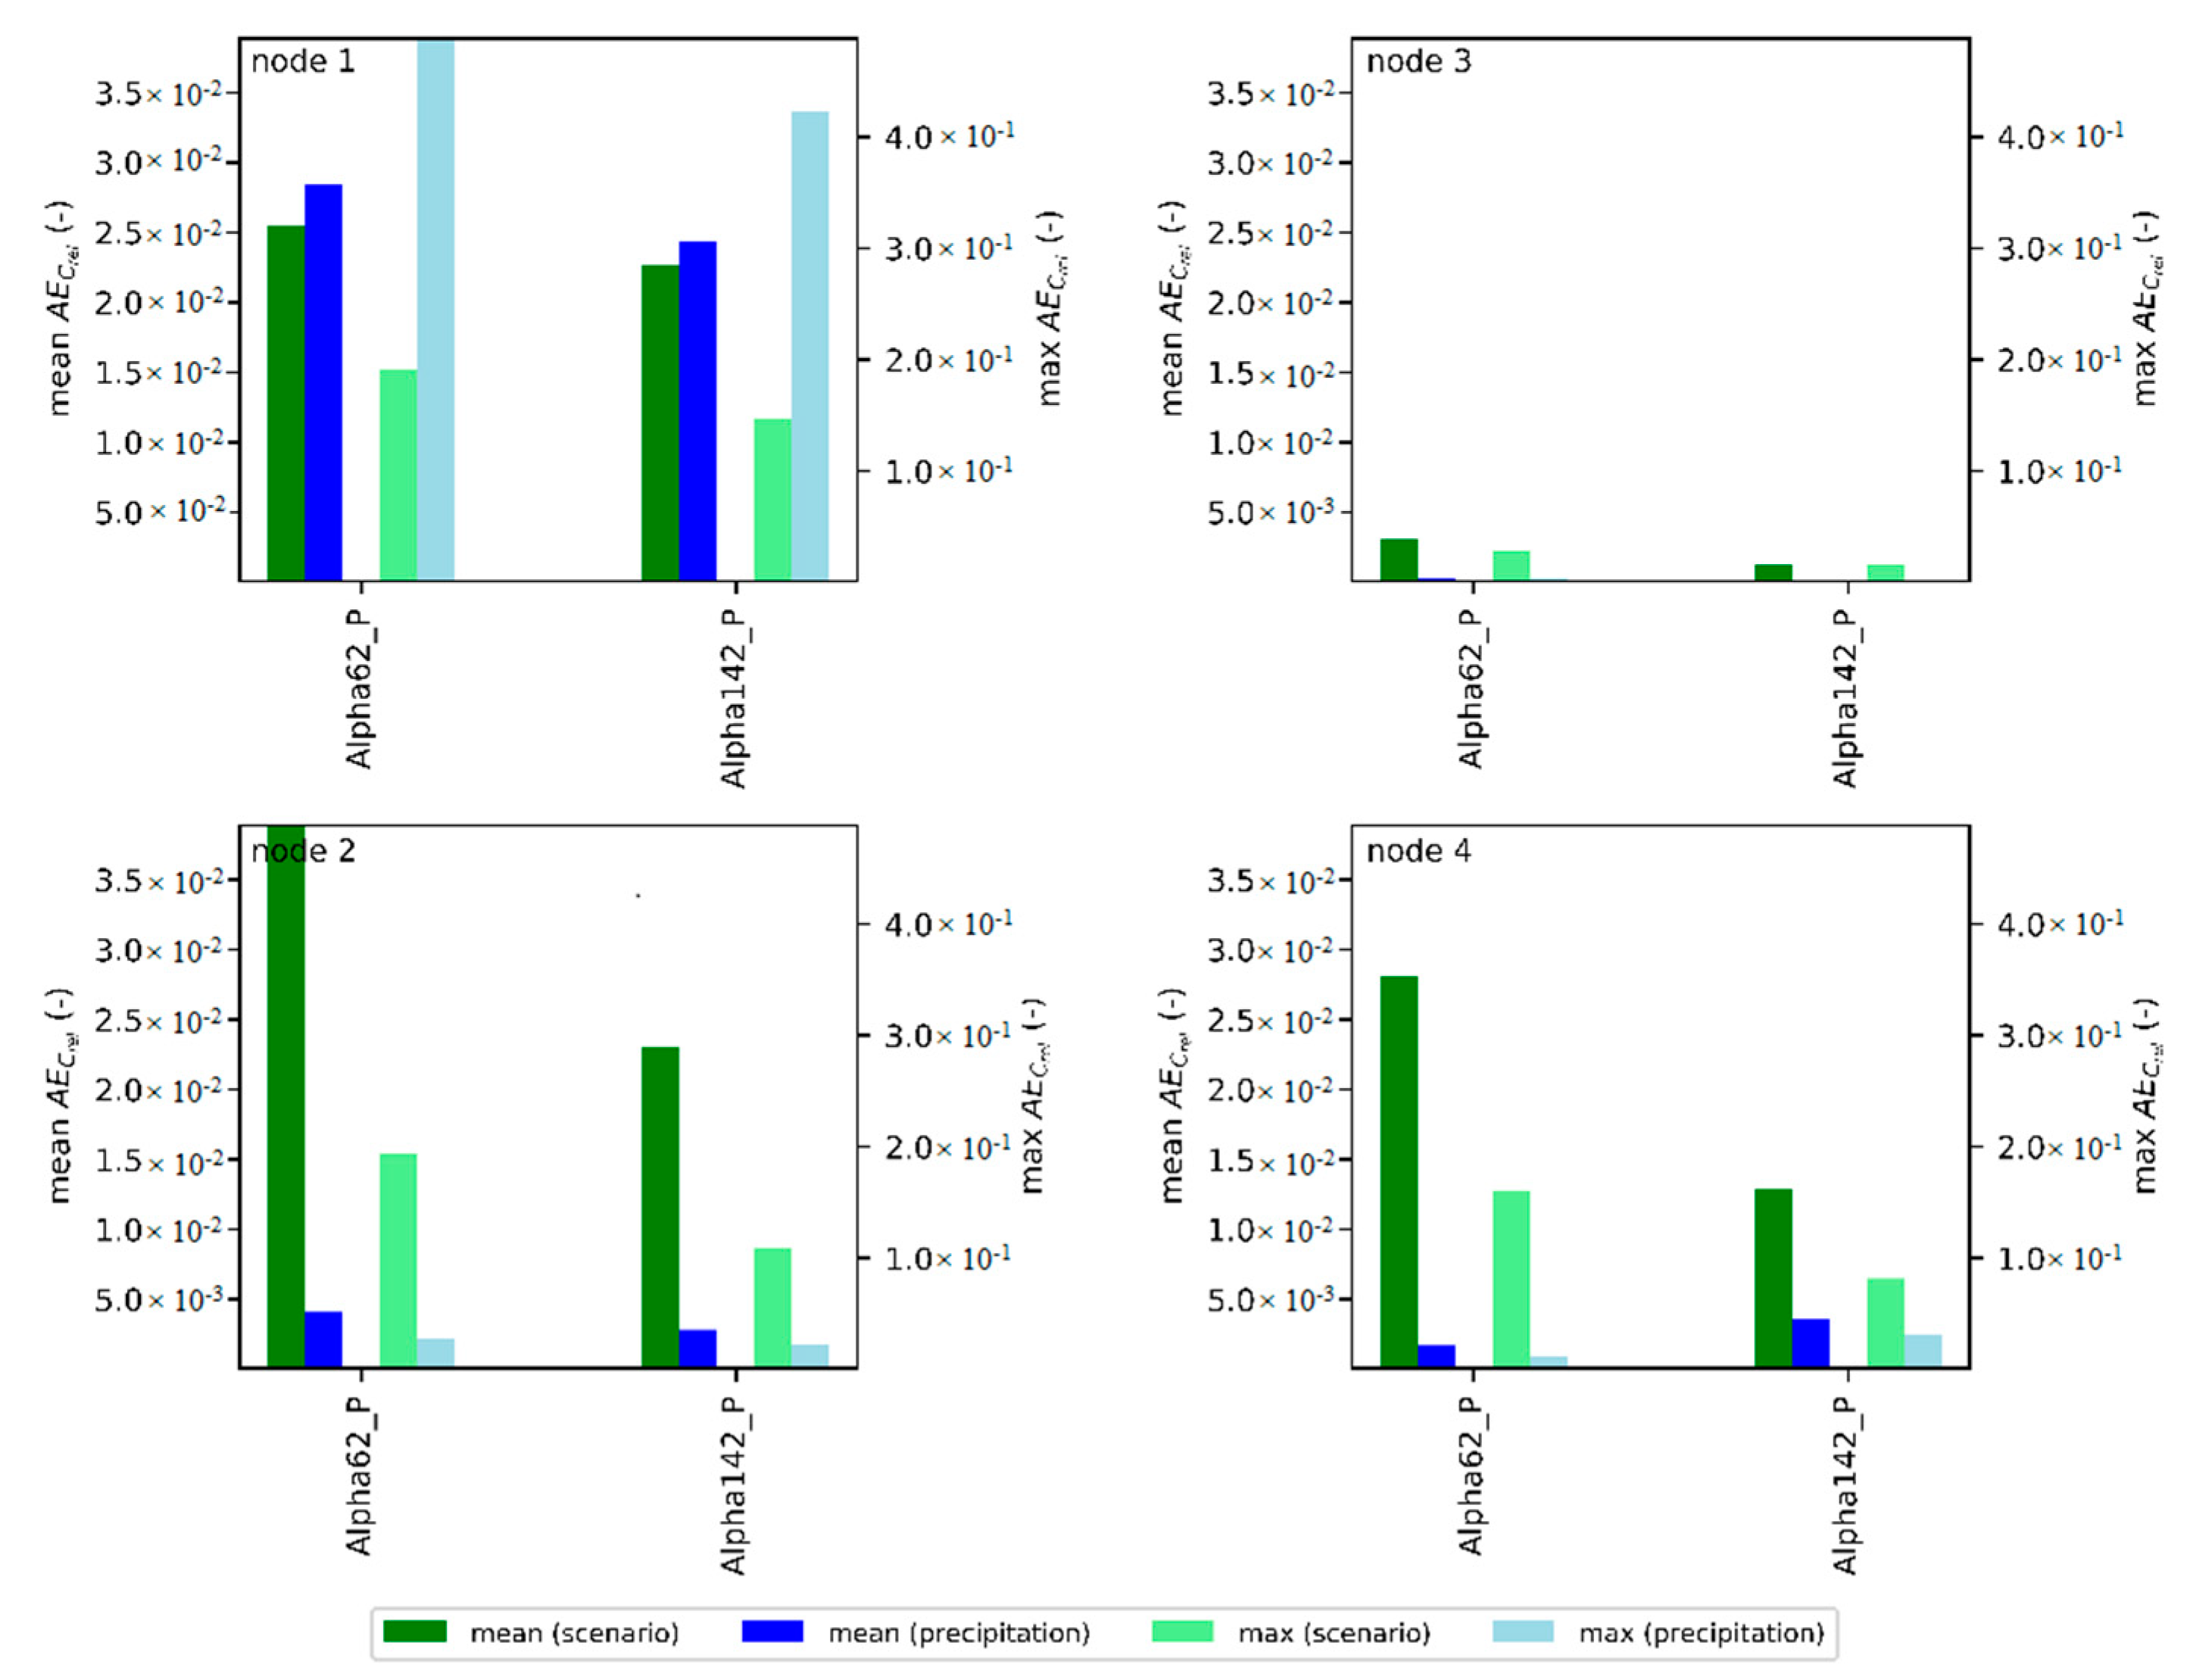
Water content and relative tracer concentration at the four observation locations, as well as the cumulated solute mass fluxes for four flux lines, were extracted from the model result files via a self-developed Python script (script including input data and plots available under http://dx.doi.org/10.25532/OPARA-15). Comparison of the importance of the precipitation water infiltration (precipitation sensitivity) on TSE travel times with the parameter and conceptual changes made in each scenario (scenario sensitivity, see Table 4) was done. For this, the respective concentration breakthrough curves (BTCs) in each scenario without precipitation (only TSE infiltration is active) were compared to both the reference model without precipitation and the scenario model with precipitation. Due to different time step sizes of each model run, each simulated time series was transferred into a time series with equalized output times. For this purpose, an ensemble learning method for regression using the random forest algorithm was applied. This kind of decision tree approach was able to fit a highly complex time series with very good precision and efficiency [60]. For this study, regression was defined as successful if the coefficient of determination R² was above a threshold value of 0.99. After regression, the mean absolute error (mean AECrel) and maximum absolute error (max AECrel), related to the relative concentration Crel, were calculated for each modeling scenario in order to estimate scenario sensitivity (i.e., reference scenario without precipitation infiltration vs the respective scenario without infiltration), as well as precipitation sensitivity (i.e., scenario without and with precipitation infiltration).

3. Results

3.1. Simulated Variables at Selected Observation Nodes

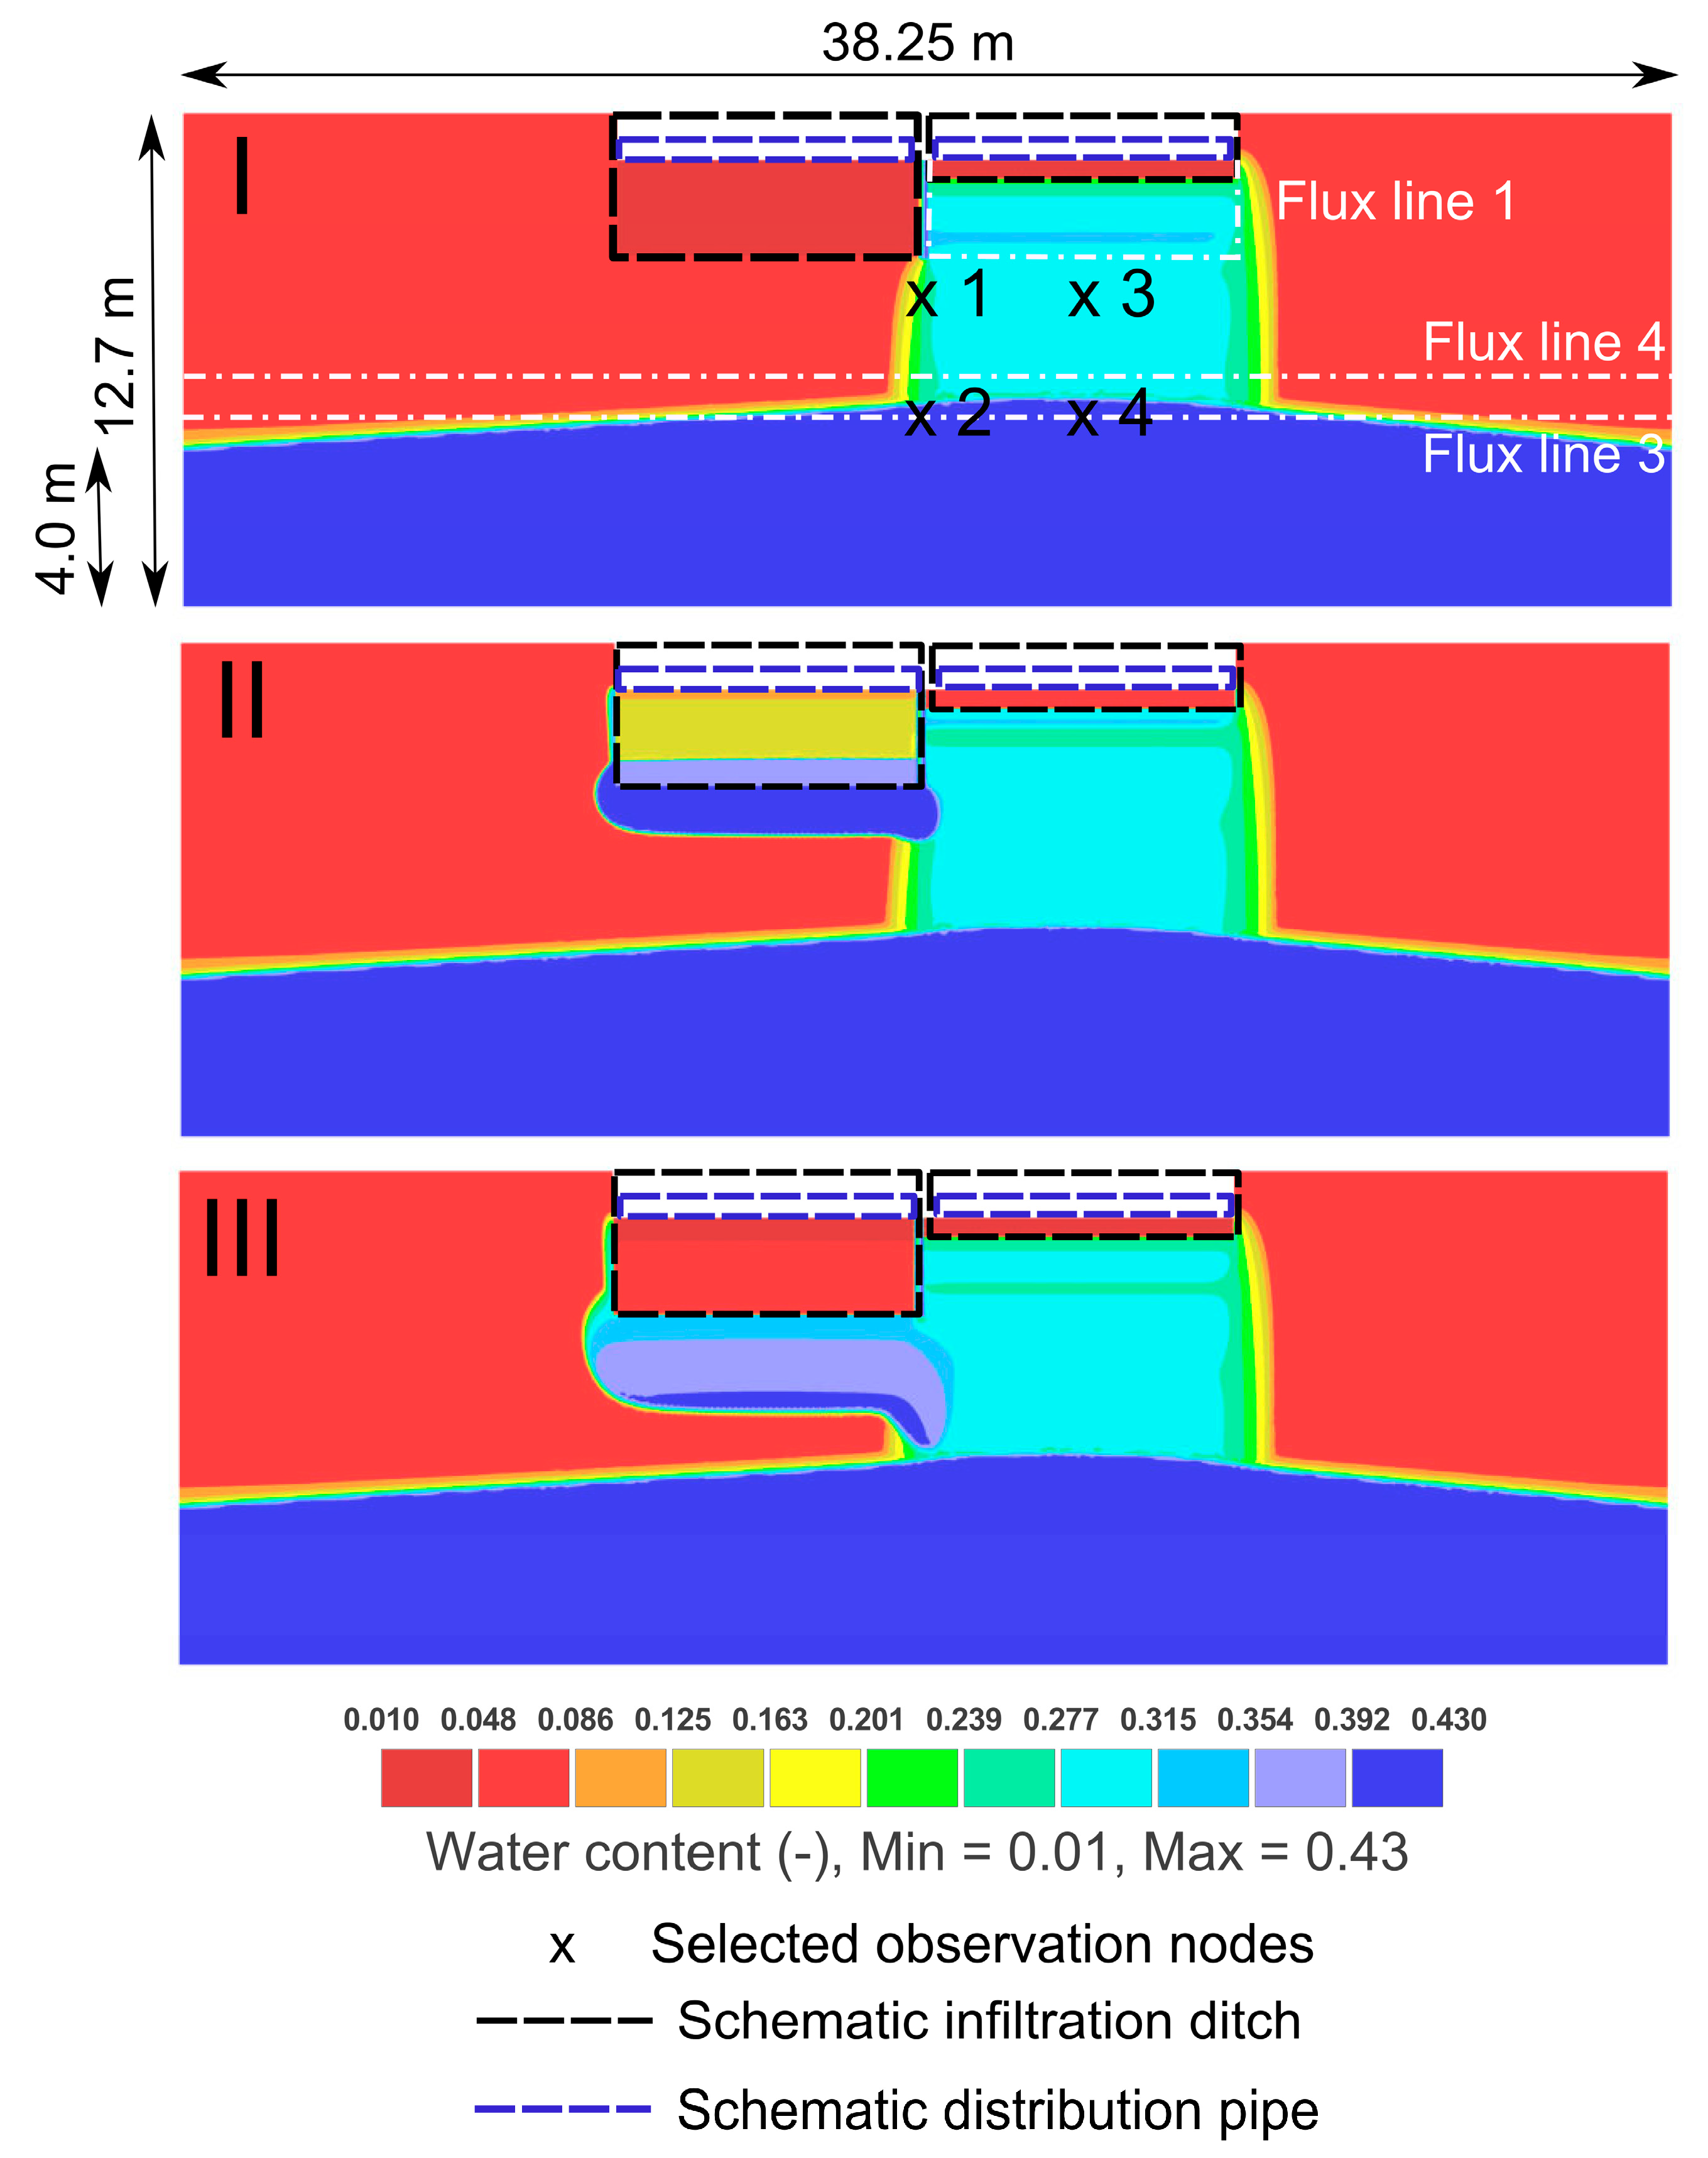
To investigate the impact of a precipitation event on the closely-spaced infiltration, water contents, as well as conservative transport, were analyzed. Figure 3 shows water contents at selected model times before and after the precipitation event. It can be seen that parts of the TSE infiltration plume were affected by the precipitation event, although a large portion of the vertical movement appeared to be undisturbed.
Figure 4 shows the water content θ [-] at each observation node, as shown in Figure 2 and Figure 3, for the reference model and the scenarios of lower and higher groundwater table (GWlow and GWup). Note, that the lower observation nodes are at the vertical position where flux line 3 was integrated to quantify cumulated tracer mass fluxes before transfer into groundwater (see Figure 2). It can be seen that a comparably low water-saturated hydraulic conductivity of 2 × 10⁻⁵ m·s−1 in the reference model led to a significant ponding such that observation nodes 2 and 4 constantly show full water saturation after a travel time from the TSE infiltration ditch of less than 15 days. Therefore, these observation nodes do not depict the effect of the precipitation event. However, at observation node 1, and also in scenario GWlow at node 2, the precipitation event led to a rapid increase of recorded pressure head and, thus, water content. Water contents were stable before the precipitation event started. The rise in water content due to precipitation infiltration was followed by a comparably fast decline. Until the end of the simulation, stable conditions for water contents could be observed again.
To better highlight the impact on the TSE infiltration in terms of retention times, Figure 4 also shows relative tracer concentrations at each observation node. It is obvious that BTCs at observation nodes 3 and 4 were practically identical when comparing simulations for the reference model and for scenario models with and without precipitation infiltration. Thus, the precipitation event had no effect on TSE transport in the center of the plume (and hence the main portion of the TSE infiltration ditch). However, due to dilution, a significant difference could be observed for observation node 1 that was located centrally between both infiltration ditches. Once precipitation water reaches the TSE infiltration zone, concentrations in the affected area were mostly smaller for scenarios in comparison to scenarios without precipitation water infiltration. This effect also led to a slightly faster increase of tracer concentration, in particular observation nodes, below the center of the closely-spaced infiltration system (e.g., observation node 2 for scenario GWlow), although only minor differences in the BTCs could be observed.
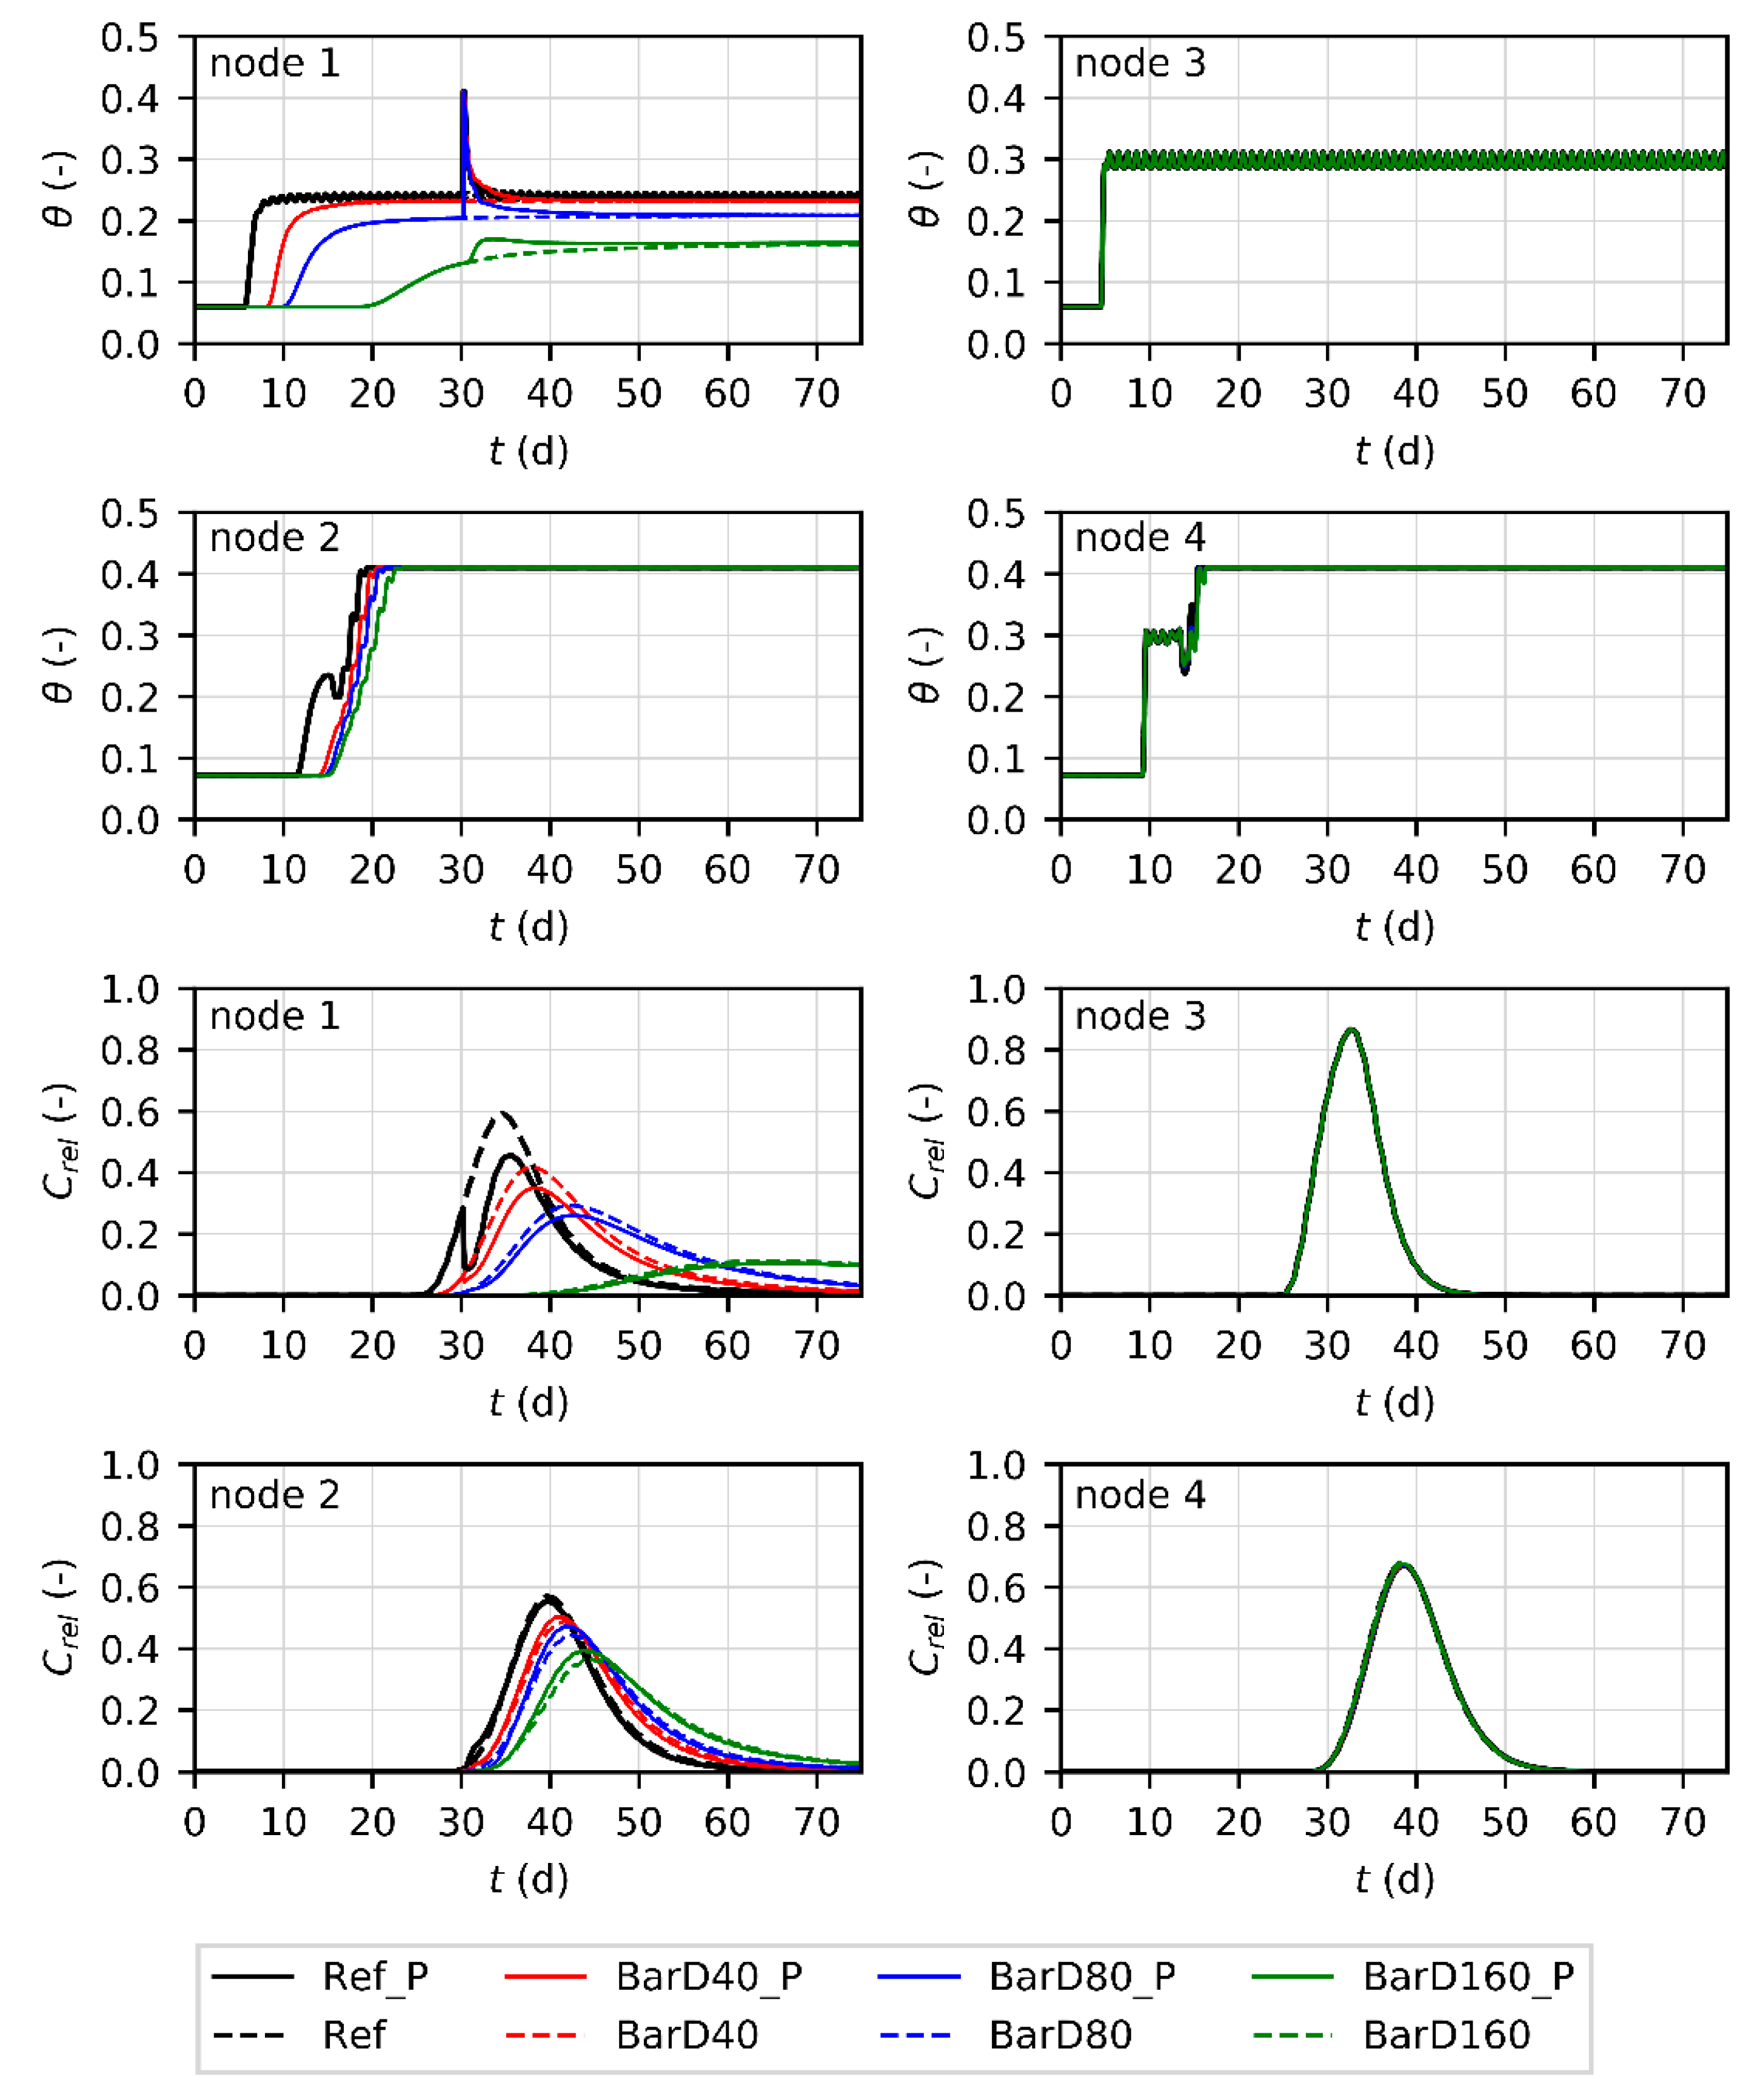
For most of the scenarios and observation nodes, the precipitation event had only a slight impact on the BTCs as the area influenced by the precipitation infiltration was small (see Electronic Supplementary Materials S2 for BTCs of all scenarios). Changes in the BTCs mostly belonged to the direct area of interaction (observation node 1, and observation point 2 in selected scenarios). BTC behavior mainly depended on the hydrogeological setting (e.g., van Genuchten shape parameter α and hydraulic conductivity) and conceptual realization of the TSE infiltration ditch, rather than on effects originating from the precipitation infiltration ditch. Interestingly, neglecting the hydraulic barrier (scenario NoBar) seemed not to be important for the conditions analyzed here (see Electronic Supplementary Materials S2). Here, the direct area effect by the precipitation infiltration could even more easily be reduced by considering a slightly enlarged distance between the infiltration ditches of 0.8 m or 1.6 m, respectively (see Figure 5).
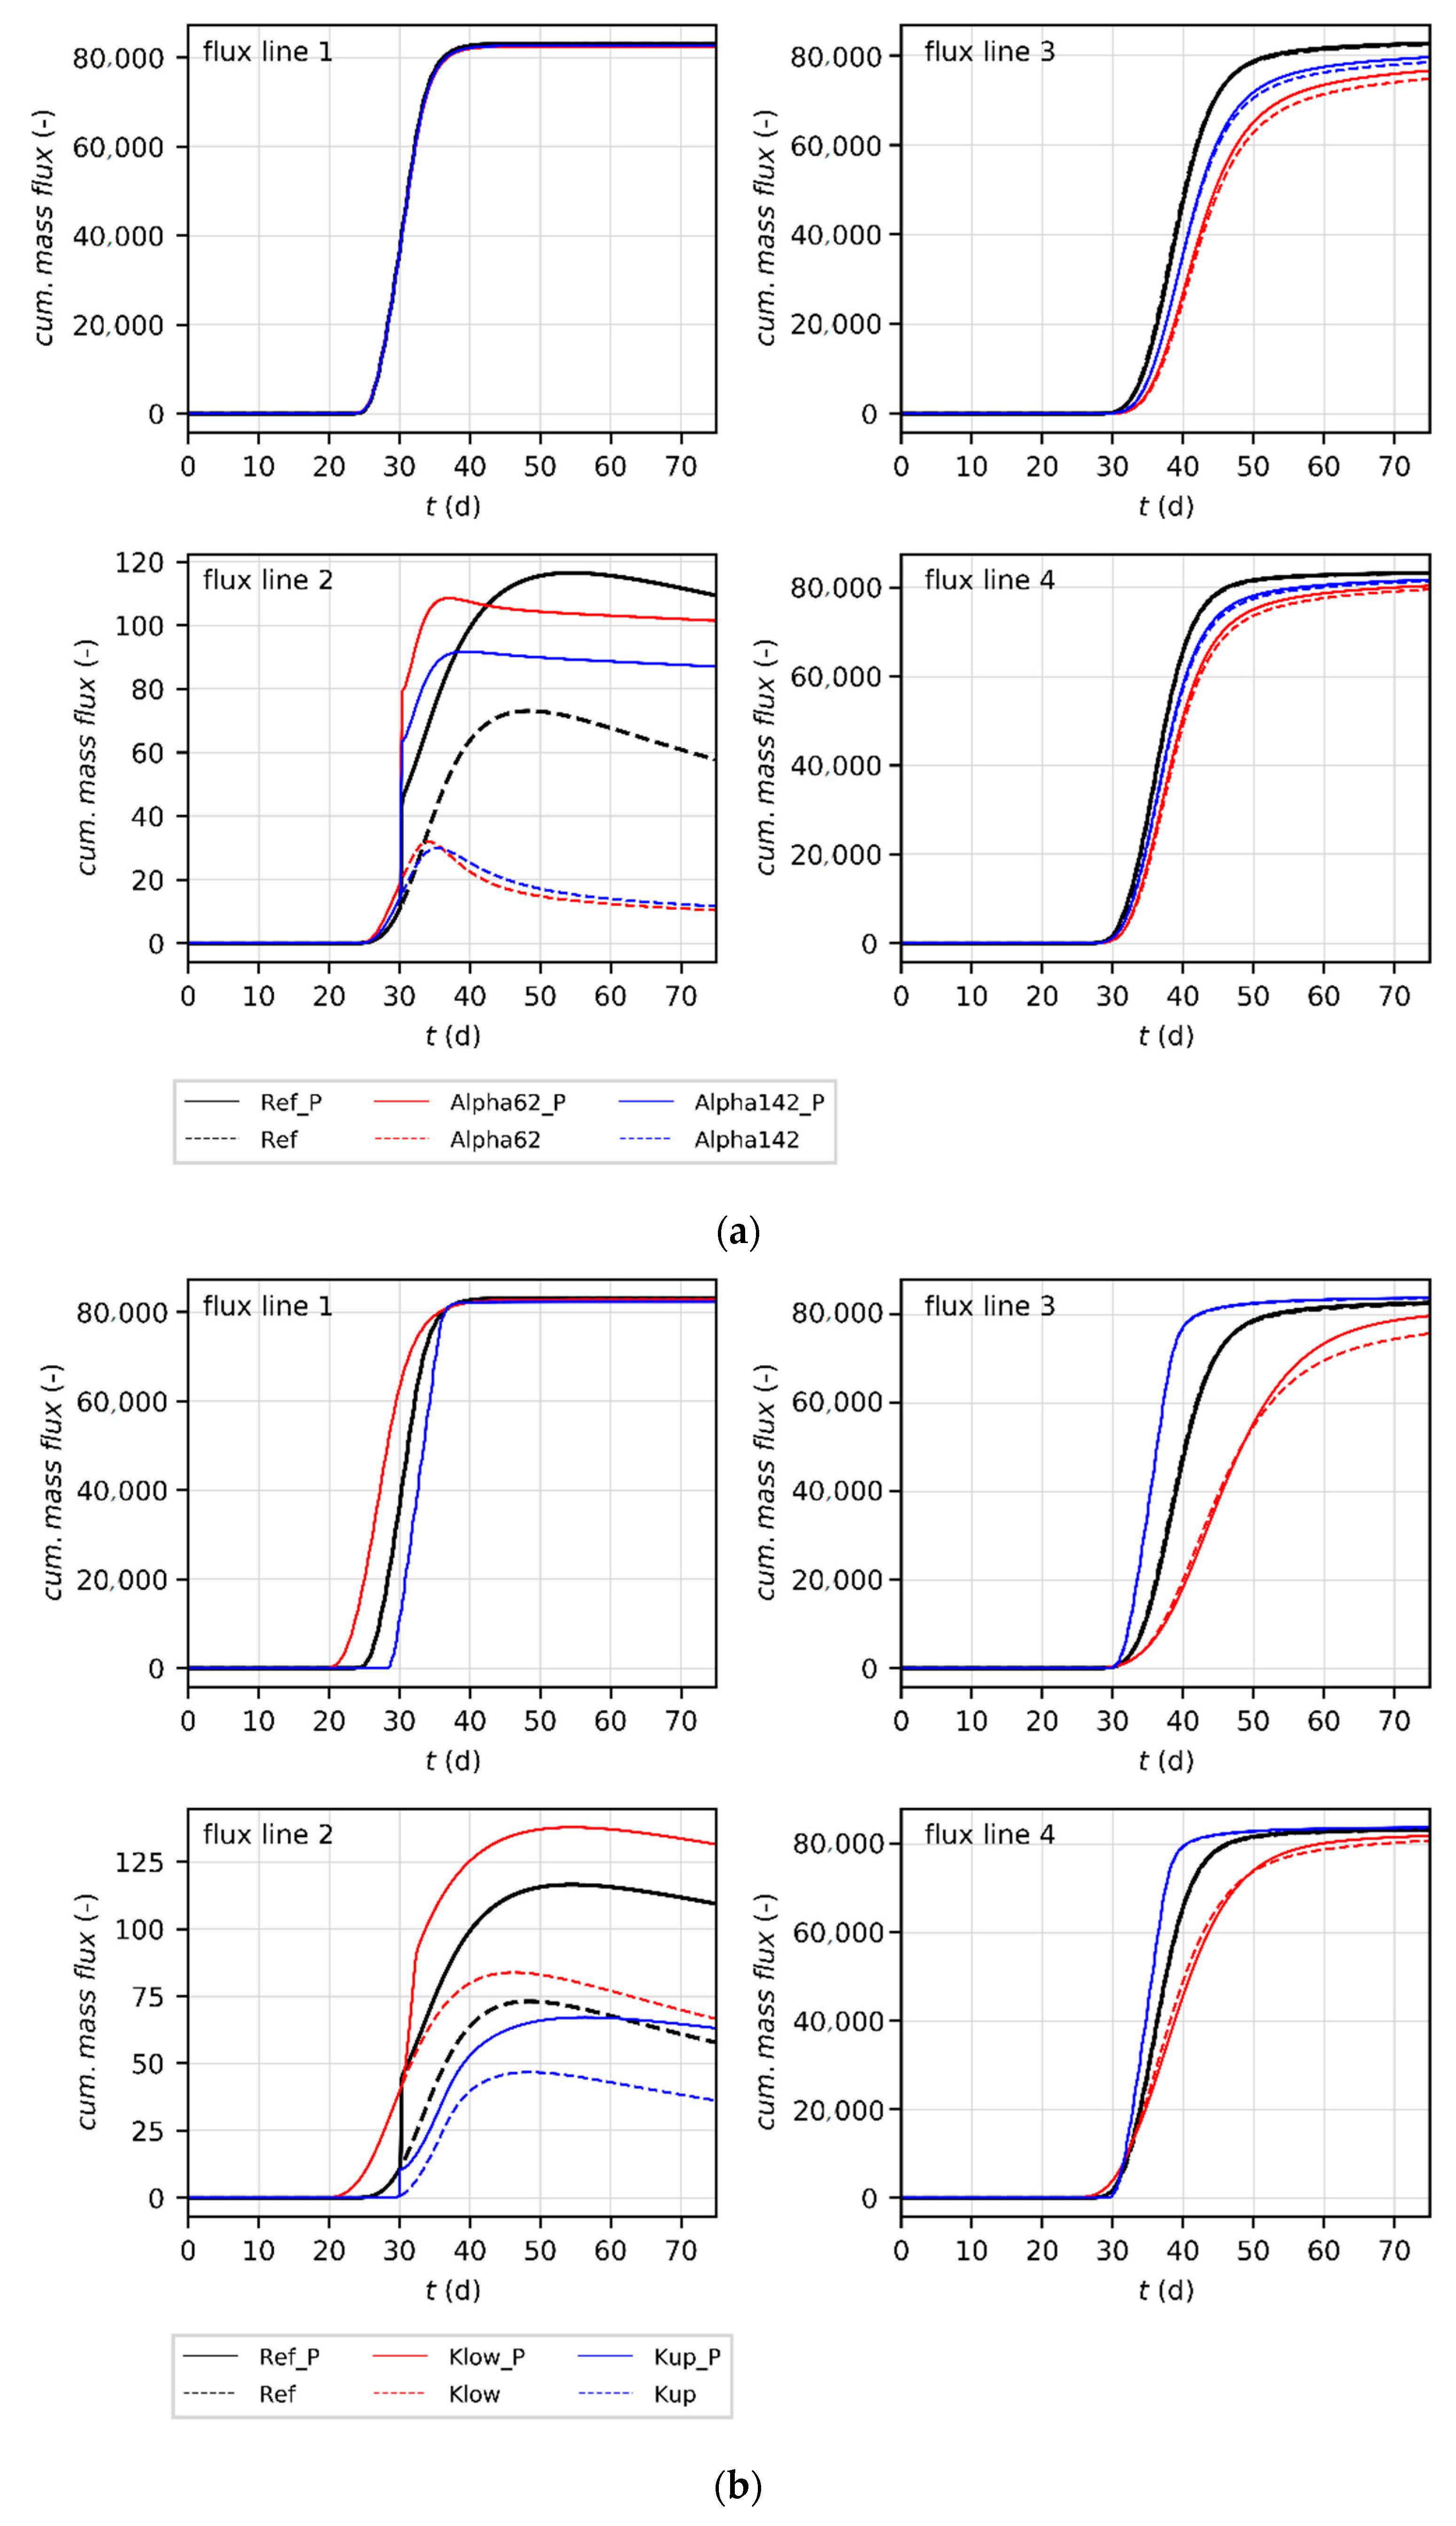
Figure 6a,b shows cumulated solute mass fluxes over the four flux lines (as depicted in Figure 2) for the cases of varying van Genuchten shape parameter α (scenarios Alpha62 and Alpha142) and hydraulic conductivity (scenarios Klow and Kup). From these cases, it again becomes obvious that subsurface material seems to have a larger influence on TSE infiltration than the existence of infiltrated precipitation water. By comparing all scenarios with the reference case, as well as with and without the precipitation event, in none of the considered cases, precipitation water infiltration showed a large effect on the cumulated mass flux across the horizontal flux lines above the initial groundwater table when compared to the effect of varying subsurface properties (see Electronic Supplementary Materials S3). Only for low water-saturated hydraulic conductivities of 5 × 10⁻⁶ m·s−1 (scenario Klow) a noticeable difference could be identified for flux line 3 (see Figure 6b). However, this was due to the increased horizontal flow component above the initial groundwater table when precipitation infiltration led to significant groundwater mounding. Here, it is noteworthy that groundwater mounding was more prominent than expected for field applications as the two-dimensional set-up neglected flow into the second horizontal direction. Besides this, a third dimension is assumed to additionally reduce the interaction between both infiltration systems.

3.2. Parameter Sensitivity Analysis

The bandwidth of scenarios has been used to calculate scenario and precipitation sensitivities (mean AECrel and max AECrel values, respectively) for each of the four observation nodes (see Figure 2 and Figure 3; see Section 2.3.2: Evaluation of Model Scenario Sensitivity for methodological details). Exemplarily, results are shown in Figure 7 for a varying van Genuchten shape parameter α (scenario Alpha142 and Alpha62) and for all scenarios in Electronic Supplementary Materials S4; hereby the sensitivities reveal the relatively small importance of the precipitation infiltration as compared to the conceptual and parameter variation. Again, results indicate that the importance of the precipitation infiltration is most dominant for observation node 1 and, in some cases, for observation node 2 (see Electronic Supplementary Materials S4). However, in agreement with the results of the BTCs at the observation nodes (Figure 4 and Figure 5 and Electronic Supplementary Materials S2) and the cumulated mass fluxes across the horizontal flux lines 3 and 4 (Figure 6a,b and Electronic Supplementary Materials S3), parameter and conceptual uncertainties (as modeled in the various scenarios) often led to larger sensitivities in comparison to the existence of an active precipitation infiltration system. This could especially be seen when comparing scenario and precipitation sensitivities in observation nodes 3 and 4 (located in center below the TSE infiltration ditch). For observation point 2 in all scenarios, except for the removal of the hydraulic barrier between both infiltration systems (scenario NoBar) and the stepped infiltration (scenario Step), the scenario sensitivity was larger than precipitation sensitivity. However, it has to be kept in mind that sensitivities are also influenced by the tracer labeling time (as observable by a scenario including a tracer labelled period shifted by −7 days in Electronic Supplementary Materials S2–S4).

4. Discussion and Conclusions

From the analyses shown in the previous sections, it can be stated that closely-spaced precipitation and TSE infiltration has the potential to affect water content and, therefore, TSE travel behavior within the unsaturated zone. However, under the conditions analyzed here, i.e., when dimensioning of the infiltration ditches/trenches is realized based on German guidelines, these changes only occurred within short time periods. Besides this, depending on the geometrical design of the closely-spaced infiltration system, the portion of the total vertical TSE percolation area being influenced by precipitation remained small. When comparing BTCs of the synthetic solute TSE tracer at different observation nodes in the center of the TSE infiltration ditch and the center of the combined closely-spaced infiltration system, only small differences between the modeled scenarios with and without a precipitation event could be observed in comparison to the impact of subsurface properties and conceptual design of the closely-spaced system. This was supported by tracing cumulated solute mass fluxes across selected flux lines. Especially for the van Genuchten shape parameter α, which is not considered in ditch dimensioning strategies according to German guidelines, larger effects on cumulated mass fluxes across horizontal flux lines above the groundwater table could be noticed for varying this parameter as compared to consideration of an additional precipitation event. These conclusions support the operational criteria I and II delineated in the respective sections. Numerical results also revealed that storage capacity of the precipitation water infiltration was not significantly reduced, supporting operational criterion III. However, such systems include a large complexity between hydro(geo)logical parameters, geometrical dimensioning of the system, and the infiltration rates applied. For example, possible negative effects may arise in case of a significant groundwater mounding resulting from very shallow groundwater levels or significantly small hydraulic conductivities. Therefore, it is envisaged that appropriate modeling tools are applied to test the combination of precipitation and TSE infiltration systems for a respective site. Hydrogeological and technical details have to be considered to ensure a reduced influence between the two kinds of water to be infiltrated and, thus, sufficiently long TSE retention times. However, the closely-spaced precipitation water and TSE infiltration by ditches appeared to be plannable under careful consideration of German guidelines (see References [40,41,42]), as long as the adjacent TSE infiltration did not largely reduce the projected infiltration area of the precipitation system and vice versa. Besides this, as the base for dimensioning was a precipitation event with a 5-year recurrence interval, following works should also consider effects of precipitation events of higher intensities possibly flooding the TSE infiltration.
Although this numerical modeling study was able to investigate selected processes of closely-spaced TSE and precipitation water infiltration, practical issues have to be considered when it comes to real-world application. This may include, among others, site-specific chemical reactions (see e.g., Reference [50]), clogging (see e.g., Reference [49]), and the system´s technical layout. For the latter, please note that, apart from the infiltration method investigated here, also other systems can be used (e.g., References [19,40]).
To support the numerical findings obtained in this study, but also to investigate the flow and transport processes of the closely-spaced system under well-defined conditions, a laboratory-scale 3-D physical model with TSE application has been constructed [50]. For verification and additional scenario analysis, coupling the transport simulation of the closely-spaced infiltration system with a reactive simulation code, such as PHREEQC [61], seems highly appropriate to study these processes in more detail.

Supplementary Materials

The following are available online at https://www.mdpi.com/2073-4441/10/10/1460/s1, Electronic Supplementary Materials S1: Table “Porous media hydraulic parameters”, Electronic Supplementary Materials S2: Figures of “Simulated values of water content θ and relative solute concentration Crel at four selected observation nodes”, Electronic Supplementary Materials S3: Figures of “Cumulated solute mass fluxes across all four flux lines”, and Electronic Supplementary Materials S4: Figures of “Mean (mean AECrel) and maximum absolute errors (max AECrel) representing scenario and precipitation sensitivities, respectively, related to relative concentration Crel at four selected observation nodes”.

Author Contributions

Conceptualization, F.H., S.K., and P.-W.G.; Investigation, F.H. and M.B.; Methodology, F.H., C.E., S.K., and T.F.; Validation, F.H. and C.E.; Writing—original draft, F.H., C.E., and M.B.; Writing—review and editing, C.E., S.K., T.F., M.B., and P.-W.G.

Funding

This work was supported by the Saxon Development Bank (Grant number 100301390), the European Social Fonds of the European Union, and the German Research Foundation (grant number LI 727/24-1).

Acknowledgments

We thank Marc Walther, Robert Pinzinger, René Blankenburg, and Sarah Trepte for providing support during the numerical simulation and climate data acquisition. In addition, Bernd Märtner and Harald Dostmann are acknowledged for providing insights into the practical design of infiltration systems.

Conflicts of Interest

The authors declare no conflict of interest. The funders had no role in the design of the study; in the collection, analyses, or interpretation of data; in the writing of the manuscript, or in the decision to publish the results.

References

  1. Newman, P. Sustainable urban water systems in rich and poor cities—Steps towards a new approach. Water Sci. Technol. 2001, 43, 93–99. [Google Scholar] [CrossRef] [PubMed]
  2. Daigger, G.T. Evolving Urban Water and Residuals Management Paradigms: Water Reclamation and Reuse, Decentralization, and Resource Recovery. Water Environ. Res. 2009, 81, 809–823. [Google Scholar] [CrossRef] [PubMed]
  3. Younos, T. Paradigm shift: Holistic approach for water management in urban environments. Front. Earth Sci. Chin. 2011, 5, 421–427. [Google Scholar] [CrossRef]
  4. Wang, S. Values of decentralized systems that avoid investments in idle capacity within the wastewater sector: A theoretical justification. J. Environ. Manag. 2014, 136, 68–75. [Google Scholar] [CrossRef] [PubMed]
  5. Ellis, J.B.; Revitt, D.M. Sewer losses and interactions with groundwater quality. Water Sci. Technol. 2002, 4, 195–202. [Google Scholar] [CrossRef]
  6. Lerner, D.N. Identifying and quantifying urban recharge: A review. Hydrogeol. J. 2002, 10, 143–152. [Google Scholar] [CrossRef]
  7. Chisala, B.N.; Lerner, D.N. Distribution of sewer exfiltration to urban groundwater. Water Manag. 2008, 161, 333–341. [Google Scholar] [CrossRef]
  8. Dou, T.; Troesch, S.; Petitjean, A.; Gábor, P.T.; Esser, D. Wastewater and Rainwater Management in Urban Areas: A Role for Constructed Wetlands. Procedia Environ. Sci. 2017, 37, 535–541. [Google Scholar] [CrossRef]
  9. United States Environmental Protection Agency (US EPA). Voluntary National Guidelines for Management of Onsite and Clustered (Decentralized) Wastewater Treatment Systems; EPA 832-B-03-001; United States Environmental Protection Agency, Office of Water: Washington, DC, USA, 2003; p. 62. Available online: https://nepis.epa.gov/Exe (accessed on 11 September 2018).
  10. Teerlink, J.; Hernández, V.M.; Higgins, C.P.; Drewes, J.E. Removal of trace organic chemicals in onsite wastewater soil treatment units: A laboratory experiment. Water Res. 2012, 46, 5174–5184. [Google Scholar] [CrossRef] [PubMed]
  11. EU91/271/EEC. Council Directive of 21 May 1991 Concerning Urban Waste Water Treatment; The Council of the European Communities: Brussels, Belgium, 1991; p. 13. Available online: https://eur-lex.europa.eu/legal-content/EN/TXT/?uri=celex%3A31991L0271 (accessed on 11 September 2018).
  12. Oron, G.; Campos, C.; Gillerman, L.; Salgor, M. Wastewater treatment, renovation and reuse for agricultural irrigation in small communities. Agric. Water Manag. 1999, 38, 223–234. [Google Scholar] [CrossRef]
  13. Bakir, H.A. Sustainable wastewater management for small communities in the Middle East and North Africa. J. Environ. Manag. 2001, 61, 319–328. [Google Scholar] [CrossRef] [PubMed]
  14. Chirisa, I.; Bandauko, E.; Matamanda, A.; Mandisvika, G. Decentralized domestic wastewater systems in developing countries: The case study of Harare (Zimbabwe). Appl. Water Sci. 2017, 7, 1069–1078. [Google Scholar] [CrossRef]
  15. Porse, E.C. Stormwater Governance and Future Cities. Water 2013, 5, 29–52. [Google Scholar] [CrossRef] [Green Version]
  16. Nickel, D.; Schoenfelder, W.; Medearis, D.; Dolowitz, D.P.; Keeley, M.; Shuster, W. German experience in managing storm water with green infrastructure. J. Environ. Plan. Manag. 2014, 5, 403–423. [Google Scholar] [CrossRef]
  17. Boller, M. Towards sustainable urban stormwater management. Water Sci. Technol. Water Supply 2004, 4, 55–65. [Google Scholar] [CrossRef]
  18. Sieker, F. On-Site stormwater management as an alternative to conventional sewer systems: A new concept spreading in Germany. Water Sci. Technol. 1998, 38, 65–71. [Google Scholar] [CrossRef]
  19. Bouwer, H. Artificial recharge of groundwater: Hydrogeology and engineering. Hydrogeol. J. 2002, 10, 121–142. [Google Scholar] [CrossRef]
  20. Shuster, W.D.; Morrison, M.A.; Thurston, H.W. Seasonal and situational impacts on the effectiveness of a decentralized stormwater management program in the reduction of runoff volume. In Proceedings of the 7th International Conference on Sustainable Techniques and Strategies for Urban Water Management/Novatech, Cincinnati, OH, USA, 28 June–1 July 2010. [Google Scholar]
  21. Balkema, A.J.; Preisig, H.A.; Otterpohl, R.; Lambert, F.J.D. Indicators for the sustainability assessment of wastewater treatment systems. Urban Water 2002, 4, 153–161. [Google Scholar] [CrossRef]
  22. Meng, F.; Fu, G.; Butler, D. Water quality permitting: From end-of-pipe to operational strategies. Water Res. 2016, 101, 114–126. [Google Scholar] [CrossRef] [PubMed] [Green Version]
  23. Massoud, M.A.; Tarhini, A.; Nasr, J.A. Decentralized approaches to wastewater treatment and management: Applicability in developing countries. J. Environ. Manag. 2009, 90, 652–659. [Google Scholar] [CrossRef] [PubMed]
  24. Parkinson, J.; Tayler, K. Decentralized wastewater management in peri-urban areas in low-income countries. Environ. Urban. 2003, 15, 75–90. [Google Scholar] [CrossRef]
  25. Zhang, D.Q.; Jinadasa, K.B.S.N.; Gersberg, R.M.; Liu, Y.; Ng, W.J.; Tan, S.K. Application of constructed wetlands for wastewater treatment in developing countries—A review of recent developments (2000–2013). J. Environ. Manag. 2014, 141, 116–131. [Google Scholar] [CrossRef] [PubMed]
  26. Wilderer, P.A.; Schreff, D. Decentralized and centralized wastewater management: A challenge for technology developers. Water Sci. Technol. 2000, 41, 1–8. [Google Scholar] [CrossRef]
  27. Jones, R.A.; Lee, G.F. Septic Tank Wastewater Disposal Systems as Phosphorus Sources for Surface Waters. J. Water Pollut. Control Fed. 1979, 51, 2764–2775. [Google Scholar]
  28. Aristi, I.; Von Schiller, D.; Arroita, M.; Barceló, D.; Ponsatí, L.; García-Galán, M.J.; Sabater, S.; Elogesi, A.; Acuna, V. Mixed effects of effluents from a wastewater treatment plant on river ecosystem metabolism: Subsidy or stress? Freshw. Biol. 2015, 60, 1398–1410. [Google Scholar] [CrossRef]
  29. Al-Musawi, T.J.; Mohammed, I.A.; Atiea, H.M. Optimum efficiency of treatment plants discharging wastewater into river, case study: Tigris river within the Baghdad city in Iraq. MethodsX 2017, 4, 445–456. [Google Scholar] [CrossRef] [PubMed]
  30. Jin, Z.; Zhang, X.; Li, J.; Yang, F.; Kong, D.; Wei, R.; Huang, K.; Zhou, B. Impact of wastewater treatment plant effluent on an urban river. J. Freshw. Ecol. 2017, 32, 697–710. [Google Scholar] [CrossRef]
  31. Li, Y.-H.; Li, H.-B.; Sun, T.-H.; Wang, X. Effects of hydraulic loading rate on pollutants removal by a deep subsurface wastewater infiltration system. Ecol. Eng. 2011, 37, 1425–1429. [Google Scholar] [CrossRef]
  32. Quanrud, D.M.; Arnold, R.G.; Wilson, L.G.; Conklin, M.H. Effect of soil type on water quality improvement during soil aquifer treatment. Water Sci. Technol. 1996, 33, 419–431. [Google Scholar] [CrossRef]
  33. Quanrud, D.M.; Hafer, J.; Karpiscak, M.M.; Zhang, J.; Lansey, K.E.; Arnold, R.G. Fate of organics during soil-aquifer treatment: Sustainability of removals in the field. Water Res. 2003, 37, 3401–3411. [Google Scholar] [CrossRef]
  34. Sun, T.; He, Y.; Ou, Z.; Li, P.; Chang, S.; Qi, B.; Ma, X.; Qi, E.; Zhang, H.; Ren, L.; et al. Treatment of domestic wastewater by an underground capillary seepage system. Ecol. Eng. 1998, 11, 111–119. [Google Scholar] [CrossRef]
  35. Viswanathan, M.N.; Al Senafy, M.N.; Rashid, T.; Al-Awadi, E.; Al-Fahad, K. Improvement of tertiary wastewater quality by soil aquifer treatment. Water Sci. Technol. 1999, 40, 159–163. [Google Scholar] [CrossRef]
  36. Reemtsma, T.; Gnirb, R.; Jekel, M. Infiltration of combined sewer overflow and tertiary municipal wastewater: An integrated laboratory and field study on nutrients and dissolved organics. Water Res. 2000, 34, 1179–1186. [Google Scholar] [CrossRef]
  37. Zhang, Z.; Lei, Z.; Zhang, Z.; Sugiura, N.; Xu, X.; Yin, D. Organics removal of combined wastewater through shallow soil infiltration treatment: A field and laboratory study. J. Hazard. Mater. 2007, 149, 657–665. [Google Scholar] [CrossRef] [PubMed]
  38. Van Cuyk, S.; Siegrist, R.; Logan, A.; Masson, S.; Fischer, E.; Figueroa, L. Hydraulic and purification behaviors and their interactions during wastewater treatment in soil infiltration systems. Water Res. 2001, 35, 953–964. [Google Scholar] [CrossRef]
  39. Oudot, J.; Ambles, A.; Bourgeois, S.; Gatellier, C.; Sebyera, N. Hydrocarbon infiltration and biodegradation in a landfarming experiment. Environ. Pollut. 1989, 59, 17–40. [Google Scholar] [CrossRef]
  40. DWA-A 138. Arbeitsblatt DWA-A 138 Planung, Bau und Betrieb von Anlagen zur Versickerung von Niederschlagswasser; DWA: Hennef, Germany, 2005; p. 62. ISBN 978-3-937758-66-4. [Google Scholar]
  41. DIN 4261-1. Small Sewage Treatment Plants—Part 1: Plants for Waste Water Pretreatment; DIN Deutsches Institut für Normung e.V.: Berlin, Germany, 2010; p. 15. [Google Scholar]
  42. DIN 4261-5. Small Sewage Treatment Plants—Part 5: Infiltration of Aerobic Biologically Treated Domestic Wastewater; DIN Deutsches Institut für Normung e.V.: Berlin, Germany, 2012; p. 10. [Google Scholar]
  43. DEKRA. Auswertung Immobilienwirtschaftlicher Daten zu Einfamilienhäusern; DEKRA: Saarbrücken, Germany, 2008; p. 41. [Google Scholar]
  44. KOSTRA-DWD. Software KOSTRA-DWD 2010, Version 3-1, Koordinierte Starkniederschlags-Regionalisierungs-Auswertungen; Deutscher Wetterdienst (DWD), Vertrieb Institut für technisch-wissenschaftliche Hydrologie GmbH: Nürnberg, Germany, 2010. [Google Scholar]
  45. Dostmann, H.; M & S Umwelttechnik GmbH, Plauen, Germany. Personal communication, 2018.
  46. Treskatis, C.; Hein, C.; Peiffer, S.; Hermann, F. Brunnenalterung: Sind Glaskugeln eine Alternative zum Filterkies nach DIN 4924? BBR Fachmag. Brunnen Leitungsbau 2009, 60, 36–44. [Google Scholar]
  47. Lyman, W.J.; Reidy, P.J.; Levy, B. Mobility and Degradation of Organic Contaminants in Subsurface Environments; CK Smoley. Inc.: Chelsea, MI, USA, 1992; p. 416. ISBN 978-0873718004. [Google Scholar]
  48. Meikle, A.; Amin-Hanjani, S.; Anne Glover, L.; Killham, K.; Prosser, J.I. Matric potential and the survival and activity of a Pseudomonas fluorescens inoculum in soil. Soil Biol. Biochem. 1995, 27, 881–892. [Google Scholar] [CrossRef]
  49. Märtner, B.; Gräber, P.-W.; Bergmann sen, M. Verbundprojekt RESS-199-016 ESEK Ganzheitliches System zur Errichtung von Kleinkläranlagen; BMBF-Funded Project: Plauen, Germany, 2013; Available online: https://forschungsinfo.tu-dresden.de/detail/forschungsprojekt/13496 (accessed on 11 September 2018).
  50. Fichtner, T.; Händel, F.; Engelmann, C.; Gräber, P.-W.; Blankenburg, R.; Kuke, C.; Liedl, R.; Märtner, B.; Mansel, H. Laboratory and numerical investigation of biodegradation potential during combined treated waste water and rain water infiltration to minimize of pollution risk. In Proceedings of the International Conference on New Approaches to Groundwater Vulnerability, Ustron, Poland, 4–8 June 2018. [Google Scholar]
  51. DIN EN 12556-3. Small Wastewater Treatment Systems for up to 50 PT—Part 3: Packaged and/or Site Assembled Domestic Wastewater Treatment Plants; German Version EN 12566-3:2016; DIN Deutsches Institut für Normung e.V.: Berlin, Germany, 2016; p. 46. [Google Scholar]
  52. DIN 12556-2. Small Wastewater Treatment Systems for up to 50 PT—Part 2: Soil Infiltration Systems; German Version CEN/TR 12566-2:2005; DIN Deutsches Institut für Normung e.V.: Berlin, Germany, 2007; p. 53. [Google Scholar]
  53. Tomoda, N. Sensibilitätsanalyse Mittels Softwaretool PCSiWaPro® von Hydrogeologischen und Hydrologischen Kenngrößen bei Versickerung von Gereinigten Abwassers aus Kleinkläranlagen. Diploma Thesis, Technische Universität Dresden, Dresden, Germany, 2012. [Google Scholar]
  54. Šejna, M.; Šimůnek, J.; van Genuchten, M.T. The HYDRUS Software Package for Simulating the Two- and Three-Dimensional Movement of Water, Heat, and Multiple Solutes in Variably-Saturated Porous Media; User Manual Version 2.04; PC-Progress: Riverside, CA, USA; Rio de Janeiro, Brazil; Prague, Czech Republic, 2014; p. 305. Available online: https://www.pc-progress.com/en/Default.aspx?h3d-downloads (accessed on 11 September 2018).
  55. Šimůnek, J.; van Genuchten, M.T.; Šejna, M. The HYDRUS Software Package for Simulating the Two- and Three-Dimensional Movement of Water, Heat, and Multiple Solutes in Variably-Saturated Porous Media; Technical Manual 2.0; PC-Progress: Riverside, CA, USA; Rio de Janeiro, Brazil; Prague, Czech Republic, 2012; p. 258. Available online: https://www.pc-progress.com/en/Default.aspx?h3d-downloads (accessed on 11 September 2018).
  56. Richards, L.A. Capillary conduction of liquids through porous mediums. J. Appl. Phys. 1931, 1, 318–333. [Google Scholar] [CrossRef]
  57. Van Genuchten, M.T. A closed-form equation for predicting the hydraulic conductivity of unsaturated soils. Soil Sci. Soc. Am. J. 1980, 44, 892–898. [Google Scholar] [CrossRef]
  58. Mualem, Y. A new model for predicting the hydraulic conductivity of unsaturated porous media. Water Resour. Res. 1976, 12, 513–522. [Google Scholar] [CrossRef]
  59. Gräber, P.-W.; Blankenburg, R.; Kemmesies, O.; Krug, S. SiWaProDSS –Beratungssystem zur Simulation von Prozessen der unterirdischen Zonen. In Simulation in Umwelt-und Geowissenschaften—Workshop Leipzig 2006; Wittmann, J., Müller, M., Eds.; Shaker: Leipzig, Germany, 2006; p. 278. ISBN 978-3-8322-5132-1. [Google Scholar]
  60. Breiman, L. Random Forests. Mach. Learn. 2001, 45, 5–32. [Google Scholar] [CrossRef] [Green Version]
  61. Parkhurst, D.L.; Appelo, C.A.J. User’s Guide to PHREEQC (Version 2)—A Computer Program for Speciation, Batch-Reaction, One-Dimensional Transport, and Inverse Geochemical Calculation; Water-Resources Investigations Report 99-4259; U.S. Geological Survey: Denver, CO, USA, 2006; p. 312. [CrossRef]
Figure 1. Scheme of two possible designs for a closely-spaced infiltration of precipitation water and treated wastewater (treated sewage effluent TSE), not to scale, based on References [40,42].
Water 10 01460 g001
Figure 2. Conceptual reference model for closely-spaced infiltration, observation nodes 1–4, together with mass flux lines 1–4 are also depicted, not to scale.
Water 10 01460 g002
Figure 3. Water contents in the reference model: (I) before precipitation water event, (II) directly after precipitation event, and (III) approximately 0.5 days after the beginning of precipitation event. Flux line 2 is vertically located between the infiltration ditches in the center of the hydraulic barrier.
Water 10 01460 g003
Figure 4. Simulated values of water content θ and relative solute concentration Crel at four selected observation nodes (as depicted in Figure 2 and Figure 3) for the reference scenario and the scenarios GWup and GWlow (groundwater table increased/reduced by 1 m). _P indicates the scenarios with a precipitation event.
Water 10 01460 g004
Figure 5. Simulated values of water content θ and relative solute concentration Crel at four selected observation nodes (as depicted in Figure 2 and Figure 3) for the reference scenario and the scenarios BarD40, BarD80 and BarD160 (with different distances between TSE and precipitation infiltration ditch). _P indicates the scenarios with a precipitation event.
Water 10 01460 g005
Figure 6. (a) Simulated values of cumulated solute mass flux over four flux lines, as shown in Figure 2, for the reference scenario and scenarios Alpha62 and Alpha142 (varying van Genuchten shape parameter α). Note that cumulated mass fluxes could decrease due to reversed mass flux direction. _P indicates the scenarios with a precipitation event. (b) Simulated values of cumulated solute mass flux over the four flux lines, as shown in Figure 2, for the reference scenario and scenarios Klow and Kup (varying water-saturated hydraulic conductivity). Note that the conservative tracer labelled period was adapted for different scenarios of varied hydraulic conductivities. _P indicates the scenarios with a precipitation event.
Water 10 01460 g006
Figure 7. Mean (mean AECrel) and maximum absolute errors (max AECrel) representing scenario (green) and precipitation (blue) sensitivities at four selected observation nodes for the scenario under variation of the van Genuchten shape parameter α. _P has been generally added to scenario abbreviations.
Water 10 01460 g007
Table 1. Precipitation intensities hN of different event durations for a 5-year event at Schöneck i.V. (data: [44]).
Duration (min)510152030456090120
hN (mm)9.714.718.120.724.528.531.534.737.2
Duration (min)1802403605407201080144028804320
hN (mm)41.044.048.753.957.968.275.995.9108.7
Table 2. Input parameters for precipitation infiltration ditch dimensioning after [40].
ParameterValueReference
Effective drained area (m²)315Based on [43]
Water-saturated hydraulic conductivity of subsurface material (m·s−1)2 × 10⁻⁵Field infiltration test at Schöneck i.V. in 2017 by Co. M&S Umweltprojekt GmbH [45]
Safety factor (-)1.2[40]
Length of infiltration ditch (m)7.75Iteratively calculated according to Reference [40]
Height of infiltration ditch (m)2.5Assumption, site-specific
Porosity of gravel pack (-)0.35[46]
Table 3. Spatial extents of the infiltration ditches for precipitation and TSE infiltration, respectively. Height of the precipitation water ditch and TSE infiltration ditch was kept at 2.5 m and 0.5 m, respectively.
Water-Saturated Hydraulic Conductivity (m·s−1)Precipitation Water InfiltrationTSE Infiltration
Bottom Area (m2)Width (m)Length (m)Bottom Area (m2)Width (m)Length (m)
5.0 × 10−624.802.0012.405.000.5010.00
2.0 × 10−515.662.027.754.000.508.00
8.0 × 10−44.901.004.902.000.504.00
Table 4. Investigated scenarios: For every scenario except “Local precipitation on TSE ditch”, a model with and without precipitation event was run. Due to varying travel times, the tracer-labelled period was adapted for scenarios Kup and Klow to create best comparability at locations of observation nodes 2 and 4, and flux line 3. Please note that abbreviation Alpha142 corresponds to a van-Genuchten shape parameter α of 0.0124 cm−1.
ScenarioAbbreviation General Description
ReferenceRefGeneral scenario based on Schöneck i.V.; isotropic; homogeneous
Higher K valueKupWater-saturated hydraulic conductivity of native subsurface material increased from 2 × 10⁻⁵ m·s−1 to 8 × 10⁻⁴ m·s−1
Lower K valueKlowWater-saturated hydraulic conductivity of native subsurface material decreased from 2 × 10⁻⁵ m·s−1 to 5 × 10⁻⁶ m·s−1
AnisotropyAnisoWater-saturated horizontal hydraulic conductivity of native subsurface material and gravel increased by a factor of 10
Layered structureLayIntegration of layer of reduced permeability (Loam after Hydrus 2D/3D soil catalogue) at depth 2–3 m below precipitation water infiltration ditch
Low Alpha value (van Genuchten model)Alpha142
Alpha62
Consideration of strong lateral water movement by a small van-Genuchten retention function shape parameter α of 0.0124 cm−1 and 0.0062 cm−1 instead of 0.124 cm−1 for native subsurface material, respectively
Higher groundwater tableGWupChange groundwater table altitude from 5 m to 4 m below precipitation water infiltration ditch
Lower groundwater tableGWlowChange groundwater table altitude from 5 m to 6 m below precipitation water infiltration ditch
Local precipitation on TSE ditchRainTSEPrecipitation water is infiltrated to TSE ditch (i.e., direct precipitation infiltration with respect to TSE ditch area)
No hydraulic barrierNoBarRemoval of vertical hydraulic barrier between both infiltration ditches; gravel assumed
Natural hydraulic barrierBarD40
BarD80
BarD160
Distance between both infiltration ditches increased to 0.4 m, 0.8 m and 1.6 m, respectively; native subsurface material assumed
Stepped infiltration ditchesStep
Step2
Precipitation infiltration is located 1.25 m and 2.5 m deeper as compared to reference case; hydraulic barrier is fixed for 2.5 m from the top of TSE infiltration ditch