Article

Migration of Gyrotactic Micro-Organisms in Water

State Key Laboratory of Simulation and Regulation of Water Cycle in River Basin, China Institute of Water Resources and Hydropower Research, Beijing 100038, China
*
Author to whom correspondence should be addressed.
Water 2018, 10(10), 1455; https://doi.org/10.3390/w10101455
Submission received: 30 August 2018 / Revised: 9 October 2018 / Accepted: 12 October 2018 / Published: 15 October 2018
(This article belongs to the Section Water Quality and Contamination)

Abstract

:
Understanding the swimming characteristics of micro-organisms is significant for modelling the migration of motile cells and corresponding ecological risk assessments associated with harmful algae in oceans and estuaries. Presented in this paper is an experimental and numerical investigation of swimming characteristics of a typical gyrotactic micro-organism, Heterosigma akashiwo (H. akashiwo) in water, based on the technology of planar laser-induced fluorescence and the finite volume method. Two-dimensional swimming velocity of algal cells are obtained by analyzing cells’ trajectories in the vertical plane, and three-dimensional swimming velocity is reconstructed based on the assumption that cells’ swimming is isotropic in the horizontal plane. Four important parameters are given to reflect the swimming characteristics of gyrotactic cells in still water, including the mean swimming speed (Vs = 146 μm/s), the relative strength of reorientation by gravitational torque to rotational diffusion (λ = 1.96), the time scale of reorientation (B = 5.6 s), and rotational diffusivity (Dr = 0.046 rad2/s). A database of the ambient vorticity, mean swimming velocity and diffusivity tensor is established, by solving Fokker-Planck equation for the probability density function of cells’ swimming under the combined action of gravity, rotational diffusion, and the ambient vorticity. The mean swimming velocity and translational diffusion tensor of H. akashiwo are found to change with the horizontal and vertical vorticity. It is also shown that gyrotactic cells swim in a given direction for a weak horizontal vorticity, in contrast to cells’ tumbling and being trapped for a strong horizontal vorticity.

1. Introduction

Gyrotactic micro-organisms are one type of motile micro-organisms widely existing in aqueous environments, such as oceans, lakes, rivers, and reservoirs, which can swim in a particular direction in fluid flowing with a weak horizontal vorticity (or tumble unsteadily in the fluid with strong horizontal vorticity) [1]. The swimming characteristics of gyrotactic micro-organisms are essential to understand various ecological phenomena associated with bioconvection [1,2,3,4], algal patches [5,6], thin phytoplankton layers [7], harmful algal blooms [8,9,10], etc.
Regarding the swimming characteristics of gyrotactic micro-organisms, there have been various theoretical, numerical, and experimental studies with focus on typical species, such as Heterosigma akashiwo [11,12], Chlamydomonas nivalis (C. nivalis) [1,2,13,14], Chlamydomonas reinhardtii (C. reinhardtii) [15,16,17], Dunaliella salina (D. salina) [18], etc. H. akashiwo is one typical gyrotactic micro-organism in red tide, which is a serious threat for fish, shellfish, etc. if they greatly accumulate in ambient water bodies [19,20]. Previous studies showed that the swimming behavior of H. akashiwo, such as, swimming modes, swimming speed, vertical swimming velocity, and turning rate were influenced by light, halocline [21], pH [22], salinity [8,23], predators [12,23,24], and strains [25,26].
Three typical parameters to characterize the swimming behavior of gyrotactic micro-organisms are the mean swimming speed Vs, the rotational diffusion coefficient Dr, as well as the time scale B for cells’ reorientation by the gravitational torque against the viscous torque caused by flow shear. Several ways have been adopted to obtain these parameters based on microscope-based tracking methods [13,27,28], laser-based tracking methods [29,30], and video-based tracking methods [12,21,31], in which a key point is to capture the trajectories of cells for statistical analysis. The microscope-based tracking method can provide a high spatial resolution for cells’ trajectories, while the laser-based and video-based tracking methods can offer a large field of view which is beneficial to track more trajectories each time. Hill and Häder [13] proposed a biased random walk model to calculate the swimming direction and rotational diffusion coefficient of micro-organisms. Leptos et al. [32] measured the swimming velocity and compared the diffusion of C. reinhardtii and Brownian motion of passive particles. Croze et al. [18] measured the gyrotactic parameters of D. salina in the still water. Recently, Sengupta et al. [26] investigated the time scale for reorientation of different strains of H. akashiwo.
Many efforts have been made to understand the swimming characteristics and distribution of gyrotactic micro-organisms in various flows, such as Poiseuille flow [33,34], horizontal shear flow [7], steady vortical flow [5,35], density stratified flow [36], free surface flow [37,38], as well as the flow past a single vertical circular cylinder [14]. The gyrotaxis of microorganisms was first observed and analyzed by Kessler [33]. A generalized analysis and model were given by Pedley and Kessler [1,2]. Recently, some important phenomena in turbulence are found to depend on the gyrotaxis of microorganisms [35,37,38,39,40], including the formation of a thin phytoplankton layer caused by gyrotactic trapping [7,10], the microscale patches of motile phytoplankton [5,35], accumulation at free water surface [37,38,41,42], turbulent channel flows in photobioreactors [43], etc. Results show that the swimming of gyrotactic phytoplankton species is influenced by gravitational torque and the viscous torque induced by flow shear in the fluid flowing with non-zero vorticity. However, up-to-date, the rotational diffusion coefficient, the relative strength of reorientation by gravitational torque to rotational diffusion and the swimming characteristics of H. akashiwo in a three-dimensional vorticity field have not been understood very well, especially the swimming direction and translational diffusion under the combined action of horizontal and vertical vorticity, although they are very important for the prediction of corresponding concentration distribution.
This work is to investigate the swimming characteristics of H. akashiwo in still fluid and the three-dimensional vorticity field. The specific objects are: (1) to measure the fluorescence spectrum of H. akashiwo, (2) to obtain the swimming speed and direction, (3) to analyze the relative strength of reorientation to rotational diffusion, (4) to obtain the typical values of B and Dr, and (5) to calculate the mean swimming velocity and translational diffusion tensor in three-dimensional vorticity field.

2. Materials and Methods

2.1. Experimental Setup

The experimental setup in the present work was based on the design of an experimental setup by Vladimirov et al. [30], and some modifications were made according to the swimming speed of H. akashiwo. The experimental system mainly consisted of a test tube, an acrylic box, an imaging system, an injection system, and a planar laser with wavelength of 447 nm (MDL-F-447NM-3.5 W-1601, Changchun New Industries Optoelectronics Technology, Changchun, China), as shown in Figure 1. The test tube (15 mm × 15 mm × 190 mm) was modified based on that used by Vladimirov et al. [30], which was located in an acrylic box (200 mm × 200 mm × 300 mm) full of water to maintain a thermostatic environment. Two thin rubber tubes that threaded through the sides of acrylic box were respectively connected with the inlet and outlet of the test tube. The 1.5 mm-thick laser sheet was used to illuminate cells in the centerplane of the test tube, which was controlled by a synchronizer to ensure that the cells were only illuminated during the exposure time. The imaging acquisition system consisted of a 16-bit CMOS (Complementary Mental Oxide Semiconductor) camera (PCO.edge 5.5, Intelligent Laser Applications of Germany, Aachen, Germany) with a resolution of 2048 × 2048 pixels, a lens (EF-S 60 mm f/2.8 USM, Canon, Tokyo, Japan), a 550 nm high-pass filter (Beijing JJAM Technology Limited corporation, Beijing, China), and an imaging analysis software (CamWare, Intelligent Laser Applications of Germany, Aachen, Germany). The injection system included a syringe pump (Pump 11 elite, Harvard Apparatus, Holliston, MA, USA) and injection syringes (Himilton, Reno, NV, USA) with various capacities, which was connected with the rubber tube to provide fluid for the test tube.
The swimming speed of H. akashiwo measured in the present paper was larger than that measured by Hill and Häder [13], and the test tube in the present work was extended in the length and width compared with that of Vladimirov et al. [30] to suit the faster cells. The measurement area (14.23 mm × 14.23 mm) was located 140 mm away from the bottom of the test tube. The design of the test tube considered the swimming speed of the motile cells and the injection time to weaken the influence of the injection on the fluid in the test tube.
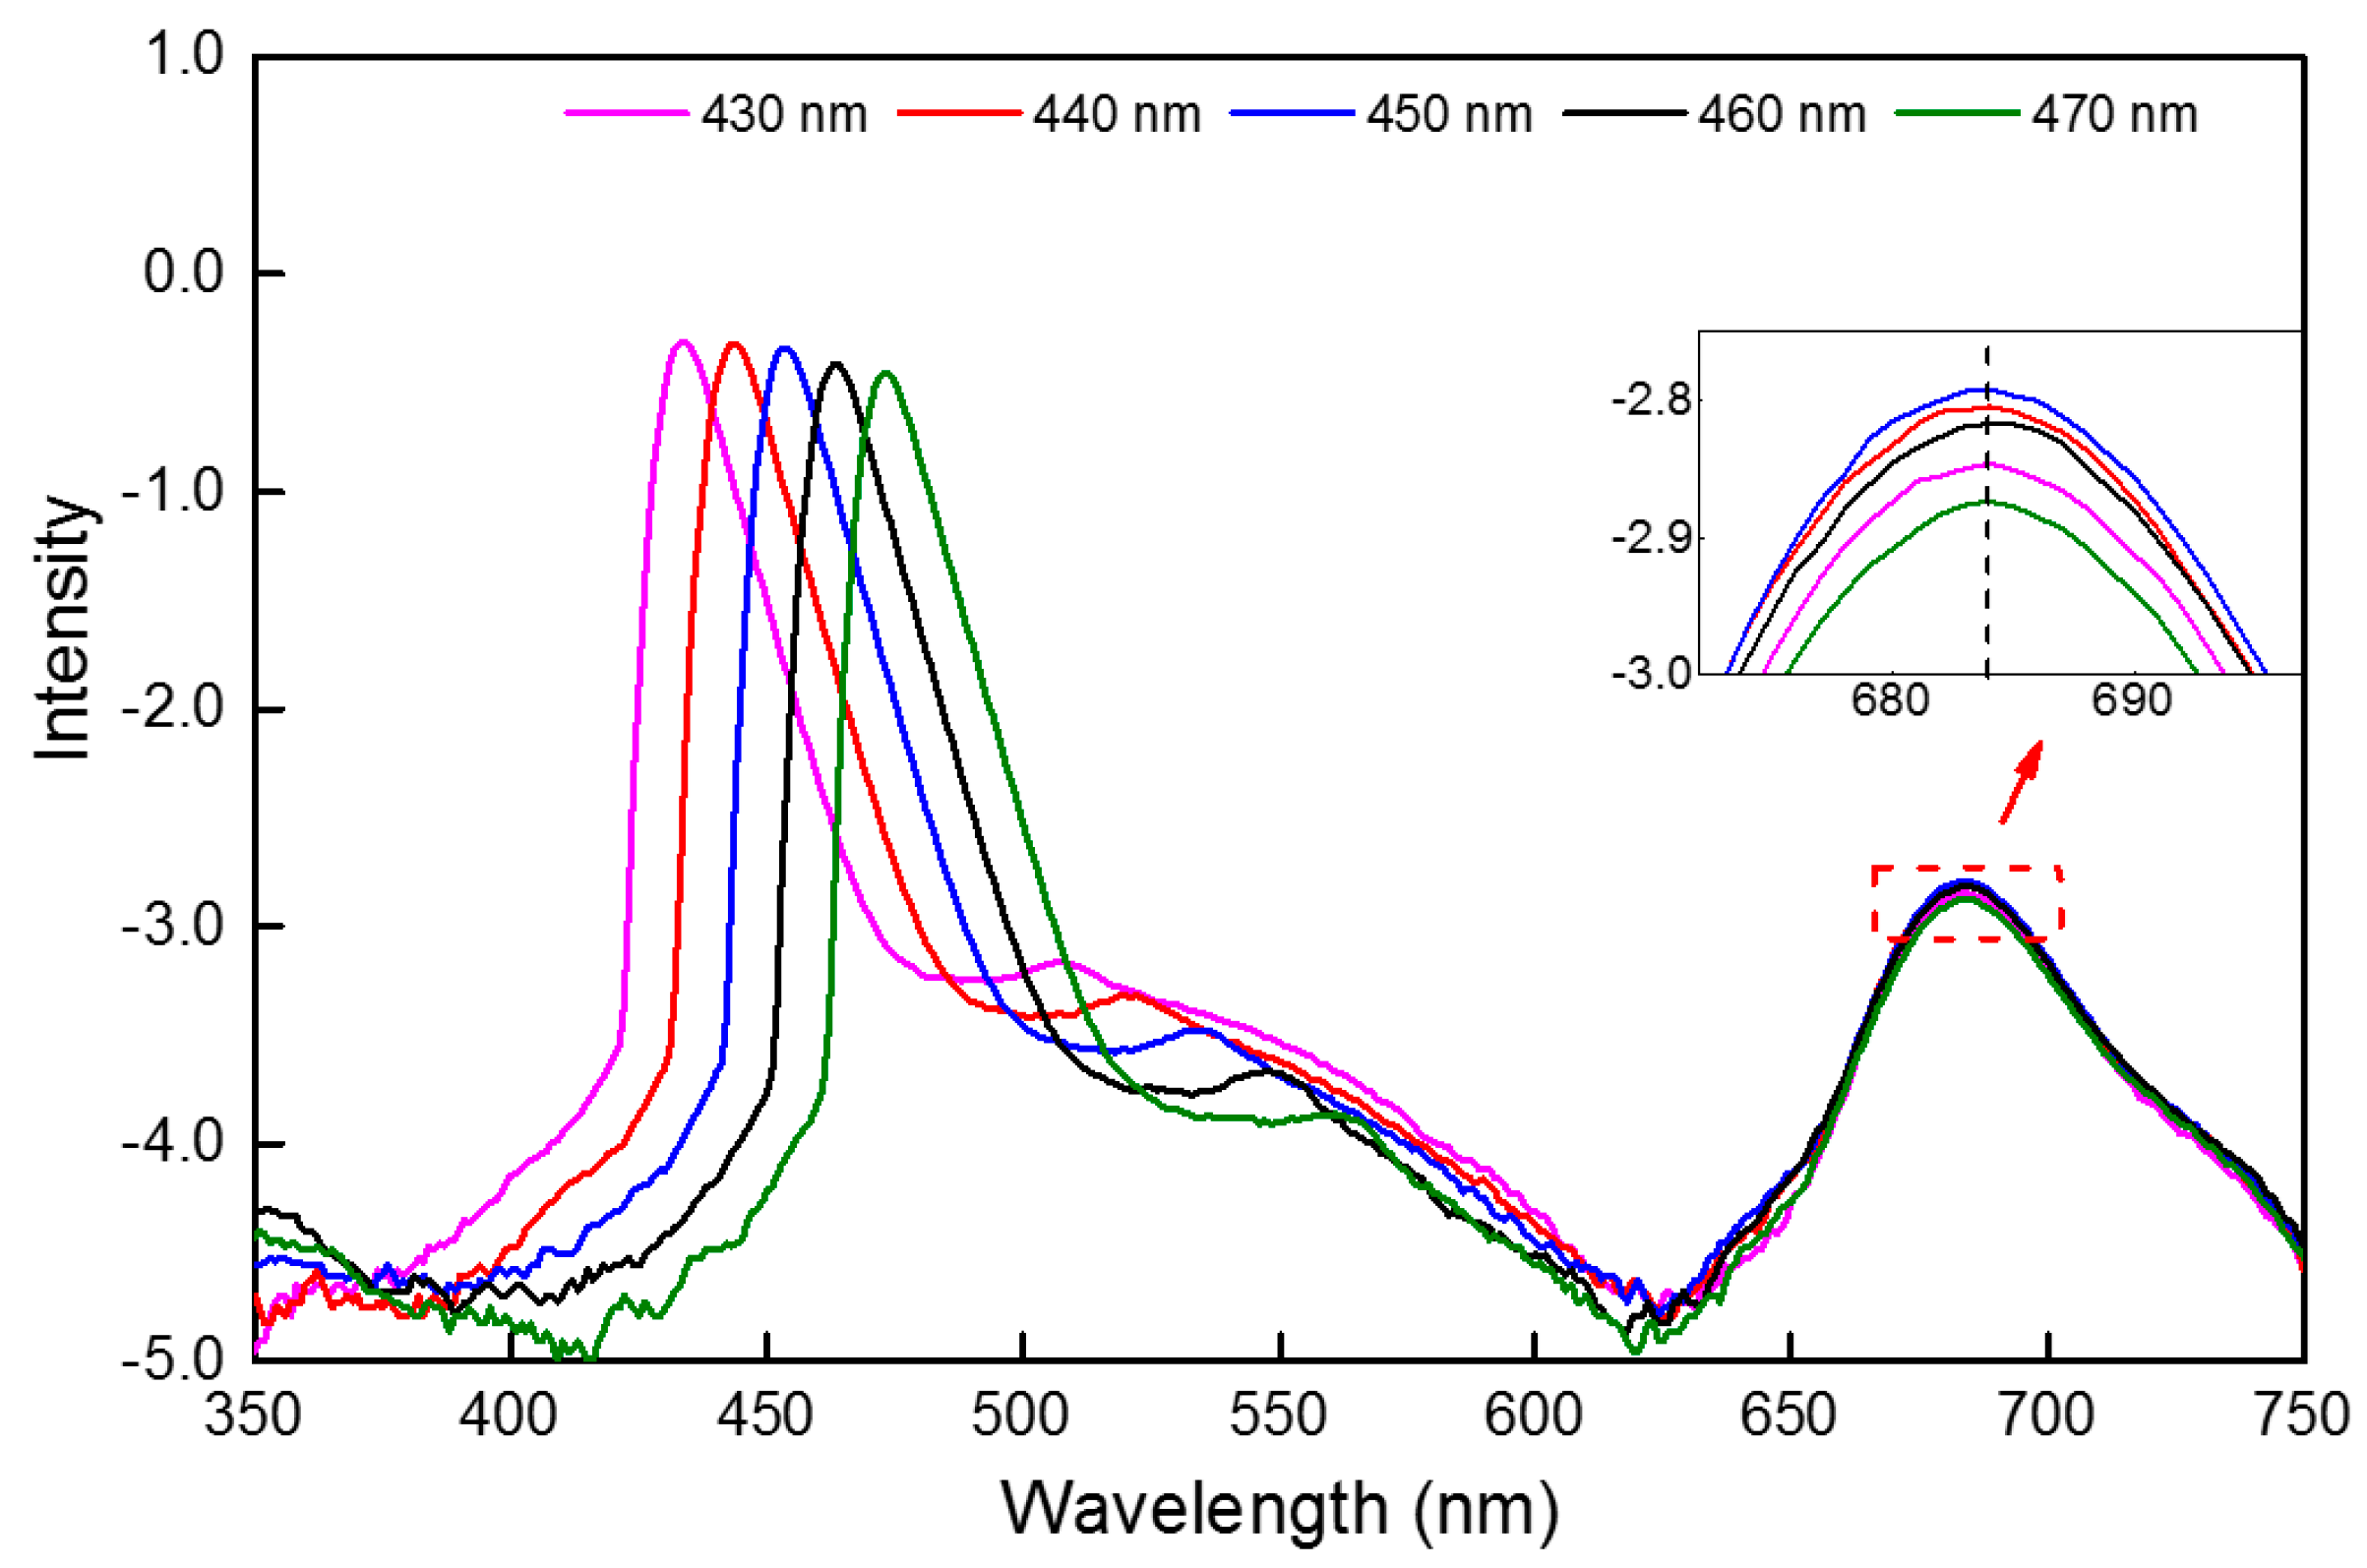
The trajectories of H. akashiwo could be recorded by camera due to its fluorescent characteristics under the illumination of a laser with an appropriate wavelength. One preliminary work in the present paper was to measure the fluorescence spectrum of H. akashiwo using a fluorescence spectrophotometer (F-7000 FL, HITACHI, Tokyo, Japan). The cells were stimulated by the laser with various wavelengths, and the optimum wavelength that made the fluorescent intensity of cells reach its maximum was selected from 430–470 nm, as shown in Figure 2. The horizontal and vertical axes respectively represent the wavelength and the logarithm of the normalized light intensity. The left five peaks were from the excitation light, and the peaks that almost coincide in the right were from the emission light by the algae. The enlarged peaks in the inset show that under the illumination of 450 nm laser, the emission of H. akashiwo has the maximum peak, and the peak of fluorescence spectrum locates at 685 nm. Thus, a laser with a wavelength 447 nm and 550 nm high-pass filter were selected in the present work, and all the experiments in present paper were performed in a dark environment to eliminate interference from other lights.
The experimental materials included algal cells (H. akashiwo, Shanghai Guangyu Biological Technology Co., Ltd., Shanghai, China) and f/2 medium. The algal cells were incubated at 25 °C in f/2 medium, and the daily cycle was 12 h of white light (3000 lux) and 12 h in the dark. The cells used for experiments were taken from the upper layer of suspensions which were vibrated for 5 min and stood for 30 min. Cell suspensions were prepared by diluting algal culture with f/2 media to attain a cell concentration of ~5 × 10⁴ cells/mL. All the experiments in this work were carried out during the first half of the algae’s daytime to keep the same swimming characteristics. The tests were performed according to the following procedures. Firstly, the acrylic box and the test tube were filled with water and the filtered f/2 medium at the same temperature, respectively. After 1 h, the fluid in the tube was completely still. Then suspensions of cells (3.5 mL) were continuously injected into the tube by a discharge of 1.5 μL/s, which ensured mean rising velocity of the water surface in the test tube was no more than 7 µm/s. The algal cells arrived at the bottom of the test tube when the injection was finished, and we marked this moment as t = 0 min. The number of motile cells in the measured zone at t = 20 min is adequate to get reasonable statistics, and therefore, the first set of images (30 successive frames) were recorded at t = 20 min, with a 50 ms exposure time. Then images were taken every 5 min for an hour with the camera and laser keeping the same setting. The above operation was one test, and three tests were performed over the whole experiment.

2.2. Image Processing and Analysis Methods

A sample of individual cells was recorded in each frame with a spatial resolution 6.95 μm/pixel, as shown in Figure 3a. The trajectories of cells shown in Figure 3b were obtained by overlaying 30 successive images. Each trajectory, containing several walks, is defined as a track, as shown in Figure 3c. In the present work, 13,684 tracks in 3 tests were collected, and 6292 tracks that contain at least 10 walks were selected to calculate the swimming velocity and direction.
Consider a Cartesian coordinate system with x-axis parallel to the laser sheet, y-axis perpendicular to the plane of laser sheet, and z-axis vertical upward along the axis of the test tube. The swimming velocity of cell (Vx, Vz) is calculated by
  V x = K x k x k 1 Δ t  
  V z = K z k 1 z k Δ t  
where (xk, zk) and (xk−1, zk−1) are the pixel positions of algal cells on the k-th frame and k−1-th frame, K (6.95 μm/pixel) is the conversion coefficient between pixel and physical coordinates, and Δt (0.5 s) is the time interval between two continuous images. We assume that the swimming velocity of cells in the x-y plane is isotropic (Vx = Vy), and the resultant speed (V) is defined as
  V = V x 2 + V y 2 + V z 2 = 2 V x 2 + V z 2 = V r 2 + V z 2  
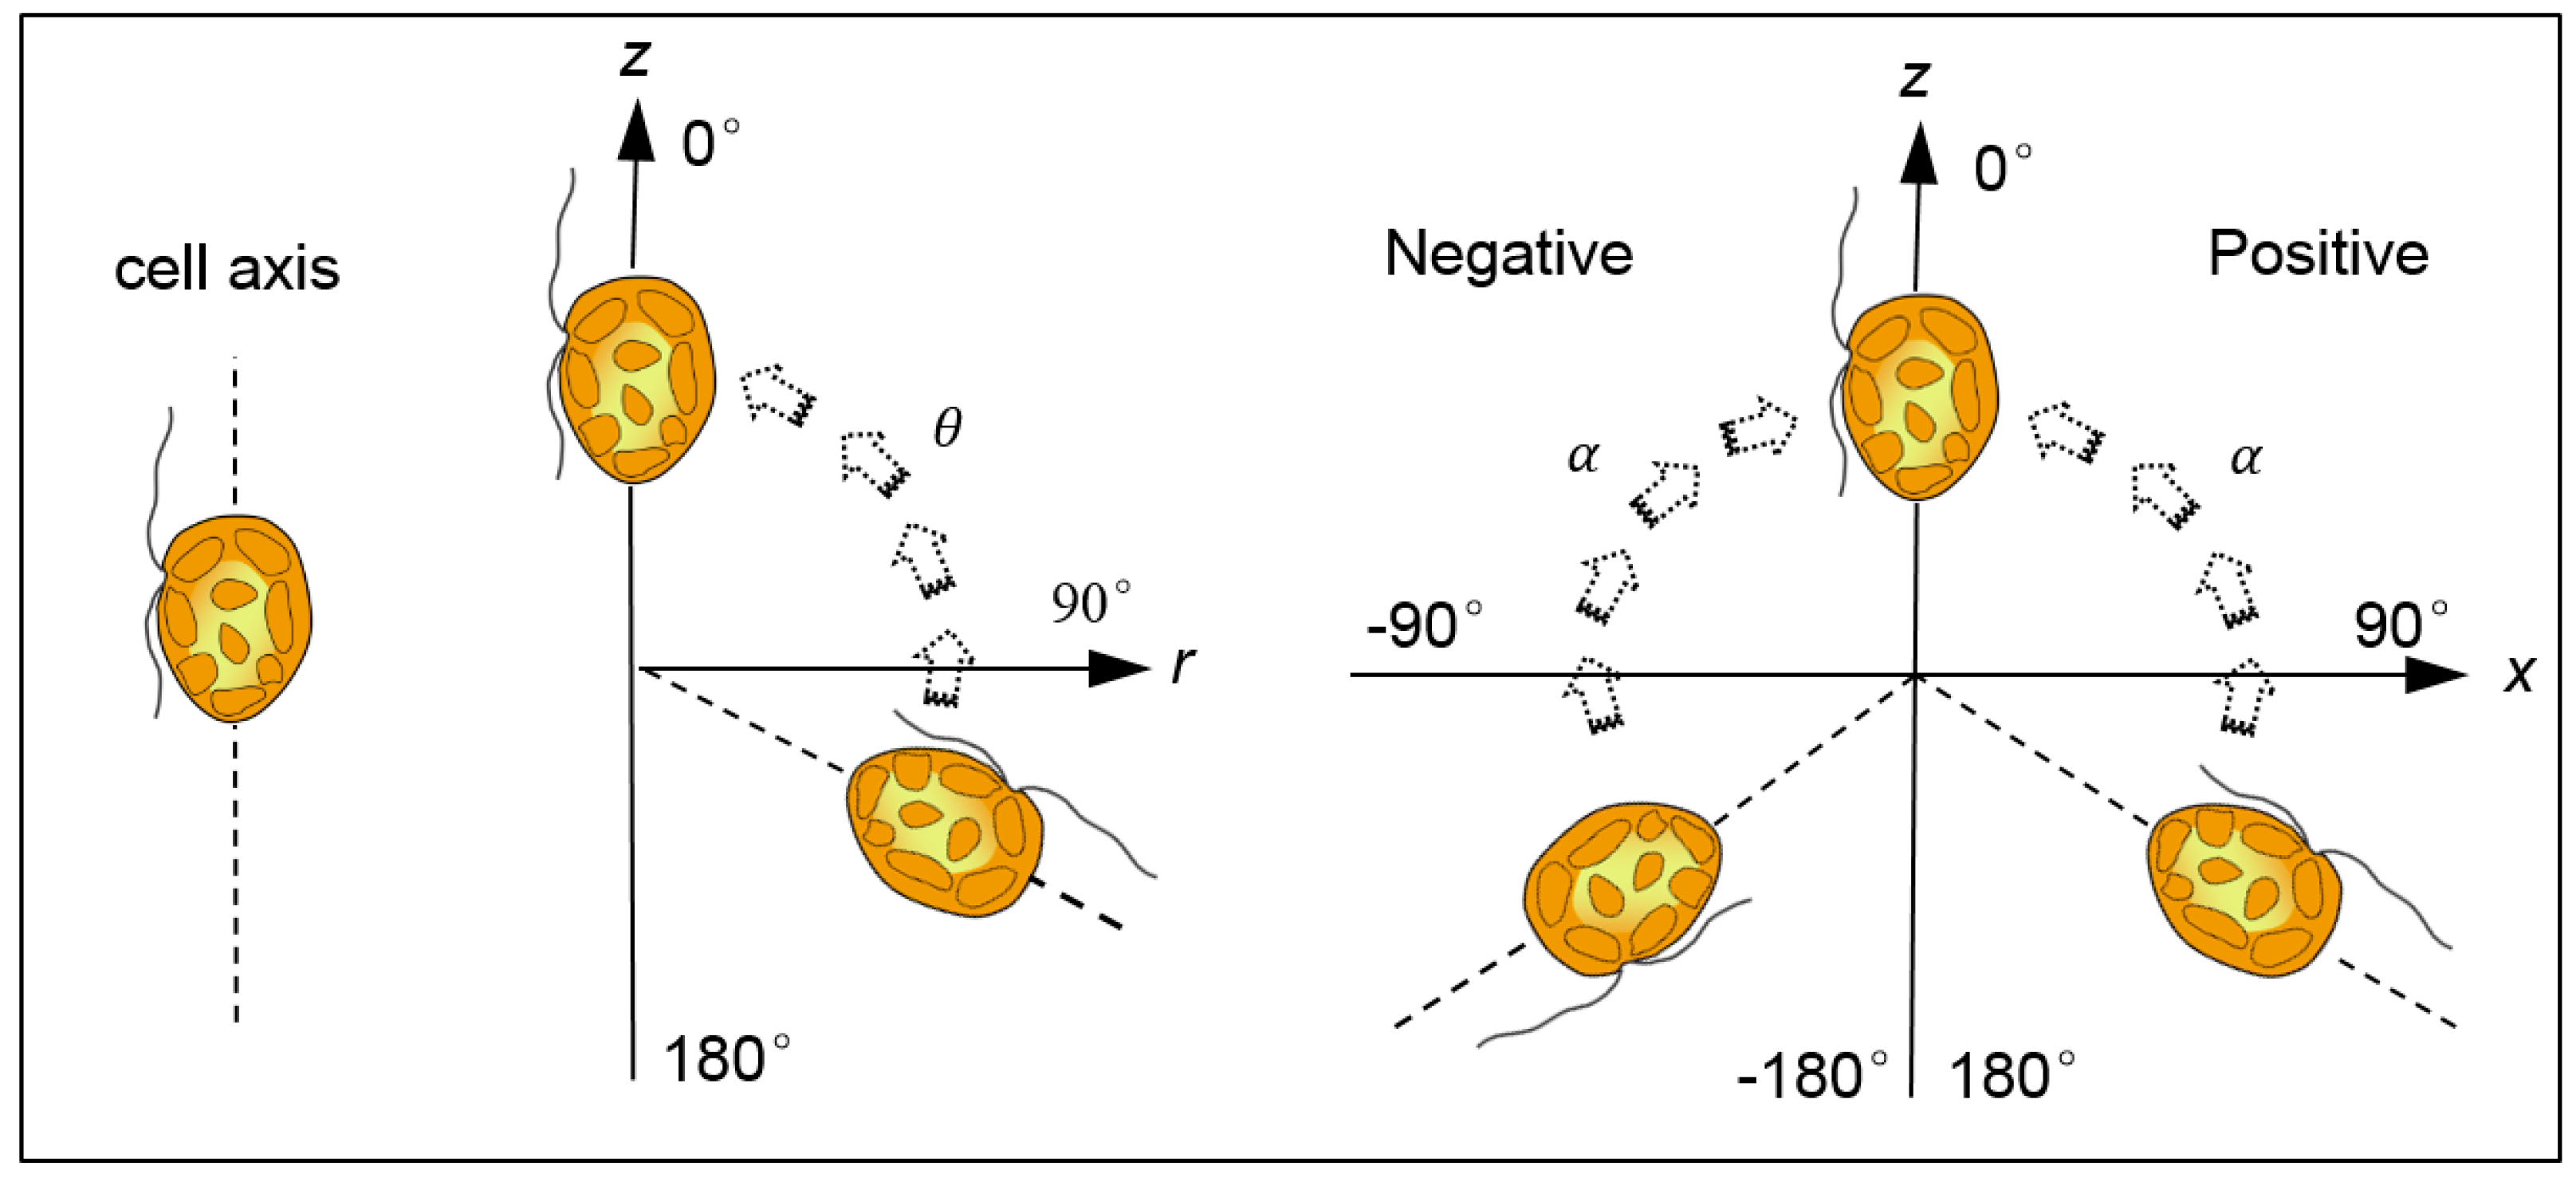
where Vr is the total swimming velocity in the x-y plane, and the r-axis is determined by (Vx, Vy, 0). The swimming direction of motile cells in r-z plane and x-z plane are defined as θ (0~180°) and α (−180°~180°), respectively, as shown in Figure 4.
  θ = arctan V r V z                    ( V z > 0 )  
  θ = π 2                                   ( V z = 0 )  
  θ = π + arctan V r V z             ( V z < 0 )  
  α = arctan V x V z                     ( V z 0 )    
  α = π 2                      ( V x > 0 ,   V z = 0 )     
  α = π 2                  ( V x < 0 ,   V z = 0 )       
V, Vx, and Vz calculated by Equations (1)–(3) are divided into square bins of width Δv = 10 μm/s to obtain probability density function (PDF) of swimming velocity,
  f i = n i k · N 0 · Δ v  
  f i j = n i j k · N 0 · Δ v 2  
where k (the value is 10) is the number of walks in one track, N0 is the number of tracks in Table 1, ni is the number of walks in the i-th bin for velocity ranging from [i × Δv, (i + 1) × Δv], and nij is the number of walks that Vx and Vz located in the i-th and j-th bins. Discrete values of fi and fij constitute the one-dimensional f(Vx), f(Vz), f(V) and two-dimensional probability density function f(Vx, Vz). f(V, θ) are obtained by use of the same computational method as above.

2.3. Fokker-Planck Model

We assume that the swimming speed of cells, Vs (equate to V in Section 2.2) is constant independent of the swimming direction p. The mean swimming velocity Vc can be computed as [2]
  V c = V s p = V s p  
  · · f ( p ) d 2 p  
where f(p) is probability density function of swimming direction of H. akashiwo. The cell’s translational diffusivity tensor D is given by [2]
  D = V s 2 τ [ p p p p ]  
where τ is the correlation time. In this work, the translational diffusion coefficient is computed based on the Equation (14). Here, the correlation time, for simplicity, is assumed to be constant following the work [2]. However, the constant correlation time is not a good approximation for all flow conditions, especially for the flow with a high shear rate. A better approximation is given by ’generalised Taylor dispersion theory’ [43,44,45,46,47]. Hwang and Pedley [3] gave detailed comments on the Equation (14) and the generalised Taylor dispersion theory.
The probability density function of swimming direction, f(p), satisfies the Fokker-Planck (FK) equation:
  f t + · ( p ˙ f ) = D r 2 f  
where ▽ is the gradient operator in p-space, p ˙ is the gyrotactic reorientation rate, and Dr is the rotational diffusivity. For spherical cells (e.g., H. akashiwo), p ˙ is given, for the weak fluid acceleration, by
  p ˙ = 1 2 B [ k ( k · p ) p ] + 1 2   ω p  
where k is the unit vector in the vertically direction, B is the reorientation time of gyrotactic H. akashiwo, and ω is the vorticity of ambient flow.
Equation (15) is solved based on the finite volume method [14]. The initial uniform distribution of probability density (1/4 π ) is specified, and the periodical boundary condition f ( θ , 0 , t ) = f ( θ , 2 π , t ) , is specified. In the present paper, the vorticity is inputted as a parameter of Equation (15). Equation (15), with the same initial and boundary conditions, is solved for a set of vorticities (wx, wy, wz), to obtain the relationship of the mean swimming velocity and the translational diffusivity tensor.

3. Results

3.1. Swimming Velocity and Direction Distribution

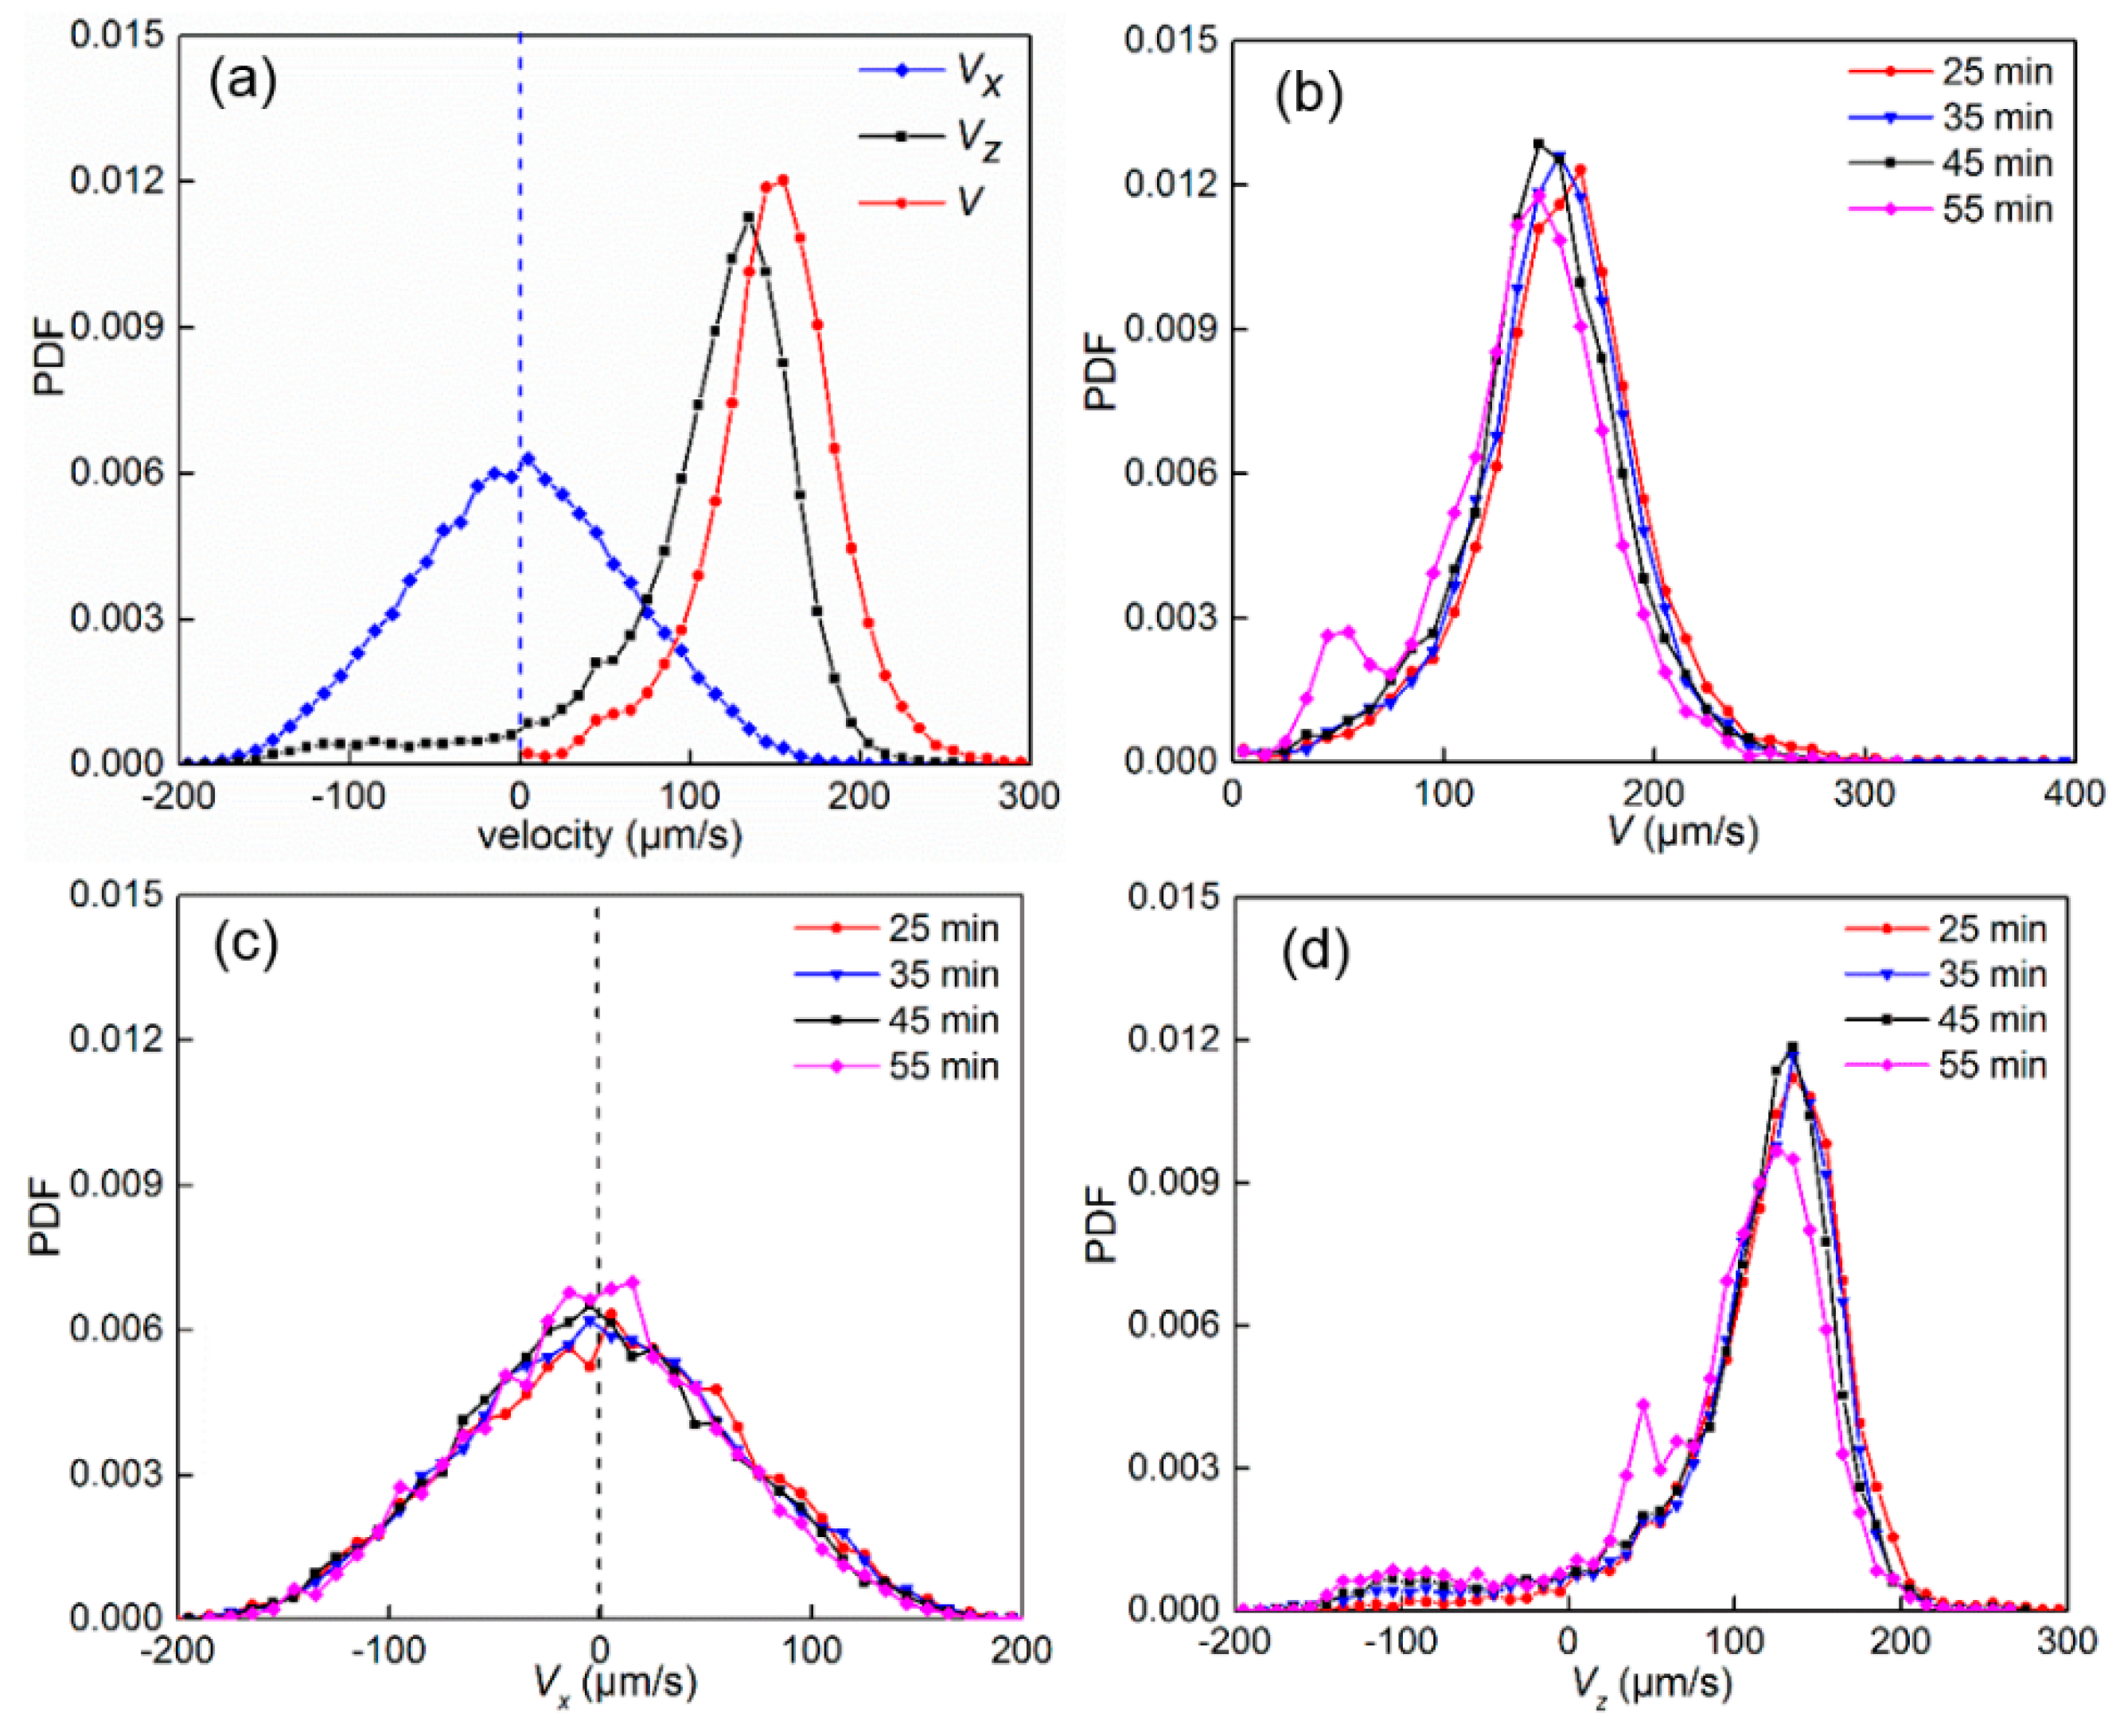
The one-dimensional distribution of probability density function of swimming velocity in all tests is shown in Figure 5a with the average value of V, Vx, Vz locating at 143.57, 0.37, 104.54 µm/s. The f(Vx) is approximately subjected to Gaussian distribution f ( V x ) = 1 / 2 π σ · e V x 2 / ( 2 σ 2 ) , where σ = 62.82. The PDFs for V, Vx and Vz at different time are shown in Figure 5b–d, which change little over time (20–50 min).
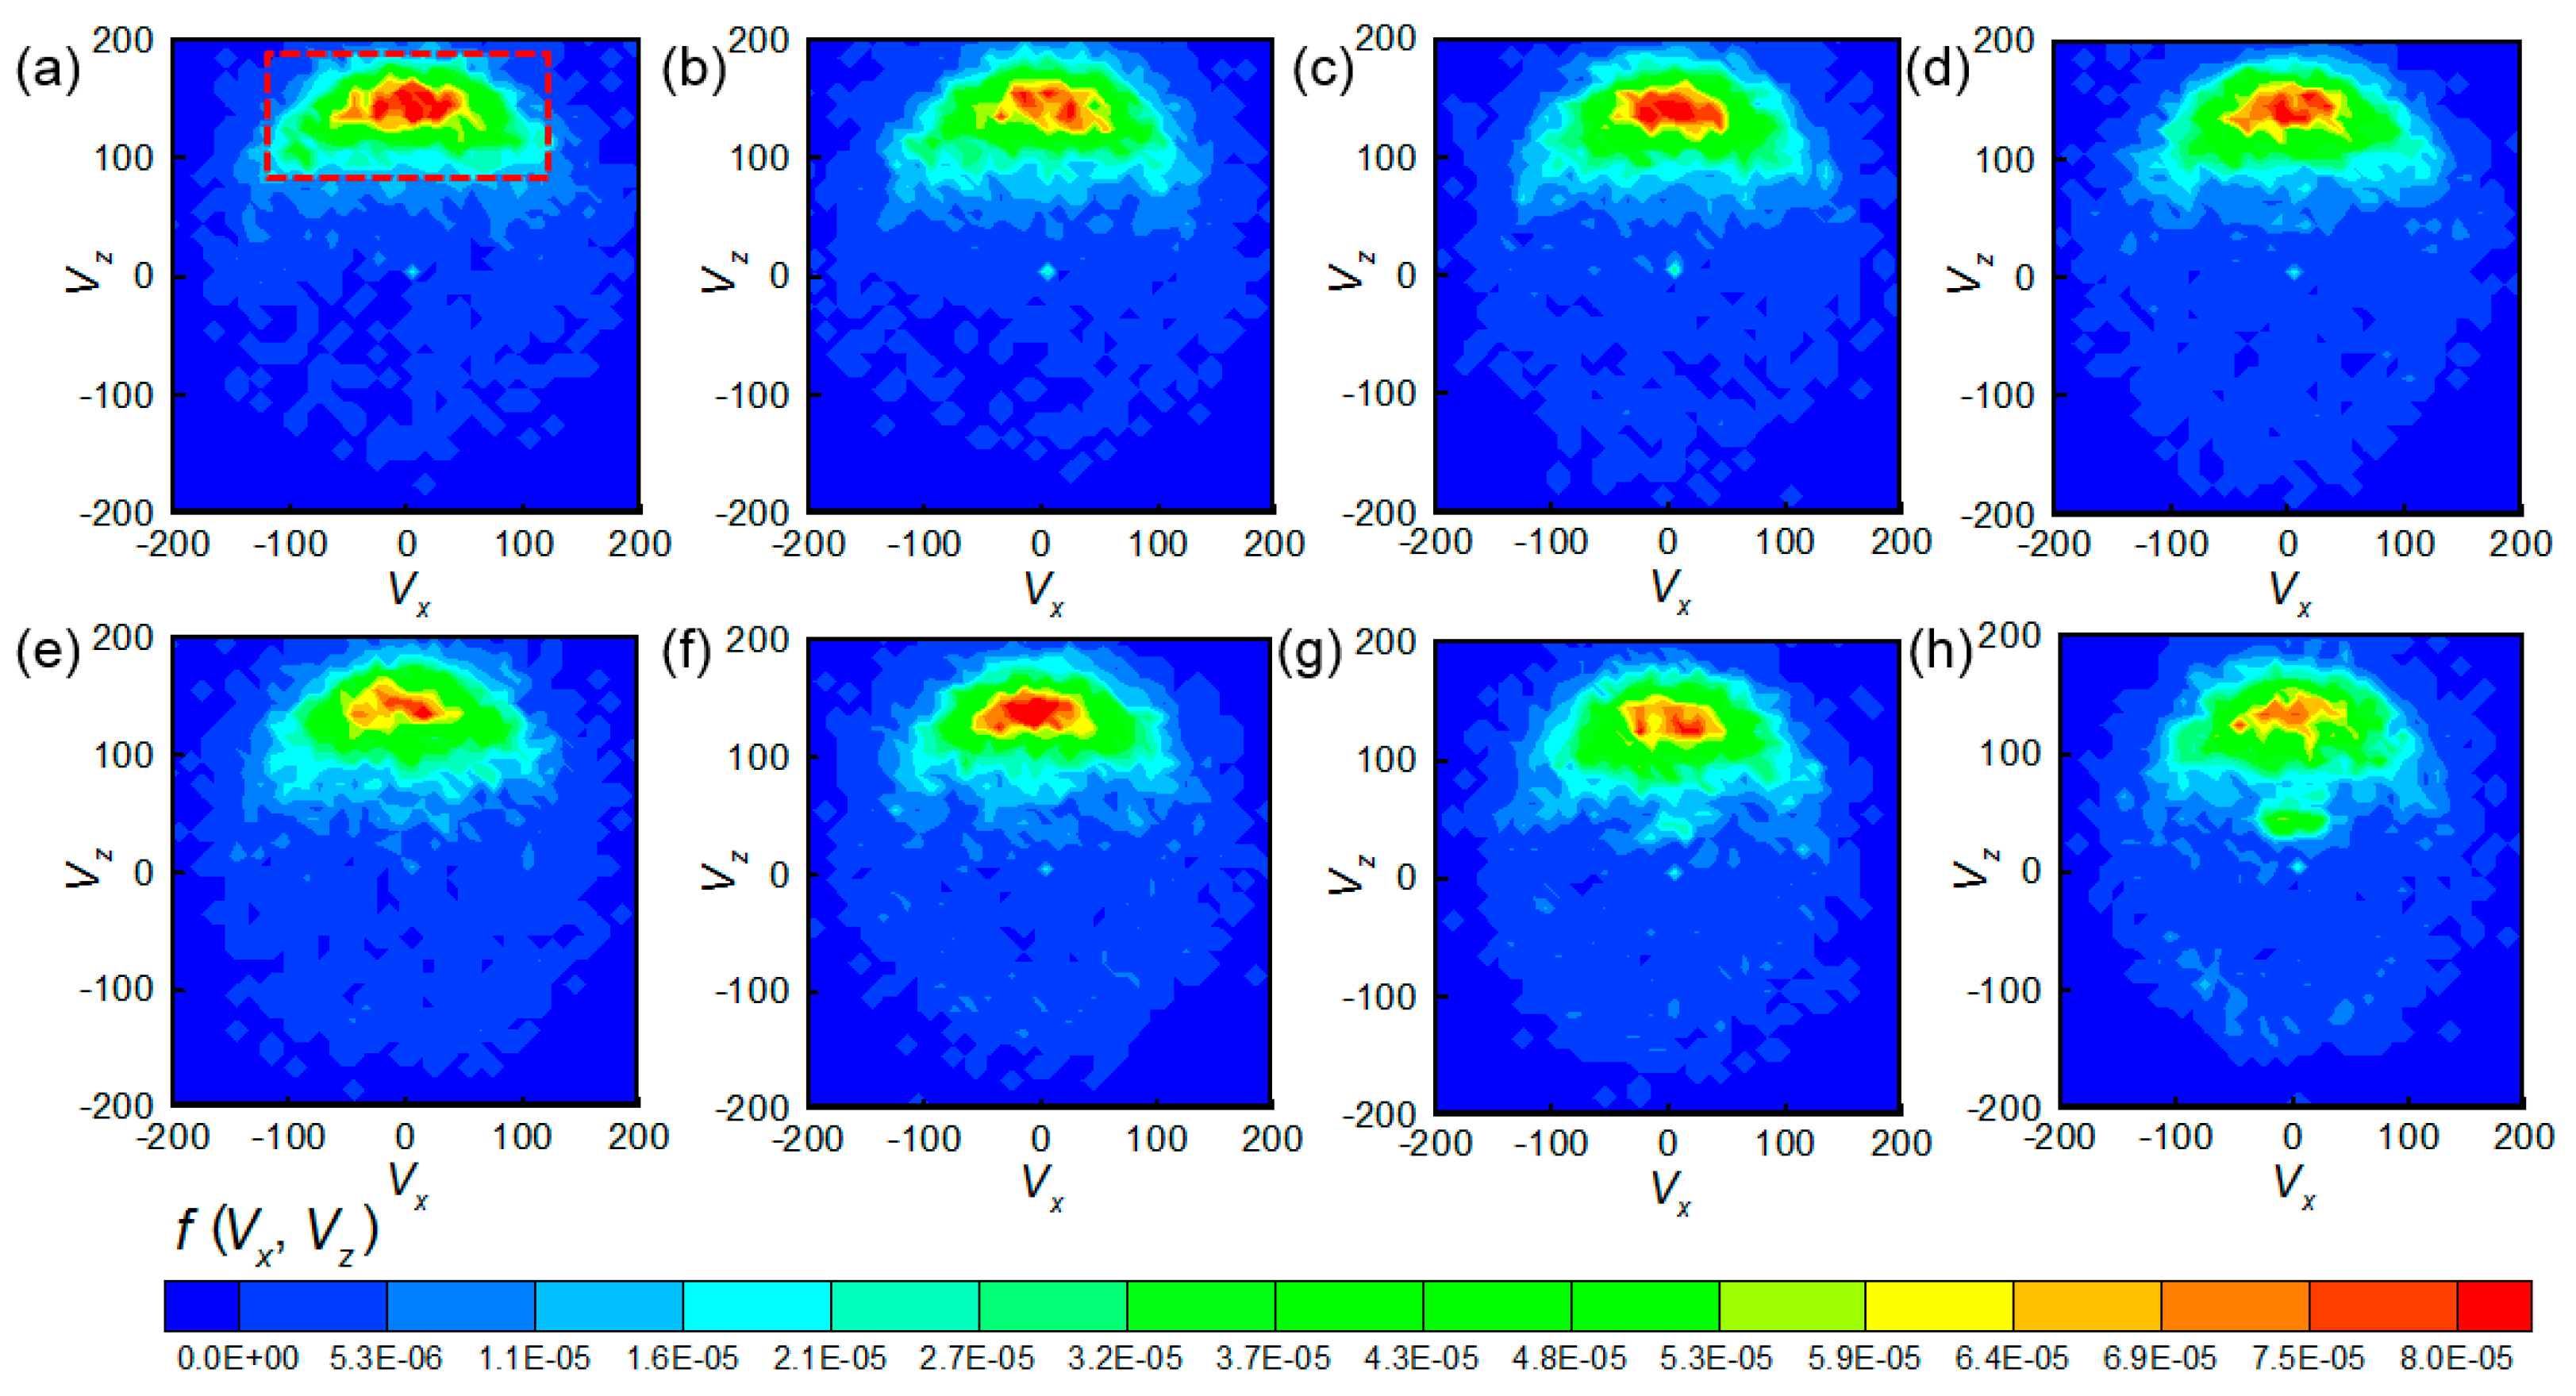
The distributions of f(Vx, Vz) in the x-z plane at 20–55 min are shown in Figure 6, in which the areas with high probability density are similar to the shape of mushrooms. The value of Vx is mainly within [−80, 80] µm/s with the symmetric axis around Vx = 0 µm/s, while Vz is basically above 80 µm/s. It is obvious that the spatial distribution is less clustered at t = 55 min with the accumulated area surrounded by red, dashed line extending in the z-direction and narrowing in the x-direction, as shown in Figure 6a,h.
The mean swimming velocities, standard deviations (σ), and deviation coefficient (Cs) are computed with Equations (17)–(19),
  U ¯ = 1 k N i j = 1 k N i U j       i = 1 ,   2 ,   , 8  
  σ = j = 1 k N i ( U j U ¯ ) 2 / ( k N i )  
  C s = j = 1 k N i ( U j U ¯ ) 3 / ( k N i σ 3 )  
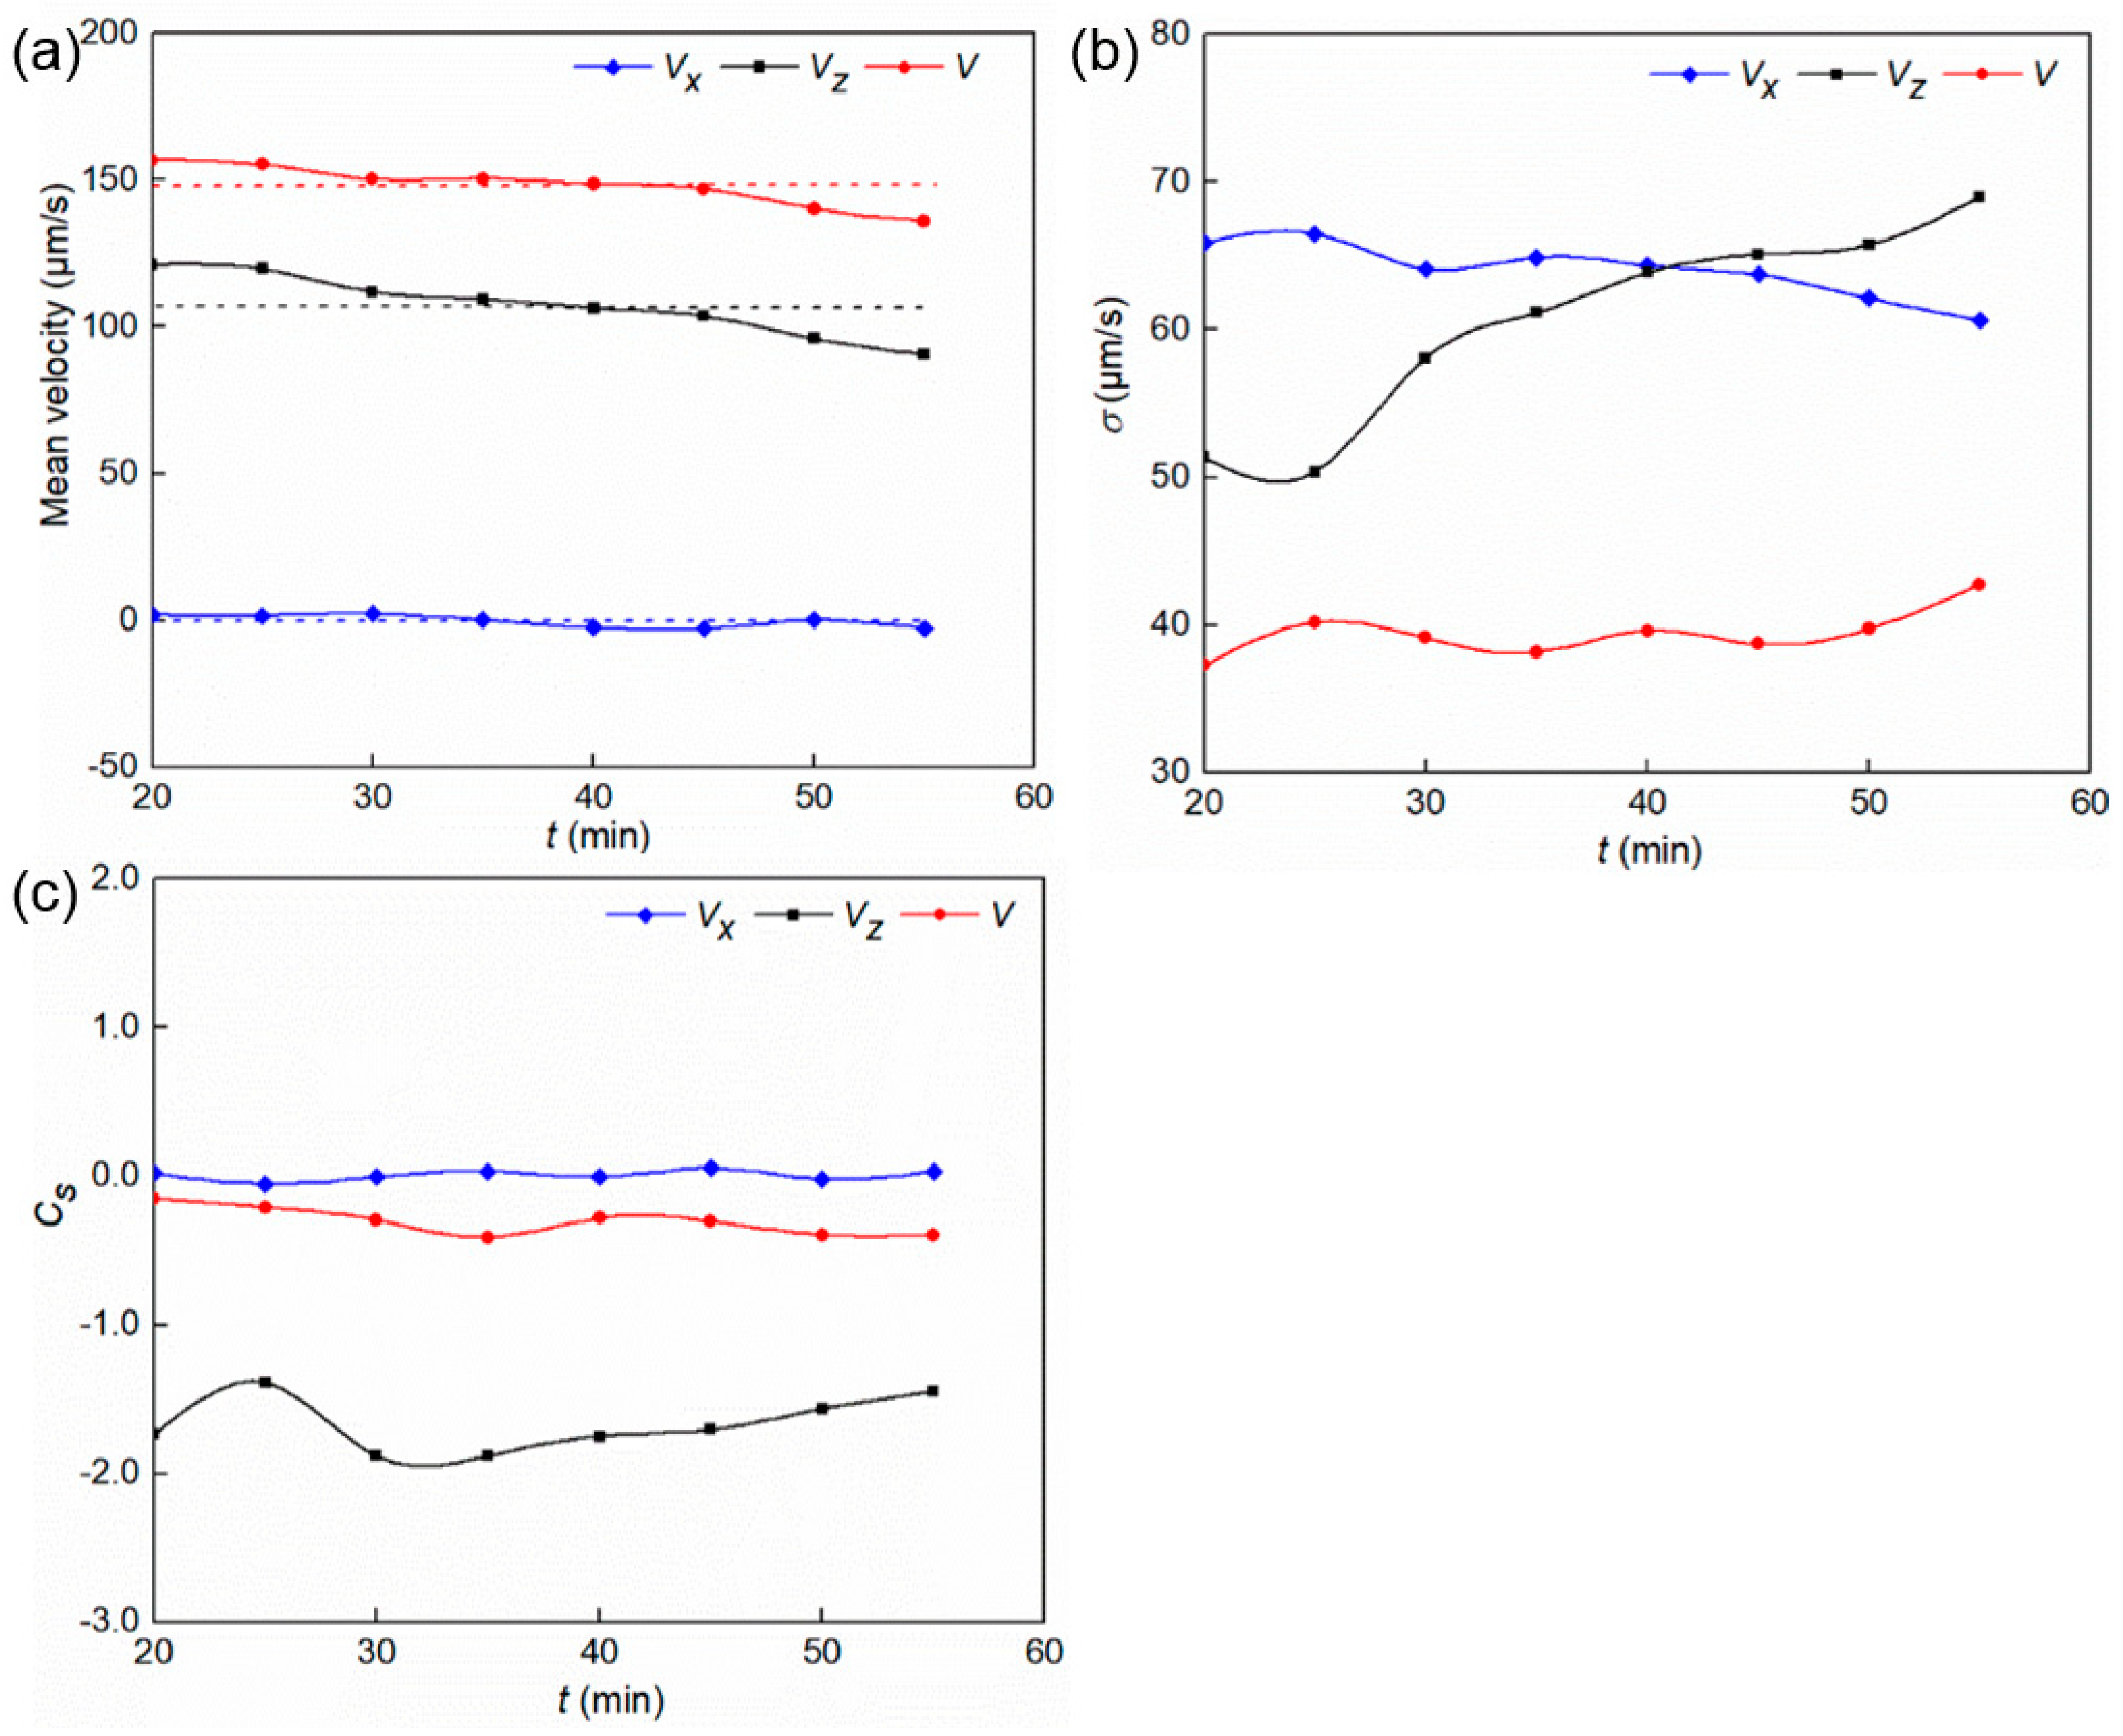
where k (the value is 10) is the number of walks in one track, U is the variable to represent V, Vx, or Vz, and Ni is the number of tracks in the last line in Table 1. Figure 7a presents the mean swimming velocities at three tests, and the dashed lines in Figure 7a represent the mean swimming velocity for all the tests. The values of V and Vz decrease with time to some extent, while the value of Vx fluctuates around Vx = 0 µm/s. The variation of standard deviations of Vx and V are weak compared with that of Vz, as shown in Figure 7b. The deviation coefficients do not change greatly with time, as shown in Figure 7c, which indicates that the distribution patterns remain stable. The results illustrate that the swimming characteristics of cells in the x-y plane is time-independent, the differences of PDFs for Vz increase slightly with time due to the smaller Vz of the cells coming later, and the swimming ability changes a little in tests.
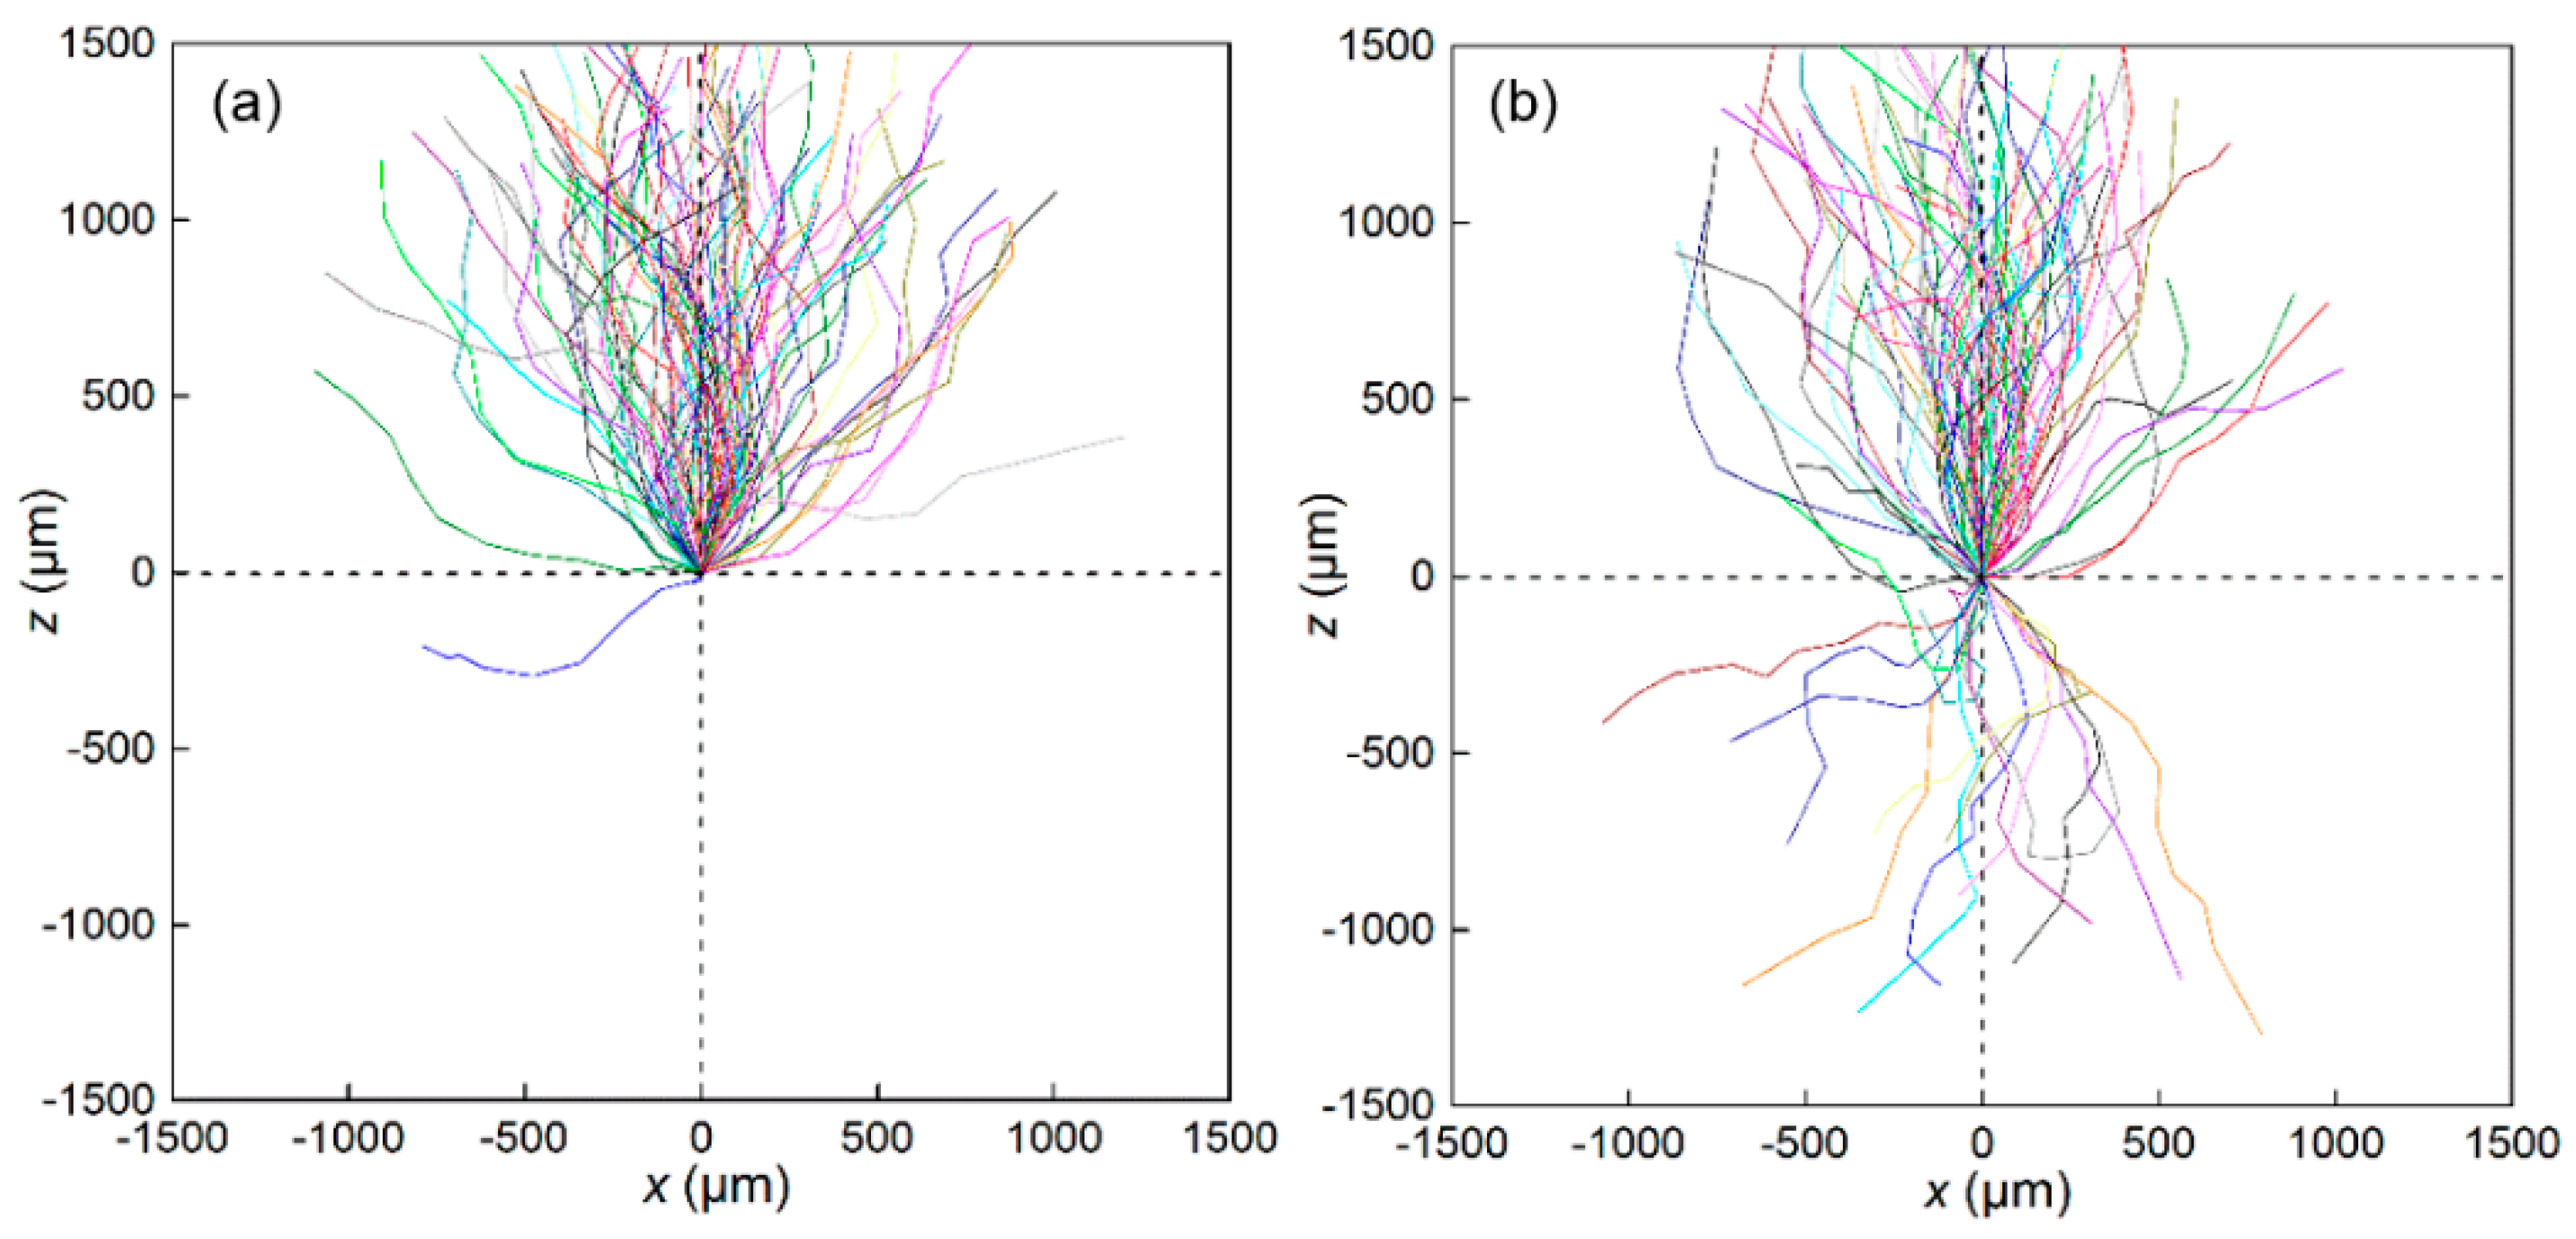
The PDF of swimming direction in r-z plane is shown in Figure 8a. The f(θ) increases with the decreasing θ to reach the maximum value at θ = 0°, i.e., the vertical direction (z-axis). Figure 8b presents more intuitively the variation of f(θ) with θ after injection, which changes little over time. The f(θ) rises obviously when 0° < θ < 90°, while keeps stable around 0.001 in the case that θ > 90°. The results show that the H. akashiwo tends to swim upwards, and this conclusion is also verified by the trajectories of 100 cells within 5 s at t = 20 min and 55 min, as shown in Figure 9. The origin of each trajectory in Figure 9 has been moved to the same point to compare. Both the gravitaxis and randomness can be observed in Figure 9. It is noted that a number of downward trajectories have been observed at t = 55 min, and corresponding reasons are not clear.

3.2. Relative Strength of Reorientation by Gravitational Torque to Rotational Diffusion

According to the theoretical analysis of gyrotactic micro-organisms given by Pedley and Kessler [2], f(V,θ) and ln[f(V,θ)] are subjected to
  f = μ 1 e λ cos θ  
  ln f = λ cos θ + ln μ 1  
where λ represents the relative relationship between the random diffusion and the preferred migration, and µ0 is λ/(4πsinhλ).
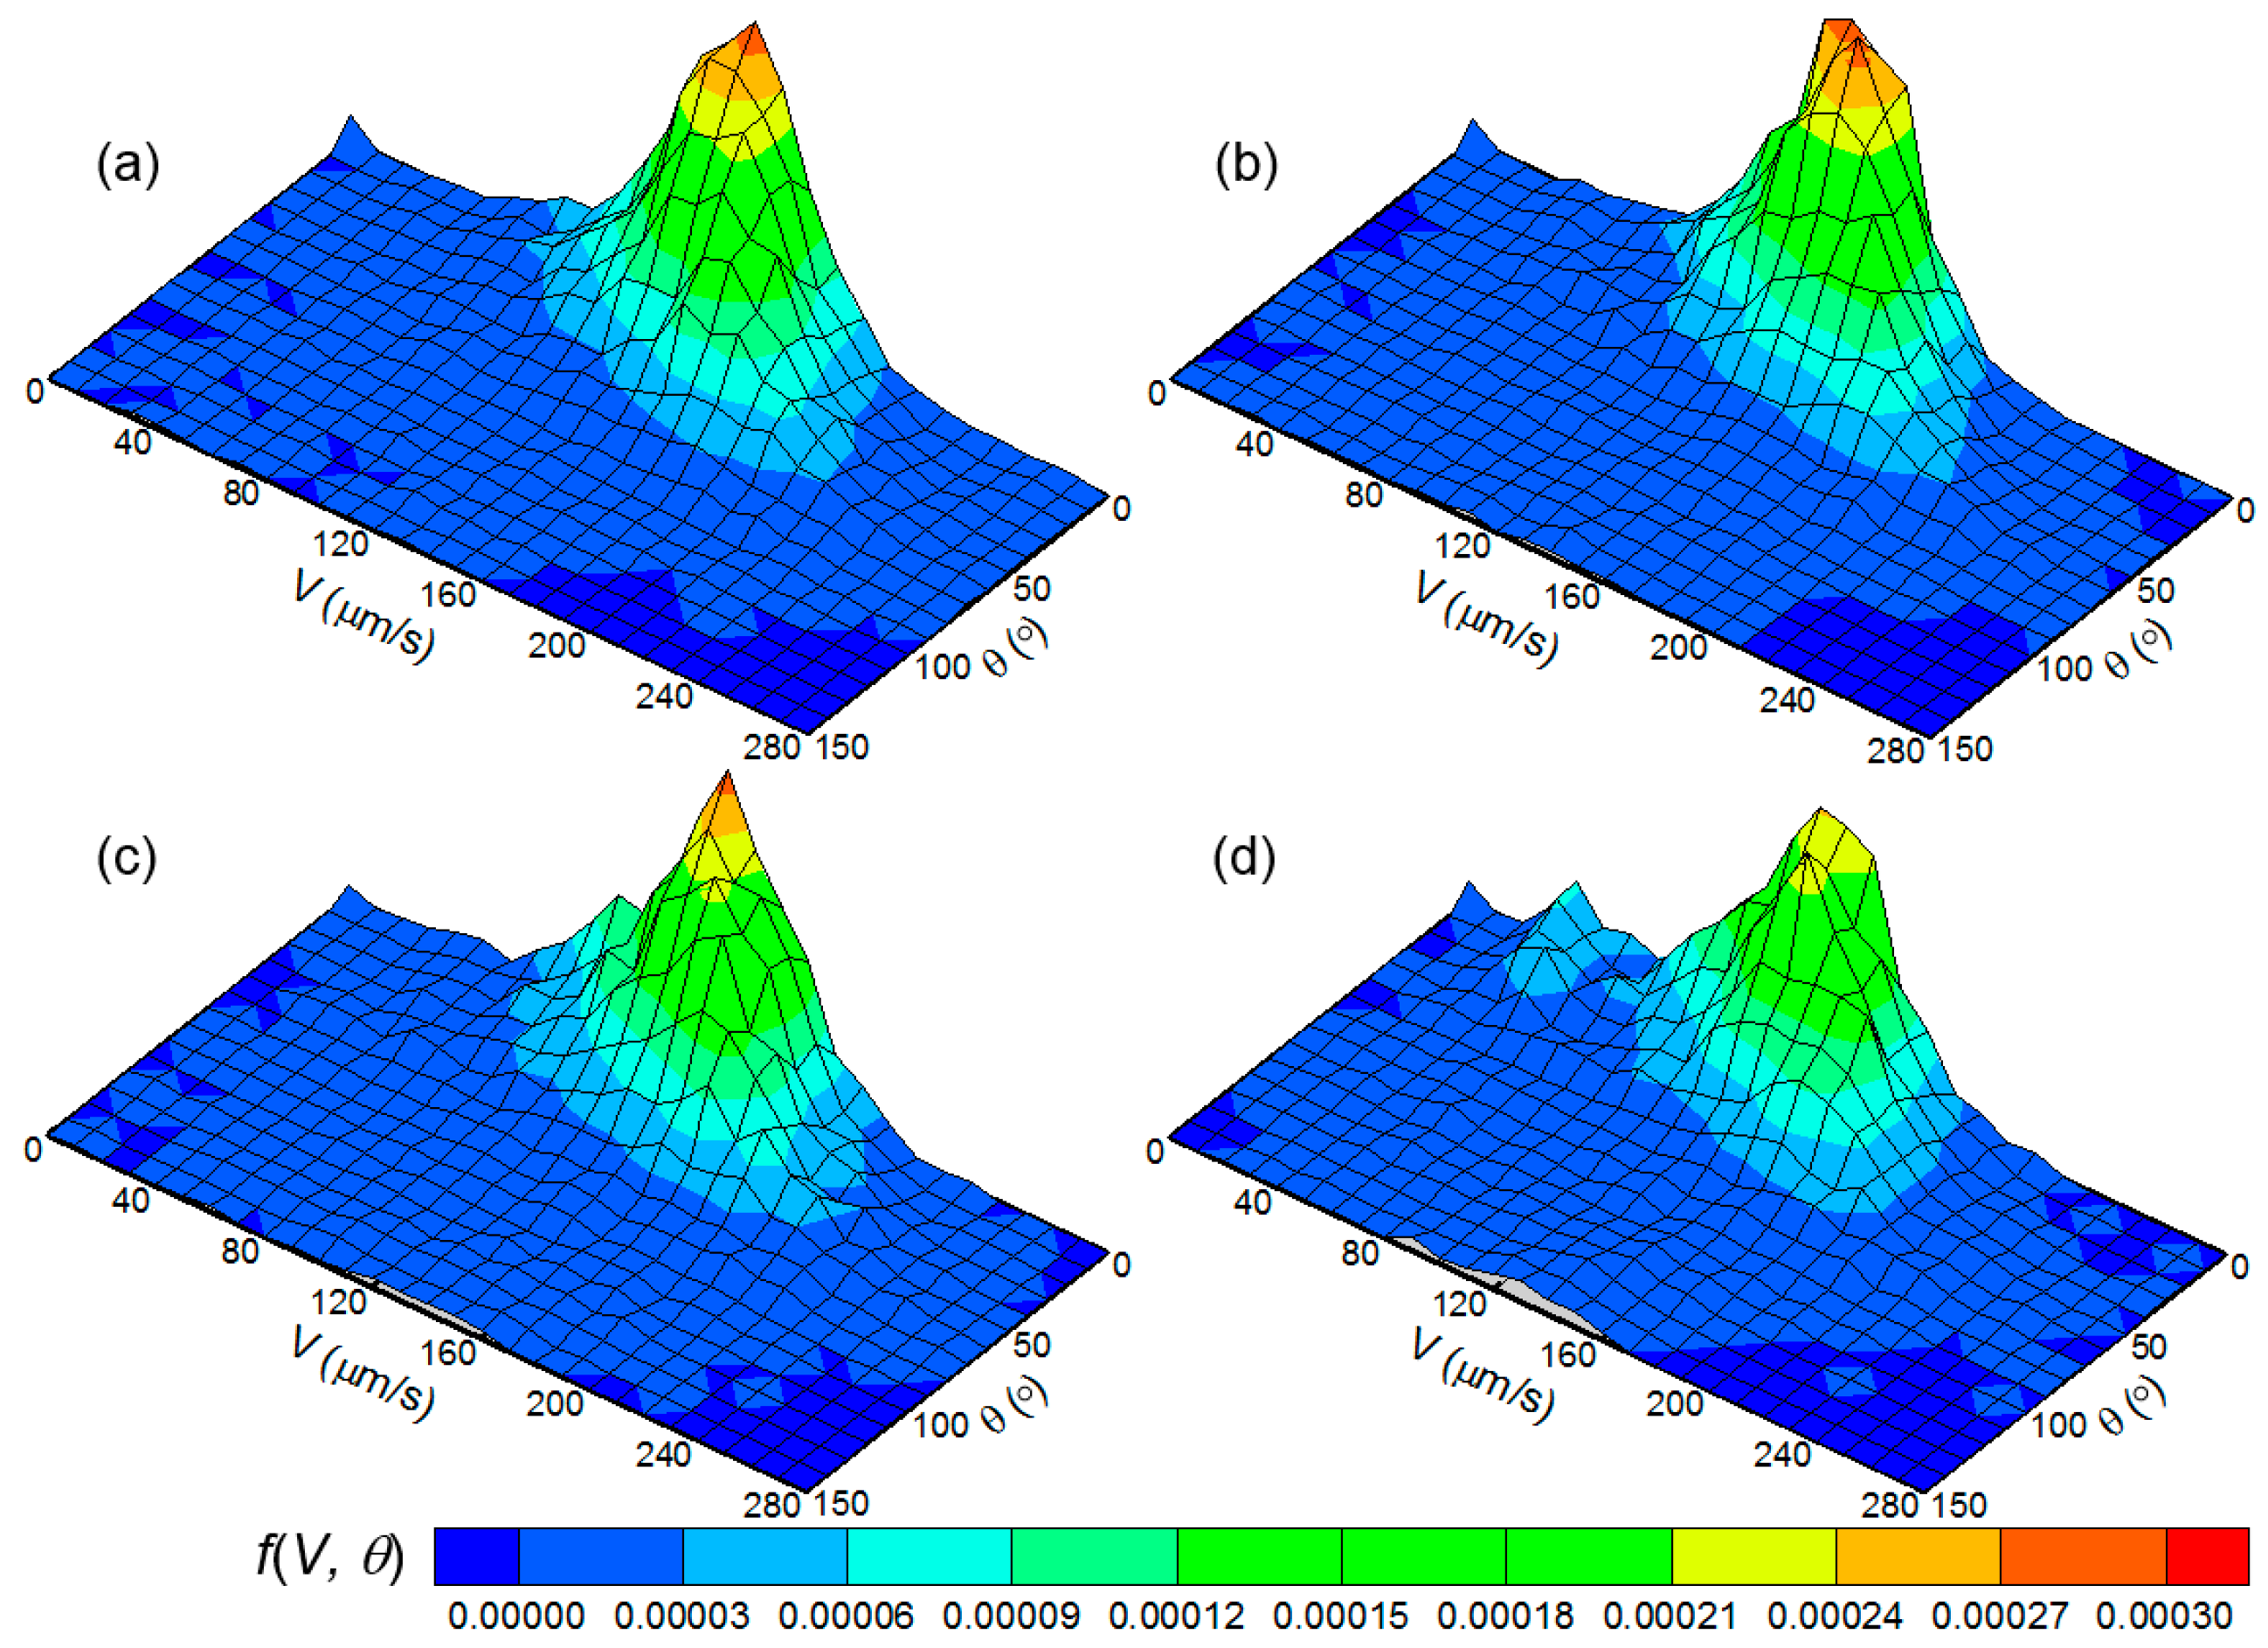
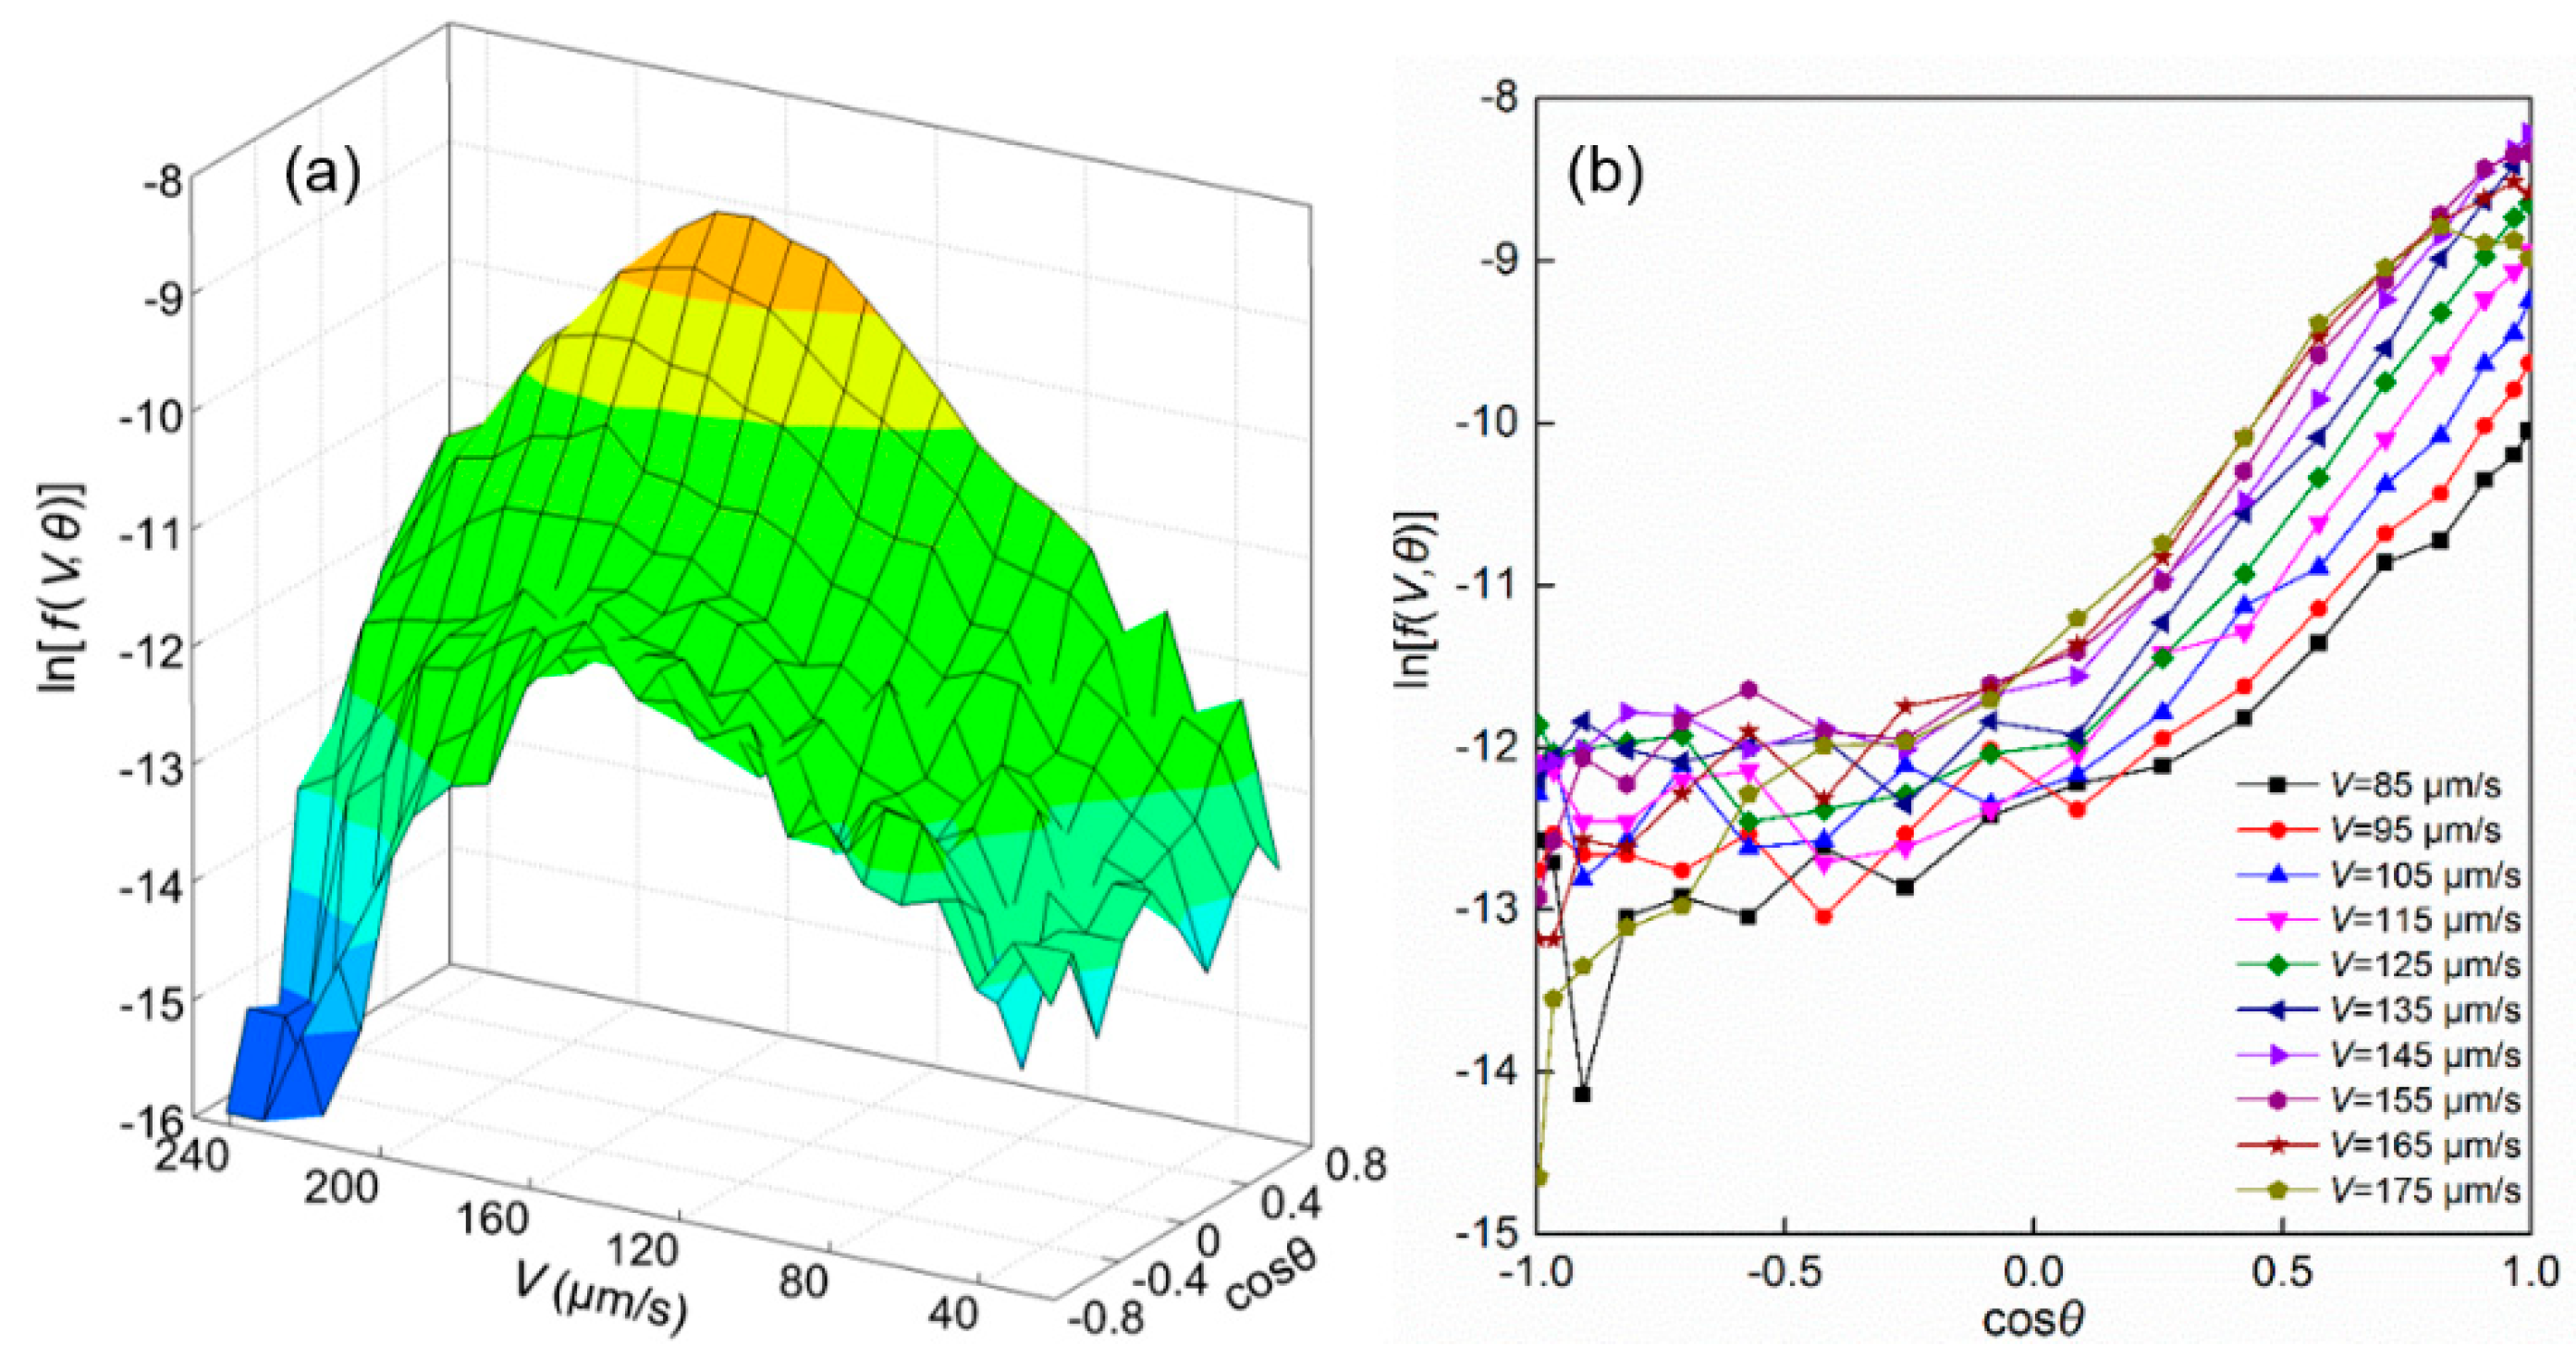
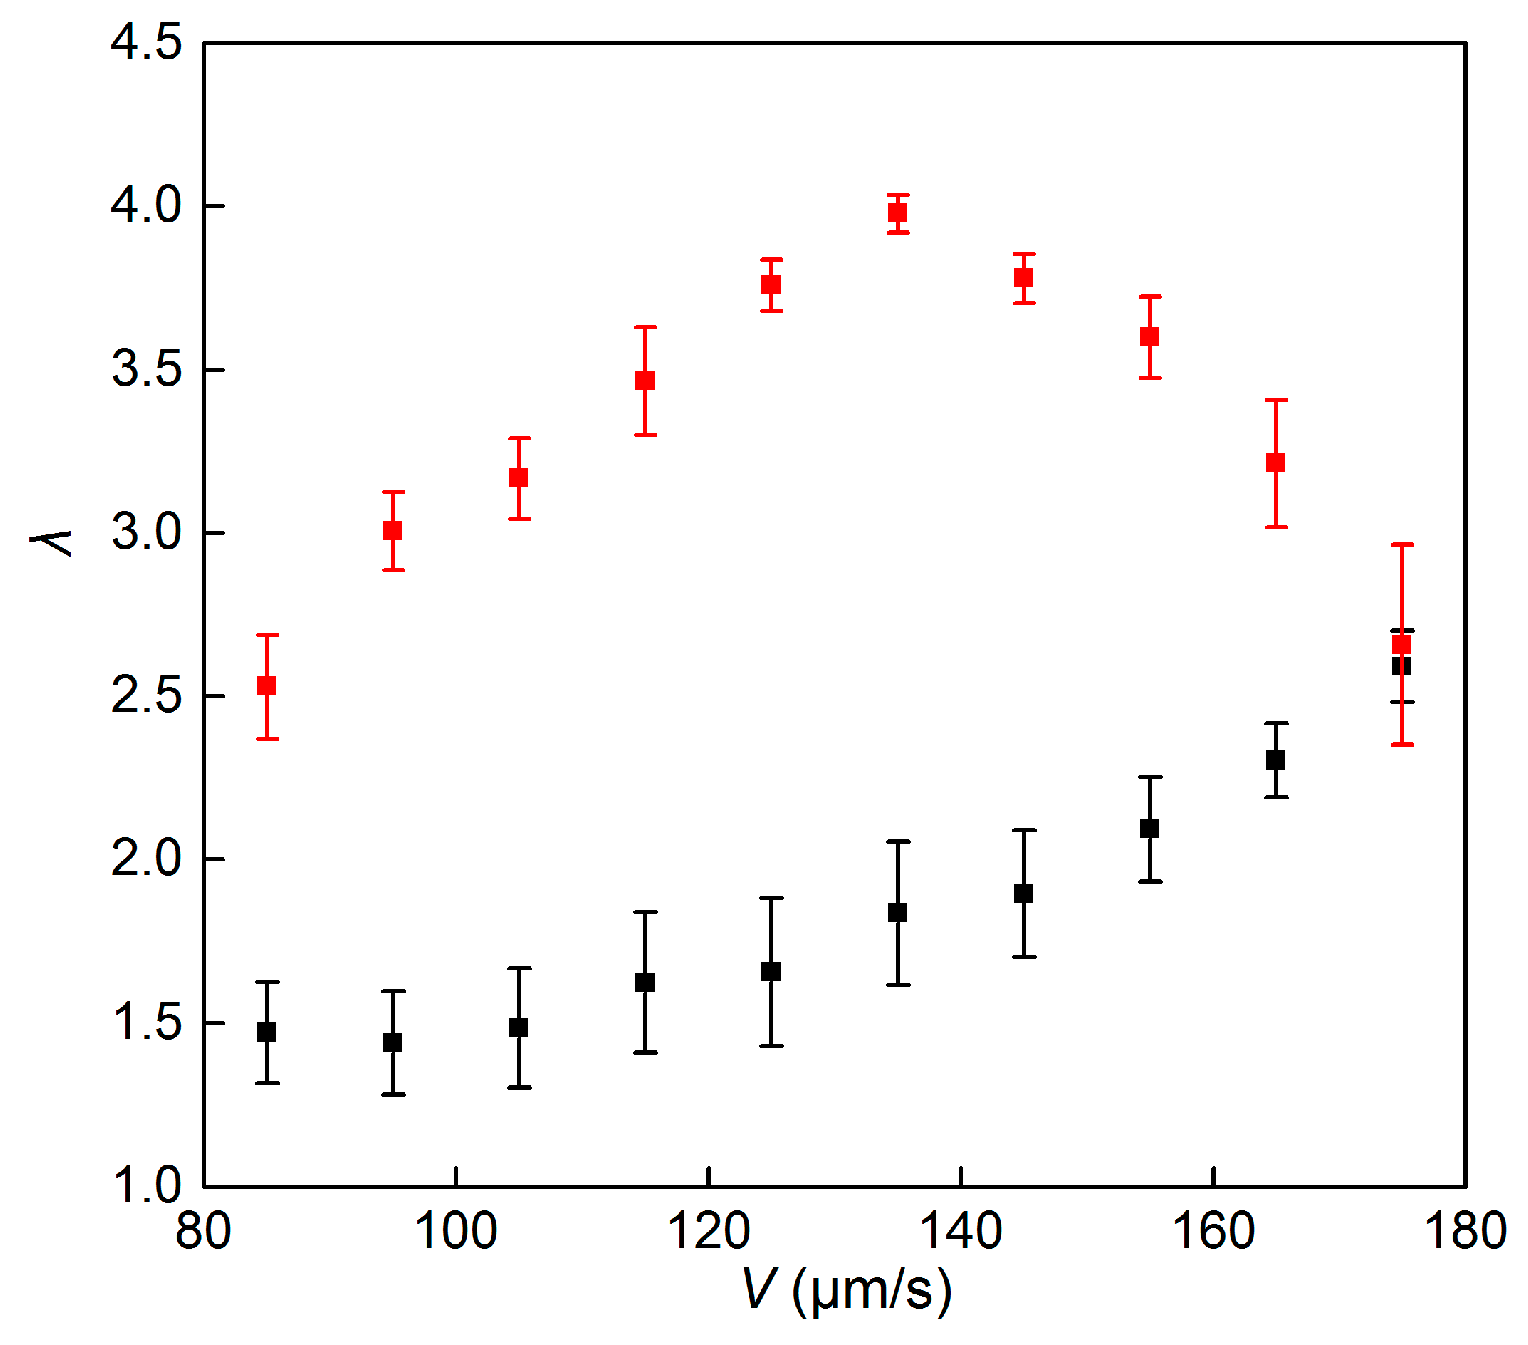
The f(V,θ) of motile cells shows that the cells with V = 80–180 µm/s and θ = 0°–60° occupy the majority in all tests, as shown in Figure 10. The peaks of f(V,θ) drop to smaller values in the V-axis, and the small peak appearing in Figure 10d represents the slower cells that coming later. The distribution of ln[f(V,θ)] at different swimming velocity and swimming direction is shown in Figure 11a, and according to Equation (21) the slopes in cosθ−ln[f(V,θ)] plane are the values of λ. The linear relationships between ln[f(V,θ)] and cosθ at V = 80–180 µm/s are shown in Figure 11b. It is shown that λ = 1.44–2.60, and that the average value of λ = 1.96. We also found that the linear relation is more obvious for the case of cosθ > 0, in which λ = 2.53–3.98 with the average value, 3.44, as shown in Figure 12. In addition, λ can be calculated from another equation presented by Pedley and Kessler [2]:
  V z V = coth λ 1 λ  
  V = V f ( V ) d 2 V  
where < > represents the ensemble average. The value of λ is 3.64 based on Equation (22).

3.3. Time Scale of Reorientation by Gravitational Torque

The swimming direction of H. akashiwo is reoriented due to the torque caused by the displacement of the center of mass relative to the geometric center [1]. This intrinsic feature, resulted from bottom heaviness, can be described by the time scale of reorientation, B, which is determined by [48],
  B = μ α 2 ρ g h  
where μ is the dynamic fluid viscosity, ρ is the density of cells, g is the gravitational acceleration, α is a dimensionless constant, and h is the displacement of the center of mass relative to the geometric center. Kessler [34] proposed the range of h is 0–0.1a and estimated h = 0.1 µm, B = 3.4 s for C. nivalis, where a is the average radius of cells.
It is not easy to estimate B according to Equation (24) is not so convenient to be used for other kinds of algal cells. Hill and Häder [13] built a biased random walk model to estimate the parameters of algal cells, and proposed B = 2.7 s for C. nivalis based on the swimming trajectories obtained by microscope-based tracking methods. For the experimental results in the present paper, the swimming directions of cells are subjected to
  E [ α ( T ) α ( 0 ) ] ~ T μ 0 [ α ( 0 ) ] ,  
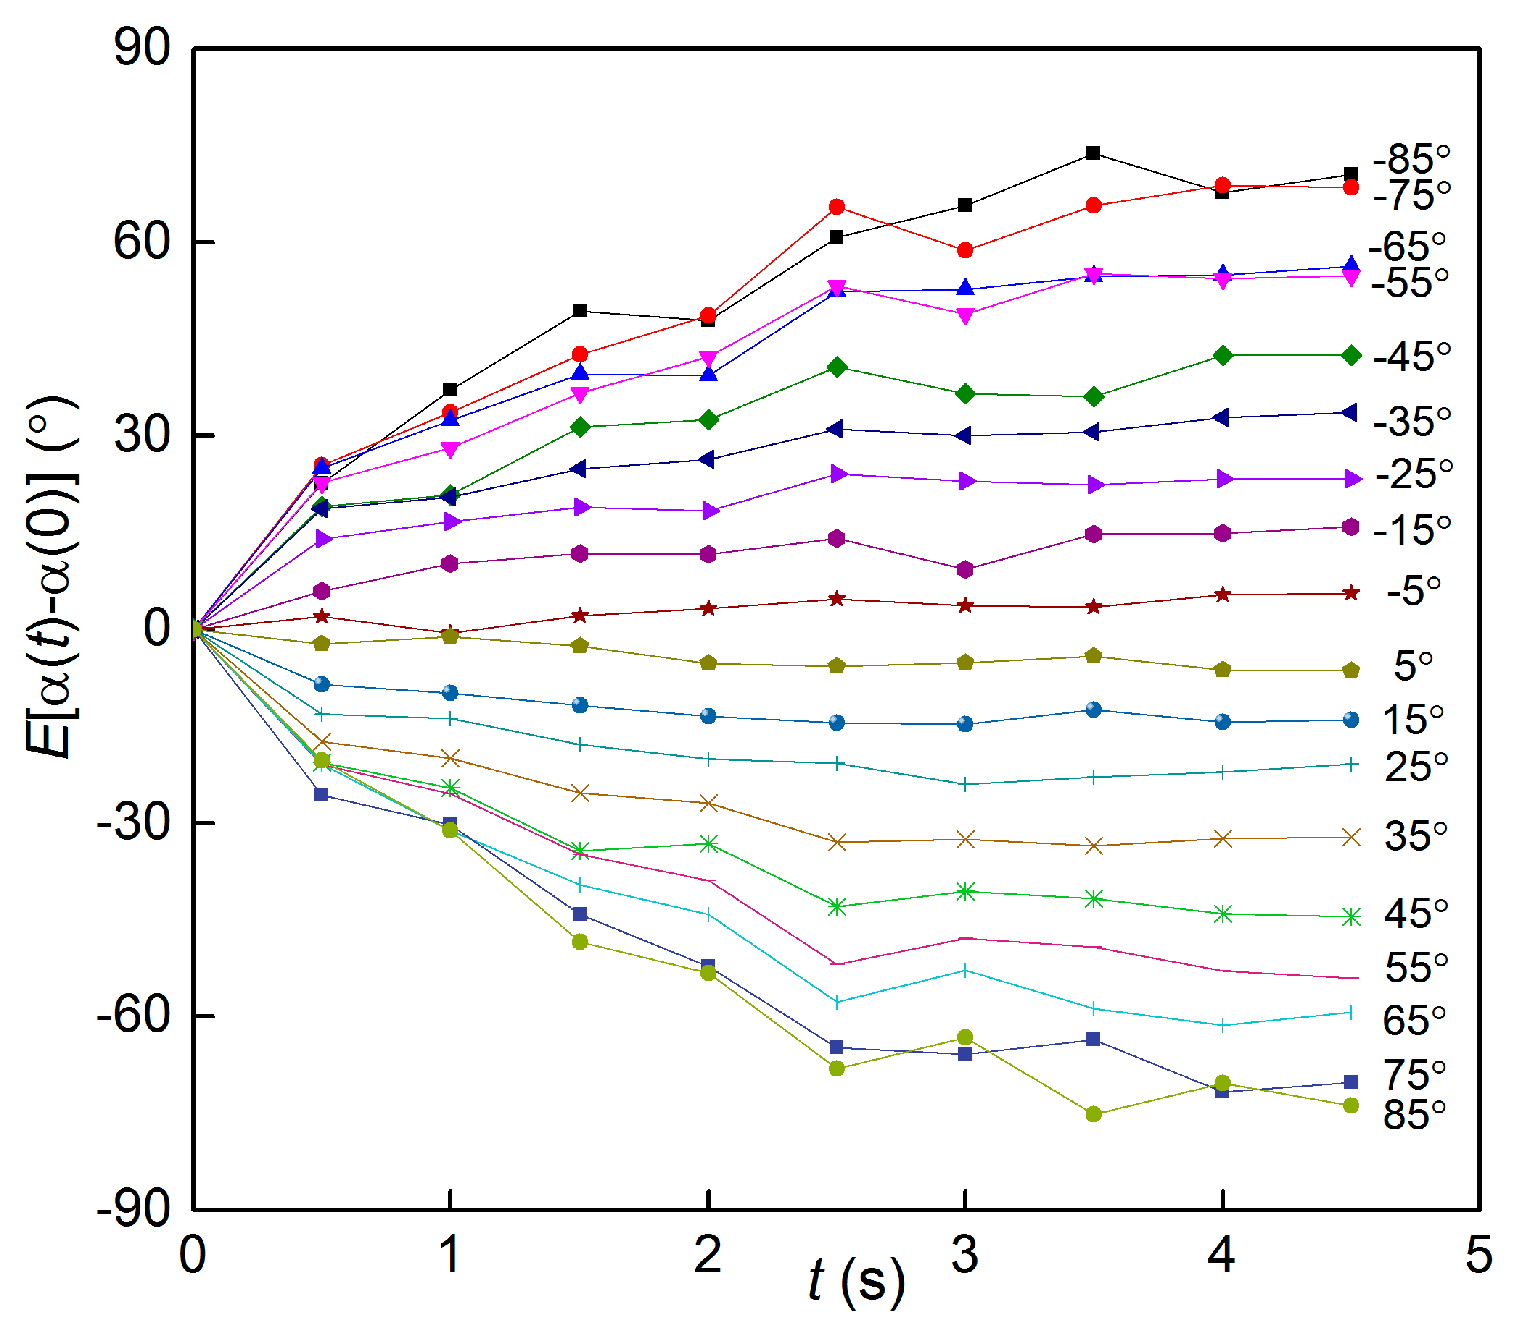
where α(0) is the initial swimming angle at T = 0 s, which corresponds to t = 20 min in all tests, and α(0) = 0 represents that the cells swim vertically upward. In one shot, 30 successive frames are recorded by a frequency of 2 fps, thus the maximum T is 15 s for each set of images. The expectations of turning amplitudes, E[α(t)−α(0)], are proportional to time, and the corresponding slopes, μ0[α(0)], represent turning speed of cells with different α(0), as shown in Figure 13, in which the −85° and −75° respectively represent the population of cells with α(0) at [−90°, −80°] and [−80°, −70°] when T = 0 s. For the population characterized by α(0) = −85°, the cells constantly rotate to adjust the swimming direction until the rotation angle nearly reaching 85°, and at that moment the turning amplitude does not increase with time any more, which means that the swimming directions have been upward and the cells have reached equilibrium. The turning amplitudes are almost constant for the cells α(0) = ±5°, because the initial positions of algal cells are close to vertical direction. The initial instant T = 0 is any moment for the algal cells, thus Figure 13 shows that at any time the cells constantly adjust their swimming direction to reach the equilibrium state.
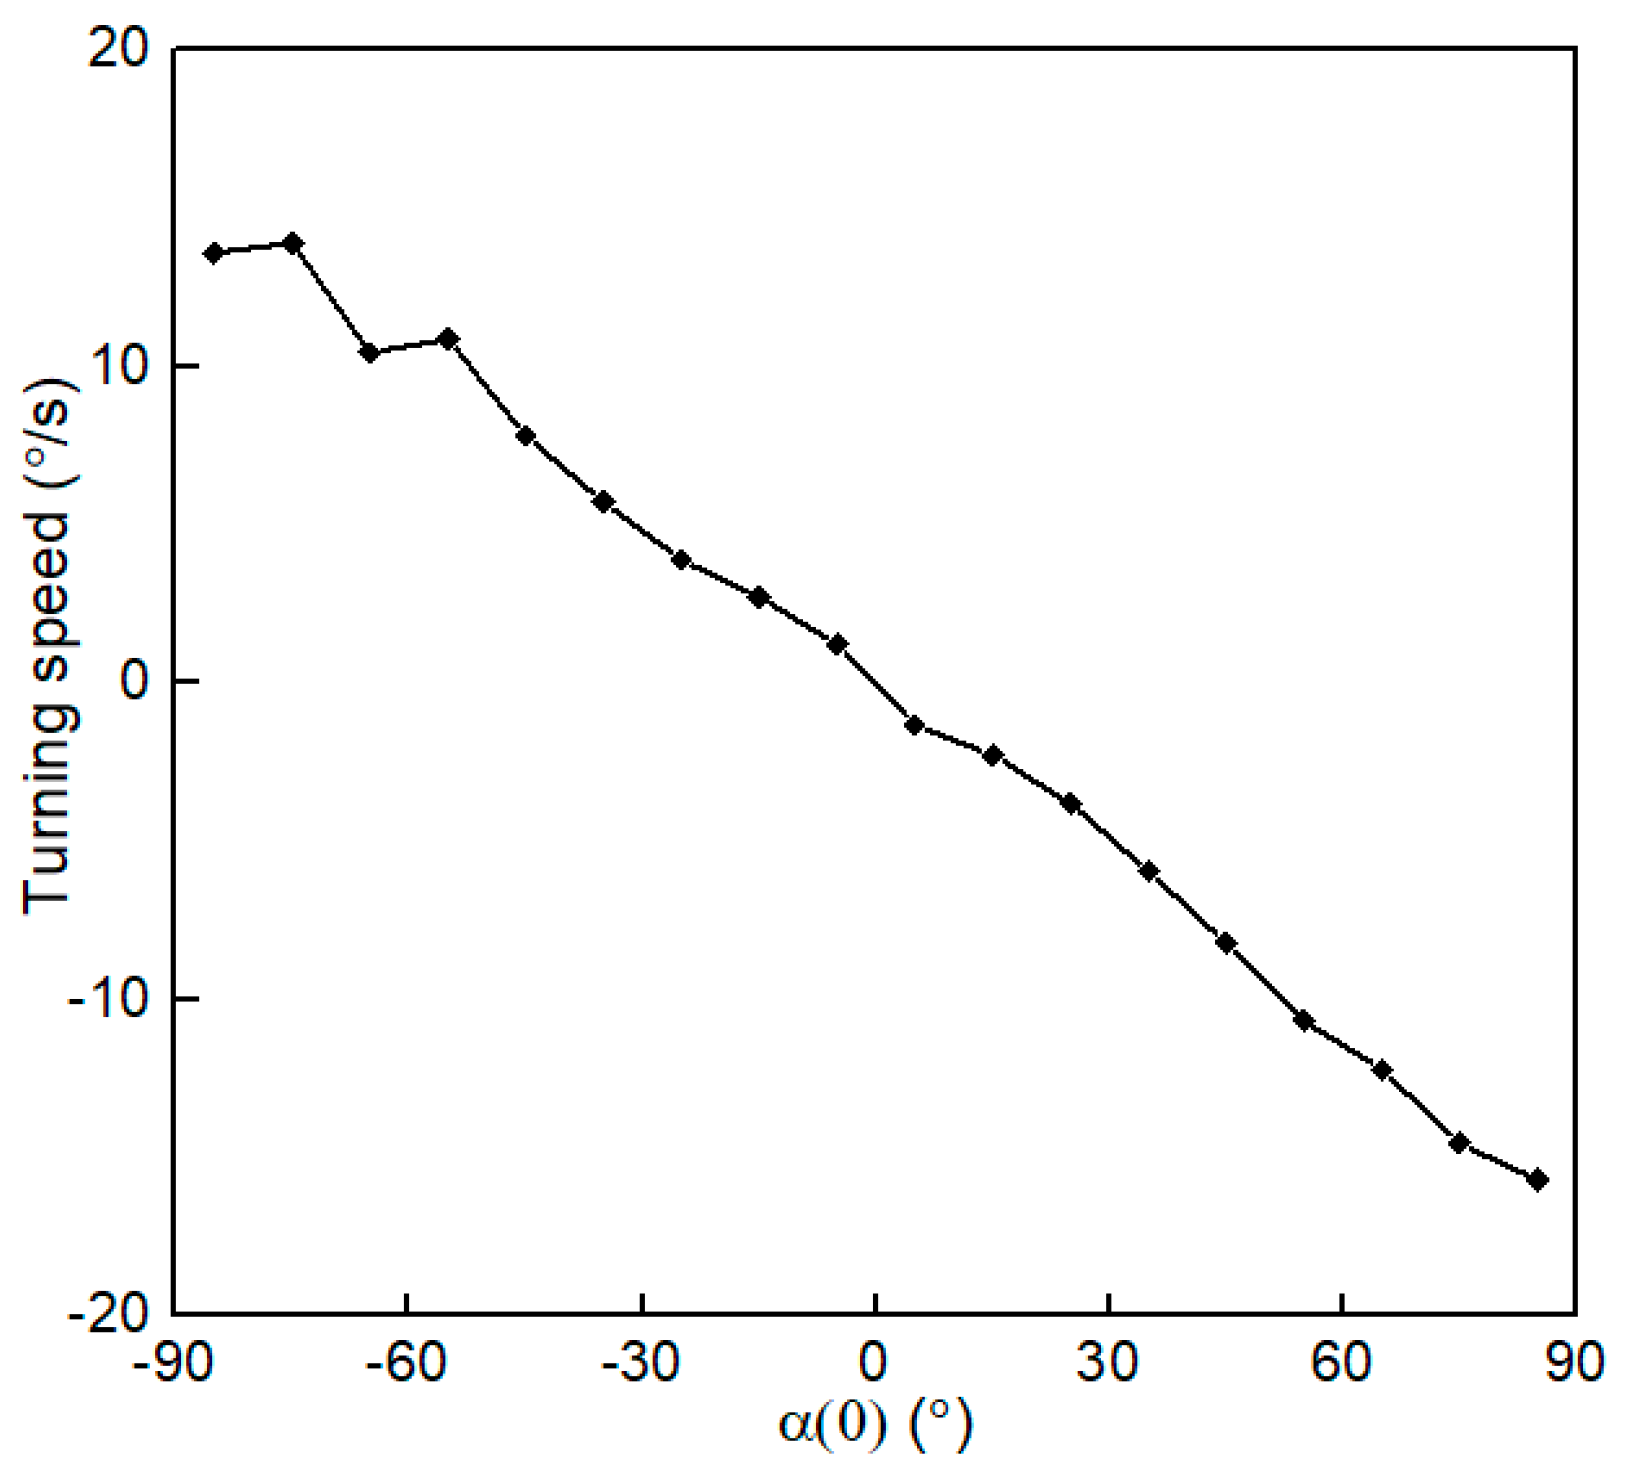
The slopes in Figure 13, μ0[α(0)], are proportional to [α(0)], as shown in Figure 14. The curve in Figure 14 shows that the more algal cells deviate from their equilibrium position, the greater the turning speed. The function μ0(α) represents the turning speed of motile cells from the initial position to the position of α = 0, which is subjected to Equation (26),
  μ 0 ( α ) = d 0 α = 0.18 α        as        t 0  
where d0, a positive constant, is the drift coefficient. Thus we estimate B = d0−1 = 5.6 s for H. akashiwo in present paper.

3.4. Rotational Diffusion Coefficient

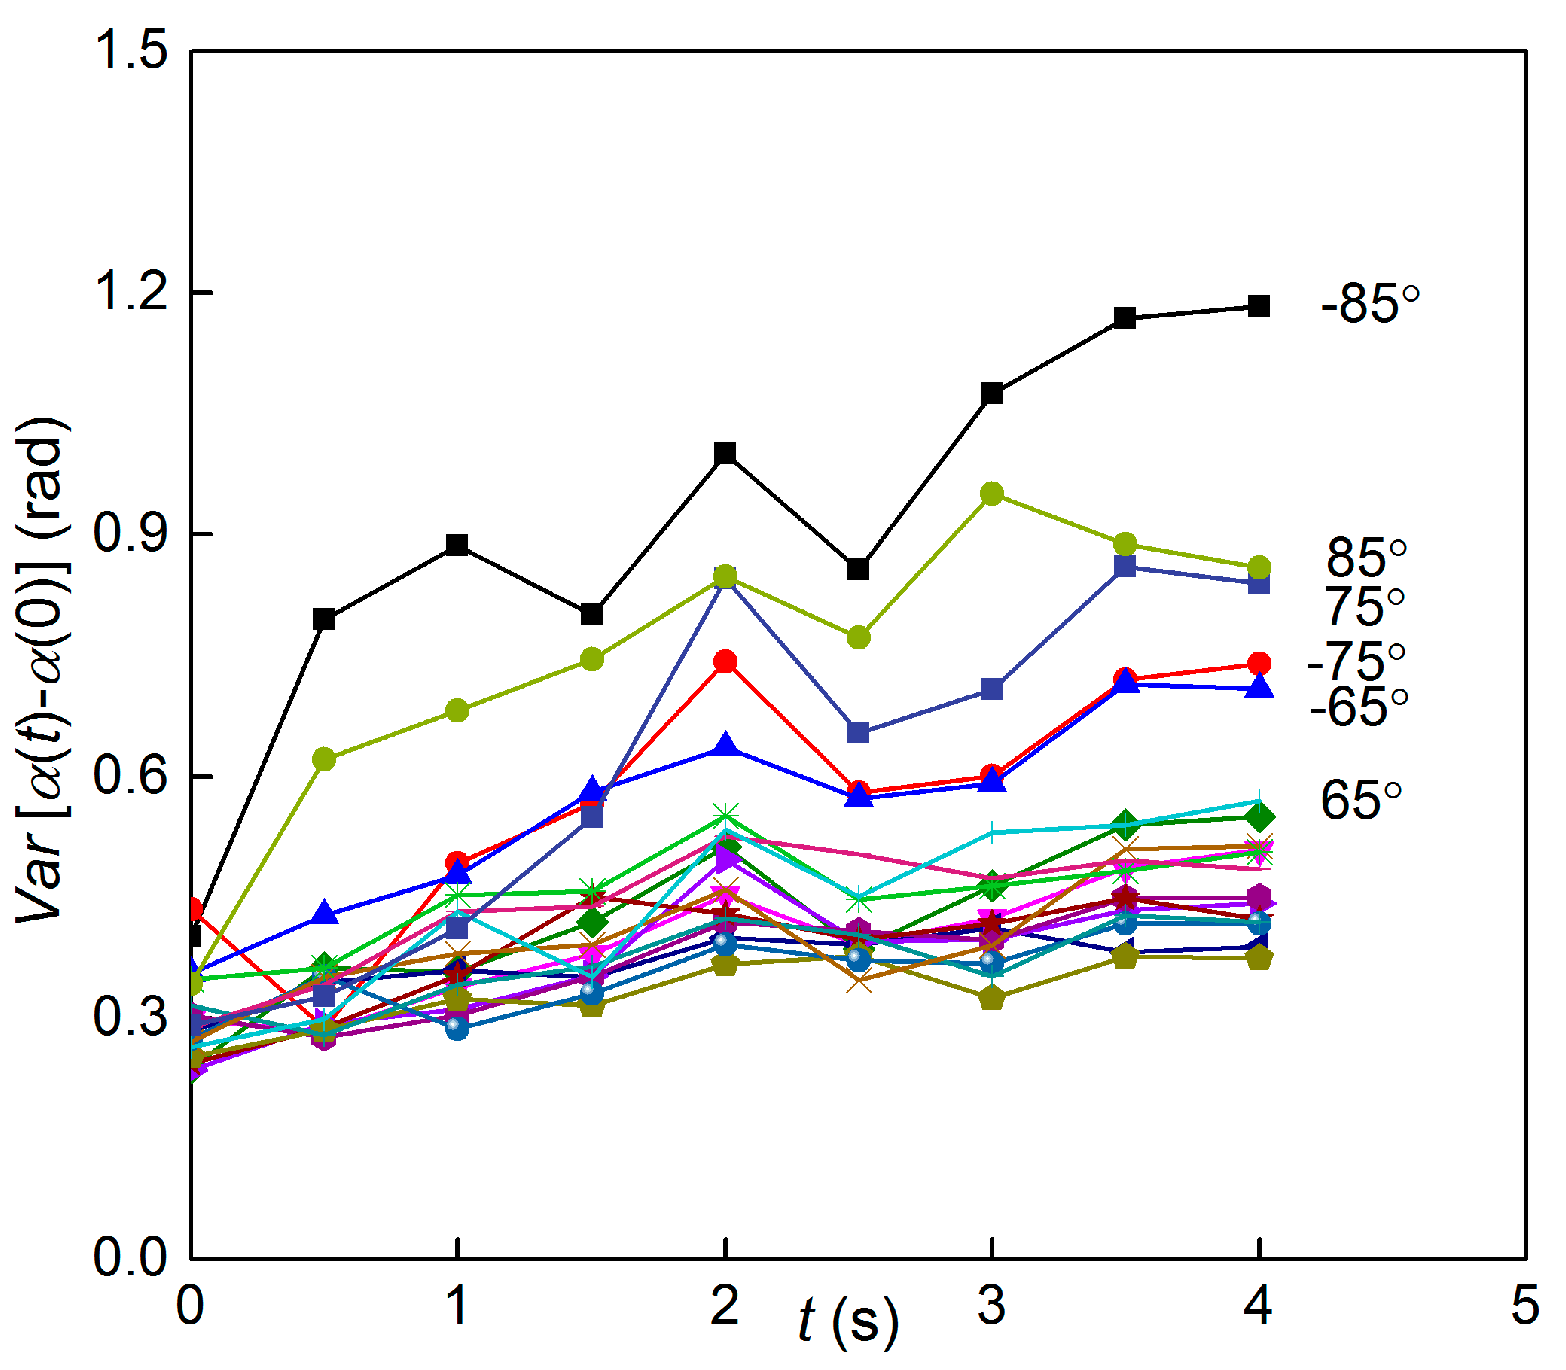
The variance of the turning amplitude, Var[α(t)−α(0)], is proportional to time,
  V a r [ α ( T ) α ( 0 ) ] ~ T σ 0 2 [ α ( 0 ) ] ,  
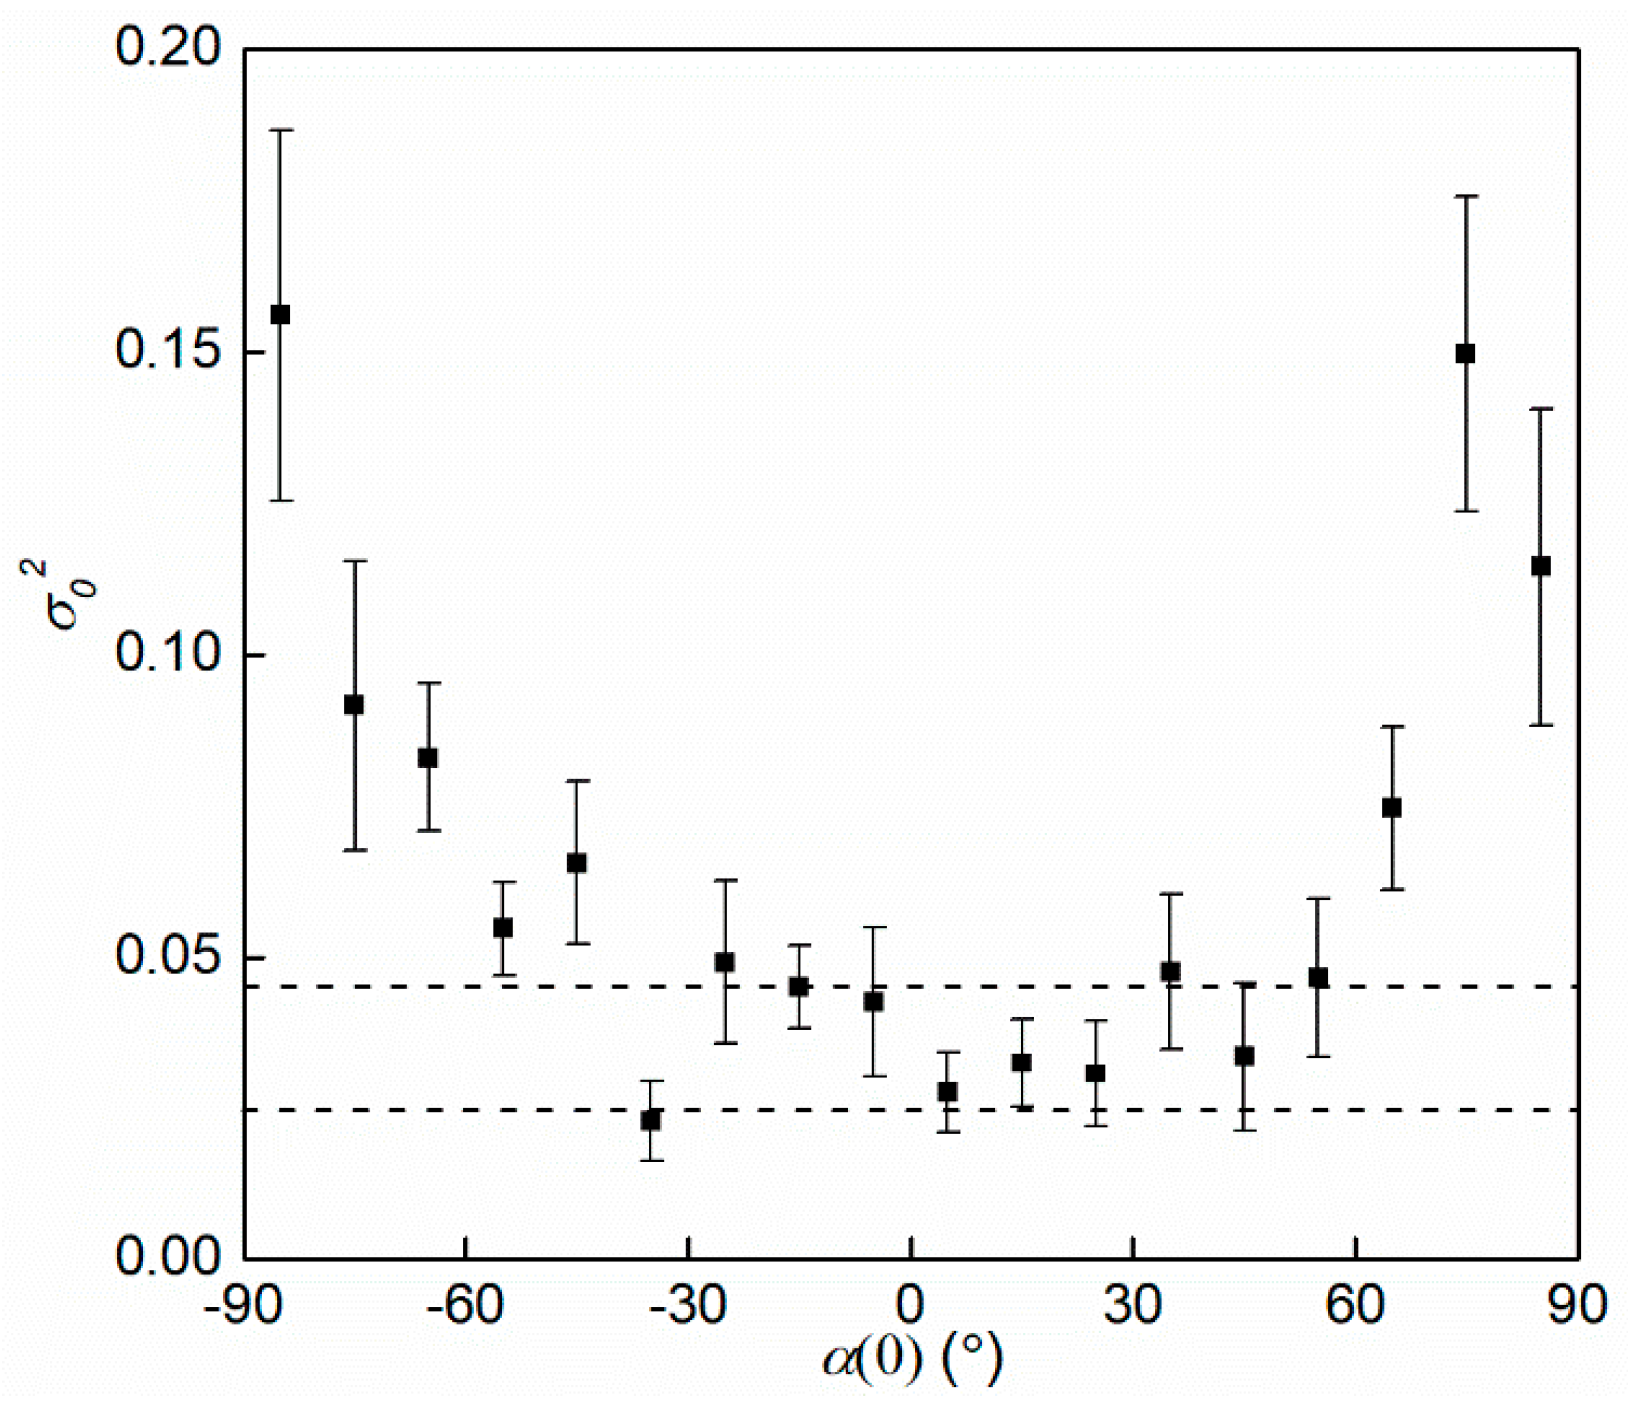
where σ02[α(0)] is the variance of turning speed, and the relationship is shown in Figure 15. The slopes for various initial angles, ranging from 0.023–0.156, are depicted in Figure 16. Thus, the rotational diffusion coefficient, Dr, which equals to σ02/2, varies in the scope of 0.012–0.078.
The rotational diffusivity can also be calculated by the equation given by Pedley and Kessler [1]
  λ = 1 2 B D r  
According to Equation (28), Dr = 1/(2) = 0.034–0.062 rad2/s with a mean value 0.046 rad2/s for all cells, and Dr = 0.022–0.035 rad2/s with a mean value 0.026 rad2/s for the cells only walking vertically upwards, and Dr = 0.025 rad2/s if λ is calculated by Equation (22). The values of Dr calculated by Equation (28) are consistent with that calculated according to Figure 16.

3.5. Swimming Characteristics of H. akashiwo in Vorticity Field

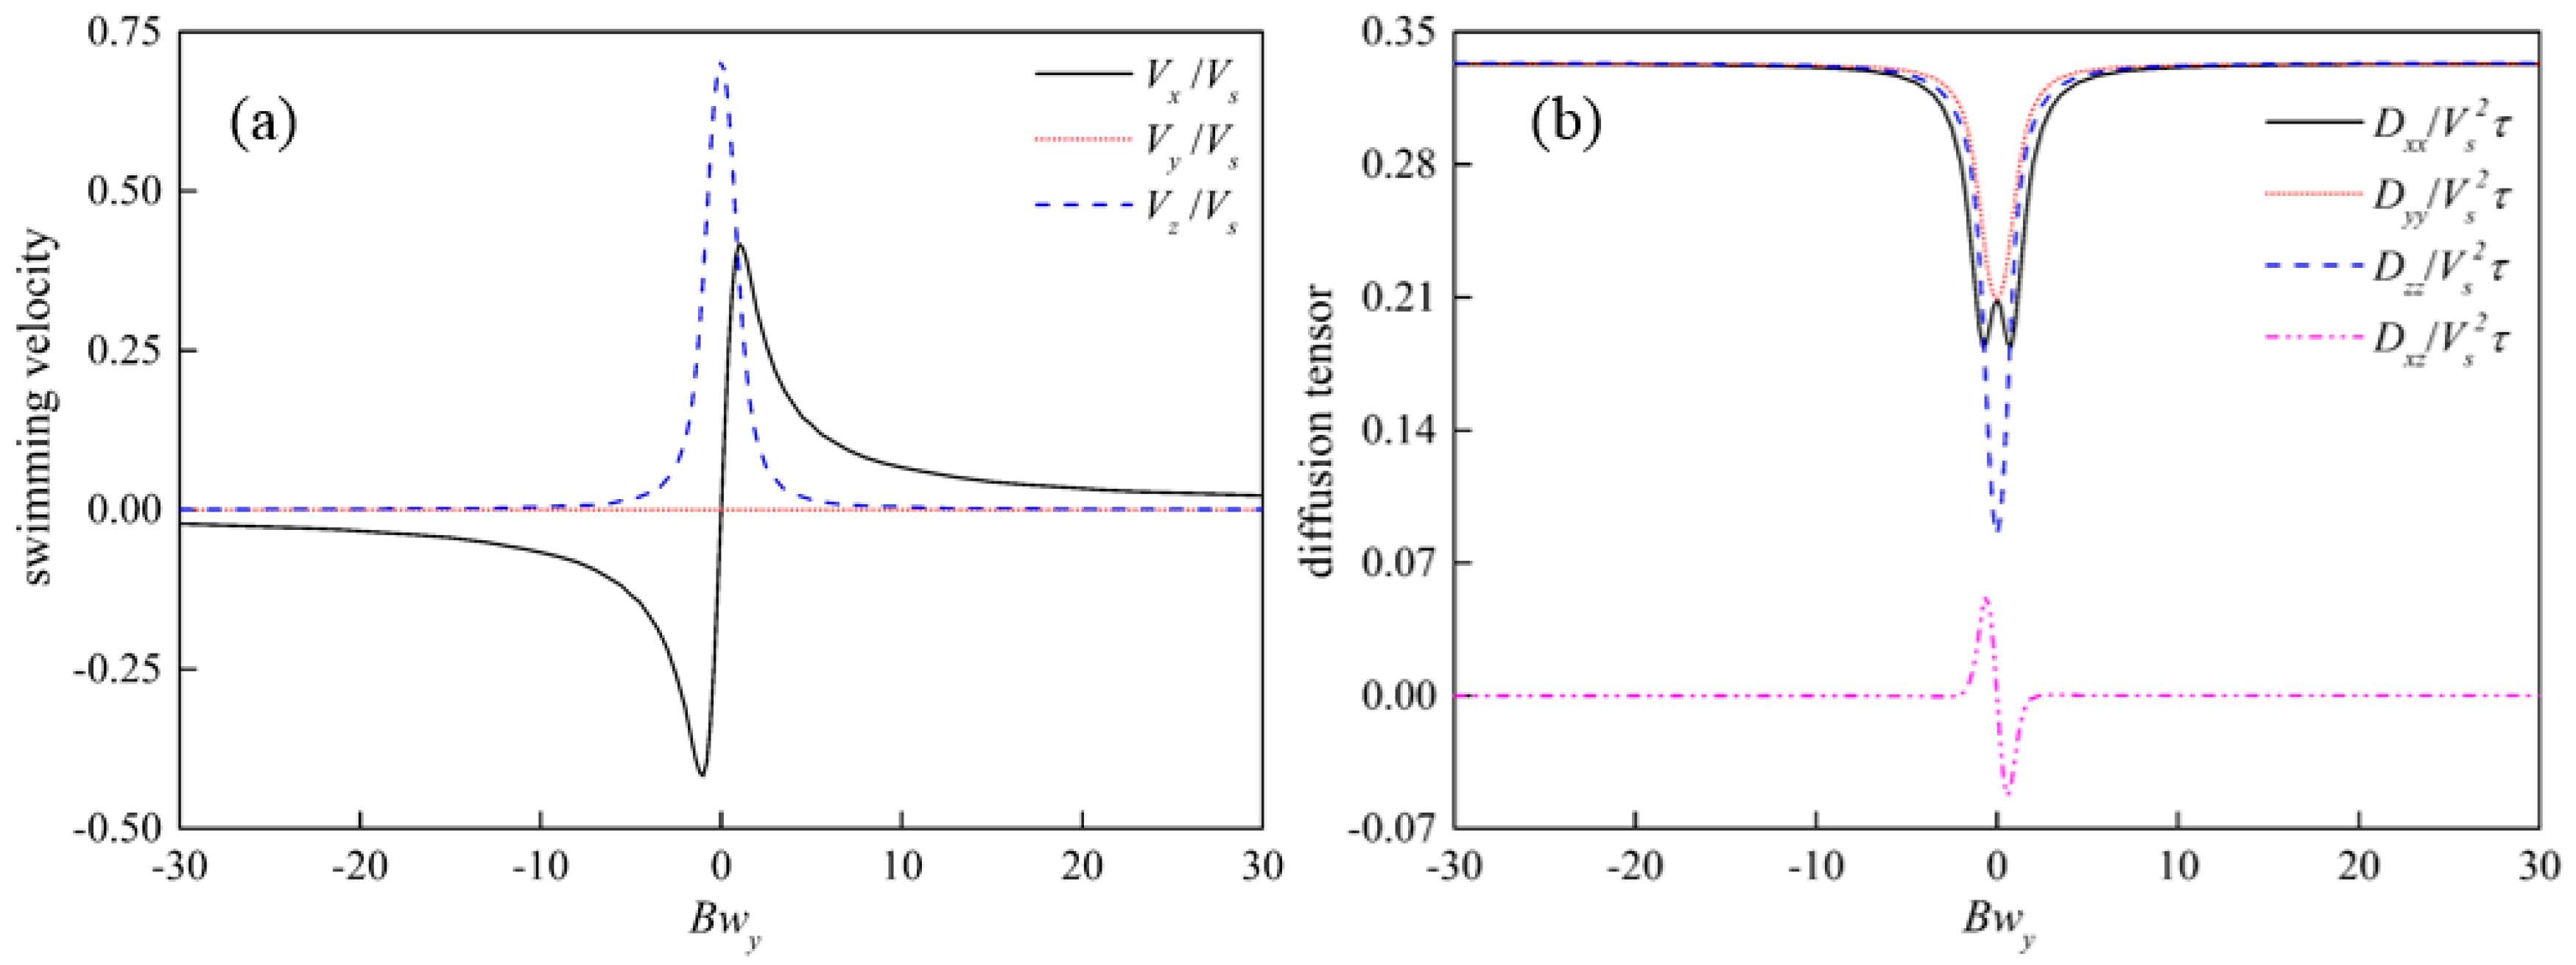
The swimming velocity V and translational diffusivity tensor D of H. akashiwo were found to change with the horizontal vorticity. For the case of wx = 0 and wz = 0, the longitudinal swimming velocity Vx increased firstly to a maximum and decreased to zero with the increase of wy, the vertical swimming velocity Vz decreased with the increasing wy, and the lateral velocity Vy kept constant, as shown in Figure 17a. When |Bwy| > 0.9, Vx is greater than Vz. For the weak horizontal vorticity, algal cells can swim with an angle against the vertical direction. However, for the strong vorticity, the cells cannot swim upwards in a fixed angle, as shown in Figure 17a, because the maximum gravitational torque due to the difference of cells’ buoyance center and mass center cannot balance the viscous torque caused by the flow shear [7]. Figure 17b presents the variation of translational diffusivity with lateral vorticity. It is shown that the diagonal components of translational diffusivity are much greater than the off-diagonal components. For the weak horizontal vorticity, the translational diffusion are found to be anisotropic. With the increase of horizontal vorticity, the anisotropic translational diffusion tends rapidly to the isotropic translational diffusion with the diagonal components equal to 1/3.
For the case of wx = 0 and wz = 0, the horizontal swimming velocity and the off-diagonal components of D are equal to zero, and Vz/Vs, Dxx/(Vs2τ), Dyy/(Vs2τ), and Dzz/(Vs2τ), are equal to 0.71, 0.21, 0.21, and 0.08, respectively, which means that the single vertical vorticity cannot change the swimming direction and translational diffusion.
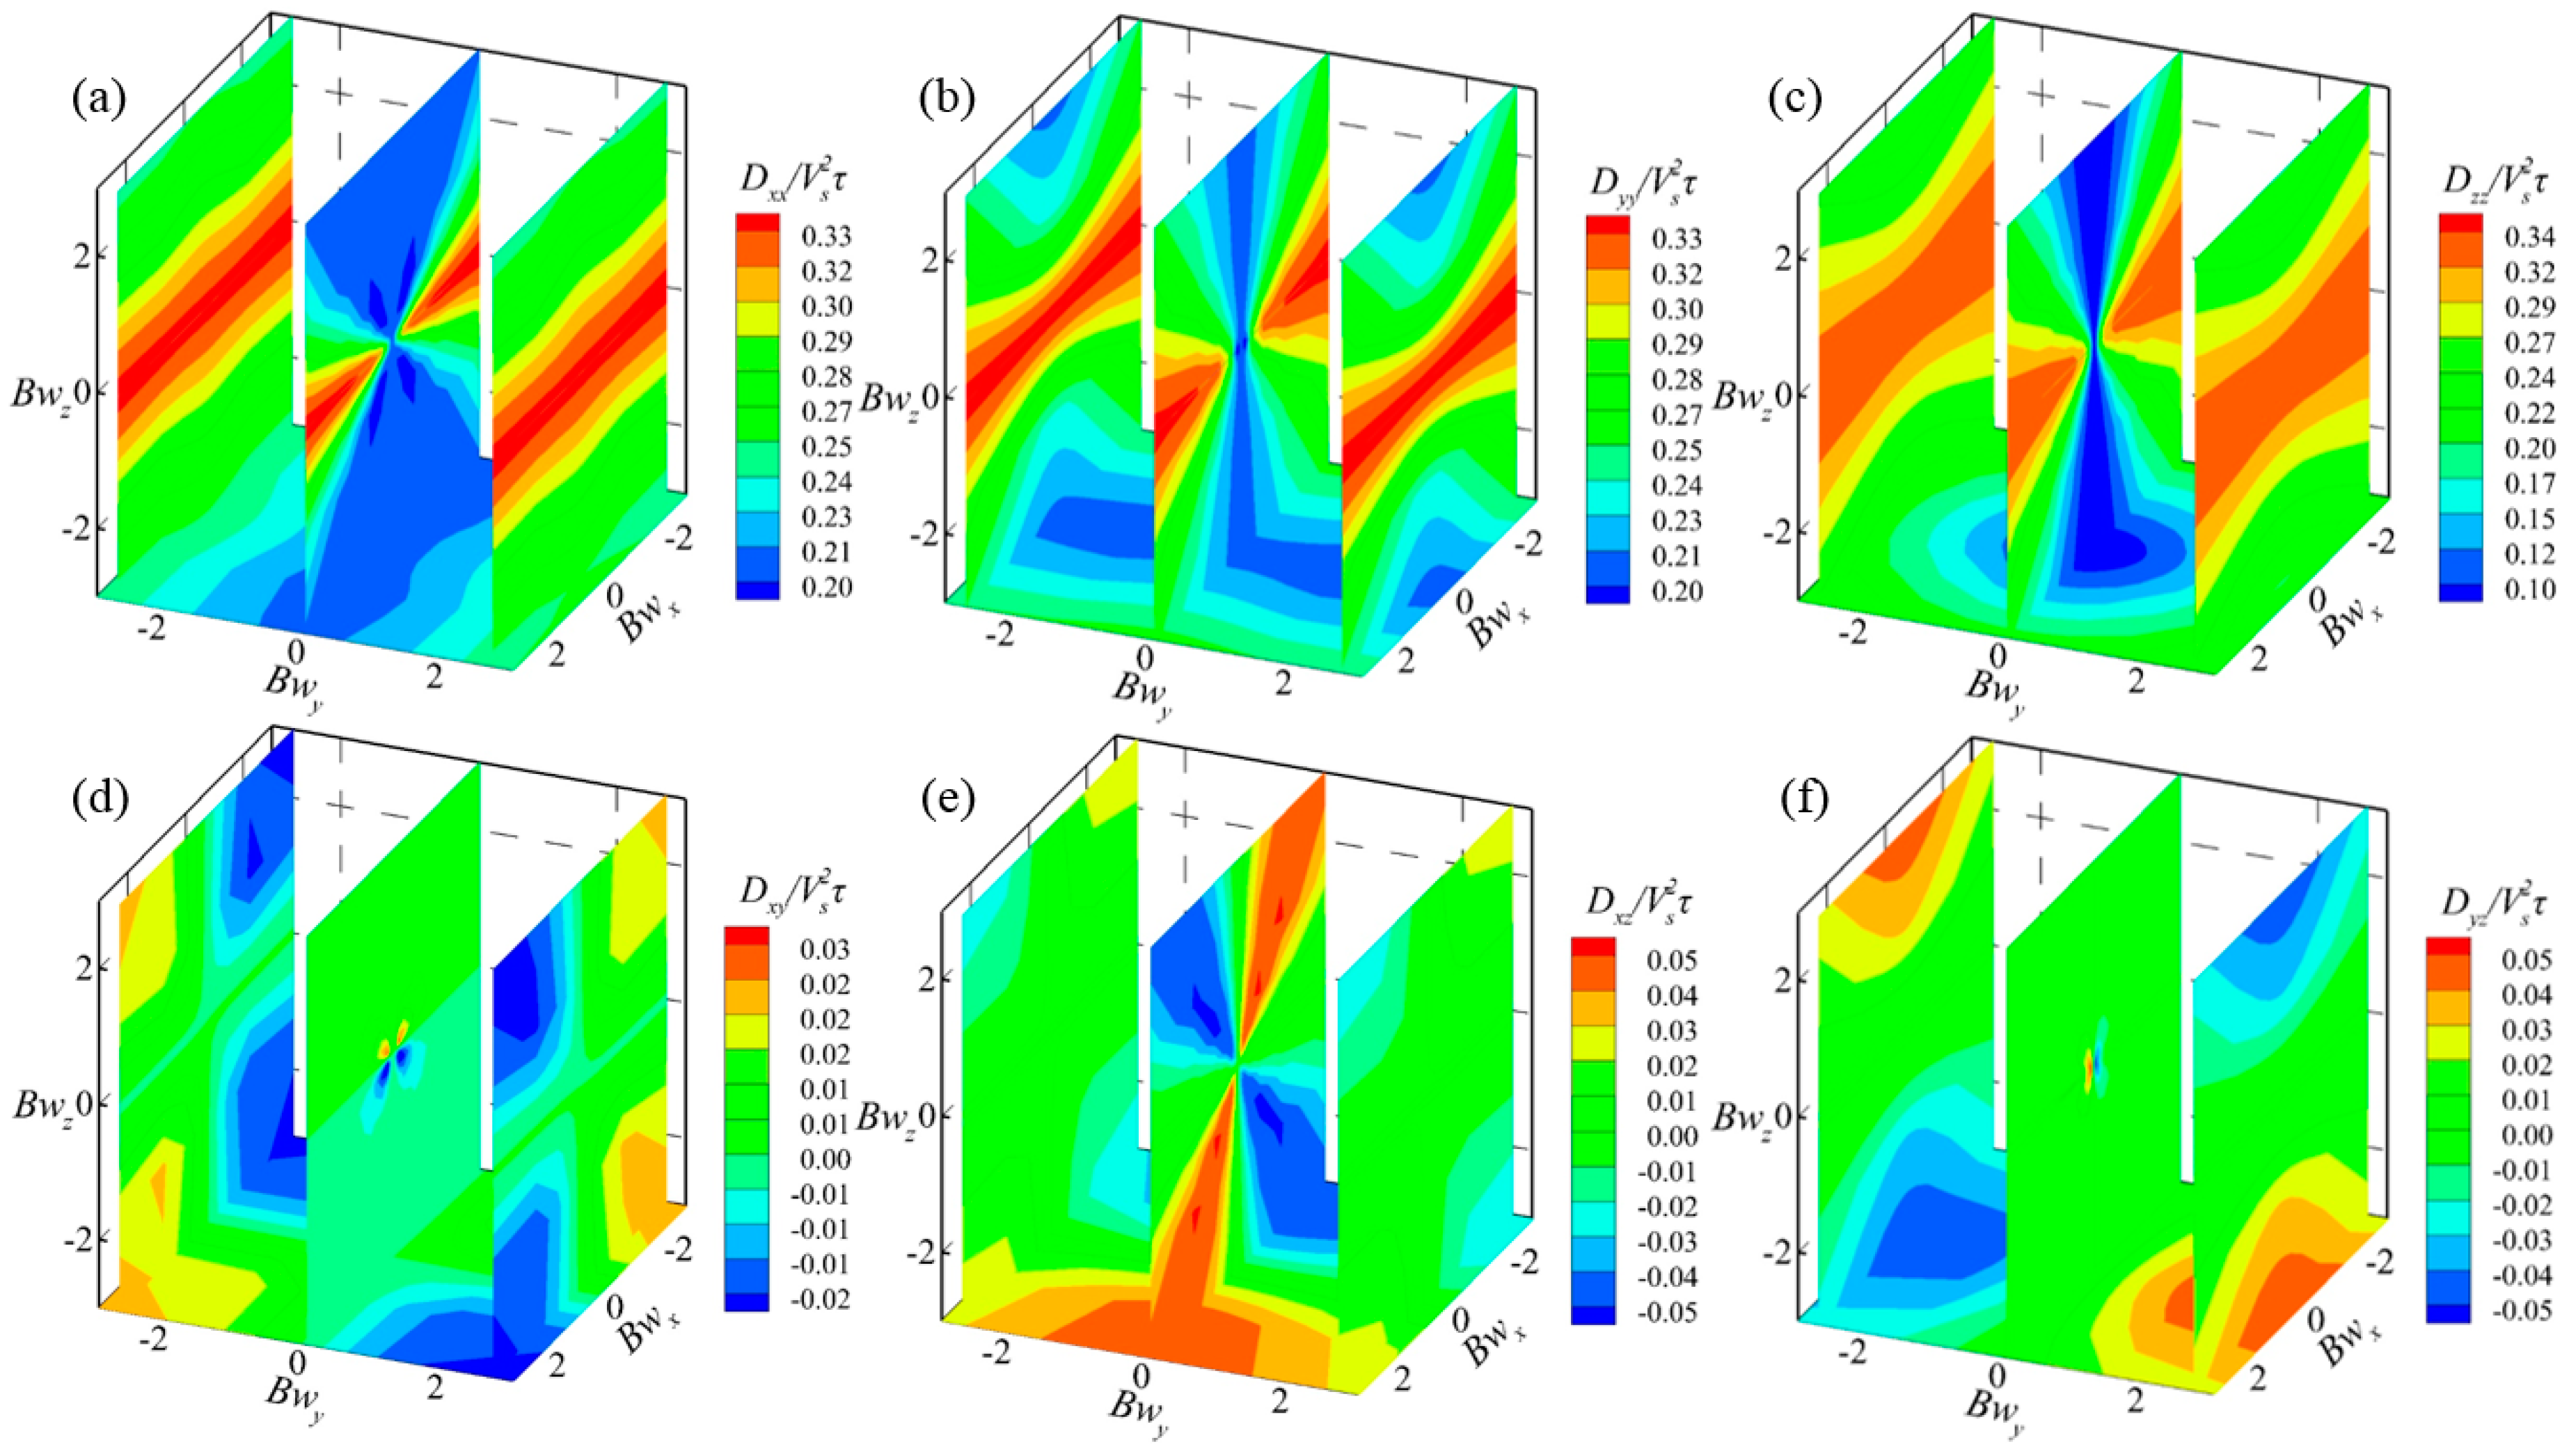
In the weak horizontal vorticity, wz slightly weakens the horizontal swimming velocity and components of D, while the strong horizontal vorticity enhances the gyrotaxis, as shown in Figure 18 and Figure 19.

4. Discussion

Some swimming patterns of gyrotactic micro-organisms found in previous studies [11,12,49,50] have also been observed in this work, such as helical trajectories, straight trajectories, and the combination of helical and straight trajectories, as shown in Figure 3d. In the present work, the Equation (3) for computing three-dimensional velocity of cells was based on the assumption that the swimming velocity of cells in x- and y-directions is isotropic, which has been testified by previous studies for gyrotactic micro-organisms [17].
The swimming velocity of H. akashiwo, to some extents, depends on external environments and its strains, as shown in Table 2. Harvey and Menden-Deuer [12] found that the swimming speed of H. akashiwo increased by 38% in the presence of a predator, while Strom et al. [23] found that the presence of a predator resulted in an increase of 22% and a decrease of 58% of swimming speed below and above halocline, respectively. Bearon et al. [11] noted that the gross swimming speeds of H. akashiwo in light phase are 49–66 µm/s and 88–119 µm/s for strain CCMP452 (Provasoli Guillard Center for Culture of Marine Phytoplankton, Maine, USA) and CCAP934-1(Culture Collection of Algae and Protozoa, North Sea, Norway), respectively. Havey et al. [25] also found similar variations of swimming velocity and turning rate due to strains. Recently, Sengupta et al. [26] revealed that different strains of H. akashiwo cells have different responses to turbulence cues. The algal cells in present work are originated from Zhoushan, China, where H. akashiwo frequently blooms, and the swimming velocity (measured at the 2nd–4th hour in the light phase) is relatively high compared with previous results. Parameters of various cells from previous studies and present work are listed in Table 2.
The effect of laser on the swimming direction of cells is studied by analyzing the swimming velocity in different frames; 1935 cells, walking through all the frames, were selected from all tests. The average values of Vz are 100.81, 105.15, and 104.24 μm/s for 1–10, 10–20, 20–30 frames, respectively, and the average values of V are 128.97, 132.55, 134.11 μm/s for 1–10, 10–20, 20–30 frames, respectively. Vz and V have a small fluctuation about 6 μm/s within 30 frames, much less than the mean swimming speed, which means that the effect of laser on the swimming direction of motile cells are negligible.
The swimming velocity of H. akashiwo probably depends on various factors, such as species, temperature, illumination, culture media, etc. With regard to the difference from previous works, some probable reasons we think come from the tiny difference of algal species, temperature of culture media, and the diel light cycle. The cells in the work [26] are cultivated at 21 °C or 18 °C under the diel light cycle (14 h light: 10 h dark), while the cells are the present experiment are cultivated at 25 °C under the diel light cycle (12 h light: 12 h dark). Furthermore, the cells (GY-H24, H. akshiwo, from Zhoushan, China, provided by Shanghai Guangyu Biological Technology Co., Ltd., Shanghai, China) used in the present work differ from those in the works [11,23,24,25,26]. The range of swimming velocity of H. akshiwo ranges from 20 to 156 μm/s [11,12,23,24,25,26], and the present velocity is closed to these results in References [12,24,26]. Besides, the present reorientation time of H. akshiwo is close to the results found in Reference [26].
The vertical migration of gyrotactic cells depends on the gyrotactic parameters of algal cells, hydrodynamic characteristics, and other external conditions, such as light, nutrients, temperature, etc. Mashayekhpour et al. [41] proposed that the high-gyrotaxis swimmers may reach the free water surface to form a high-concentration area, but the thermal stratification in lakes and oceans may disrupt cells’ motility and hinder corresponding accumulation [37]. Strong horizontal vorticity can make cells tumble [7], resulting in some interesting ecological phenomena, for example thin phytoplankton layer. In this study, it was shown that the vertical vorticity can weaken the effect of the strong horizontal vorticity on the vertical swimming velocity, as shown in Figure 19, which means that the gyrotactic swimmers can swim more easily towards the free surface in the flow with the strong vertical vorticity than in the flow with the weak vertical vorticity. The circulation with the strong vertical vorticity exists in the realistic flows due to topography and external factors, such as wind. However, further investigations needs to be performed to understand the effect of the combined actions of horizontal and vertical vorticity on the distribution of microorganisms in a specific flow.

5. Conclusions

The swimming characteristics of H. akashiwo in still water and a three-dimensional vorticity field were investigated based on the laser-based tracking method and the finite volume method. The results showed that the peak of fluorescence spectrum of H. akashiwo locates at 685 nm under the illumination of 450 nm laser. The swimming ability of H. akashiwo cells is independent of time for a given period about 50 min, and most motile cells swim vertically upwards due to the negative gravitaxis, though several cells walk down due to randomness. For all motile cells, the dimensionless parameter λ, which represents the relative strength of reorientation by gravitational torque to rotational diffusion, is in the range of 1.44–2.60, while for the cells only walking upward, corresponding range is 2.53–3.98. The reorientation time and rotational diffusivity are 5.6 s and 0.046 rad2/s, respectively. The swimming velocity and translational diffusion tensor of H. akashiwo change with the horizontal and vertical vorticity. Algal cells are able to keep the swimming direction in the weak horizontal vorticity, while they cannot swim towards a given direction in the strong horizontal vorticity. In the presence of horizontal vorticity, the effect of vertical vorticity enhances with the increase of wx and wy, though a single vertical vorticity would not change the swimming direction and diffusion characteristics.

Author Contributions

X.C. and Y.W. were responsible for experiments of cell swimming, X.C. and L.Z. performed and analyzed numerical simulations, X.C. and L.Z. wrote the paper.

Funding

This work is supported by the National Key R&D Program of China (2016YFC0502202), the IWHR Research & Development Support Program (HY0145B402016 and HY0145B682017), and the Independent Research Project of State Key Laboratory of Simulation and Regulation of Water Cycle in River Basin (2015RC01 and 2015ZY04).

Acknowledgments

We thank Gao Yunhua for technical support on the experiment of emission spectra of H. akashiwo. This manuscript benefitted greatly from the comments by three reviewers.

Conflicts of Interest

The authors declare no conflict of interest.

References

  1. Pedley, T.J.; Kessler, J.O. Hydrodynamic phenomena in suspensions of swimming microorganism. Annu. Rev. Fluid Mech. 1992, 24, 313–358. [Google Scholar] [CrossRef]
  2. Pedley, T.J.; Kessler, J.O. A new continuum model for suspensions of gyrotactic micro-organisms. J. Fluid Mech. 1990, 212, 155–182. [Google Scholar] [CrossRef] [PubMed]
  3. Hwang, Y.; Pedley, T.J. Bioconvection under uniform shear: Linear stability analysis. J. Fluid Mech. 2014, 738, 522–562. [Google Scholar] [CrossRef]
  4. Hwang, Y.; Pedley, T.J. Stability of downflowing gyrotactic microorganism suspensions in a two-dimensional vertical channel. J. Fluid Mech. 2014, 749, 750–777. [Google Scholar] [CrossRef] [Green Version]
  5. Durham, W.M.; Climent, E.; Barry, M.; Lillo, F.D.; Boffetta, G.; Cencini, M.; Stocker, R. Turbulence drives microscale patches of motile phytoplankton. Nat. Commun. 2013, 4, 2148. [Google Scholar] [CrossRef] [PubMed] [Green Version]
  6. Goldstein, R.E. Green Algae as model organisms for biological fluid dynamics. Annu. Rev. Fluid Mech. 2015, 47, 343–375. [Google Scholar] [CrossRef] [PubMed]
  7. Durham, W.M.; Kessler, J.O.; Stocker, R. Disruption of vertical motility by shear triggers formation of thin phytoplankton layers. Science 2009, 323, 1067–1070. [Google Scholar] [CrossRef] [PubMed]
  8. Bearon, R.N.; Grünbaum, D.; Cattolico, R.A. Effects of salinity structure on swimming behavior and harmful algal bloom formation in Heterosigma akashiwo, a toxic raphidophyte. Mar. Ecol. Prog. 2006, 306, 153–163. [Google Scholar] [CrossRef]
  9. Kempton, J.; Keppler, C.J.; Lewitus, A.; Shuler, A.; Wilde, S. A novel Heterosigma akashiwo (Raphidophyceae) bloom extending from a South Carolina bay to offshore waters. Harmful Algae 2008, 7, 235–400. [Google Scholar] [CrossRef]
  10. Durham, W.M.; Stocker, R. Thin phytoplankton layers: Characteristics, mechanisms, and consequences. Annu. Rev. Mar. Sci. 2012, 4, 177–207. [Google Scholar] [CrossRef] [PubMed]
  11. Bearon, R.N.; Grünbaum, D.; Cattolico, R.A. Relating cell-level swimming behaviors to vertical population distributions in Heterosigma akashiwo (Raphidophyceae), a harmful alga. Limnol. Oceanogr. 2004, 49, 607–613. [Google Scholar] [CrossRef]
  12. Harvey, E.L.; Menden-Deuer, S. Predator-induced fleeing behaviors in phytoplankton: A new mechanism for harmful algal bloom formation? PLoS ONE 2012, 7, e46438. [Google Scholar] [CrossRef] [PubMed]
  13. Hill, N.A.; Häder, D.P. A biased random walk model for the trajectories of swimming micro-organisms. J. Theor. Biol. 1997, 186, 503–526. [Google Scholar] [CrossRef] [PubMed]
  14. Zeng, L.; Pedley, T.J. Distribution of gyrotactic micro-organisms in complex three-dimensional flows. Part I. Horizontal shear flow past a vertical circular cylinder. J. Fluid Mech. 2018, 852, 358–397. [Google Scholar] [CrossRef]
  15. Sineshchekov, O.; Lebert, M.; Häder, D.P. Effects of light on gravitaxis and velocity in Chlamydomonas reinhardtii. J. Plant Physiol. 2000, 157, 247–254. [Google Scholar] [CrossRef]
  16. Martin, M.; Barzyk, A.; Bertin, E.; Peyla, P.; Rafai, S. Photofocusing: Light and flow of phototactic microswimmer suspension. Phys. Rev. E 2016, 93, 051101. [Google Scholar] [CrossRef] [PubMed]
  17. Chen, X.; Zeng, L.; Wu, Y.H.; Gao, Y.H.; Zhao, Y.J. Swimming characteristics of gyrotactic microorganisms in low-Reynolds-number flow: Chlamydomonas reinhardtii. Energy Ecol. Environ. 2017, 2, 289–295. [Google Scholar] [CrossRef]
  18. Croze, O.A.; Bearon, R.N.; Bees, M.A. Gyrotactic swimmer dispersion in pipe flow: Testing the theory. J. Fluid Mech. 2017, 816, 481–506. [Google Scholar] [CrossRef]
  19. Keppler, C.J.; Hoguet, J.; Smith, K.; Ringwood, A.H.; Lewitus, A.J. Sublethal effects of the toxic alga Heterosigma akashiwo on the southeastern oyster (Crassostrea virginica). Harmful Algae 2005, 4, 275–285. [Google Scholar] [CrossRef]
  20. Rensel, J.E.J.; Haigh, N.; Tynan, T.J. Fraser river sockeye salmon marine survival decline and harmful blooms of Heterosigma akashiwo. Harmful Alage 2010, 10, 98–115. [Google Scholar] [CrossRef]
  21. Tobin, E.D.; Grünbaum, D.; Patterson, J.; Cattolico, R.A. Behavioral and physiological changes during benthic-pelagic transition in the harmful alga, Heterosigma akashiwo: Potential for rapid bloom formation. PLoS ONE 2013, 8, e76663. [Google Scholar] [CrossRef] [PubMed]
  22. Kim, H.; Spivack, A.J.; Menden-Deuer, S. pH alters the swimming behaviors of the raphidophyte Heterosigma akashiwo: Implications for bloom formation in an acidified ocean. Harmful Algae 2013, 26, 1–11. [Google Scholar] [CrossRef]
  23. Strom, S.L.; Harvey, E.L.; Fredrickson, K.A.; Menden-Deuer, S. Broad salinity tolerance as a refuge from predation in the harmful raphidophyte alga Heterosigma akashiwo (raphidophyceae). J. Phycol. 2013, 49, 20–31. [Google Scholar] [CrossRef] [PubMed]
  24. Harvey, E.L.; Jeong, H.J.; Menden-Deuer, S. Avoidance and attraction: Chemical cues influence predator-prey interactions of planktonic protists. Limnol. Oceanogr. 2013, 58, 1176–1184. [Google Scholar] [CrossRef] [Green Version]
  25. Harvey, E.L.; Menden-Deuer, S.; Rynearson, T.A. Persistent intra-specific variation in genetic and behavioral traits in the raphidophyte, Heterosigma akashiwo. Front. Microbiol. 2015, 6, 1277. [Google Scholar] [CrossRef] [PubMed]
  26. Sengupta, A.; Carrara, F.; Stocker, R. Phytoplankton can actively diversify their migration strategy in response to turbulent cues. Nature 2017, 543, 555–558. [Google Scholar] [CrossRef] [PubMed] [Green Version]
  27. Häder, D.P.; Lebert, M. Real time computer-controlled tracking of motile microorganisms. Photochem. Photobiol. 1985, 42, 509–514. [Google Scholar] [CrossRef] [PubMed]
  28. Häder, D.P.; Vogel, K. Simultaneous tracking of flagellates in real time by image analysis. J. Math. Biol. 1991, 30, 63–72. [Google Scholar] [CrossRef]
  29. Vladimirov, V.A.; Denissenko, P.V.; Pedley, T.J.; Wu, M.; Moskalev, I.S. Algal motility measured by a laser-based tracking method. Mar. Freshw. Res. 2000, 51, 589–600. [Google Scholar] [CrossRef]
  30. Vladimirov, V.A.; Wu, M.S.C.; Pedley, T.J.; Denissenko, P.V.; Zakhidova, S.G. Measurement of cell velocity distributions in populations of motile algae. J. Exp. Biol. 2004, 207, 1203–1216. [Google Scholar] [CrossRef] [PubMed] [Green Version]
  31. Harvey, E.L.; Menden-Deuer, S. Avoidanve, movement, and mortality: The interactions between a protistan grazer and Heterosigma akashiwo, a harmful algal bloom species. Limnol. Oceanogr. 2011, 56, 371–378. [Google Scholar] [CrossRef]
  32. Leptos, K.C.; Guasto, J.S.; Gollub, J.P.; Pesci, A.I.; Goldstein, R.E. Dynamics of enhanced tracer diffusion in suspensions of swimming eukaryotic microorganisms. Phys. Rev. L 2009, 103, 198103. [Google Scholar] [CrossRef] [PubMed]
  33. Kessler, J.O. Hydrodynamic focusing of motile algal cells. Nature 1985, 313, 218–220. [Google Scholar] [CrossRef]
  34. Kessler, J.O. Individual and collective fluid dynamics of swimming cells. J. Fluid Mech. 1986, 173, 191–205. [Google Scholar] [CrossRef]
  35. Lillo, D.F.; Cencini, M.; Durham, W.M.; Barry, M.; Stocker, R.; Climent, E.; Boffetta, G. Turbulent fluid acceleration generates clusters of gyrotactic microorganisms. Phys. Rev. Lett. 2014, 112, 044502. [Google Scholar] [CrossRef] [PubMed]
  36. Ardekani, A.M.; Doostmohannadi, A.; Desai, N. Transport of particles, drops, and small organisms in density stratified fluids. Phys. Rev. F 2017, 2, 100503. [Google Scholar] [CrossRef]
  37. Lovecchio, S.; Zonta, F.; Marchioli, C.; Soldati, A. Thermal stratification hinders gyrotactic micro-organism rising in free-surface turbulence. Phys. Fluids 2017, 29, 053302. [Google Scholar] [CrossRef]
  38. Lovecchio, S.; Zonta, F.; Soldati, A. Influence of thermal stratification on the surfacing and clustering of floaters in free surface turbulence. Adv. Water Resour. 2014, 72, 22–31. [Google Scholar] [CrossRef]
  39. Zhan, C.; Sardina, G.; Lushi, E.; Brandt, L. Accumulation of motile elongated micro-organisms in turbulence. J. Fluid Mech. 2014, 739, 22–36. [Google Scholar] [CrossRef]
  40. Ardekani, M.N.; Sardina, G.; Brandt, L.; Karpboss, L.; Bearon, R.N.; Variano, E.A. Sedimentation of inertia-less prolate spheroids in homogenous isotropic turbulence with application to non-motile phytoplankton. J. Fluid Mech. 2017, 831, 655–674. [Google Scholar] [CrossRef]
  41. Mashayekhpour, M.; Marchioli, C.; Lovecchio, S.; Lay, E.N.; Soldati, A. Wind effect on gyrotactic micro-organism surfacing in free-surface turbulence. Adv. Water Resour. 2017. [Google Scholar] [CrossRef]
  42. Enriquez, R.M.; Taylor, J.R. Numerical simulations of the competition between wind-driven mixing and surface heating in triggering spring phytoplankton blooms. ICES J. Mar. Sci. 2015, 72, 1926. [Google Scholar] [CrossRef]
  43. Croze, O.A.; Sardina, G.; Ahmed, M.; Bees, M.A.; Brandt, L. Dispersion of swimming algae in laminar and turbulent channel flows: Consequences for photobioreactors. J. R. Soc. Interface 2013, 10, 20121041. [Google Scholar] [CrossRef] [PubMed]
  44. Hill, N.A.; Bees, M.A. Taylor dispersion of gyrotactic swimming micro-organisms in a linear flow. Phys. Fluids 2002, 14, 2598–2605. [Google Scholar] [CrossRef] [Green Version]
  45. Manela, A.; Frankel, I. Generalized Taylor dispersion in suspensions of gyrotactic swimming micro-organisms. J. Fluid Mech. 2003, 490, 99–127. [Google Scholar] [CrossRef]
  46. Bearon, R.N.; Hazel, A.L.; Thorn, G.J. The spatial distribution of gyrotactic swimming micro-organisms in laminar flow fields. J. Fluid Mech. 2011, 680, 602–635. [Google Scholar] [CrossRef]
  47. Bearon, R.N.; Bees, M.A.; Croze, O.A. Biased swimming cells do not disperse in pipes as tracers: A population model based on microscale behaviour. Phys. Fluids 2012, 24, 121902. [Google Scholar] [CrossRef]
  48. Pedley, T.J.; Kessler, J.O. The orientation of spheroidal microorganisms swimming in a flow field. Proc. R. Soc. Lond. 1987, 231, 47–70. [Google Scholar] [CrossRef]
  49. Fehchle, T. How dinoflagellates swim. Protist 2001, 152, 329–338. [Google Scholar] [CrossRef]
  50. Visser, A.W.; Kirboe, T. Plankton motility patterns and encounter rates. Oecologia 2006, 148, 538–546. [Google Scholar] [CrossRef] [PubMed]
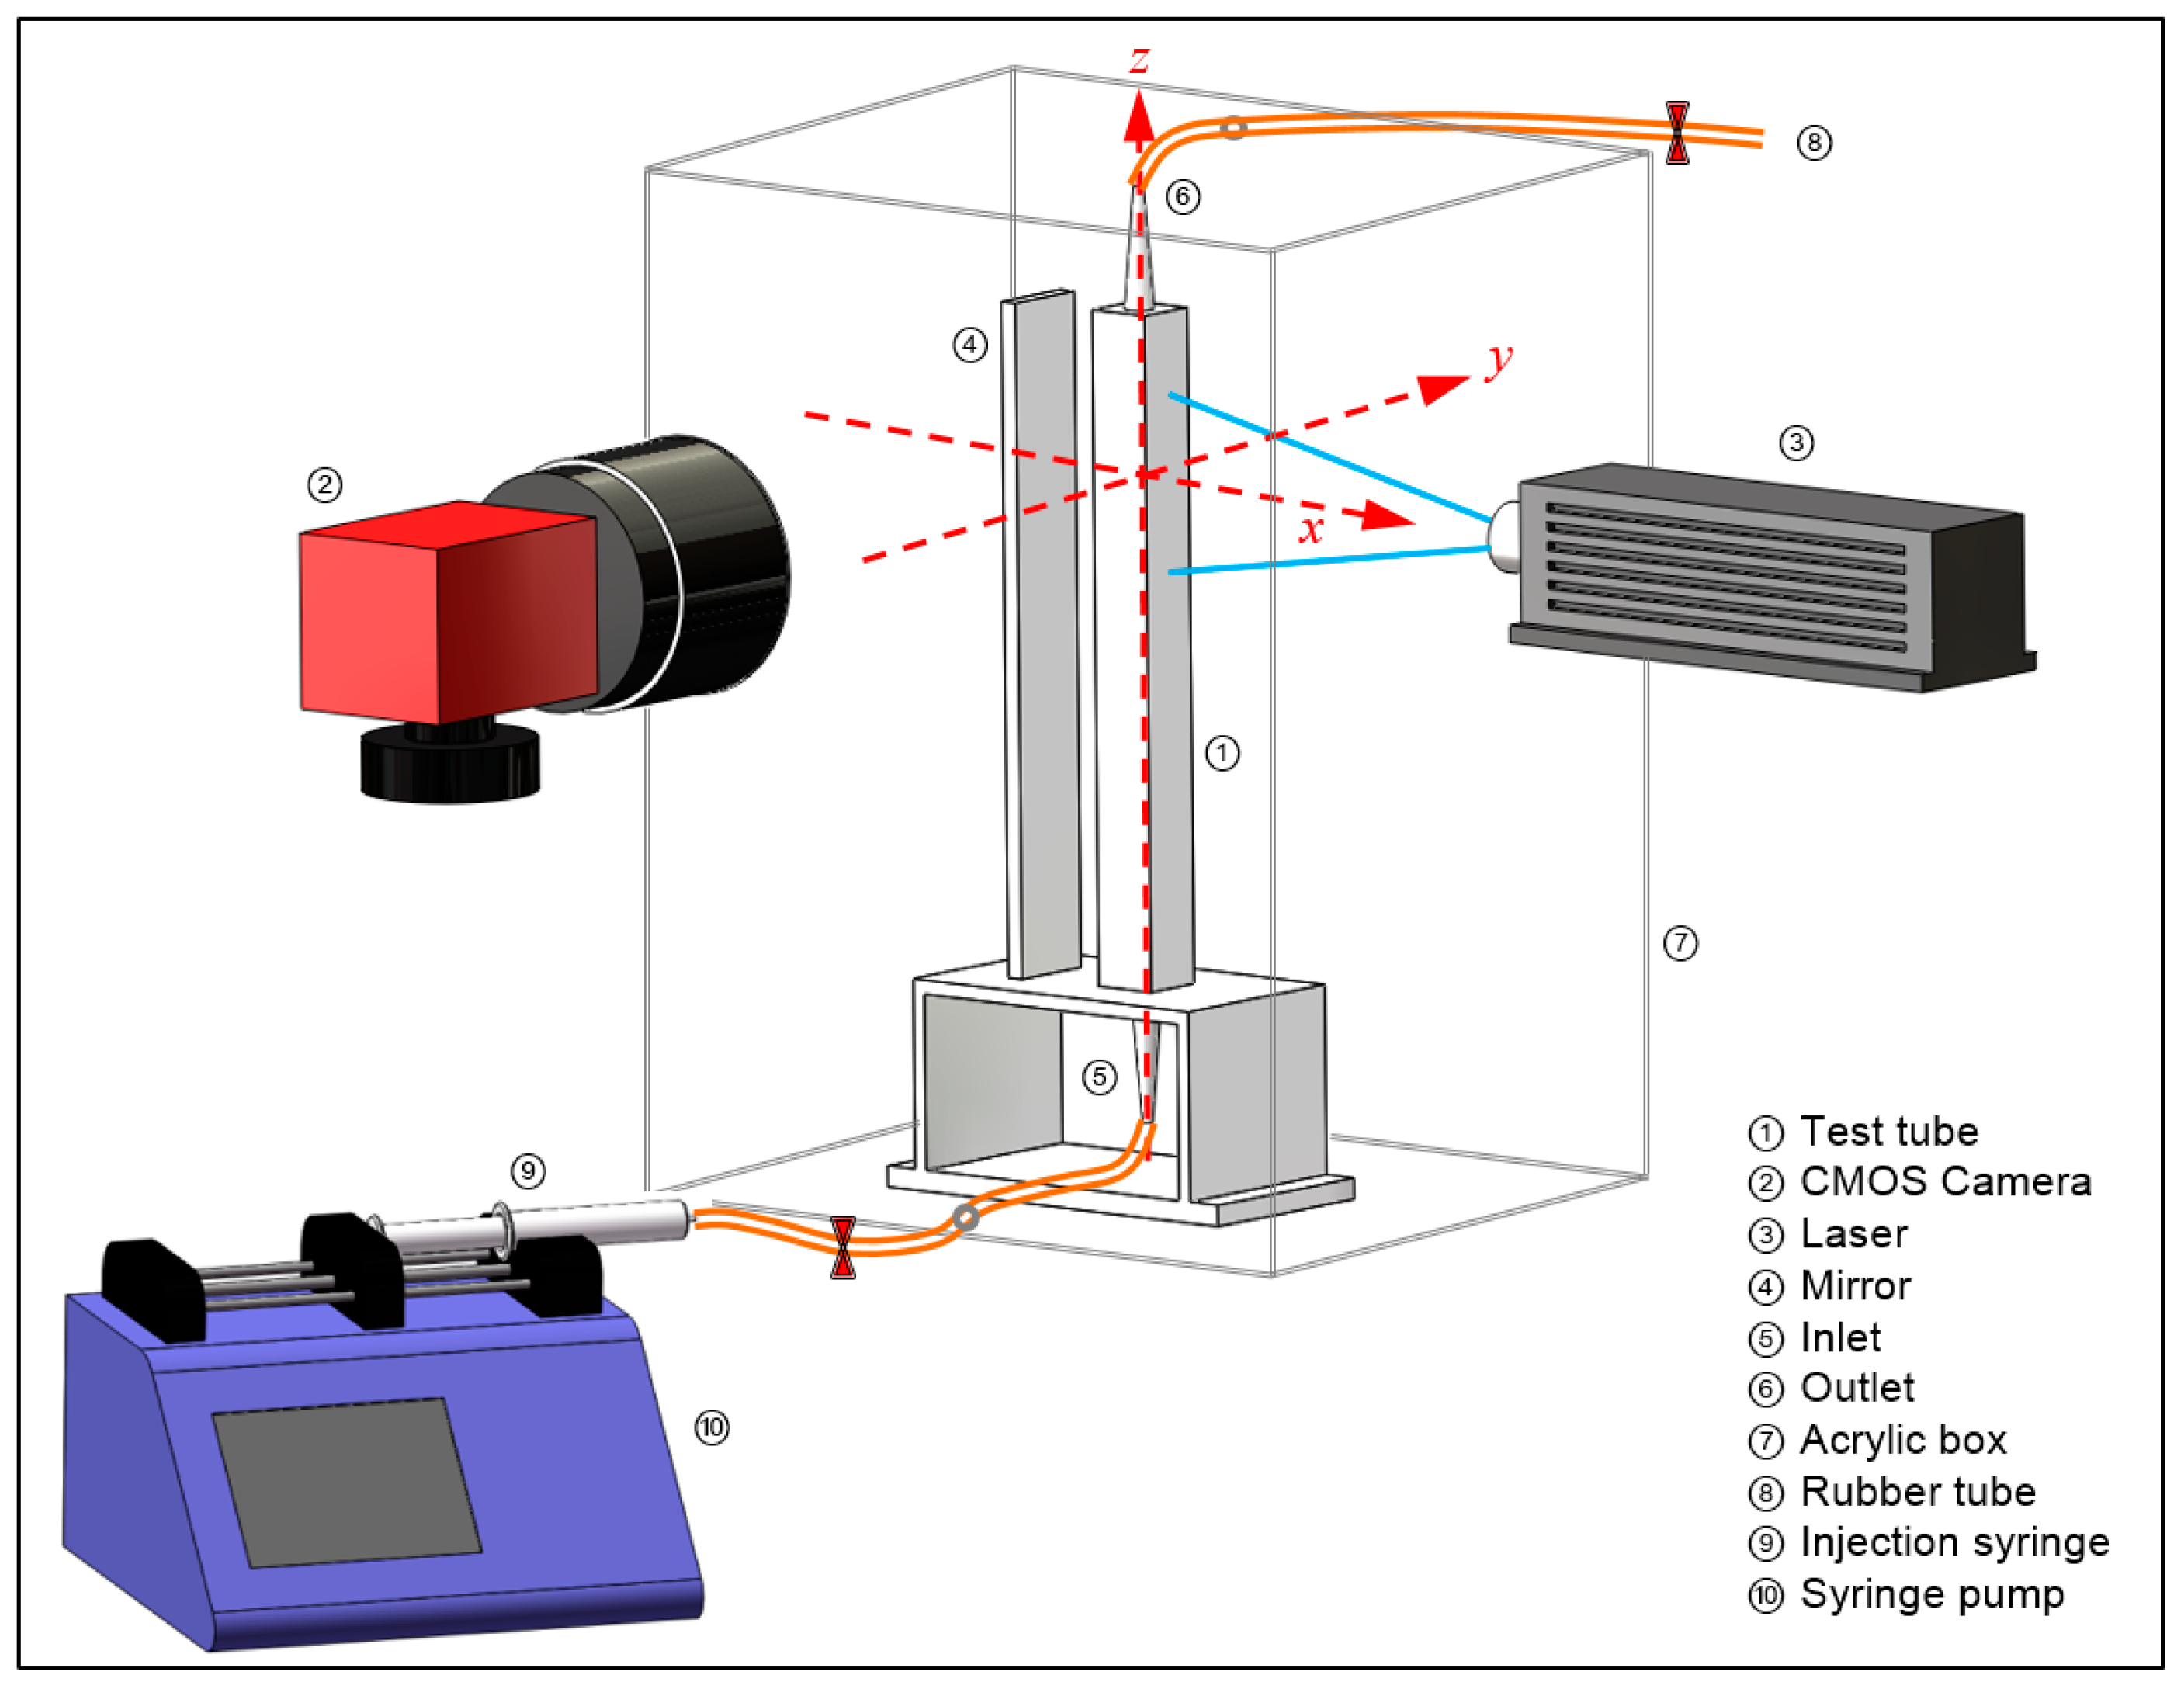
Figure 1. Experimental setup.
Water 10 01455 g001
Figure 2. Emission spectra of Heterosigma akashiwo under various spectrums of lasers.
Water 10 01455 g002
Figure 3. Images of motile cells: (a) algal cells (represented by dark spots) in one frame, (b) trajectories of cells in 30 frames, (c) one track/trajectory with dozens of walks, and three swimming patterns: (d1) helical trajectories, (d2) straight trajectories, and (d3) trajectories combined helical and straight ones.
Water 10 01455 g003
Figure 4. Definition of swimming direction.
Water 10 01455 g004
Figure 5. Distribution of probability density of swimming velocity: (a) f (V), f (Vx), and f (Vz) in all tests, (b) f (Vz) at different time, (c) f (Vx) at different time, and (d) f (V) at different time.
Water 10 01455 g005
Figure 6. Distribution of f(Vx, Vz) at different time: (a) 20 min, (b) 25 min, (c) 30 min, (d) 35 min, (e) 40 min, (f) 45 min, (g) 50 min, and (h) 55 min.
Water 10 01455 g006
Figure 7. Statistical parameter of the swimming velocity V, Vx, and Vz and at different time: (a) mean velocity, (b) standard deviations (σ), and (c) deviation coefficient (Cs).
Water 10 01455 g007
Figure 8. Distribution of f(θ), (a) spatial distribution of f(θ), and (b) f(θ) at different time.
Water 10 01455 g008
Figure 9. Swimming trajectories (100 tracks) of H. akashiwo cells in x-z plane: (a) t = 20 min, and (b) t = 55 min.
Water 10 01455 g009
Figure 10. f(V,θ) at (a) 25 min, (b) 35 min, (c) 45 min, (d) 55 min.
Water 10 01455 g010
Figure 11. Distribution of ln[f(V,θ)]: (a) ln[f(V,θ)] versus V and cosθ, (b) ln[f(V,θ)] versus cosθ for given V.
Water 10 01455 g011
Figure 12. λ at different values of V with the red bars corresponding to the values of all cells in tests and the black bars corresponding to the values of cells that only walk upwards.
Water 10 01455 g012
Figure 13. Variation of average turning amplitude with time at different angles α(0).
Water 10 01455 g013
Figure 14. Turning speed of cells at different initial swimming angles.
Water 10 01455 g014
Figure 15. Variance of the turning amplitude at different time for various angles α(0).
Water 10 01455 g015
Figure 16. Dr at different initial swimming angles.
Water 10 01455 g016
Figure 17. Variation of swimming velocity (a) and translational diffusivity tensor (b) with wy.
Water 10 01455 g017
Figure 18. Swimming velocity, (a) Vx/Vs, (b) Vy/Vs, and (c) Vz/Vs with wx, wy, and wz.
Water 10 01455 g018
Figure 19. Translational diffusion tensor, (a) Dxx/Vs2τ, (b) Dyy/Vs2τ, (c) Dzz/Vs2τ, (d) Dxy/Vs2τ, (e) Dxz/Vs2τ, and (f) Dyz/Vs2τ with wx, wy, and wz.
Water 10 01455 g019
Table 1. The number of tracks at different time for three tests.
Sets20 min25 min30 min35 min40 min45 min50 min55 min
1N11N12N13N14N15N16N17N18
2N21N22N23N24N25N26N27N28
3N31N32N33N34N35N36N37N38
SumN1N2N3N4N5N6N7N8
Table 2. Gyrotactic parameters of various algal cells.
AlgaeV (μm s−1)B (s)Dr (rad2 s−1)Paper
C. nivalis633.40.067[1,2]
C. nivalis552.70.084[13]
C. nivalis3860.036[30]
D. salina62.7 ± 0.410.5 ± 1.30.23 ± 0.06[18]
H. akashiwo-2-[7]
H. akashiwo (CCMP3107)-4.9 ± 1.5-[26]
H. akashiwo (CCMP452↑ a)74.5 ± 42.419.3 ± 13.5-[26]
H. akashiwo (CCMP452↓ b)73.8 ± 46.2−23.1 ± 10.2-[26]
H. akashiwo (CCMP452)49–66--[11]
H. akashiwo (CCAP934-1)88–119--[11]
H. akashiwo20–145--[12]
H. akashiwo (CCMP3107)25–58--[23]
H. akashiwo85–135--[24]
H. akashiwo (7 strains)33–115--[25]
H. akashiwo (GY-H24)117–1565.60.046Present work
a The population of algae that swim upwards (negative gravitaxis). b The population of algae that swim downwards (positive gravitaxis).