Article

Which Drivers Control the Suspended Sediment Flux in a High Arctic Glacierized Basin (Werenskioldbreen, Spitsbergen)?

by
Elżbieta Łepkowska
1,* and
Łukasz Stachnik
2
1
Faculty of Earth Sciences, University of Silesia, Będzińska 60, 41-200 Sosnowiec, Poland
2
Department of Physical Geography, University of Wrocław, Wojciecha Cybulskiego 34, 50-205 Wroclaw, Poland
*
Author to whom correspondence should be addressed.
Water 2018, 10(10), 1408; https://doi.org/10.3390/w10101408
Submission received: 28 August 2018 / Revised: 3 October 2018 / Accepted: 4 October 2018 / Published: 10 October 2018
(This article belongs to the Section Hydrology)

Abstract

:
A unique data set of suspended sediment transport from the Breelva, which drains the Werenskioldbreen (Southwestern Spitsbergen), is reported for the period 2007–2012. This basin is thoroughly described hydrologically, glaciologically, and chemically. However, until now there was a lack of full recognition of mechanical denudation. This study extends the information on quantitative suspended sediment load (SSL), amounting to 37.30–130.94 kt per year, and also underlines the importance of its modification by high discharge events, triggered by intense snowmelt or heavy rainfall. The large floods during the hydrologically active season transported even 83% of the total SSL. The variability of the SSL is controlled by glacial storage and release mechanisms. Particularly interesting is the second half of the hydrologically active season when intense rainfall events plays a key role in shaping the sediment supply pattern. The main source of fine mineral matter is the basal moraine, drained by subglacial outflows. Their higher mobilization occurs when the hydrostatic pressure increases, often as a result of rainwater supply to the glacier system. An increasing precipitation trend for Hornsund fjord region determines a positive trend predicted for sediment flux.

Graphical Abstract

1. Introduction

Sediment yield from a glacierized basin can be used as an indicator of hydrological and sedimentological response to climate change [1]. Climate-driven increases in the ablation rate, resulting from higher air temperatures, tend to strengthen the positive trend in suspended sediment yield from glacierized areas. The intense glacier erosion, observed through high suspended sediment loads, has been a dominant geomorphological process in the high latitudes for over the last 10,000 years, as marine and lacustrine sediments records show [2,3]. Recently, the suspended sediment yield and its dynamics appear to play an important role in the biological pump by delivering sediment-bound nutrients (Si, Fe, P, N) to glacier sourced estuaries and, potentially, to the open oceans [4,5,6,7,8].
The fine mineral matter originates from the glacier and the ice-marginal or proglacial parts of the catchment and is delivered to surface waters [9,10]. Snowmelt- and rainfall-induced mass movement on ice-free slopes and lateral moraines are one of the sources of sediments [11,12]. Other sources of sediment are ice-cored moraines and frozen sediments thawing, which produce potentially more material to transport [11,13]. Finally, suspended sediment originates from subglacial drainage due to high erosion by meltwater occurring at the contact between glacier and bedrock or subglacial sediments [14]. Warm-based glaciers, with basal ice at the pressure melting point, are found to have higher rates of bed erosion due to the seasonal and interannual variability of liquid water volume leading to high sediment yields [12].
Suspended sediment loads (SSLs) differ markedly in glacierized basins worldwide [15]. Bogen and Bønsnes [16] showed, using a long series of sediment load measurements, that sediment supply is primarily controlled by bedrock susceptibility to mechanical erosion and secondarily by glaciological parameters (e.g., basal sliding speed, glacier size, ice flux, the development of a subglacial drainage system). For High-Arctic glaciers, the sediment transport depends on the thermal regime at the glacier bed. Cold-based glaciers (e.g., Austre Brøggerbreen) are dominated by sediment supply from ice-marginal zones (e.g., slope, moraine, outwash plain) [12]. The basins with polythermal and temperate glaciers (e.g., Erdmannbreen, Finsterwalderbreen) supply sediment mainly from subglacial drainage. In this process, the evolution of the subglacial drainage system from distributed to channelized controls the sediment supply throughout the ablation season [12]. Therefore, at the ablation peak, suspended sediment loads increase as a consequence of a well-developed extensive network of channels under the glacier. Also, the time lag between the suspended sediment concentration (SSC) and the discharge (Q) changes during the ablation season, because of the change in the surface areas of sediment sourcing zones [17,18].
The SSC-Q relationship is crucial for the determination of sediment dynamics from glacierized basins during ablation season. For example, Vatne et al. [19] at Finsterwalderbreen and Hodson et al. [18] at Brøggerbreen indicate that glaciers in Svalbard have a similar relationship between suspended sediment concentration and discharge. The modeling of the SSC-Q relationship suffers from the weak estimation of SSC associated with high discharge events as the direct observations are sparse [20]. At the average and low discharge, SSC sampling required to establish a model can be reduced to every fourth day [20]. Additionally, the high sediment yield associated with the high discharge requires a better estimation of the SSC-Q relationship in these conditions. Apart from modeling approach, a helpful way to determine the SSC-Q relationship is to use diurnal and seasonal hysteresis. In hysteresis, the clockwise pattern suggests that sediments are relatively available for transport and have a rapid response to increased discharge. On the other hand, an anticlockwise pattern suggests that sources of sediment were not readily available for transport and it usually appears after an episode of permafrost disturbance and enhanced erosion (e.g., at the end of the preceding hydrological cycle) [13,21].
Sediment storage and mechanical denudation are two opposite processes documented for glacierized catchments. Hodson and Ferguson [12] and Pälli et al. [22] examined sediment storage, denudation rates, and spatial sediment fluxes from proximal (i.e., directly at the terminus of the glacier) and distal ends of a 4.2 m2 proglacial area for the Finsterwalderbreen, a basin of a polythermal glacier in central Spitsbergen. The proglacial area acts as a sediment source at high discharges during peak ablation due to the high glaciofluvial erosion. When discharge decreases (usually at the end of the season), the role of the proglacial area alters towards a sink of suspended sediment, which is observed through sediment deposition at the river bed, on its banks, and in small lakes. During this period, mechanical denudation can be expected at high water levels, while accumulation predominates at low water levels. Therefore, the discharge regime throughout the ablation season determines the sink/source of sediment in the basin. Further sediment storage and mechanical denudation in a longer time period are highly dependent on the interannual change in discharge regime [23,24].
The seasonal and interannual course of the SSC depends on changes in the rate of meltwater production, which is associated with meteorological factors. The diurnal amplitude of suspended sediment concentration is associated with the ablation rate, controlled by air temperature and incoming solar radiation (e.g., [18,25,26,27]). Also, Irvine-Fynn et al. [11] pointed out that SSC variations are related to energy fluxes and thaw-related processes directly connected to meteorological conditions. They excluded rainfall in the model, indicating that its variability has a low impact on the sediment transport. The air temperature, rather than rainfall events, was also shown in recent studies to be the primary control of the sediment transport [26]. Future warming will tend to extend the hydrologically active period and the permafrost thaw depth in the proglacial zone. On the other hand, other studies emphasized the importance of large rain-induced floods resulting in elevated suspended matter entrainment [16,28].
The above studies show that polythermal glaciers are particularly important for research on the dynamics of the suspended sediment transport in the face of climate change. The influence of meteorological factors on SSC and Q pattern, as well as the importance of sediment sources, prompted us to undertake research in the Werenskioldbreen catchment. Here, we present long term and rare (for the Arctic) data on this basin. To determine the present and future changes in the suspended sediment transport, we conducted a detailed study, explaining:
(1)
how high discharge events, such as intense snowmelt and heavy rainfall, modify the suspended sediment transport in a polythermal glacier basin,
(2)
where are the main sediment sources during floods throughout the hydrologically active season in the examined basin.
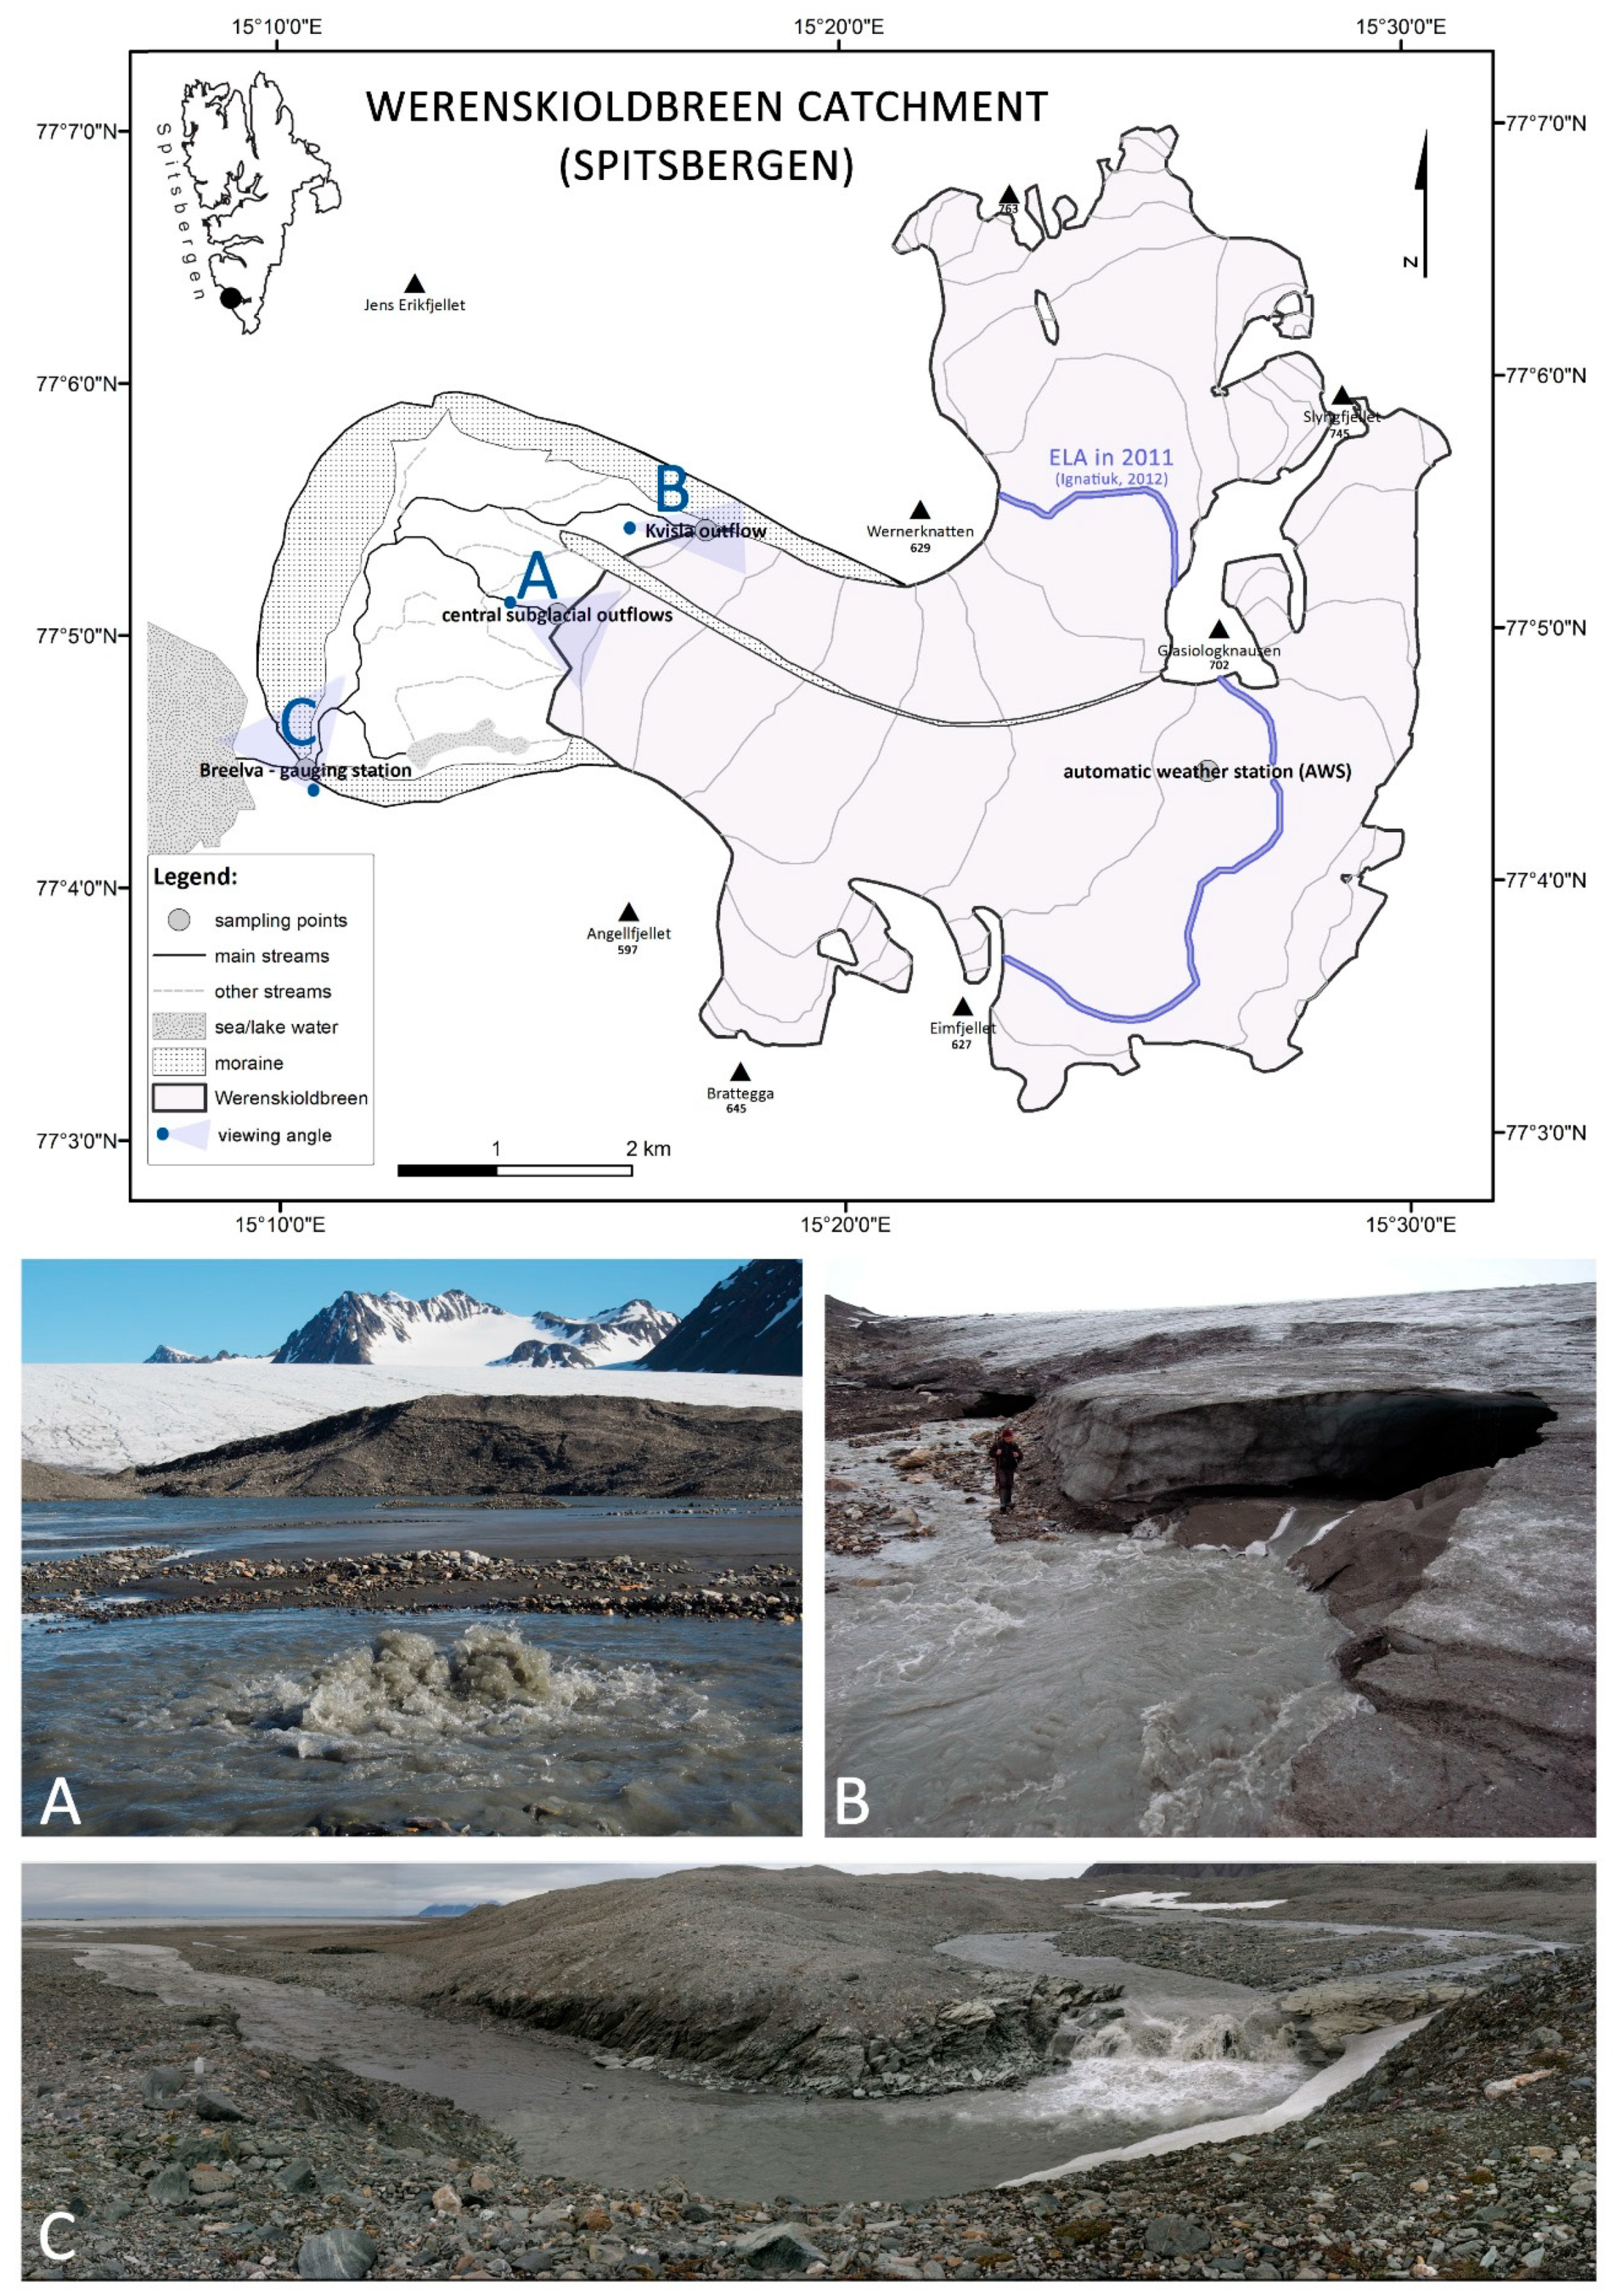
2. Study Area

The study was conducted in the forefield of Werenskiold Glacier, in the Hornsund fjord region. Werenskioldbreen is a medium-sized (27.1 km2), polythermal land-based glacier. It covers about 60% of its 44 km² basin [29,30]. The maximum elevation of the firn field is 650 m a.s.l., the equilibrium line attitude (ELA) is at about 400 m a.s.l., and the glacier terminus lies at 40–60 m a.s.l. [30,31]. Its hydrological situation, including the location of the main subglacial outflows, largely corresponds to the drainage model described by Pälli et al. [22] and improved by Grabiec [32]. Moreover, the ablation season meltwater chemistry of the glacier-fed icings shown by Stachnik et al. [33] indicates the existence of several independent subglacial channel systems. Outflows from the Werenskioldbreen take the form of karst springs, geysers, and a type Röthlisberberger (R) subglacial outflow channel. The main outflow, located in the northern part of the glacier, originates in an ice-gate and creates the Kvisla River. This conduit collects about 80% of the total water yield of the Werenskioldbreen subglacial drainage, being an important agent of subglacial erosion [34]. In the central part of the glacier foreland, subartesian outflows emerge from inactive glacier ice (called the Black and the Second Black Spring). The Angelisen subglacial drainage system is separate and its outflow is located near the southern margin of the glacier [33]. All streams in the proglacial area are combined and create the Breelva River. The Breelva breaks through the ice-cored moraine in the southern part of the basin, approximately 1.6 km from the glacier front. In this natural gauging point, a hydrometric station was located, where discharge and suspended sediment transport were measured (Figure 1).
The Werenskioldbreen is located at the intersection of three tectonic blocks of the Hecla Hoek the formation, consisting of rocks older than Devonian, which was subject to the Caledonian folding on Svalbard [35]. The main source for the washed out suspended and dissolved mineral matter are the geological formations of the front of the Werenskioldbreen, which are mainly built of meta-sediments [35,36]. Proglacial sediments and pebbles, glacioflvially deposited in the Werenskioldbreen catchment, are described by Kabala and Zapart [37] and Kowalska and Soroka [38]. The presence of calcium carbonate in the foreland of the glacier was studied by Bukowska-Jania [39] and sulfide oxidation was examined by Stachnik et al. [40] and Szynkiewicz et al. [41]. All authors emphasize that the suspended sediment consists of chlorite, feldspars, muscovite, quartz, calcite, and dolomite.

3. Methods

3.1. Discharge and Meteorological Data

Discharge measurements were conducted from May/June/July to September/October in the years 2007–2012. Direct observation periods were 62, 51, 61, 40, 121, and 35 days in the consecutive years. The data set was obtained from CTD-DIVER DI 261 or Mini-Diver (Van Essen Instruments, Delft, The Netherlands) logger with barometric compensation by BaroDiver (Schlumberger, Houston, TX, USA) with 10-min intervals and flow velocities were measured with a SEBA F1 current meter (SEBA Hydrometrie GmbH, Kaufbeuren, Germany). Total annual runoff from Werenskioldbreen basin was calculated for the whole catchment area and for the entire hydrologically active period (Table 1). More details have been reported by Majchrowska et al. [42].
Rainfall used in this analysis was recorded at the year-round Polish Polar Station in Hornsund (WMO 01003), located 16 km south-eastward from the hydrometric station, 10 m a.s.l., at the geographical coordinates 77°00′ N 15°33′ E [43,44].

3.2. Suspended Matter Sampling and Laboratory Analysis

Suspended sediment samples from the Breelva River and subglacial outflows were collected manually (mainly) or using a ISCO 6712 suspended sediment sampler (Teledyne ISCO, Lincoln, NE, USA) at the gauging station (partly in 2011). Both methods have been compared and are statistically significantly correlated (r > 0.9, p < 0.001). Volumetric samples (0.5 dm−3) were filtered with 0.7 µm Whatman GF/F filters (Sigma-Aldrich, Darmstadt, Germany), then dried at 105 °C and weighed twice [45]. Seven hundred and seventy-three (n = 773) of water and sediment samples were collected two or three times per day (at 0:00, 8:00, and 16:00 or 8:00, and 20:00 local time), including several hourly or bi-hourly, 24-h cycles at the river bank at the gauging point and once a day in subglacial outflows (a complete series in 2012). Daily sampling strategies were chosen based on SSC in the Breelva course in 2007 (Figure 2). Figure 3 presents the sampling period in each year. Grain size analyses for 2012 were carried out on a Mastersizer 2000 laser refraction particle size analyzer (Malvern Panalytical, England, UK) with 60-s runs. Daily mean grain size was calculated based on the formula of Folk and Ward [46].

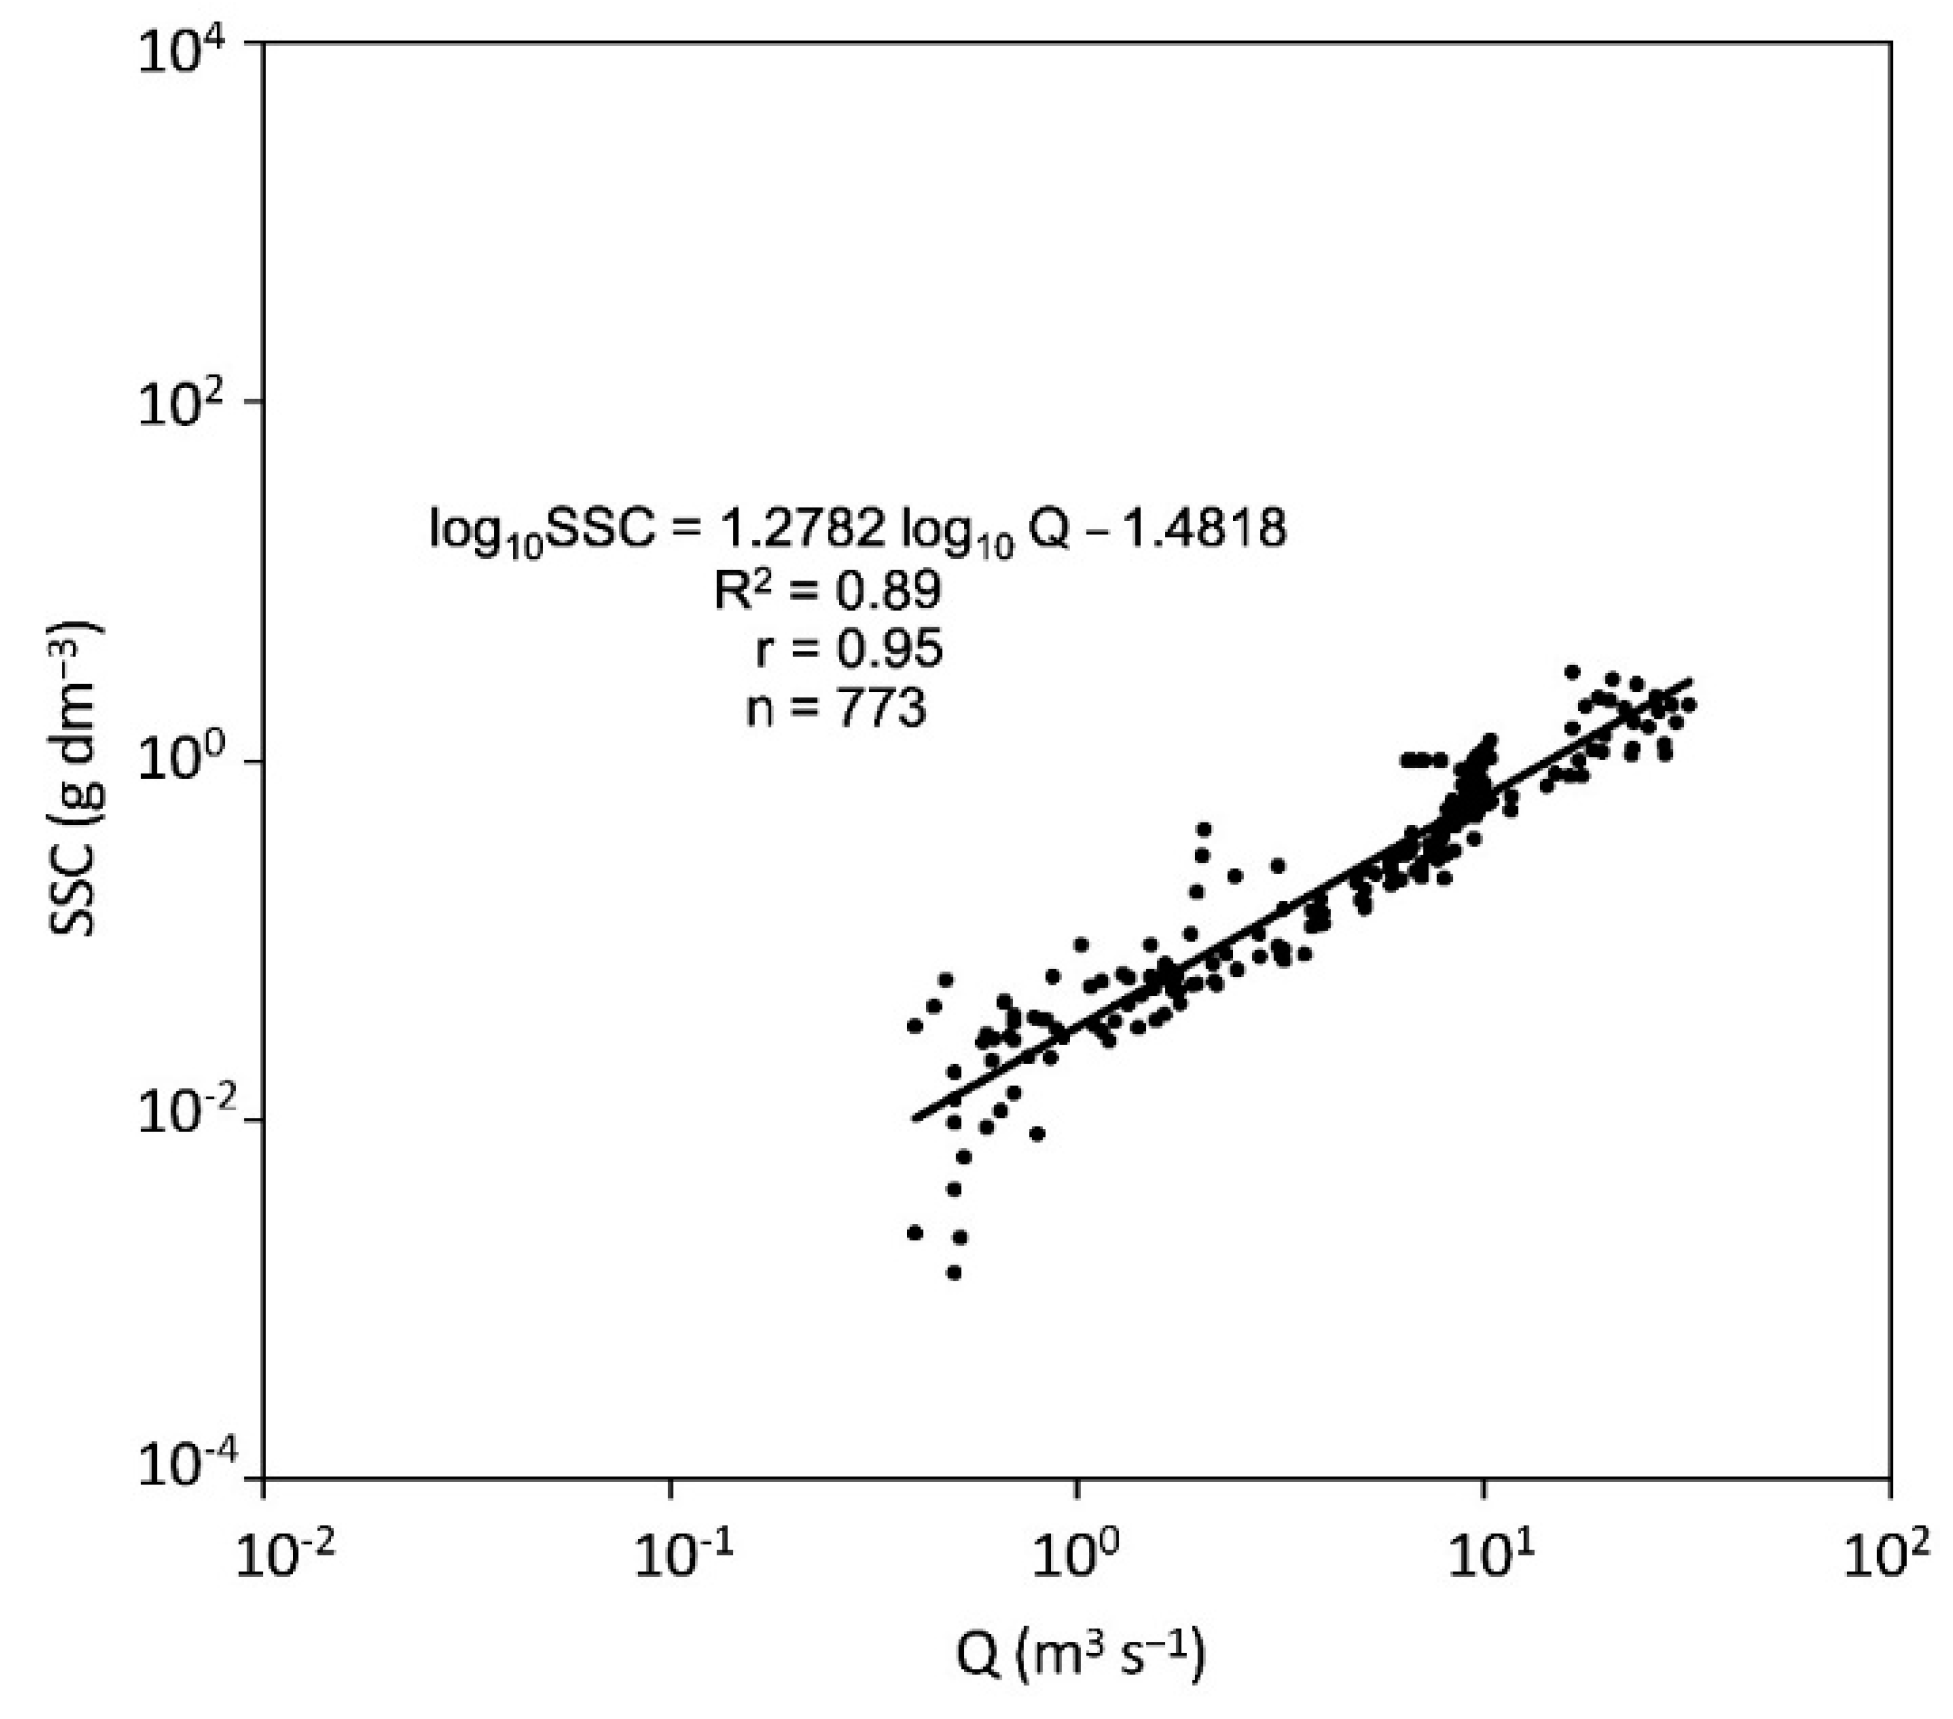
3.3. Methods of Estimation of the Suspended Sediment Concentration and Load

Suspended sediment concentration (SSC) values were multiplied by the daily runoff (m3) to determine the suspended sediment loads (SSLs), which were summed to find the annual sediment yield (t), calculated as the effective mechanical erosion rate (mm year−1 and t km−2), assuming a sediment density of 2500 kg m−3. The direct monitoring of SSC was constrained logistically and by the expedition timing. Missing data was completed based on commonly known linear log-log relationship between the SSC and discharges [47,48]. The correlations between average daily suspended sediment concentration and discharge are reported using Pearson r (r = 0.95, p < 0.001). The determined suspended sediment rating curve was very robust with an R2 = 0.8851 (Figure 4). The strong correlation between these components is widely known, despite the fact that the SSC is modified by other factors such as energy fluxes and thaw-related processes [18,49]. Additionally, discharge and SSC are typically well correlated for polythermal glaciers, such as Werenskioldbreen, where sediment store is often built up under the glacier [50]. Moreover, the strong SSC-Q relationship for the studied glacier was also confirmed by Pulina [51] and Krawczyk and Opołka-Gądek [52]. For this reason, we decided to use a simplified method of estimating the approximate sediment yield for Werenskioldbreen.

3.4. Hysteresis Index for Peak Runoff Events

The origin of floods is highlighted by the hysteresis effect (dependence of the current state on the preceding states). In the case of snowmelt floods, the culmination of the suspended sediment concentration is observed before the culmination of discharge, while in the case of peaks caused by a heavy rainfall, these culminations are synchronized. In this study, a hysteresis index (HImid) developed by Lawler et al. [53] was used to characterize the direction and magnitude of event hysteresis relationships.
The determination of the hysteresis index (HImid) value for a particular event required the mid-value discharge (Qmid) calculation:
  Q mid = k ( Q max Q min ) + Q min  
where Qmax is the peak discharge, Qmin is the lowest discharge of the event and k is the point at the loop where the calculation is being made; in our case, the index was calculated at 50% or 75% of the discharge, therefore k = 0.5 or 0.75.
For clockwise hysteresis, when SSCrl is higher than SSCfl, HImid was calculated using the formula:
  HI mid = ( SSC rl / SSC fl ) 1  
For counter-clockwise hysteresis, HImid was calculated by:
  HI mid = ( 1 / ( SSC rl / SSC fl ) ) + 1  
where SSC was interpolated on the rising (SSCrl) and falling limbs (SSCfl) of the curve, using the Qmid value.
The index is easy to interpret; the larger the number, the stronger the relationship and the bigger the loop. The sign of the index illustrates the direction of the loop (positive for clockwise and negative for anticlockwise).

4. Results

Meteorological and hydrological conditions were variable during the observed period. The rainfall measured at the Hornsund Station significantly influenced the total annual runoff in Breelva (Werenskioldbreen basin). During the ablation seasons of 2007 and 2009, snow and ice melt dominated (~70% of Qtotal), while in 2008, 2011, and 2012, heavy rainfalls drove the discharge changes. If precipitation was higher than 200 mm (2008: 245 mm, 2011: 209.5 mm, 2012: 288.2 mm), one or more rain events were observed in the hydrologically active season [42].

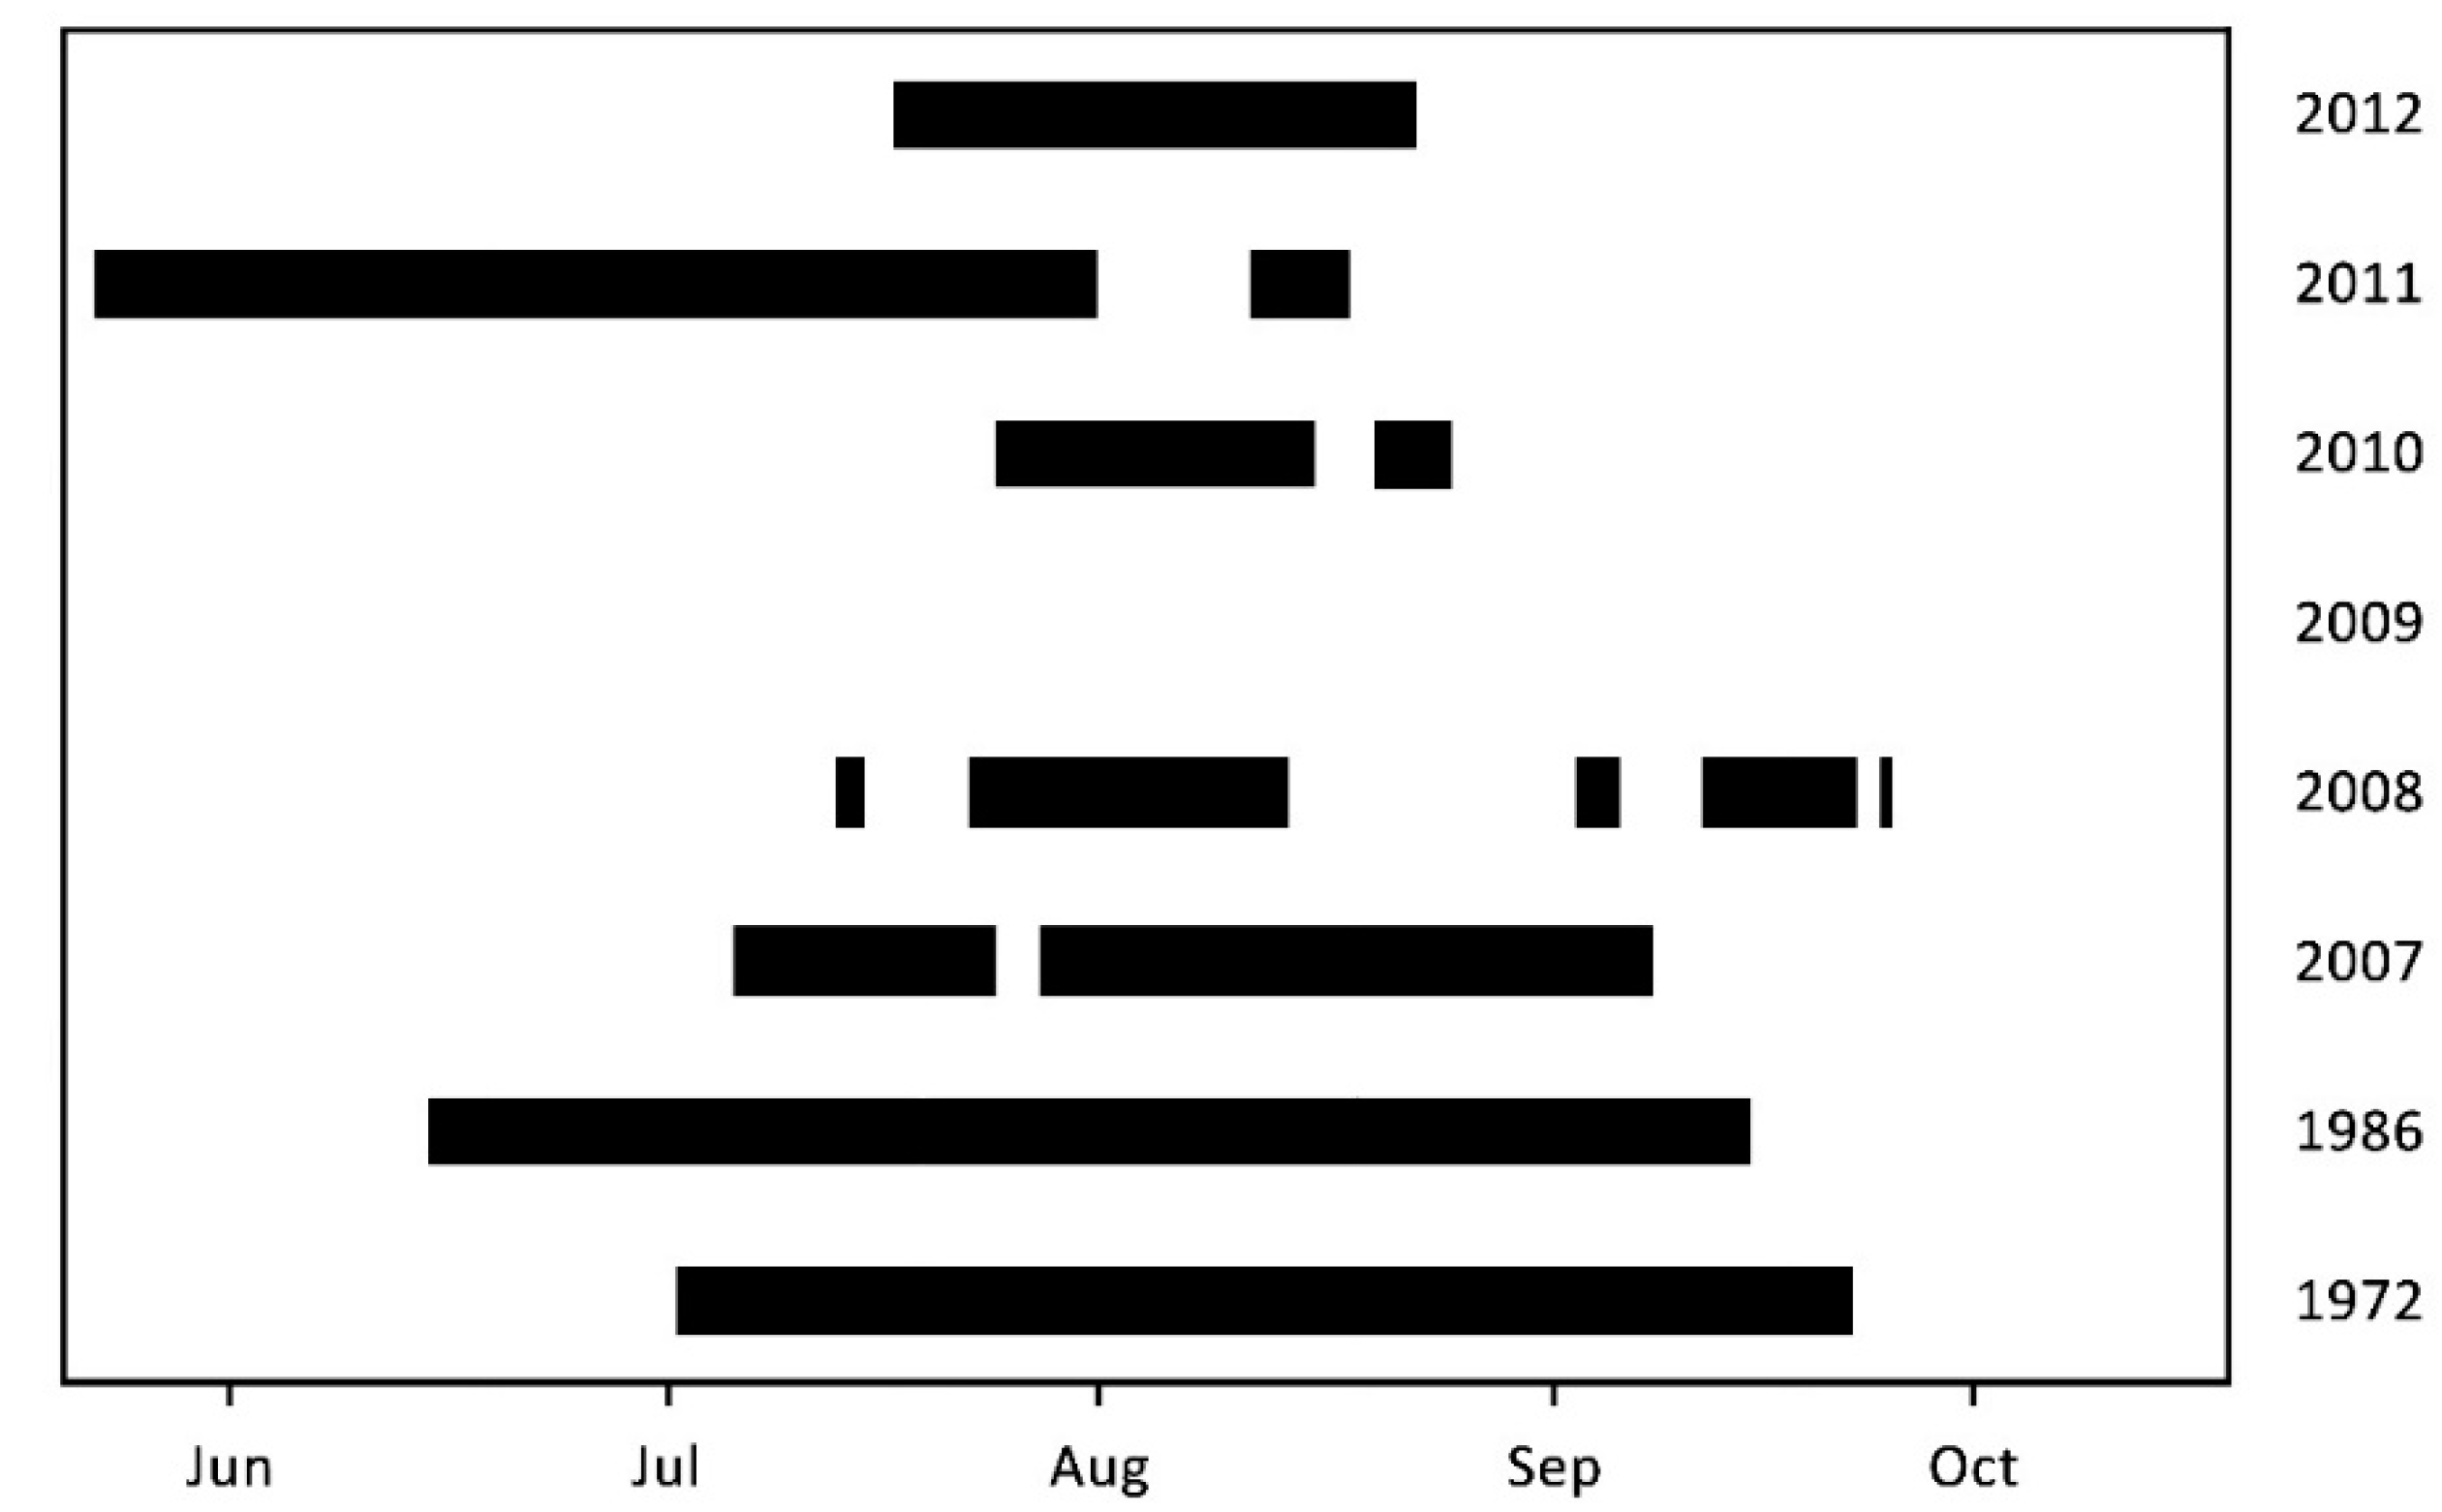
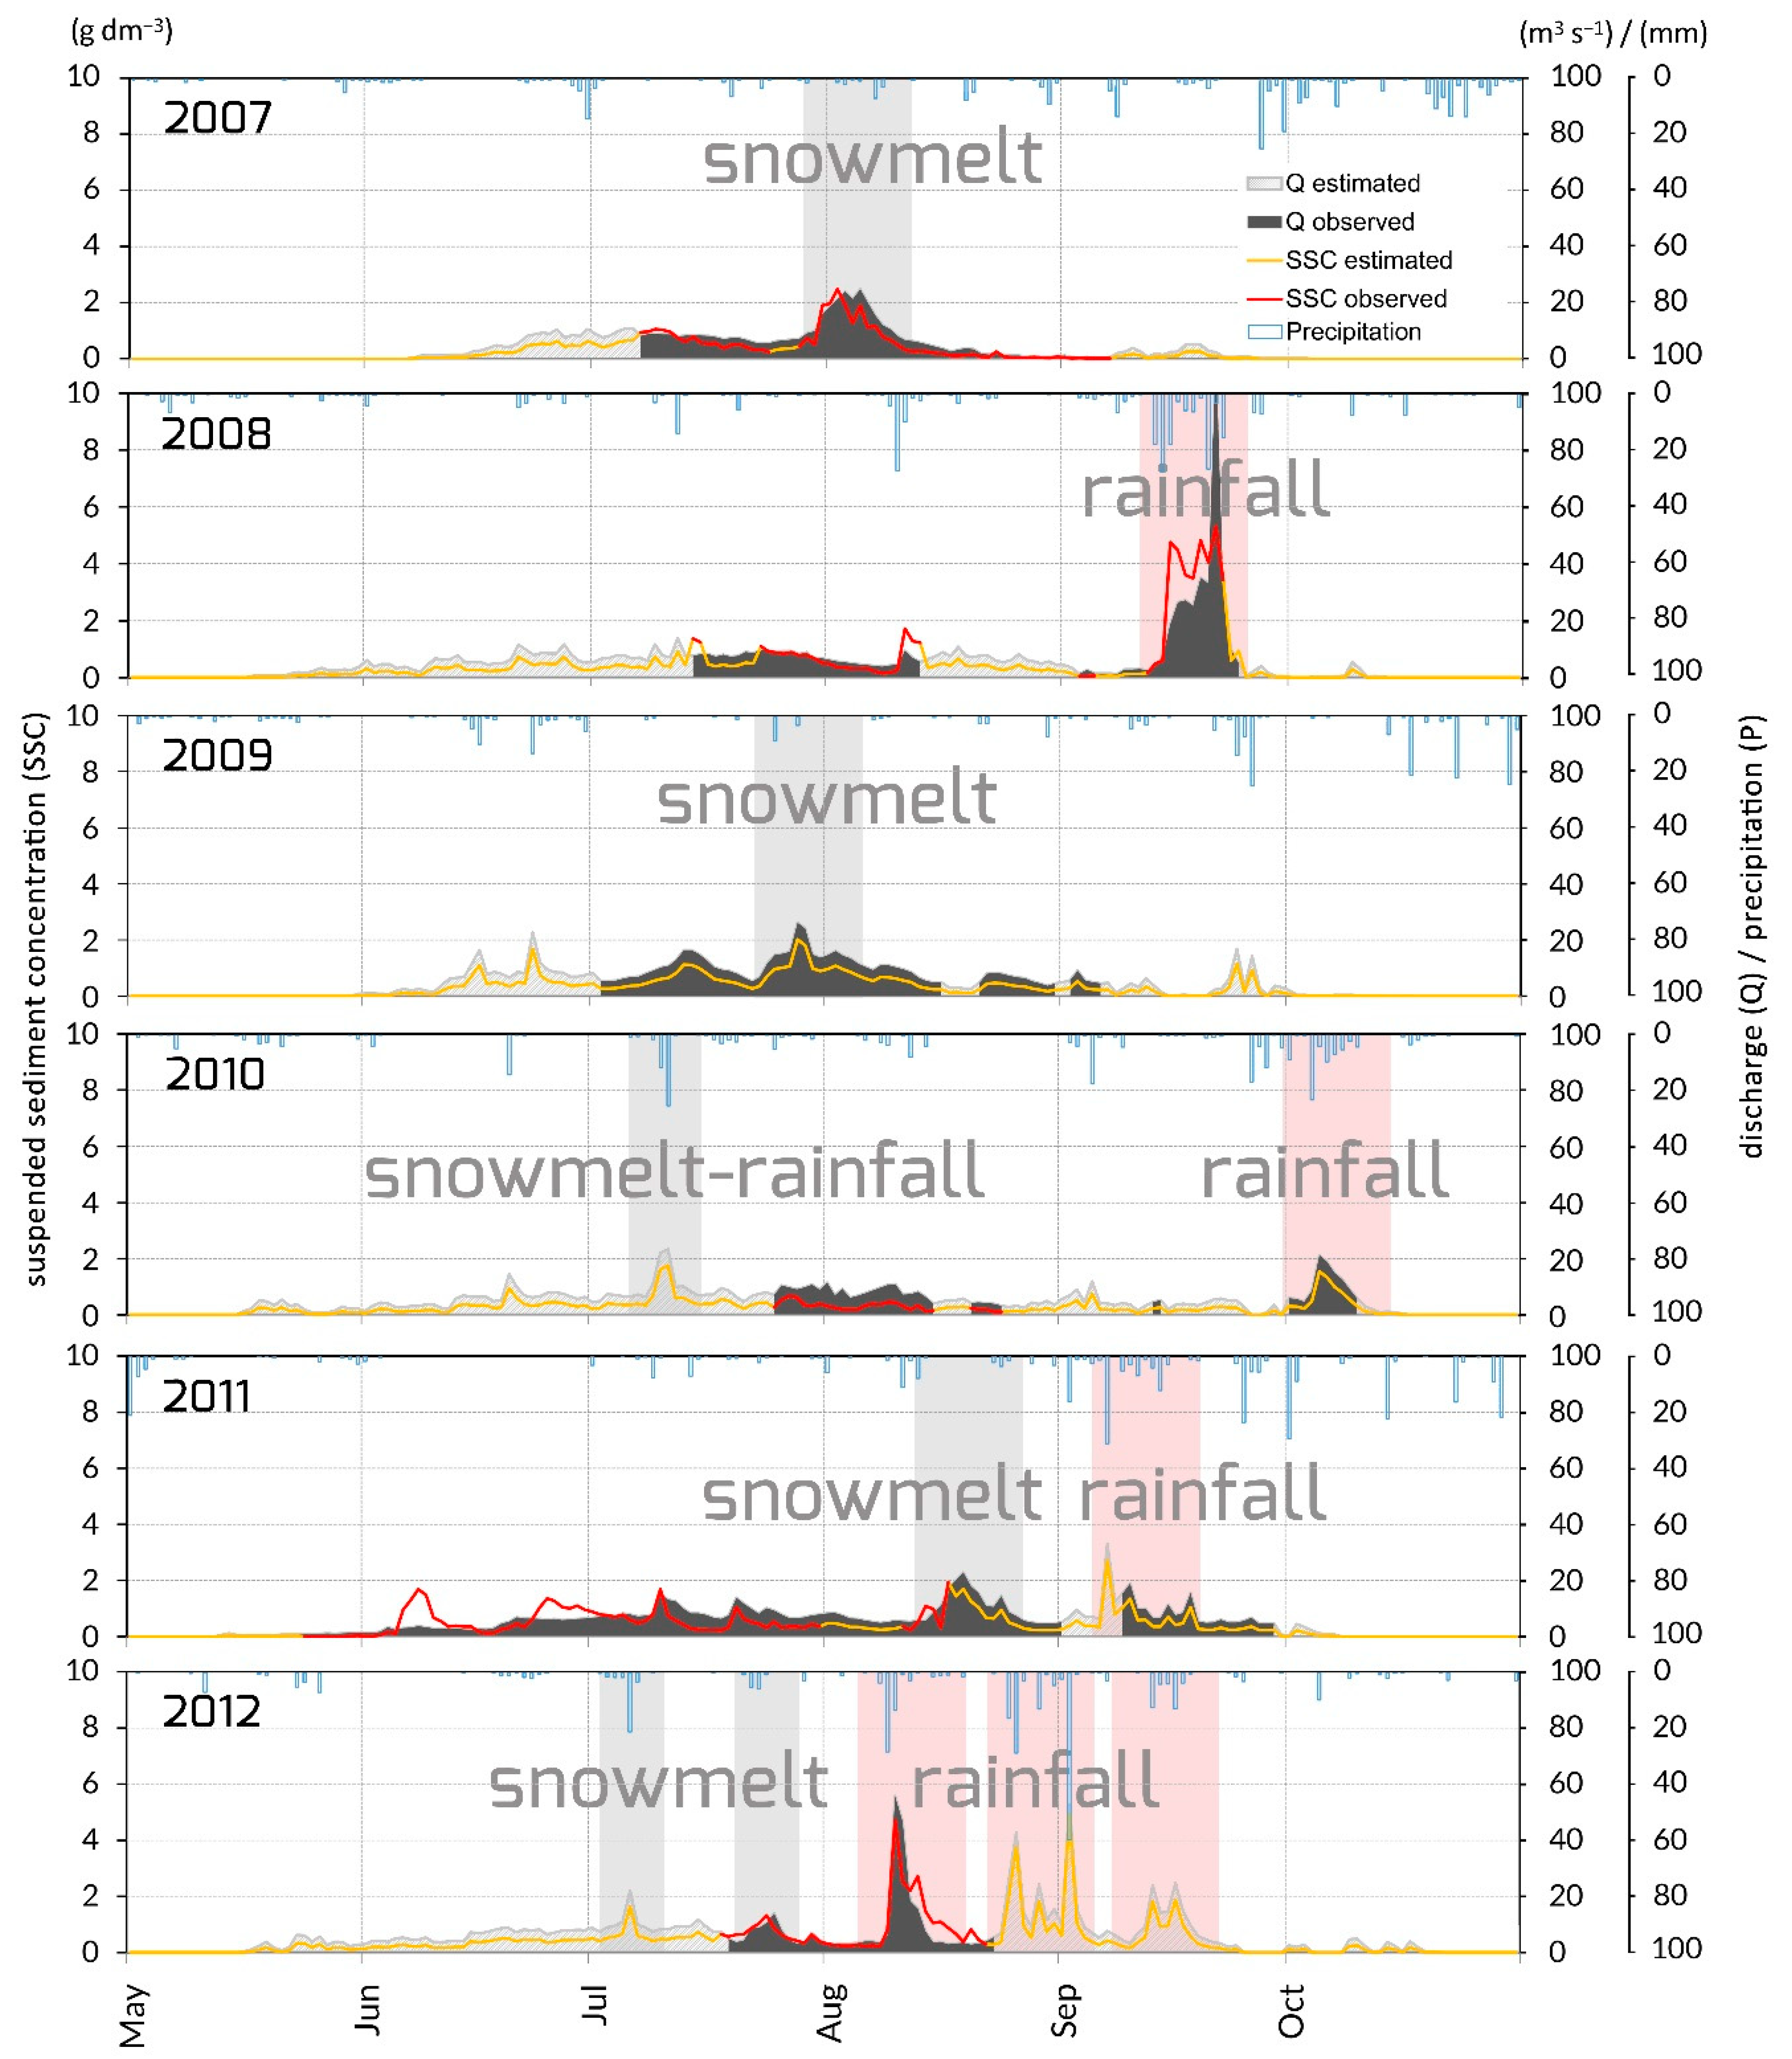
4.1. Suspended Sediment Transport during Hydrologically Active Seasons (2007–2012)

During the studied seasons, suspended sediment loads ranged from 37.30 to 130.94 kt, with a daily average of the suspended sediment concentration varying from 0.001 to 5.313 g dm−3 (Table 1). The period of direct sampling depended on the collective organization of fieldwork in each year and spanned 36–76 days (Figure 3). The hydrologically active periods were almost entirely covered by the automatic water level measurements [42]. On the basis of all data, it can be assumed that mechanical denudation for the studied catchment has a rate from 0.393 to over 1 mm year–1.

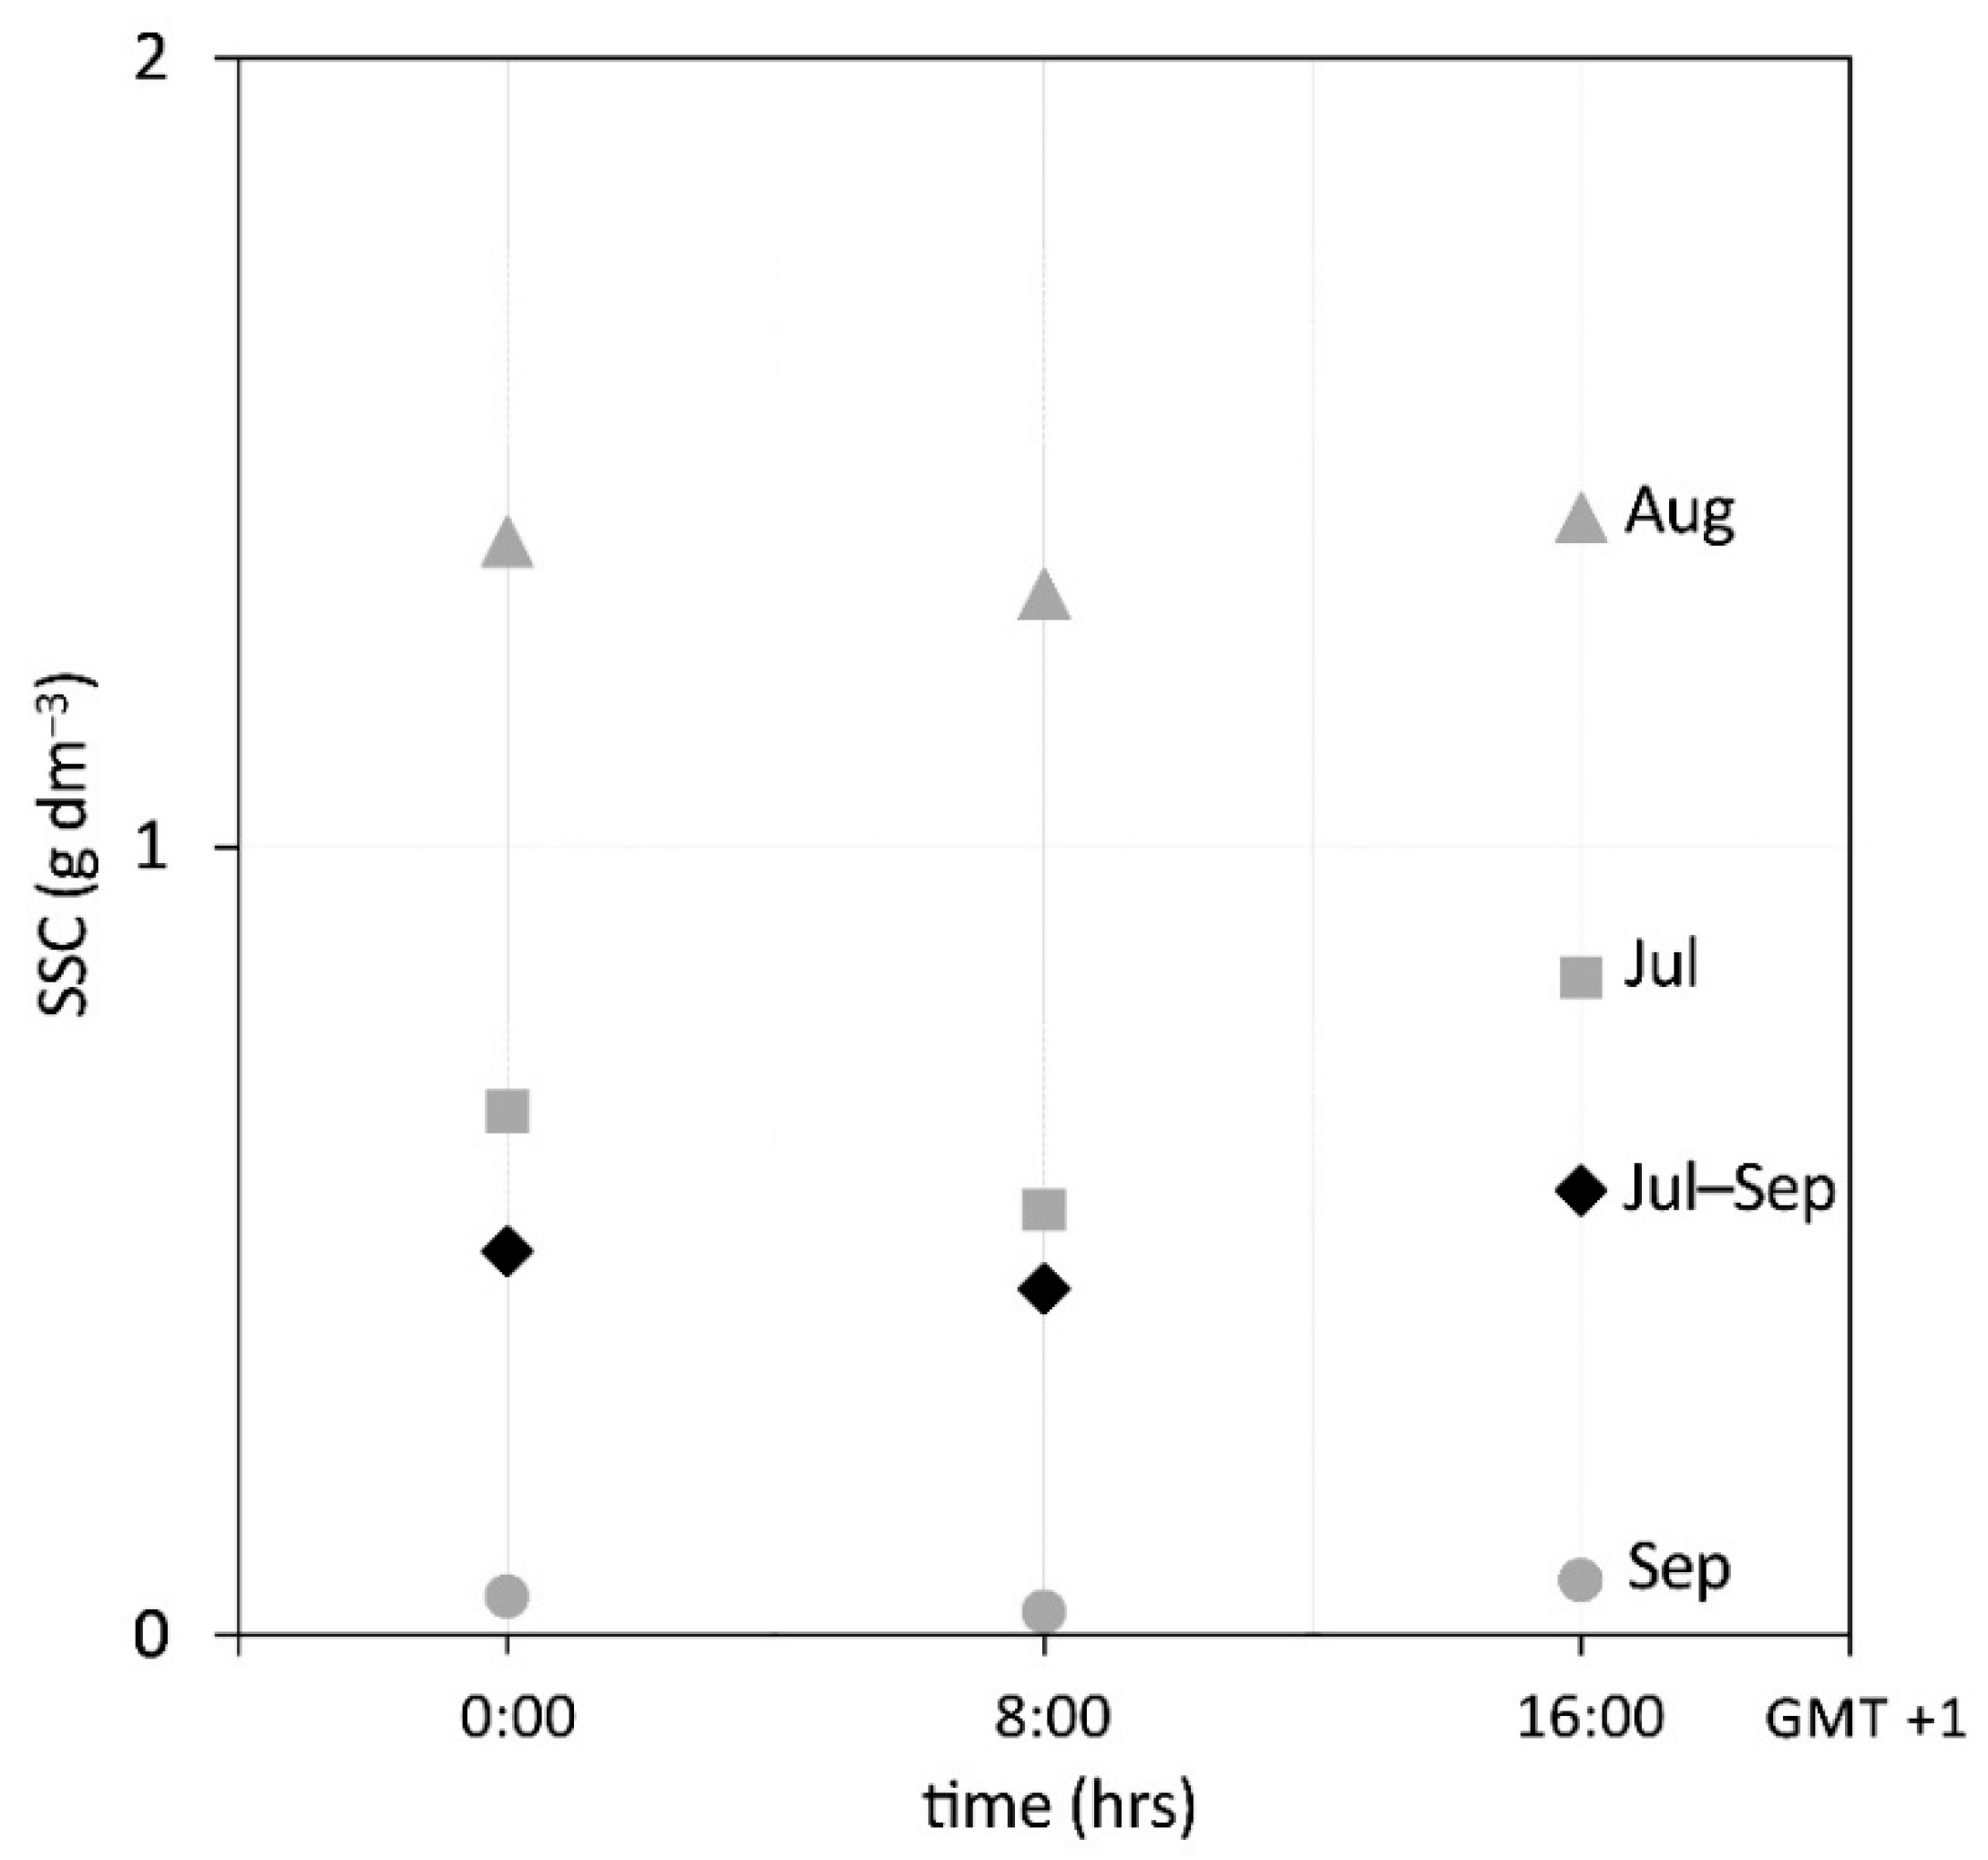
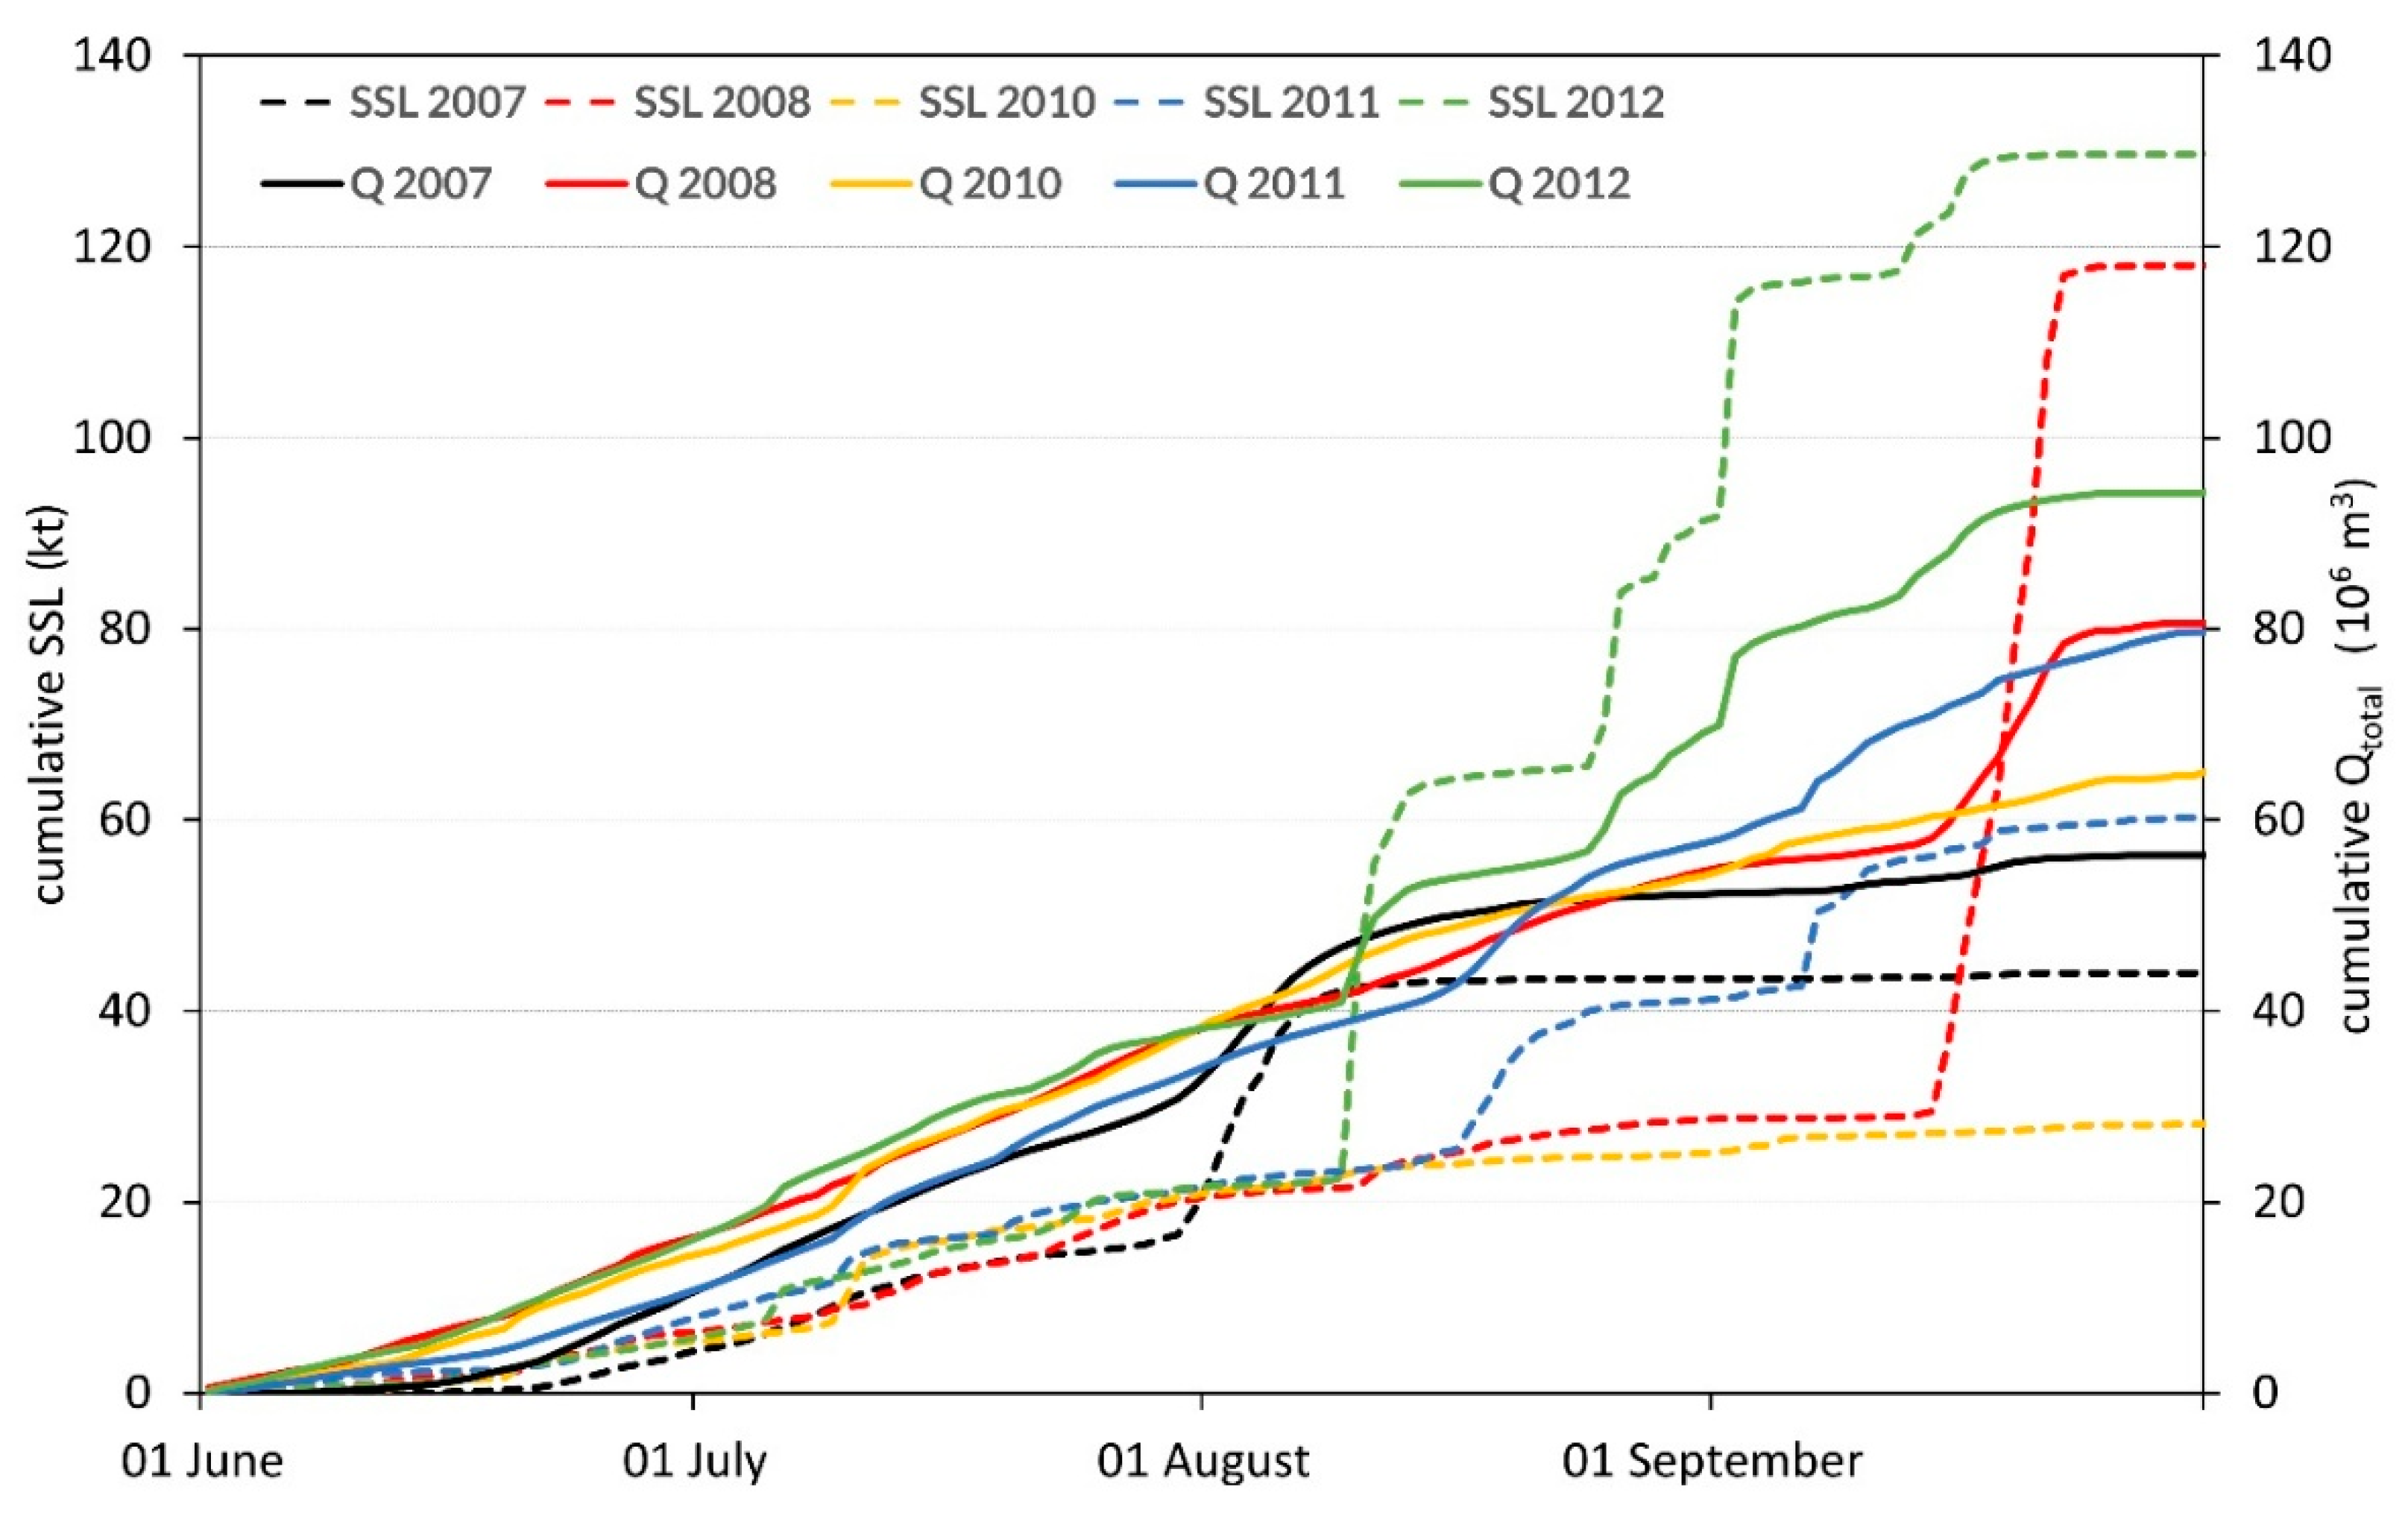
4.2. Distribution of SSC, SSL, and Runoff during the Hydrologically Active Season

The cumulative and cumulative percentage distributions of suspended sediment concentration (SSC), suspended sediment load (SSL), and runoff (Qtotal) were computed for five seasons (Figure 5, Table 2). Then, dates were determined when the cumulative curves reached 10%, 25%, 50%, 75%, and 90%, and the lag-time was calculated relative to SSC-Q (Table 2). The curve courses showed great variability, especially in seasons when the rain supply was crucial. Nevertheless, several regularities can be observed.
In the first part of the active season in 2007, 2008, and 2012, the percentage delivery of cumulative runoff (Qtotal) outpaced the corresponding SSC. In the remaining seasons (2010 and 2011) the opposite situation was observed. In addition, in 2011 SSC showed anteriority throughout the season. Moreover, in the season without significant rain floods (2007), the percentage distribution of SSC delivery was skewed towards the earlier period and at the end of the season, there was a slow exhaustion of sediments. This was evidenced by the difference of up to eight days in reaching 90% of SSC and Qtotal value. Rainier seasons renew the fine material resources for elution at the end of the hydrological activity, as it was observed in 2008 (75%–2 days, 90%–0 days), but also partly in 2010 (0 days), 2011 (−5 days), and 2012 (−2 days). The analysis of the cumulative curve shows a clear increase in SSL at the end of the season, driven by heavy rainfall.

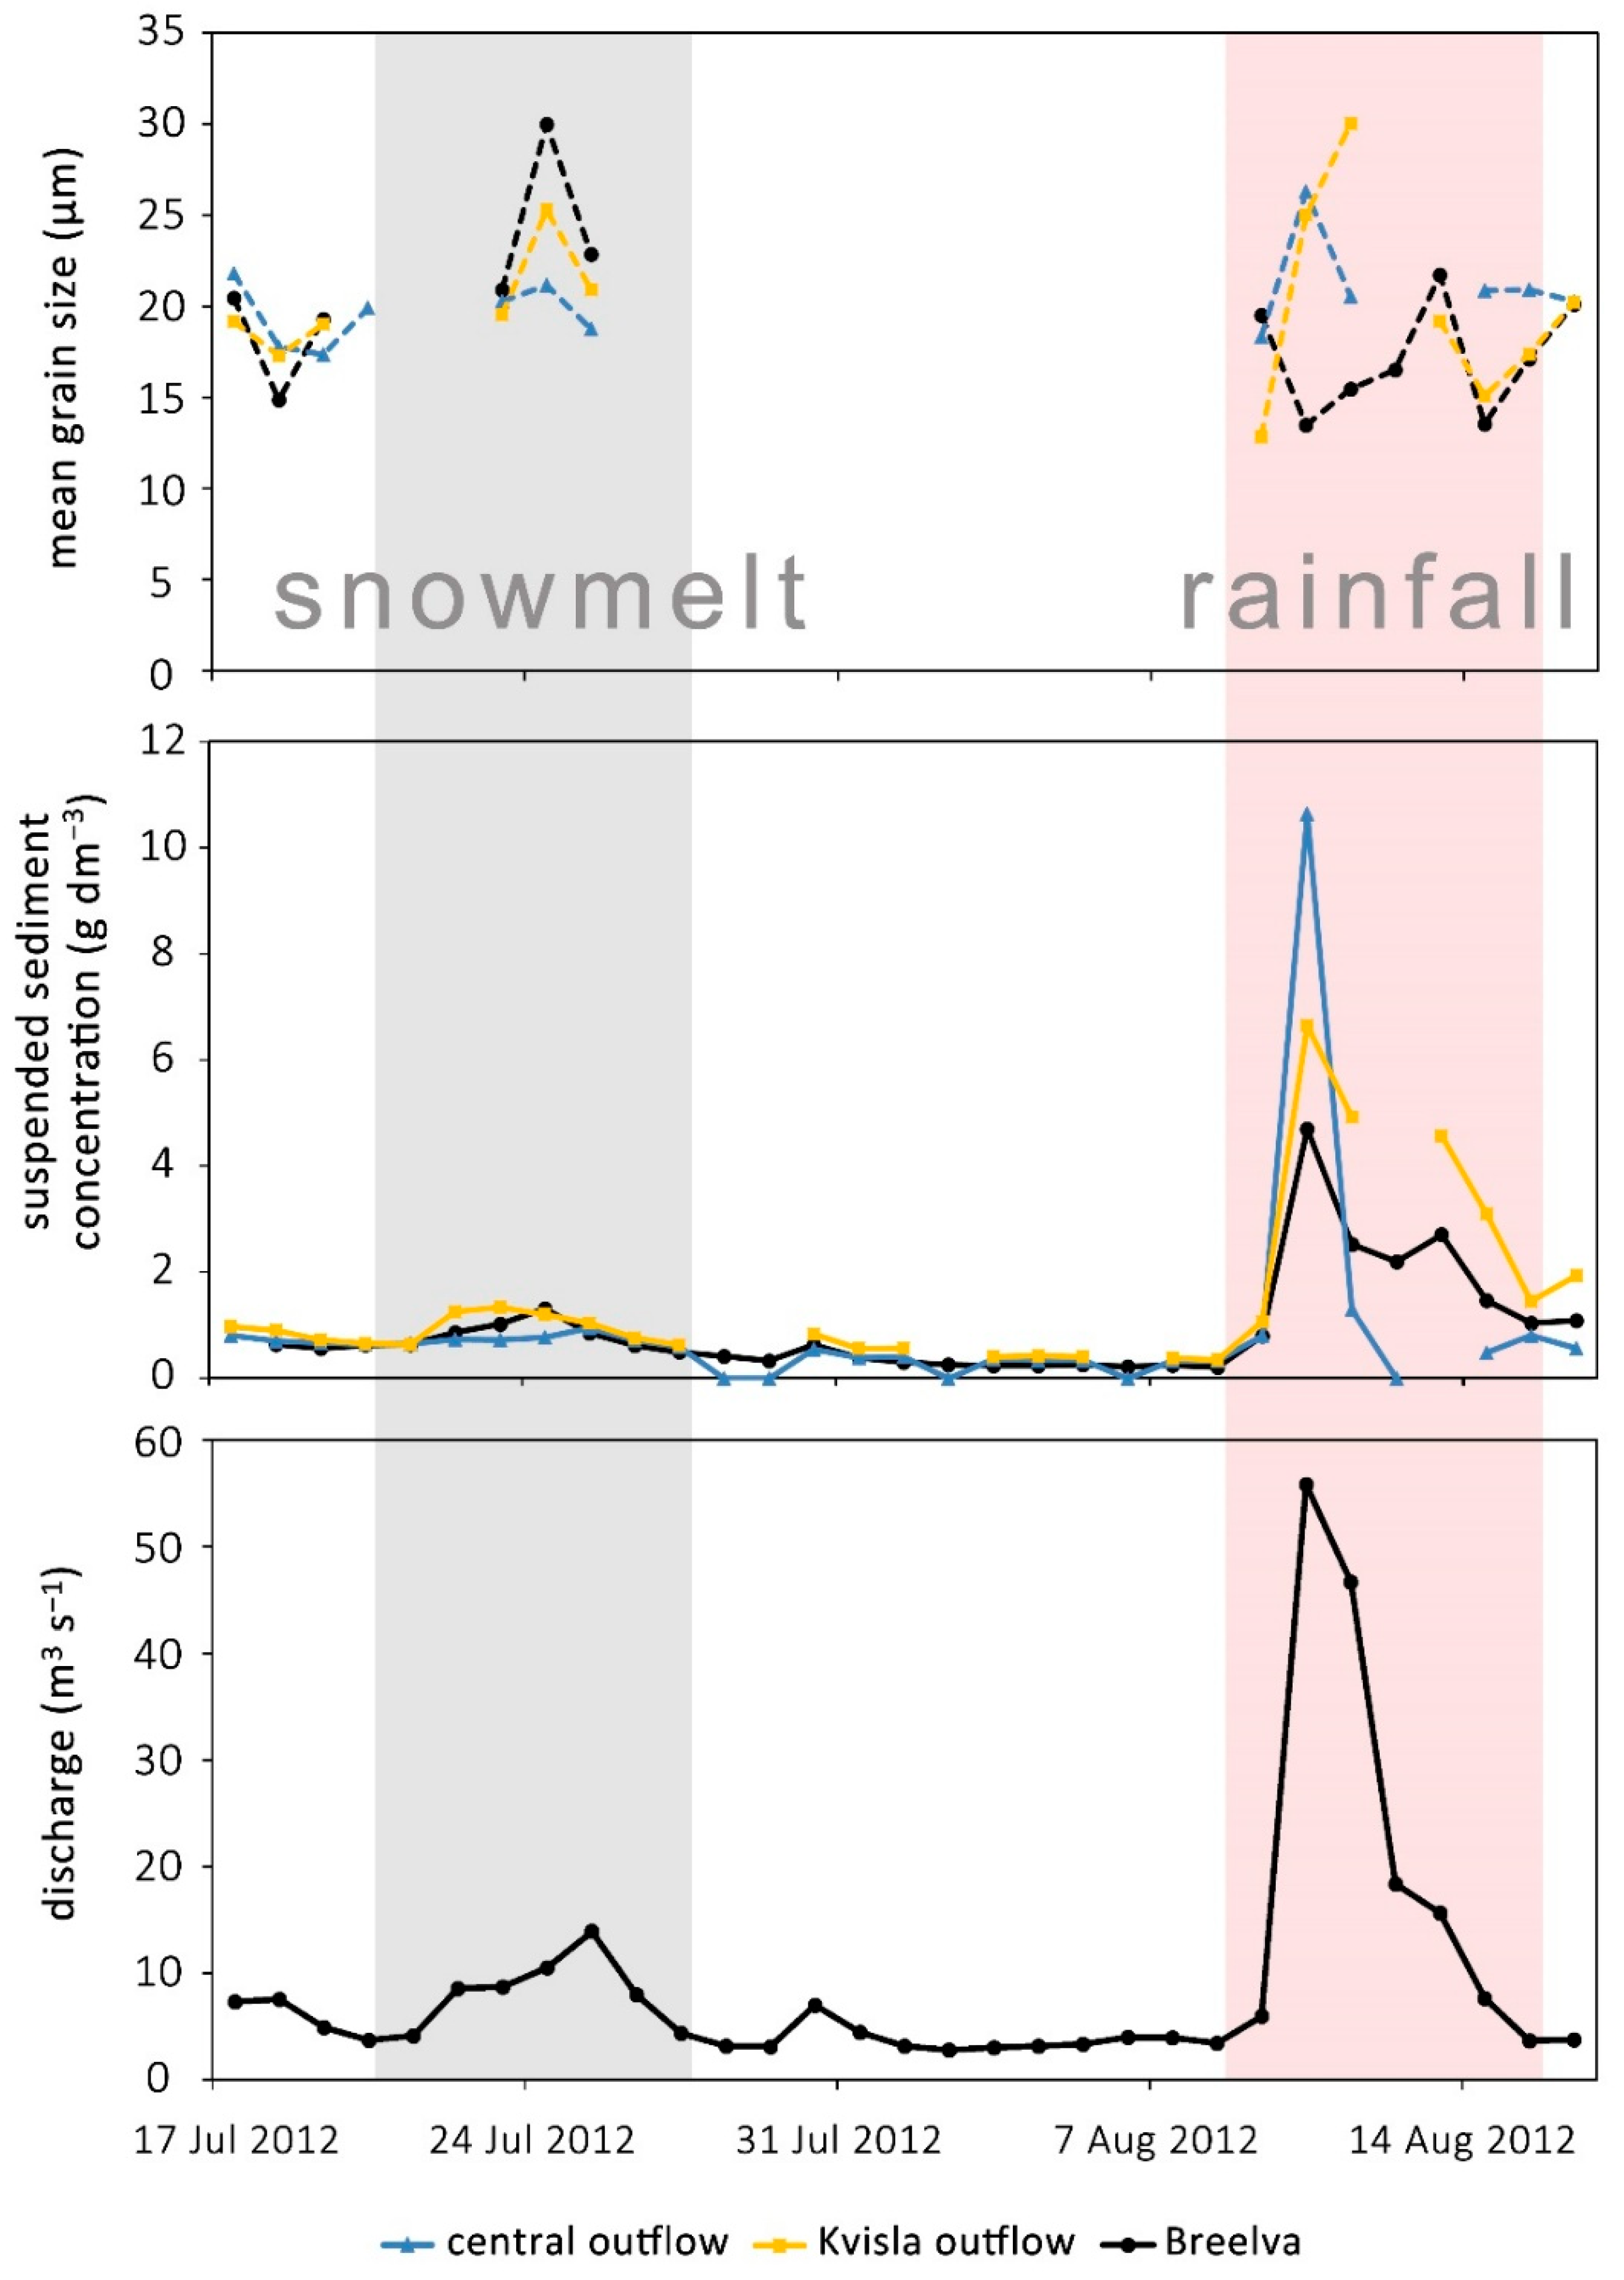
4.3. Snowmelt- and Rain-Induced Suspended Sediment Peaks: Suspended Sediment Flux during Large Floods

During the 2007–2012 hydrologically active seasons, runoff and suspended sediment yield associated with the discharge peaks were determined (i.e., when discharge exceeded its average value of 7 m3 s−1) (Table 3 based upon Majchrowska et al. [42]). Each single snowmelt flood reached discharge from several to over 20 m3 s−1, while each single rain event always had discharge above 20 m3 s−1 and exceeded 50 m3 s−1 in some cases. During such discharge peaks, as much as half of the total runoff can be generated (49% in 2012) and suspended sediment load ranges 40–83% of the total SSL at the hydrometric station (Breelva). The highest total SSLs were noted for seasons with rain-induced discharge peaks observed usually in the second part of the hydrologically active seasons (2008, 2012).
During the hydrologically active season of 2012, two peaks were selected to conduct a detailed analysis of the difference between snowmelt- and rain-derived discharge peaks (Figure 6, Table 3). The first peak occurred in the second half of July (21–27 July, with a maximum discharge ~14 m3 s−1 on 25 July) and was driven by the snowmelt. During these seven days, runoff exceeded 5 × 10⁶ m3, which contributed about 5.4% of the total annual runoff. The suspended sediment load was about 4512 t, which amounted to about 3.4% of total sediment yield during the season. The maximum suspended sediment concentration was higher at the hydrometric station (1.3 g dm−3, 24 July) than at the subglacial outflows: Kvisla (1.1 g dm−3 on 23 July) and the central outflow (~1 g dm−3 on 25 July). The maximum of mean grain sizes was also higher at the hydrometric station at the Breelva (30.1 µm), as compared to Kvisla and the central outflow on 24 July (25.4 µm and 21.3 µm, respectively). During snowmelt peak, Kvisla (marked with “B”, Figure 1) contributed to the much higher suspended sediment concentration than the central outflows (marked with “A”, Figure 1). The highest transport occurred at the hydrometric station of the Breelva River.
The second discharge peak occurred from 8 to 16 August (maximum discharge ~56 m3 s−1 on 10 August) and was associated with a very high precipitation event (52.5 mm noted in the Polish Polar Station) estimated to contribute 14% (13.9 × 10⁶ m3) of total runoff from the Werenskiold basin. The sediment yield during that event was 42,304 t, which contributed about 32% of the total SSL (Table 2). That rain event caused an increase (up to 10-fold higher than the snowmelt event) in the maximum suspended sediment concentration on 10 August in the subglacial outflows and at the hydrometric station. The maximum of suspended sediment concentration was higher at the Kvisla and the central outflows (6.7 g dm−3 and 10.7 g dm−3, respectively) than at the hydrometric station at the Breelva River (4.7 g dm−3).
Mean grain size also varied depending on the flood origin. During the first snowmelt event, sediment sources were rapidly exhausted, because mineral matter from the preceding year in subglacial outflows was fine-grained, highly sorted, and easily available for stream erosion (17.4–25.4 µm). The rain event appearing at the end of the hydrologically active season eroded sediments which are normally much coarser (up to 30.1 µm).

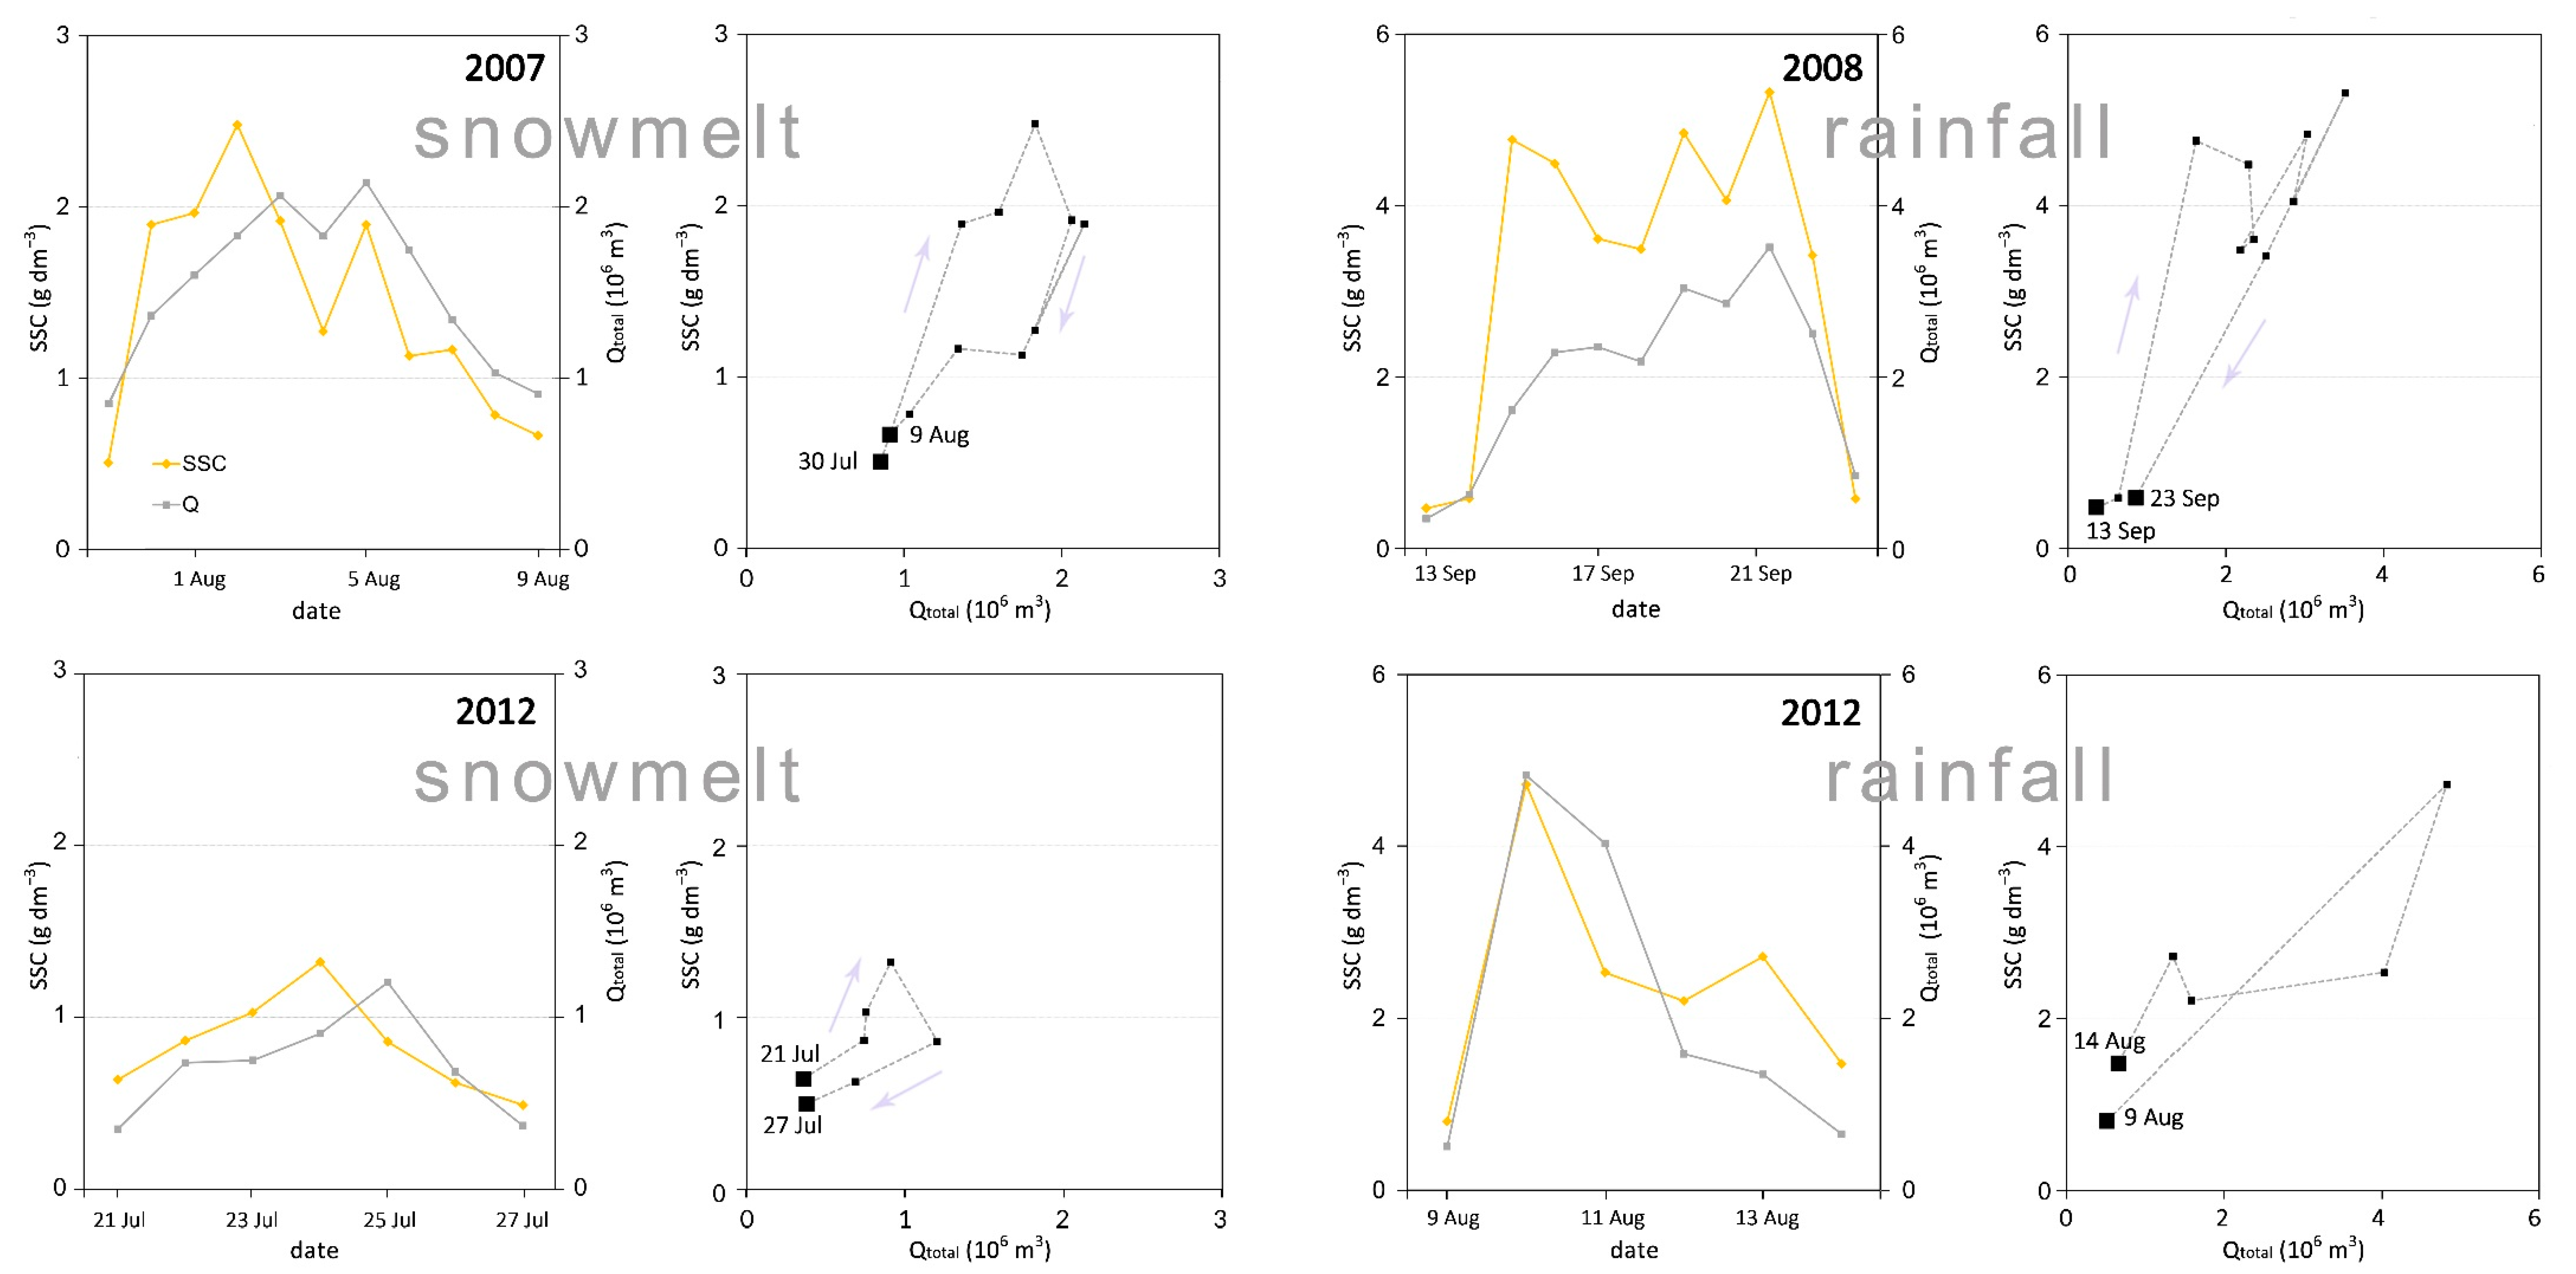
4.4. Hysteresis Relationship during Peaks

For selected snowmelt and rainfall peaks recorded in the Breelva gauging station (Figure 7), we calculated a hysteresis index, HImid. All data (Q, SSC) came from direct measurements and sampling. All results expressed clockwise hysteresis (positive values; Table 4). In the case of snowmelt floods (0.675 and 0.0601 in 2007 and 2012, respectively) we observed the classic peak of the SSC before the peak of Q. During the rain peak, the hysteresis index was very strong for 2008 (0.906) and lower for 2012 (0.503). In contrast to snowmelt floods, the rainfall peak timings of SSC and Q were more synchronous, which indicated the simultaneous discharge of water and suspended sediments.
The hysteresis effect is attributed to the changes in sediment availability throughout the event and the positive curves relate to the overall sediment source depletion during the events.

5. Discussion

5.1. The Course of SSC during the Hydrologically Active Season

In the early part of the hydrologically active season, a Q peak following the SSC peak and clockwise hysteresis suggest a low efficiency of the hydrological system (sometimes referred to as an immaturely developed system). In this period, snow cover in the catchment causes an obstruction in the supra-, en-, and subglacial drainage systems. In the proglacial zone, snowpack also inhibits the formation of a well-connected proglacial channel network. The higher SSC in the proglacial zone (distal part) than in subglacial outflows (proximal part) reflects the incomplete hydrological system development (Figure 6). Seasonal SSC-Q hysteresis during snowmelt events in 2007 and 2010 additionally confirms the hydrological development of the inefficient system and is in agreement with the previous research on suspended sediment dynamics [11,12,18,24,54,55]. We found that the delivery time of SSC was one day in advance of the corresponding runoff (Qtotal) in a hydrometric profile about 1.6 km away (Figure 7). The examples of the snowmelt flood (21–27 July) from 2012 or 30 July–9 August 2007 is proof of the inefficient glacier drainage system. A partial source of suspended sediment during snowmelt floods is the glacier channel alluvium, deposited during autumn and winter of the preceding year. Generally, at that time, the recorded SSC values in subglacial outflows are lower than at the hydrometric station, which proves the importance of proglacial sediment sources. We think that in the early part of the season, the proglacial zone acts as a sediment source for the entire SSL from the glacierized basin.
In the late part of the monitoring seasons, we observed the progressively more synchronous peak timings of SSC and Q, showing that subglacial and englacial conduit systems were more efficient in water and sediment transfer. Snowpack recession, which causes the opening of sub- and englacial conduits, causes a decrease in SSC and a Q lag. At the same time, thawing of sediment in the proglacial zone enhances glaciofluvial and thermal erosion through increasing the amount of proglacial sediment available for transport [12,13]. Although there is limited data on the thaw depth in SW Svalbard, we expected that the depth will be similar in range (0.5–1.3 m) as observed for the non-glacierized basin of Fuglebekken near the Polish Polar Station due to similar local conditions such as bedrock geology and vegetation cover [56]. Also, the supply of rainwater to supraglacial streams after snow cover has vanished stimulates a faster water transfer into the subglacial drainage, leading to an enhanced erosion in the sediment-rich areas at the glacier bed. In 2012, we noticed such an enhancement when the fine material emerging from the subglacial system had the highest value of SSC in the subglacial outflows.

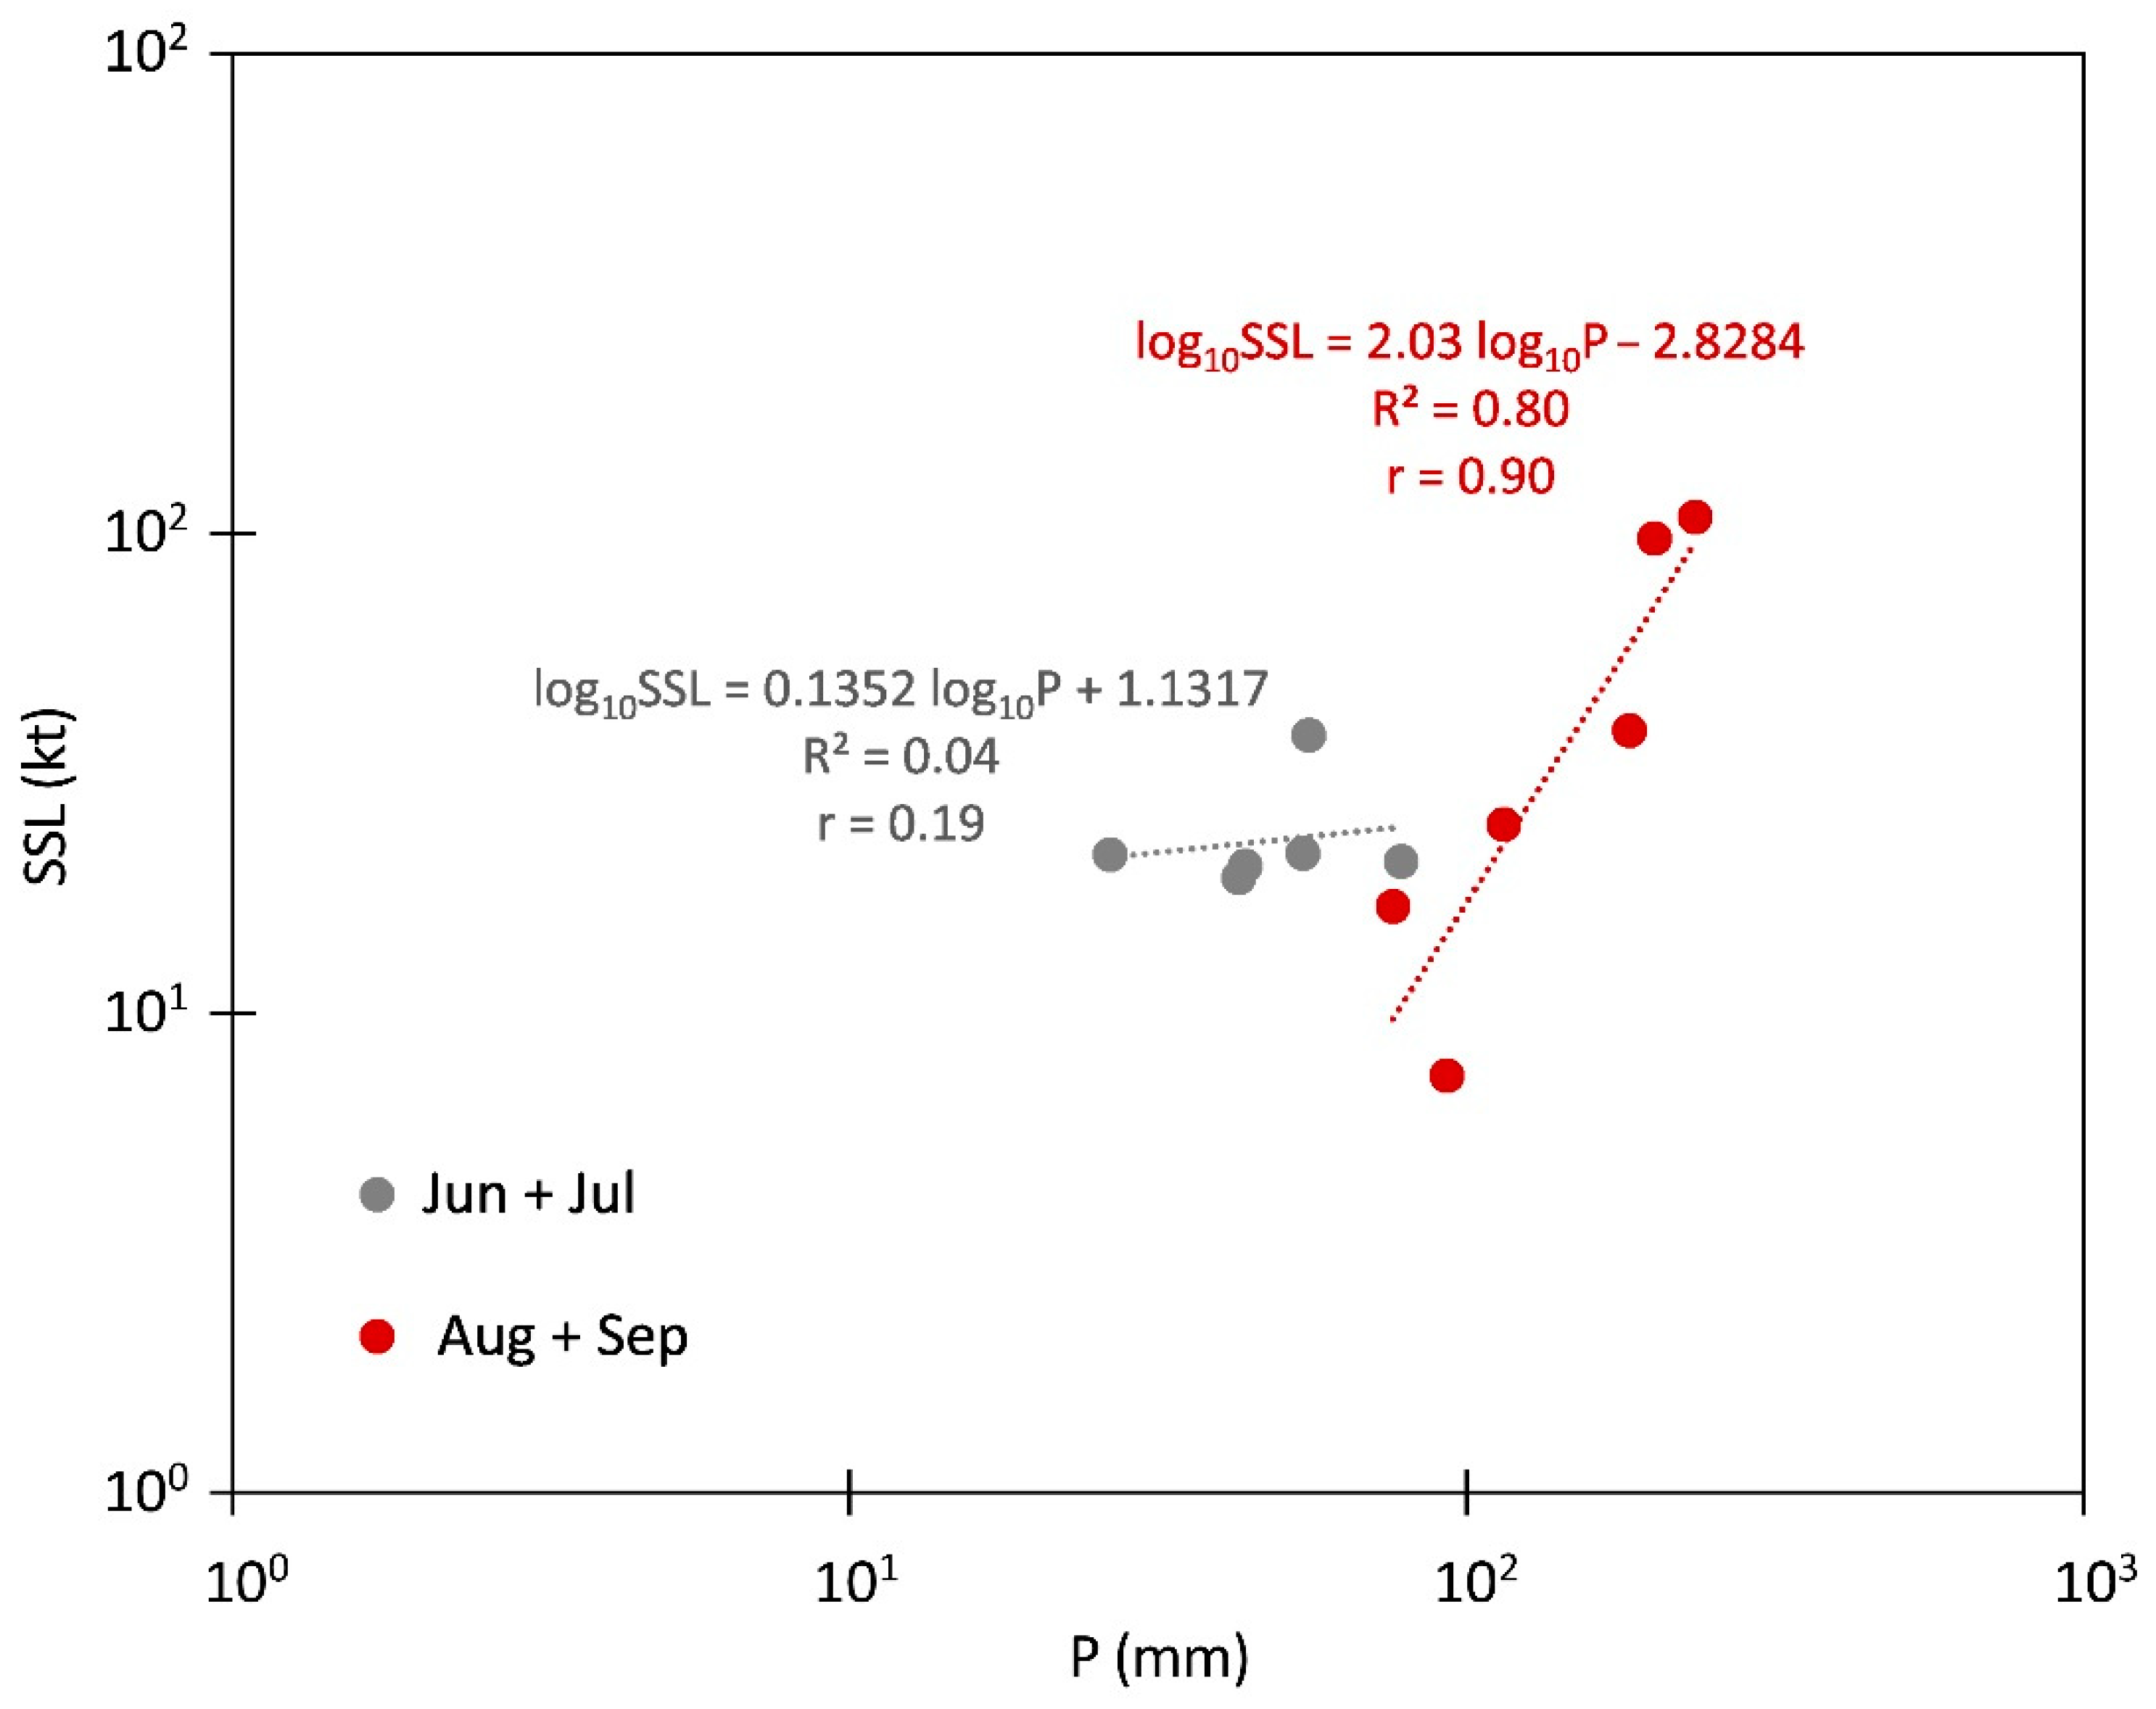
5.2. Heavy Rainfalls Accelerate Mechanical Denudation

In our observation, we indicate that snowmelt and rain-induced suspended sediment peaks play a significant role in total suspended sediment yields. However, we think that rain-induced peaks of suspended sediment occur more often (Figure 8), which may be related to the increasing tendency in heavy rain events occurrence in the SW Spitsbergen (meteorological station at the Polish Polar Station). The influence of meteorological factors on the seasonal and interannual variability of runoff in Werenskioldbreen catchment was earlier evaluated by Majchrowska et al. [42]. They emphasized that seasonal discharge fluctuations are linked to both glacier ablation and the meteorological parameters such as air temperature, snow cover, wind speed, and foehn effect. While snowmelt-induced high discharge events were generally more frequent in the first part of the hydrologically active season (usually June–July), rainfall-induced flood episodes had higher discharge and occurred in the second part of the season (August–October). Furthermore, the highest peak in discharge and suspended sediment concentration (up to 5.313 g dm−3 in 2008) coincided with a rain event (i.e., 122.6 mm for 13–23 September 2008; for comparison, the rainiest month during 1983–2012 brought 149.9 mm). A similar process has been found by Bogen and Bønsnes [16] and Liermann et al. [57], who indicated that sediments in glacierized basins are mobilized by rain events. Especially, in the late part of the season, rainwater drains the glacier quickly due to the virtual lack of water accumulation in the snowpack. In our study, we present quantitative results of rain-induced SSC peaks.
The heavy rain events are responsible for the highest sediments yields from glacierized basins during the ablation season. In a Himalayan glacierized basin, Haritashya et al. [58] noticed the impact of early season rain events on the significantly higher suspended sediment yields, as compared to the late season rain events of similar magnitude. Otherwise, in our study, we suggest that the heavy rain events during the late part of the active season lead to the removal of fine sediments, which is 10 times higher than during snowmelt flood events. In this part of the season, high efficiency of the subglacial drainage system, with well-developed channels, enhances access to subglacial fine material by extending the subglacial drainage system.
Flushing of subglacial sediments causes an immediate washing out of the fine material in one day. Richards [59] described similar mechanisms of suspended sediment transfer for Norwegian mainland glaciers, where fine sediment was transferred from the subglacial to the proglacial environment during snowmelt-dominated periods with low discharge, and then removed from the catchment during the high discharge associated with rain events. A rapid increase in the cumulative curves of SSC and Q for Breelva in the late part of the active season clearly confirms this mechanism (Figure 5).
We have also shown that rain flood caused a sudden elution of sediments in a short time. The sediment yield during the rain event in 2012 (nine days) was 42,304 t, which amounted to about 32% of the total SSL (Figure 6). For comparison, Dugan et al. [60] described that rain events as short as two days caused 35% of the seasonal suspended sediment load in a Canadian Arctic catchment. Also, Liermann et al. [57] showed six-day rain event exported as high as ~20% of annual suspended sediment yield in a glacierized basin in Norwegian mainland. Soil conditions, such as a deep active layer thaw, a high moisture content, and ground ice melt, accelerated the suspended sediment yield. Increases in the seasonal thaw depth, as suggested for an unglacierized basin near the Polish Polar Station by Wawrzyniak et al. [61], may be also a factor counteracting the sediment exhaustion in the Werenskioldbreen proglacial zone. In the proglacial zone, the relatively minor coverage of vegetation, especially vascular plants [62], and early stage of soil development [37] may enhance the availability of sediment for the bank and sheet erosion.

5.3. Subglacial Sediment Resources

The subglacial drainage structure of a polythermal glacier, through the increasing of meltwater upwelling in the subartesian system of the proglacial area, provides access to new sediment sources [12]. For Werenskioldbreen, we found that the late season transport of suspended sediment was not supply-limited, suggesting a strong rejuvenation of sediments in the polythermal glacier catchment. The high water pressure system under the frontal zone of the glacier partly explains the large supply of suspended sediment load from subglacial outflows to proglacial zone. Additional water from heavy rainfall is likely to increase the hydrostatic pressure, leading to a higher suspended sediment yield caused by the sediment elution from subglacial niches and concentrated drainage channels. We think that the supply of sediment originates from the extending subglacial channels and the mobilization of sediment from traps on the glacier bed. Grabiec [32] confirmed previous assumptions for Werenskioldbreen that two extensive subglacial depressions are situated near the glacier front, providing ideal conditions for the accumulation of water and sediments. During large floods, both depressions fill with water feeding the subartesian type outflows, which are likely to transport a vast amount of the suspended sediment. Heavy rainfall, resulting in a quick water flow in subglacial conditions, causes the mobilization of sediment.
The subglacial water source at the Werenskioldbreen is identified by looking at the changes in the SSC signals and at their response to rainfall events occurring after the main meltwater period (Figure 6). In late August 2012, when most of the snow cover on the glacier melted, the subglacial drainage system indicated an efficient development and showed a clear response to rainfall. During heavy rain events, the proximal SSC value and mean grain size (from Kvisla and central outflows) are higher than their distal values (in the proglacial zone), indicating that subglacial sediment reservoirs have been activated by subglacial water flow. A similar scenario, but for a small alpine glacier, was found by Riihimaki et al. [54], who indicated that sediment originated from a well-developed subglacial system during a rain episode. In our studies, the SSC-Q course (Figure 7) during rain episodes proves a quick and easy access to fine material and its simultaneous evacuation together with rainwater, usually as a flushing mechanism. Most likely, during heavy rainfall, the particulate material from the proglacial zone is also eluted. As much as two times higher SSC in outflows than at the hydrometric station shows that water flowing through the proglacial zone has a limited capacity to carry sediments, and deposition takes place.

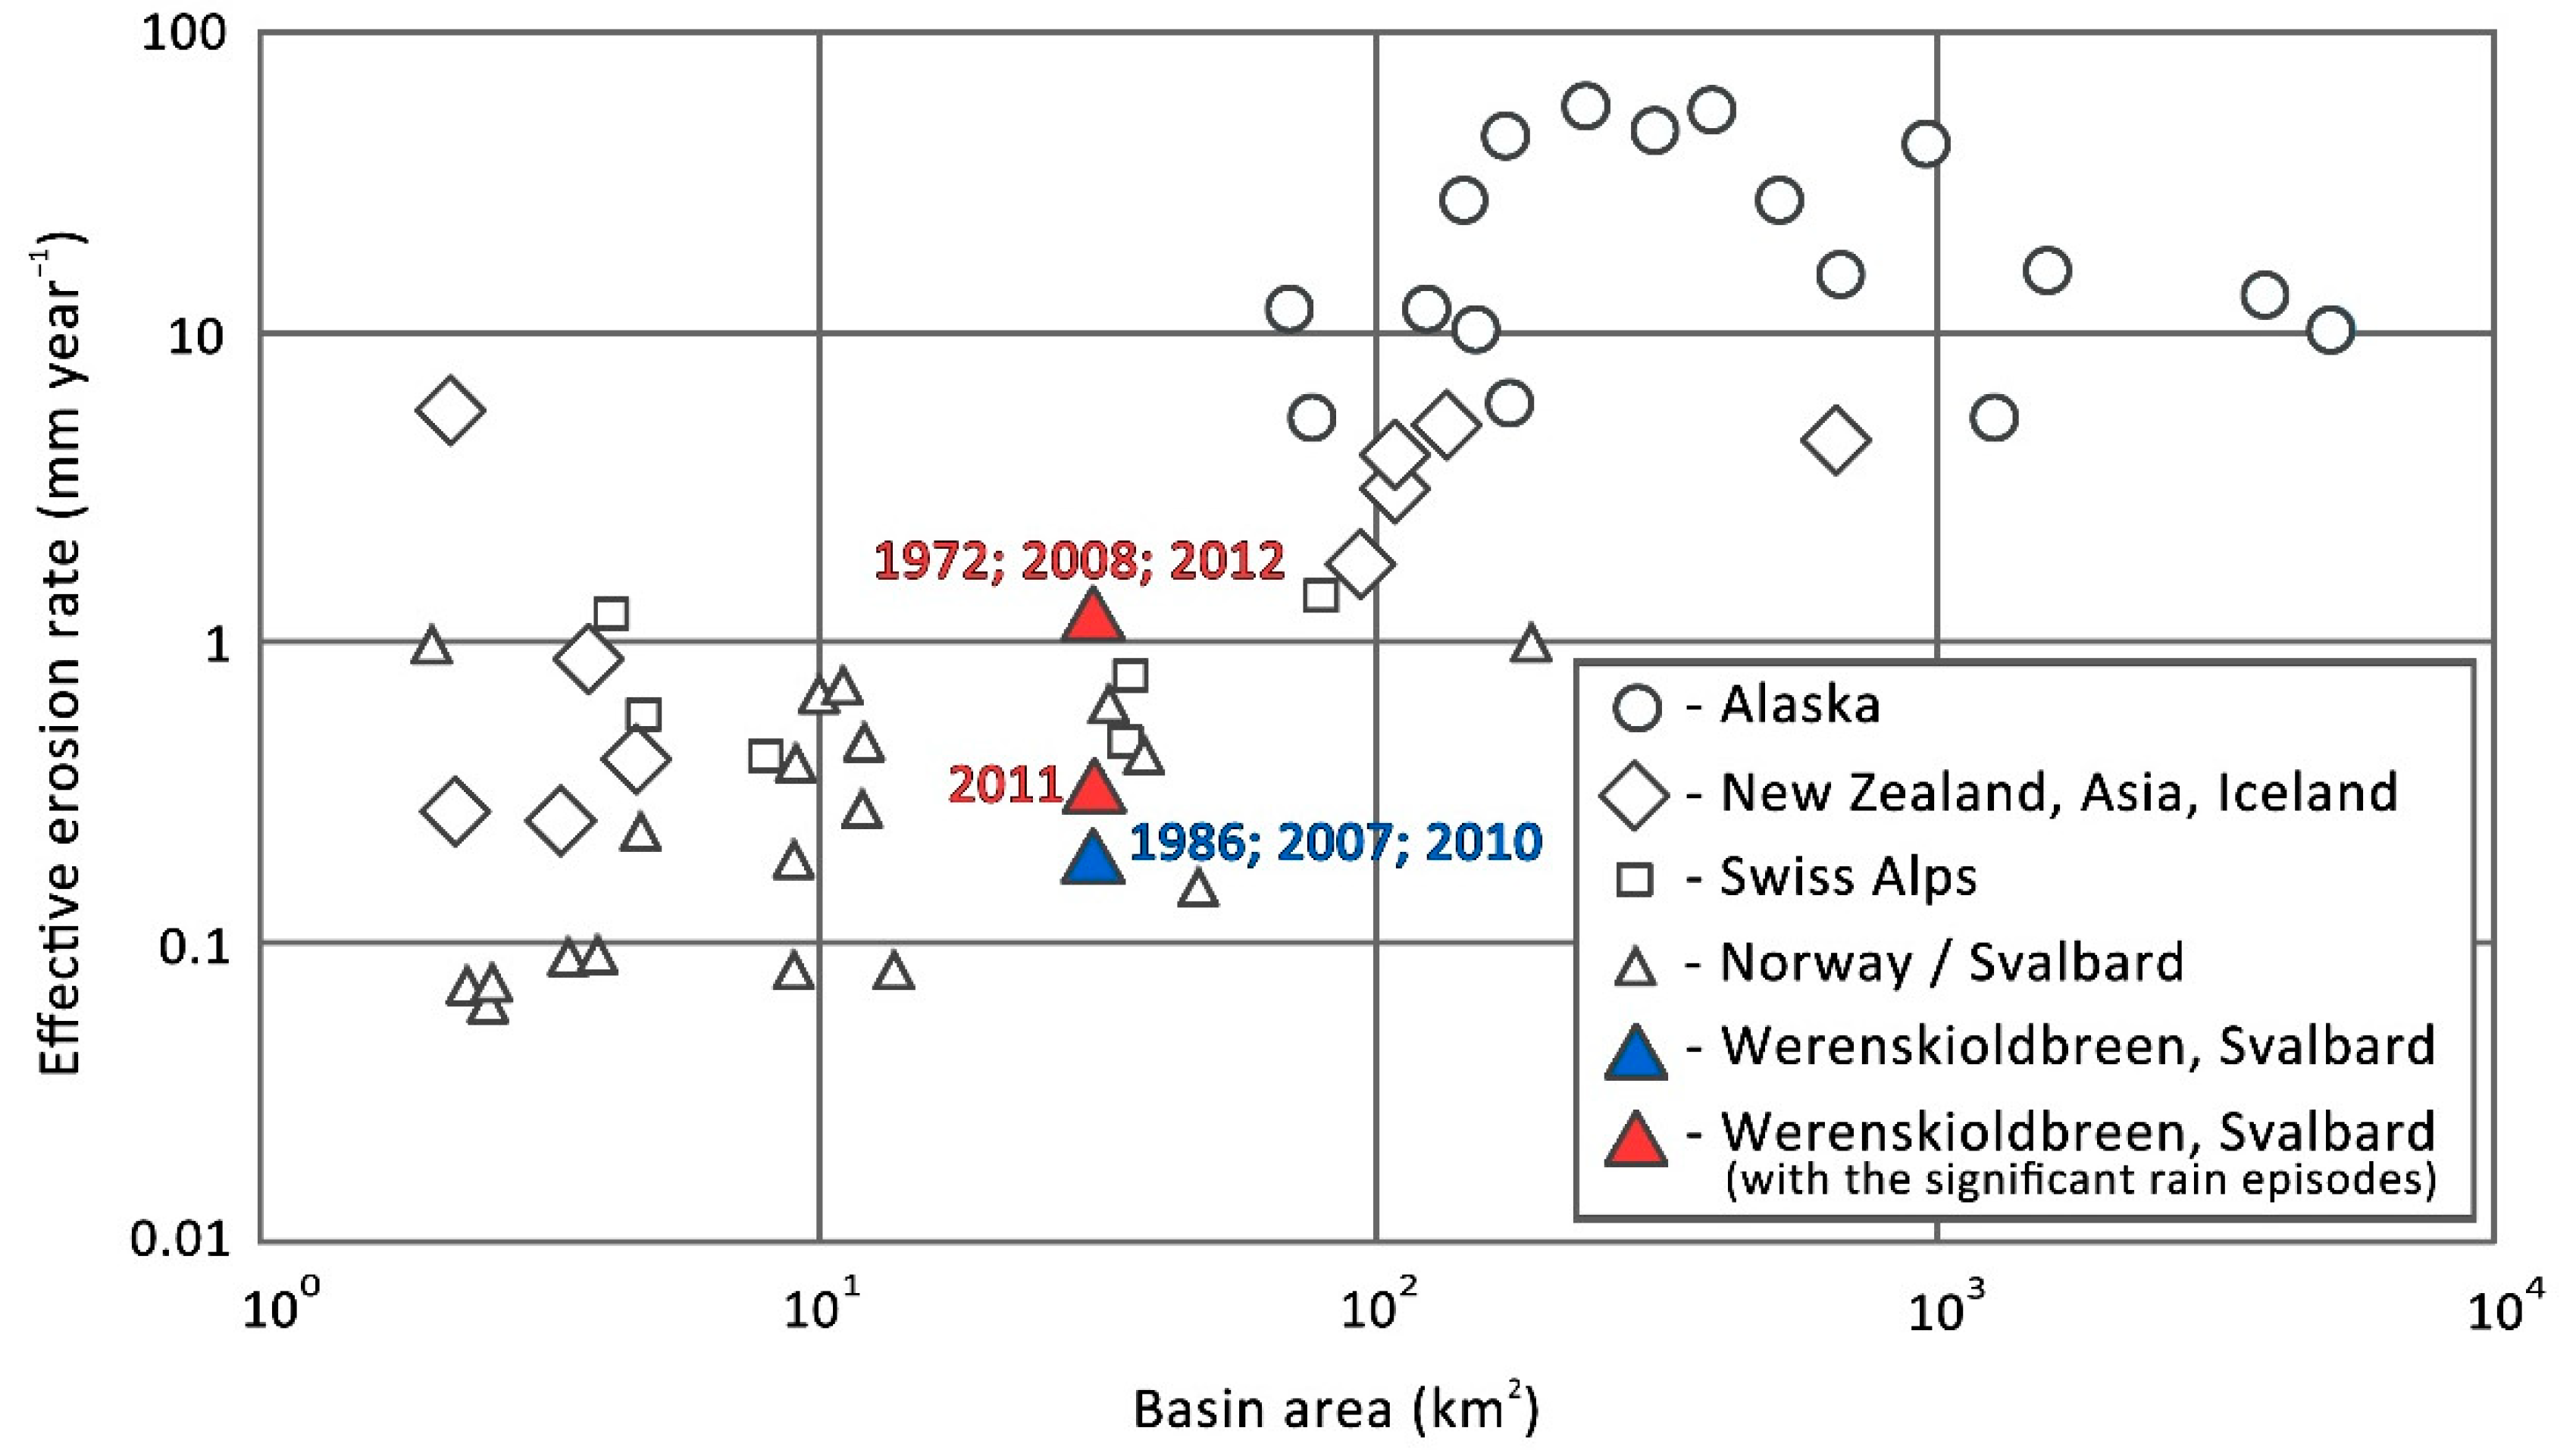
5.4. Mechanical Denudation in Werenskioldbreen and Other Glacierized Basins

Mechanical denudation rate based on the suspended sediment load for Werenskioldbreen basin is on average 0.631 ± 0.326 mm year−1. This value is in the upper part of the range for Svalbard, 0.08–1.0 mm year−1 [15,63,64,65,66,67], indicating high erosion rates as compared to other glacierized basins in Svalbard. The reasons for high values of the sediment export in Werenskioldbreen catchment have been discussed above. Compared to other glacierized basins worldwide, mechanical denudation in the Werenskioldbreen is at the lower range for glacierized basins from the Alps and by 1–2 orders of magnitude lower than for glacierized basins in tectonically active zones (Alaska, Central Asia) (Figure 9). The lower sediment flux in the Werenskioldbreen catchment is caused by low slope, limited thickness, and velocity of the glacier.
The first research into suspended sediment concentration in Werenskioldbreen catchment was conducted in the early 70s by Pulina [51] and in 1986 by Krawczyk and Opołka-Gądek [52]. According to these authors, water from the melting snow plays a major role in the transport of suspended sediment, while we also point out rainfall as another important factor. Our study shows that the annual mechanical denudation is similar to the previous studies with a small increase exceeding 1 mm year−1 during rain dominated seasons (Table 1).
For example, Krawczyk and Opołka-Gądek [52] reported that in the hydrologically active period (91 days) in 1986, the total suspended sediment load, excluding bedload from Werenskioldbreen, was 40,252 t, yielding the calculated mechanical denudation in the basin of ~0.37 mm year−1. The data presented by Pulina [51] suggested mechanical denudation over 1 mm year−1 which appears to be closer to our findings, especially for seasons with heavy rains.

5.5. Future Changes in the Suspended Sediment Yields from Glacierized Basins

Predicting the sediment load of an Arctic river was the subject of Syvitski [26]’s modeling work. According to his approach, SSL increases by 30% for every 2 °C warming. The model only takes into account the air temperature. Most studies [10,11,26] consider air temperature increase, warm winter, extended ablation season, and snowfall as major factors affecting the high sediment yield. Contrary to those studies, we show that rainfall in the late part of the hydrologically active season drives the suspended sediment yield. However, to include the precipitation in the forecast of the suspended sediment yield from a glacierized basin, higher reliability of precipitation models is required.
In the future, glacier melting and permafrost thaw are expected due to the climate warming. These changes will modify the hydrological regime and sediment flux pattern of glacier-fed rivers in the Arctic. At the regional scale of Svalbard Archipelago, glaciers lost volume of 9.71 ± 0.55 km3 a−1 over the past 40 years [68], whereas the glacierized area of the archipelago deceased by 7% in the last 30 years [69]. In the recent period of 1990–2007, glacier terminus retreat was larger than in 1930–1990, while area shrinkage was smaller. Tidewater glacier retreat was considerably higher compared to land-based glacier retreat [70]. The ablation water from melting glaciers is very important part of the total runoff, but in the catchment of the land-based Werenskioldbreen, the highest sediment load and concentration are triggered by intense rainfall events, especially in August and September. It is confirmed by a strong correlation between suspended sediment load and precipitation in these months (r ≅ 0.9) (Figure 10) and by an increase in the percentage rate of the “extreme SSL” in the total load during rain dominated seasons (Table 3). Our direct field observations, in conjunction with the recorded positive trend in the sum of liquid precipitation in Hornsund, SW Spitsbergen [71,72] causing a runoff increase [42] allow us to expect an intensification of mechanical denudation within the coming years. Despite the high interannual variations, precipitation at the Polish Polar Station had a tendency to increase during the period 2007–2017. The dominance of seasons with precipitation above average for July–September (~200 mm; 1983–2017) has been observed in the last decade. (Figure 11).
Currently the regular hydrological and sedimentological cycles in glacierized basins are more often disturbed and interrupted by intense snowmelt or heavy rainfall, or by a glacier surge, jökulhlaup events or Glacial Lakes Outburst Floods [73,74,75]. The further intensification of erosion in glaciated and periglacial areas leads to increased sediment [13] and nutrient transport [4,5,7]. The sediment delivered to fiords also impairs the diversity and productivity of bentic communities in the vicinity of glaciers [76]. Sediment yield from land-terminating glaciers also decreases the productivity of pelagic communities in the fiord [77,78].
As summarized in the Sediment Budgets in Cold Environments (SEDIBUD) programme, the trends intensifying the solute and sedimentary flux are expected in all cold regions. Another effect in glacierized basins is a decrease in water supply. The glacier recession, thinning, and thermal evolution (from temperate-towards the cold-based glaciers) leads to a potential reduction in suspended sediment yields. Such scenarios are foreseen for Svalbard’s polythermal glaciers, including Werenskioldbreen [32,79,80].

6. Conclusions

This paper shows the suspended sediment dynamics within the glacierized basin of Werenskioldbreen, a polythermal glacier in the High Arctic, for the period 2007–2012. The mechanical denudation in the Werenskioldbreen catchment was on average 0.631 ± 0.326 mm year−1, which is one of the highest in Svalbard.
Heavy rainfall is found to be a primary factor affecting both discharge and suspended sediment concentration changes, but the sediment flux is not a simple function. The removal of the highest amount of fine sediments during rain episodes is related to a quick meltwater flow in the subglacial drainage system, fine matter mobilization from glacier bed, and partly to the permafrost thaw in the proglacial zone, increasing sediment availability.
The continuous rejuvenation of the sediment supply has been proven in the entire basin during the course of the active season with rain episodes. The clockwise hysteresis loops and analysis of selected snowmelt and rain floods show evidence for subglacial conduit maturation during the season. Reducing one-day lag times between Q peaks and SSC peaks in the late part of the hydrologically active season indicate a continued development of the glacier drainage system. Under subglacial conditions, new sediment sources from the expanding channelized drainage system and from the linked cavity drainage system are continuously released during rain events. The high suspended sediment yield results from flushing of the loosened proglacial sediment by the proglacial rivers.
We think that the future models determining the suspended sediment yield from glacierized basins should include rainfall. Our study allows us to expect a greater supply of sediments to the adjacent sea due to wetter Arctic summers or autumns in the future.

Author Contributions

The first author was in charge of research conceptualization and methodology, data collection in the field, its processing, and analysis, writing the original draft of the paper. The second author supported the work, helped in editing and preparation of the manuscript for submission.

Funding

The funding for this work was provided by the SvalGlac–Sensitivity of Svalbard glaciers to climate change (Polish contribution), as part of the ESF−EPB project Polar−CLIMATE, financed by the National Centre of Research and Development (grant no. NCBiR/PolarCLIMATE−2009/2−1/2010), the ice2sea programme from the European Union 7th Framework Programme, grant number 226375; project Arctic climate system study of ocean, sea ice and glaciers interactions in Svalbard area–AWAKE2 (Pol−Nor/198675/17/2013), funded by the National Centre for Research and Development within the Polish−Norwegian Research Cooperation Programme, and the National Science Centre, Poland (Research Project N N306 792040): Complex model of chemical processes in High Arctic glacier. The publication has been supported by the Centre for Polar Studies of the University of Silesia, Poland—the Leading National Research Centre (KNOW) in Earth sciences.

Acknowledgments

The authors would like to thank Katarzyna Cichała-Kamrowska, Mirosław Wąsik (University of Wrocław) and Michał Laska (University of Silesia) who assisted in fieldwork. We wish to acknowledge the permission of the University of Wrocław to use the Baranowski Station and the Institute of Geophysics, Polish Academy of Sciences for the use of the research facilities at the Polish Polar Station, Hornsund, specifically during two wintering expeditions of 2008/2009 and 2010/2011. The authors would like to thank the anonymous reviewers for their constructive comments and suggestions to improve the quality of the manuscript.

Conflicts of Interest

The authors declare no conflict of interest.

References

  1. Stott, T.; Mount, N. Alpine proglacial suspended sediment dynamics in warm and cool ablation seasons: Implications for global warming. J. Hydrol. 2007, 332, 259–270. [Google Scholar] [CrossRef]
  2. Schiefer, E.; Kaufman, D.; McKay, N.; Retelle, M.; Werner, A.; Roof, S. Fluvial suspended sediment yields over hours to millennia in the High Arctic at proglacial Lake Linnévatnet, Svalbard. Earth Surf. Process. Landf. 2018, 43, 482–498. [Google Scholar] [CrossRef]
  3. Syvitski, J.P.M.; Burrell, D.C.; Skei, J.M. Fjords: Processes and Products; Springer: Berlin, Germany, 1987; Volume 20, ISBN 978-1-4612-4632-9. [Google Scholar]
  4. Hawkings, J.; Wadham, J.; Tranter, M.; Telling, J.; Bagshaw, E.; Beaton, A.; Simmons, S.-L.; Chandler, D.; Tedstone, A.; Nienow, P. The Greenland ice sheet as a hot spot of phosphorus weathering and export in the Arctic. Glob. Biogeochem. Cycles 2016, 30, 191–210. [Google Scholar] [CrossRef]
  5. Hawkings, J.R.; Wadham, J.L.; Benning, L.G.; Hendry, K.R.; Tranter, M.; Tedstone, A.; Nienow, P.; Raiswell, R. Ice sheets as a missing source of silica to the polar oceans. Nat. Commun. 2017, 8. [Google Scholar] [CrossRef] [PubMed]
  6. Hawkings, J.R.; Wadham, J.L.; Tranter, M.; Lawson, E.; Sole, A.; Cowton, T.; Tedstone, A.J.; Bartholomew, I.; Nienow, P.; Chandler, D.; et al. The effect of warming climate on nutrient and solute export from the Greenland ice sheet. Geochem. Perspect. Lett. 2015, 1, 94–104. [Google Scholar] [CrossRef]
  7. Hawkings, J.R.; Wadham, J.L.; Tranter, M.; Raiswell, R.; Benning, L.G.; Statham, P.J.; Tedstone, A.; Nienow, P.; Lee, K.; Telling, J. Ice sheets as a significant source of highly reactive nanoparticulate iron to the oceans. Nat. Commun. 2014, 5. [Google Scholar] [CrossRef] [PubMed] [Green Version]
  8. Wadham, J.L.; Hawkings, J.; Telling, J.; Chandler, D.; Alcock, J.; O’Donnell, E.; Kaur, P.; Bagshaw, E.; Tranter, M.; Tedstone, A.; et al. Sources, cycling and export of nitrogen on the Greenland ice sheet. Biogeosciences 2016, 13, 6339–6352. [Google Scholar] [CrossRef]
  9. Guillon, H.; Mugnier, J.L.; Buoncristiani, J.F. Proglacial sediment dynamics from daily to seasonal scales in a glaciated alpine catchment (bossons glacier, Mont Blanc massif, France). Earth Surf. Process. Landf. 2018, 43, 1478–1495. [Google Scholar] [CrossRef]
  10. Costa, A.; Molnar, P.; Stutenbecker, L.; Bakker, M.; Silva, T.A.; Schlunegger, F.; Lane, S.N.; Loizeau, J.L.; Girardclos, S. Temperature signal in suspended sediment export from an Alpine catchment. Hydrol. Earth Syst. Sci. 2018, 22, 509–528. [Google Scholar] [CrossRef] [Green Version]
  11. Irvine-Fynn, T.D.L.; Moorman, B.J.; Willis, I.C.; Sjogren, D.B.; Hodson, A.J.; Mumford, P.N.; Walter, F.S.A.; Williams, J.L.M. Geocryological processes linked to High Arctic proglacial stream suspended sediment dynamics: Examples from Bylot Island, Nunavut, and Spitsbergen, Svalbard. Hydrol. Process. 2005, 19, 115–135. [Google Scholar] [CrossRef]
  12. Hodson, A.J.; Ferguson, R.I. Fluvial suspended sediment transport from cold and warm-based glaciers in Svalbard. Earth Surf. Process. Landf. 1999, 24, 957–974. [Google Scholar] [CrossRef]
  13. Favaro, E.A.; Lamoureux, S.F. Downstream patterns of suspended sediment transport in a High Arctic river influenced by permafrost disturbance and recent climate change. Geomorphology 2015, 246, 359–369. [Google Scholar] [CrossRef]
  14. Drewry, D.J. Glacial Geologic Processes; Hodder Arnold: London, UK, 1985; pp. 1–288. ISBN 978-0713164855. [Google Scholar]
  15. Hallet, B.; Hunter, L.; Bogen, J. Rates of erosion and sediment evacuation by glaciers: A review of field data and their implications. Glob. Planet. Chang. 1996, 12, 213–235. [Google Scholar] [CrossRef]
  16. Bogen, J.; Bønsnes, T.E. Erosion and sediment transport in High Arctic rivers, Svalbard. Polar Res. 2003, 22, 175–189. [Google Scholar] [CrossRef]
  17. Hodgkins, R. Seasonal trend in suspended-sediment transport from an Arctic glacier, and implications for drainage-system structure. Ann. Glaciol. 1996, 22, 147–151. [Google Scholar] [CrossRef] [Green Version]
  18. Hodson, A.; Gurnell, A.; Tranter, M.; Bogen, J.; Hagen, J.O.; Clark, M. Suspended sediment yield and transfer processes in a small High-Arctic glacier basin, Svalbard. Hydrol. Process. 1998, 12, 73–86. [Google Scholar] [CrossRef]
  19. Vatne, G.; Etzelmüller, B.; Sollid, J.L.; Ødegård, R.S. Meltwater routing in a High Arctic glacier, Hannabreen, northern Spitsbergen. Nor. Geografisk Tidsskri. Norw. J. Geogr. 1996, 50, 67–74. [Google Scholar] [CrossRef]
  20. Ladegaard-Pedersen, P.; Sigsgaard, C.; Kroon, A.; Abermann, J.; Skov, K.; Elberling, B. Suspended sediment in a High-Arctic river: An appraisal of flux estimation methods. Sci. Total Environ. 2017, 580, 582–592. [Google Scholar] [CrossRef] [PubMed]
  21. Mao, L.; Carrillo, R. Temporal dynamics of suspended sediment transport in a glacierized andean basin. Geomorphology 2017, 287, 116–125. [Google Scholar] [CrossRef]
  22. Pälli, A.; Moore, J.C.; Jania, J.; Kolondra, L.; Głowacki, P. The drainage pattern of Hansbreen and Werenskioldbreen, two polythermal glaciers in Svalbard. Polar Res. 2003, 22, 355–371. [Google Scholar] [CrossRef]
  23. Hodgkins, R. Controls on suspended sediment transfer at a High Arctic glacier, determined from statistical modelling. Earth Surf. Process. Landf. 1999, 24, 1–21. [Google Scholar] [CrossRef]
  24. Hodgkins, R.; Cooper, R.; Wadham, J.; Tranter, M. Suspended sediment fluxes in a High-Arctic glacierised catchment: Implications for fluvial sediment storage. Sediment. Geol. 2003, 162, 105–117. [Google Scholar] [CrossRef]
  25. Sawada, M.; Johnson, P.G. Hydrometeorology, suspended sediment and conductivity in a large glacierized basin, Slims River, Yukon Territory, Canada (1993–94). Arctic 2000, 53, 101–117. [Google Scholar] [CrossRef]
  26. Syvitski, J.P.M. Sediment discharge variability in arctic rivers: Implications for a warmer future. Polar Res. 2002, 21, 323–330. [Google Scholar] [CrossRef]
  27. Szpikowski, J.; Szpikowska, G.; Zwoliński, Z.; Rachlewicz, G.; Kostrzewski, A.; Marciniak, M.; Dragon, K. Character and rate of denudation in a High Arctic glacierized catchment (Ebbaelva, Central Spitsbergen). Geomorphology 2014, 218, 52–62. [Google Scholar] [CrossRef]
  28. Leggat, M.S.; Owens, P.N.; Stott, T.A.; Forrester, B.J.; Déry, S.J.; Menounos, B. Hydro-meteorological drivers and sources of suspended sediment flux in the pro-glacial zone of the retreating Castle Creek glacier, Cariboo Mountains, British Columbia, Canada. Earth Surf. Process. Landf. 2015, 40, 1542–1559. [Google Scholar] [CrossRef]
  29. Jania, J. Klasyfikacja i cechy morfometryczne lodowców otoczenia Hornsundu, Spitsbergen. In Wyprawy Polarne Uniwersytetu Śląskiego 1980–1984; University of Silesia: Katowice, Poland, 1988; Volume 2, pp. 12–47. ISBN 8322602308. [Google Scholar]
  30. Ignatiuk, D. Bilans Energetyczny Powierzchni Lodowca a Zasilanie Systemu Drenażu Glacjalnego Werenskioldbreen. The Energy Balance of the Glacier Surface and Water Supply of Drainage System of Werenskioldbreen. Ph.D. Thesis, University of Silesia, Sosnowiec, Poland, 2012. [Google Scholar]
  31. Hagen, J.O.; Liestol, O.; Roland, E.; Jorgensen, T. Glacier Atlas of SVALBARD and Jan Mayen; Norsk Polarinstitutt: Oslo, Norway, 1993; ISBN 82-7666-066-5. [Google Scholar]
  32. Grabiec, M. Stan i Współczesne Zmiany Systemów Lodowcowych Południowego Spitsbergenu w Świetle Badań Metodami Radarowym. The State and Contemporary Changes of the Glacial Systems in Southern Spitsbergen in the Light of the Radar Methods; Wydawnictwo Uniwersytetu Śląskiego: Katowice, Poland, 2017; Volume 3536, pp. 1–328. ISBN 978-83-226-3014-3. [Google Scholar]
  33. Stachnik, Ł.; Yde, J.C.; Kondracka, M.; Ignatiuk, D.; Grzesik, M. Glacier naled evolution and relation to the subglacial drainage system based on water chemistry and GPR surveys (Werenskioldbreen, SW Svalbard). Ann. Glaciol. 2016, 57, 19–30. [Google Scholar] [CrossRef]
  34. Piechota, A.M.; Sitek, S.; Ignatiuk, D.; Piotrowski, J.A. Reconstructing subglacial drainage of Werenskiold glacier (SW Spitsbergen) based on numerical modelling. Biuletyn Państwowego Instytutu Geologicznego 2012, 451, 191–202. [Google Scholar]
  35. Birkenmajer, K. Geology of Hornsund area, Spitsbergen 1:75000; University of Silesia: Katowice, Poland, 1990. [Google Scholar]
  36. Czerny, J.; Kieres, A.; Manecki, M.; Rajchel, J. Geological map of the SW part of Wedel-Jarlsberg Land, Spitsbergen. In Institute of Geology and Mineral Deposits; Manecki, A., Ed.; University of Mining and Metallurgy: Kraków, Poland, 1993. [Google Scholar]
  37. Kabala, C.; Zapart, J. Initial soil development and carbon accumulation on moraines of the rapidly retreating Werenskiold glacier, SW Spitsbergen, Svalbard Archipelago. Geoderma 2012, 175–176, 9–20. [Google Scholar] [CrossRef]
  38. Kowalska, A.; Soroka, W. Sedimentary environment of the Nottinghambukta delta, SW Spitsbergen. Pol. Polar Res. 2008, 29, 245–259. [Google Scholar]
  39. Bukowska-Jania, E. The role of glacier system in migration of calcium carbonate on Svalbard. Pol. Polar Res. 2007, 28, 137–155. [Google Scholar]
  40. Stachnik, Ł.; Majchrowska, E.; Yde, J.C.; Nawrot, A.; Cichała-Kamrowska, K.; Ignatiuk, D.; Piechota, A. Chemical denudation and the role of sulfide oxidation at Werenskioldbreen, Svalbard. J. Hydrol. 2016, 538, 177–193. [Google Scholar] [CrossRef] [Green Version]
  41. Szynkiewicz, A.; Modelska, M.; Buczyński, S.; Borrok, D.M.; Merrison, J.P. The polar sulfur cycle in the Werenskioldbreen, Spitsbergen: Possible implications for understanding the deposition of sulfate minerals in the north polar region of mars. Geochim. Cosmochim. Acta 2013, 106, 326–343. [Google Scholar] [CrossRef]
  42. Majchrowska, E.; Ignatiuk, D.; Jania, J.; Marszałek, H.; Wasik, M. Seasonal and interannual variability in runoff from the Werenskioldbreen catchment, Spitsbergen. Pol. Polar Res. 2015, 36, 197–224. [Google Scholar] [CrossRef] [Green Version]
  43. Hornsund Glacio−Topoclim Database. Available online: http://www.glacio-topoclim.org/ (accessed on 31 August 2012).
  44. Meteorological Bulletins of the Institute of Geophysics of the Polish Academy of Sciences. Available online: https://hornsund.igf.edu.pl/Biuletyny/ (accessed on 28 August 2018).
  45. The International Organization for Standardization (ISO). Water Quality—Determination of Suspended Solids—Method by Filtration through Glass-Fibre Filters; ISO: Vernier, Switzerland, 1997. [Google Scholar]
  46. Folk, R.L.; Ward, W.C. Brazos river bar, a study in the significance of grain size parameters. J. Sediment. Res. 1957, 27, 3–26. [Google Scholar] [CrossRef]
  47. Willis, I.C. Rating curve. In Encyclopedia of Snow, Ice and Glaciers; Singh, V.P., Singh, P., Haritashya, U.K., Eds.; Springer Netherlands: Dordrecht, The Netherlands, 2011; pp. 918–922. ISBN 978-90-481-2642-2. [Google Scholar]
  48. Skarbøvik, E.; Stålnacke, P.; Bogen, J.; Bønsnes, T.E. Impact of sampling frequency on mean concentrations and estimated loads of suspended sediment in a norwegian river: Implications for water management. Sci. Total Environ. 2012, 433, 462–471. [Google Scholar] [CrossRef] [PubMed]
  49. McDonald, D.M.; Lamoureux, S.F. Hydroclimatic and channel snowpack controls over suspended sediment and grain size transport in a High Arctic catchment. Earth Surf. Process. Landf. 2009, 34, 424–436. [Google Scholar] [CrossRef]
  50. Berthling, I.; Etzelmüller, B. The changing cryosphere—Implications for solute and sedimentary fluxes in cold climate environments. In Source-to-Sink Fluxes in Undisturbed Cold Environments; Beylich, A.A., Dixon, J.C., Zwoliński, Z., Eds.; Cambridge University Press: Cambridge, UK, 2016; pp. 13–29. ISBN 9781107068223. [Google Scholar]
  51. Pulina, M. Preliminary studies on denudation in SW Spitsbergen. Bull. Acad. Pol. Sci. Terre 1974, 22, 83–99. [Google Scholar]
  52. Krawczyk, W.; Opołka-Gądek, J. Suspended sediment concentration in the Werenskiold glacier drainage basin in 1986. In XXI Polar Symposium; Zalewski, M.S., Ed.; Institute of Geophysics Polish Academy of Sciences: Warszawa, Poland, 1994; pp. 215–224. ISBN 8385173374. [Google Scholar]
  53. Lawler, D.M.; Petts, G.E.; Foster, I.D.L.; Harper, S. Turbidity dynamics during spring storm events in an urban headwater river system: The upper tame, west midlands, UK. Sci. Total Environ. 2006, 360, 109–126. [Google Scholar] [CrossRef] [PubMed]
  54. Riihimaki, C.A.; MacGregor, K.R.; Anderson, R.S.; Anderson, S.P.; Loso, M.G. Sediment evacuation and glacial erosion rates at a small alpine glacier. J. Geophys. Res. Earth Surf. 2005, 110. [Google Scholar] [CrossRef] [Green Version]
  55. Jansson, P.; Rosqvist, G.; Schneider, T. Glacier fluctuations, suspended sediment flux and glacio-lacustrine sediments. Geogr. Ann. Ser. A Phys. Geogr. 2005, 87, 37–50. [Google Scholar] [CrossRef]
  56. Leszkiewicz, J.; Caputa, Z. The thermal condition of the active layer in the permafrost at Hornsund, Spitsbergen. Pol. Polar Res. 2004, 25, 223–239. [Google Scholar]
  57. Liermann, S.; Beylich, A.A.; van Welden, A. Contemporary suspended sediment transfer and accumulation processes in the small proglacial sætrevatnet sub-catchment, Bødalen, western Norway. Geomorphology 2012, 167–168, 91–101. [Google Scholar] [CrossRef]
  58. Haritashya, U.K.; Singh, P.; Kumar, N.; Gupta, R.P. Suspended sediment from the Gangotri glacier: Quantification, variability and associations with discharge and air temperature. J. Hydrol. 2006, 321, 116–130. [Google Scholar] [CrossRef]
  59. Richards, K. Some observations on suspended sediment dynamics in Storbregrova, Jotunheimen. Earth Surf. Process. Landf. 1984, 9, 101–112. [Google Scholar] [CrossRef]
  60. Dugan, H.A.; Lamoureux, S.F.; Lafrenière, M.J.; Lewis, T. Hydrological and sediment yield response to summer rainfall in a small High Arctic watershed. Hydrol. Process. 2009, 23, 1514–1526. [Google Scholar] [CrossRef]
  61. Wawrzyniak, T.; Osuch, M.; Napiórkowski, J.; Westermann, S. Modelling of the thermal regime of permafrost during 1990–2014 in Hornsund, Svalbard. Pol. Polar Res. 2016, 37, 219–242. [Google Scholar] [CrossRef] [Green Version]
  62. Piroznikow, E.; Gorniak, A. Changes in the characteristics of the soil and vegetation during the primary succession in the marginal zone of the Werenskiold glacier, Spitsbergen. Pol. Polar Res. 1992, 13, 19–29. [Google Scholar]
  63. Bogen, J. Glacial sediment production and development of hydro-electric power in glacierized areas. Ann. Glaciol. 1989, 13, 6–11. [Google Scholar] [CrossRef]
  64. Sollid, J.L.; Etzelmüller, B.; Vatne, G.; Ødegård, R. Glacial dynamics, material transfer and sedimentation of Erikbreen and hannabreen, Liefdefjorden, northern Spitsbergen. Z. Geomorphol. Suppl. Issue B 1994, 97, 123–144. [Google Scholar]
  65. Kjeldsen, O. Materialtransportundersckelser i Norske Breelver 1980; Vassdragsdirektor Hydrologisk Avdeling: Oslo, Norway, 1981. [Google Scholar]
  66. Elverhøi, A.; Svendsen, J.I.; Solheim, A.; Andersen, E.S.; Milliman, J.; Mangerud, J.; Hooke, R.L. Late quaternary sediment yield from the High Arctic Svalbard area. J. Geol. 1995, 103, 1–17. [Google Scholar] [CrossRef]
  67. Dixon, J.C. Contemporary solute and sedimentary fluxes in arctic and subarctic environments: Current knowledge. In Source-to-Sink Fluxes in Undisturbed Cold Environments; Beylich, A.A., Dixon, J.C., Zwoliński, Z., Eds.; Cambridge University Press: Cambridge, UK, 2016; pp. 39–51. ISBN 9781107068223. [Google Scholar]
  68. Nuth, C.; Moholdt, G.; Kohler, J.; Hagen, J.O.; Kääb, A. Svalbard glacier elevation changes and contribution to sea level rise. J. Geophys. Res. Earth Surf. 2010, 115. [Google Scholar] [CrossRef] [Green Version]
  69. Nuth, C.; Kohler, J.; König, M.; Von Deschwanden, A.; Hagen, J.O.; Kääb, A.; Moholdt, G.; Pettersson, R. Decadal changes from a multi-temporal glacier inventory of Svalbard. Cryosphere 2013, 7, 1603–1621. [Google Scholar] [CrossRef] [Green Version]
  70. Błaszczyk, M.; Jania, J.A.; Kolondra, L. Fluctuations of tidewater glaciers in hornsund fjord (southern svalbard) since the beginning of the 20th century. Pol. Polar Res. 2013, 34, 327–352. [Google Scholar] [CrossRef]
  71. Łupikasza, E. Long-term variability of precipitation form in Hornsund (Spitsbergen) in relation to atmospheric circulation (1979–2009). Bull. Geogr. Phys. Geogr. Ser. 2010, 3, 65–86. [Google Scholar] [CrossRef]
  72. Osuch, M.; Wawrzyniak, T. Climate projections in the Hornsund area, southern Spitsbergen. Pol. Polar Res. 2016, 37, 379–402. [Google Scholar] [CrossRef]
  73. Beylich, A.A.; Gintz, D. Effects of high-magnitude/low-frequency fluvial events generated by intense snowmelt or heavy rainfall in Arctic periglacial environments in northern swedish lapland and northern Siberia. Geogr. Ann. Ser. A Phys. Geogr. 2004, 86, 11–29. [Google Scholar] [CrossRef]
  74. Knudsen, N.T.; Yde, J.C.; Gasser, G. Suspended sediment transport in glacial meltwater during the initial quiescent phase after a major surge event at Kuannersuit glacier, Greenland. Geografisk Tidsskri. Dan. J. Geogr. 2007, 107, 1–7. [Google Scholar] [CrossRef]
  75. Beylich, A.A.; Dixon, J.C.; Zwoliński, Z. Summary of key findings from arctic, antarctic, and mountain environments. In Source-to-Sink Fluxes in Undisturbed Cold Environments; Beylich, A.A., Dixon, J.C., Zwoliński, Z., Eds.; Cambridge University Press: Cambridge, UK, 2016; pp. 398–399. ISBN 9781107068223. [Google Scholar]
  76. Legeżyńska, J.; Włodarska-Kowalczuk, M.; Głuchowska, M.; Ormańczyk, M.; Kędra, M.; Węsławski, J.M. The malacostracan fauna of two Arctic fjords (west Spitsbergen): The diversity and distribution patterns of its pelagic and benthic components. Oceanologia 2017, 59, 541–564. [Google Scholar] [CrossRef]
  77. Meire, L.; Mortensen, J.; Meire, P.; Juul-Pedersen, T.; Sejr, M.K.; Rysgaard, S.; Nygaard, R.; Huybrechts, P.; Meysman, F.J.R. Marine-terminating glaciers sustain high productivity in Greenland fjords. Glob. Chang. Biol. 2017, 23, 5344–5357. [Google Scholar] [CrossRef] [PubMed] [Green Version]
  78. Hopwood, M.J.; Carroll, D.; Browning, T.J.; Meire, L.; Mortensen, J.; Krisch, S.; Achterberg, E.P. Non-linear response of summertime marine productivity to increased meltwater discharge around Greenland. Nat. Commun. 2018, 9, 3256. [Google Scholar] [CrossRef] [PubMed]
  79. Irvine-Fynn, T.D.L.; Hodson, A.J.; Moorman, B.J.; Vatne, G.; Hubbard, A.L. Polythermal glacier hydrology: A review. Rev. Geophys. 2011, 49. [Google Scholar] [CrossRef]
  80. Navarro, F.J.; Martín-Español, A.; Lapazaran, J.J.; Grabiec, M.; Otero, J.; Vasilenko, E.V.; Puczko, D. Ice volume estimates from ground-penetrating radar surveys, Wedel Jarlsberg Land glaciers, Svalbard. Arct. Antarct. Alp. Res. 2014, 46, 394–406. [Google Scholar] [CrossRef]
Figure 1. Measurement points in the Werenskioldbreen catchment: (A) subartesian central subglacial outflows, (B) the Kvisla channelized outflow (R-channel), (C) Breelva gauging station (E. Łepkowska and P. Łepkowski).
Water 10 01408 g001
Figure 2. Daily changes of suspended sediment concentration at the Breelva River in 2007, based upon monthly averaged sampling every 8 h (for July n = 29 days, August n = 31 days, September n = 7 days).
Water 10 01408 g002
Figure 3. The duration of suspended sediment concentration (SSC) monitoring in Breelva. The days of sampling (2 or 3 samples a day) in each year (1972, 1986, 2007, 2008, 2010, 2011, 2012).
Water 10 01408 g003
Figure 4. The correlation (r-Pearson) between the suspended sediment concentration (log10 SSC (g dm−3)) and discharge (log10 Q (m3 s−1)) at the Breelva hydrometic station.
Water 10 01408 g004
Figure 5. Cumulative delivery of SSL and Q. The suspended sediment load (SSL) is marked with a dashed line and runoff (Qtotal) is a continuous line.
Water 10 01408 g005
Figure 6. Mean daily grain size, suspended sediment concentration (SSC), and discharge (Q) in the Breelva (hydrometric station—C, Figure 1), central (A, Figure 1), and Kvisla (B, Figure 1) outflows. The snowmelt and rain floods are marked as shaded areas.
Water 10 01408 g006
Figure 7. Hysteresis patterns between SSC and runoff in Breelva during 2007, 2008, and 2012 (examples of rain and snowmelt peak cycles).
Water 10 01408 g007
Figure 8. Discharge (Q) and suspended sediment concentration (SSC) in the Breelva River, with an indication of the origin of the peaks (shaded areas), with the background data of precipitation in Hornsund (P) [43].
Water 10 01408 g008
Figure 9. Regional effective bedrock erosion rates marked according to Hallet et al. [15]: southeast Alaska (open circles), Swiss Alps (small squares), Norway/Svalbard (open triangles), and other areas including New Zealand, Asia, and Iceland (diamonds). In the diagram, we added the values obtained for Werenskioldbreen (red triangles or blue triangles for the seasons with the significant rain episodes).
Water 10 01408 g009
Figure 10. The relationship (r-Pearson) between normalized suspended sediment load (SSL) and precipitation (P) in Hornsund for June–September each year (2007–2012) (Reference [43] and authors’ data).
Water 10 01408 g010
Figure 11. Rainfall events in June–September of the years: 1986 and 2007–2017 for the Polish Polar Station [43,44], additionally with summer precipitation (1 July–22 September) in 1972, according to Pulina [51].
Water 10 01408 g011
Table 1. The suspended sediment concentration (SSC), suspended sediment load (SSL), and the rate of mechanical denudation and total annual runoff (Qtotal) from Werenskioldbreen catchment in the studied seasons (1972, 1986 and 2007–2012).
Year Period of Sampling (Date Range and Number of Days)Suspended Sediment Concentration (SSC) (g dm−3)Suspended Sediment Load (SSL) (kt)Mechanical Denudation (t km−2) aMechanical Denudation (mm Year −1) bTotal Annual Runoff (Qtotal) (106 m3) **Source
19723.07–21.09
(81 days)
>1.000[51]
198616.06–14.09
(91 days)
0.045–3.63040.25914.80.366~50[52]
20077–24.07; 28.07–7.09
(60 days)
0.011–2.47836.52 (43.95 *)830.00 (998.87 *)0.332 (0.400 *)56.37this study
200814–15.07; 23.07–13.08;
3–5.09; 12–22.09; 24.09
(39 days)
0.043–5.313107.26 (118.46 *)2437.73 (2692.32 *)0.975 (1.077 *)84.04this study
2009--57.71 *1243 *0.497 *78.91-
201025.07–15.08; 20–24.08
(27 days)
0.109–0.6746.56 (37.30 *)149.09 (847.68 *)0.060 (0.339 *)78.35this study
201124.05–31.07; 11–17.08
(76 days)
0.001–1.93028.35 (60.23 *)644.31 (1368.79 *)0.258 (0.548 *)82.28this study
201218.07–22.08
(36 days)
0.217–4.71849.89 (130.94 *)1133.86 (2975.91 *)0.454 (1.190 *)98.71this study
a Taking into account the calculated area of the basin (44 km2). b Taking into consideration a generalized, average value of specific sediment weight in the Breelva River catchment was assumed as 2500 kg m−3. * Estimated value for the hydrologically active season. ** Based on Majchrowska et al. [42].
Table 2. Dates and lag-times of the cumulative percentage distribution of suspended sediment concentration (SSC) and runoff (Qtotal) for Breelva catchment.
Year% of SSC (Date)
SSC 10%SSC 25%SSC 50%SSC 75%SSC 90%
200726 Jun8 Jul28 Jul4 Aug11 Aug
200826 Jun21 Jul24 Aug18 Sep21 Sep
201020 Jun8 Jul27 Jul5 Sep29 Sep
201112 Jun29 Jun31 Jul26 Aug12 Sep
201227 Jun19 Jul12 Aug30 Aug13 Sep
Year% of Runoff (Qtotal) (Date)
Qtotal 10%Qtotal 25%Qtotal 50%Qtotal 75%Qtotal 90%
200725 Jun6 Jul27 Jul6 Aug19 Aug
200820 Jun8 Jul7 Aug16 Sep21 Sep
201020 Jun9 Jul31 Jul4 Sep29 Sep
201126 Jun13 Jul13 Aug5 Sep17 Sep
201221 Jun10 Jul11 Aug2 Sep15 Sep
YearLag Time (Days)
SSC 10%–Qtotal 10%SSC 25%–Qtotal 25%SSC 50%–Qtotal 50%SSC 75%–Qtotal 75%SSC 90%–Qtotal 90%
20071 day2 days1 days−2 days−8 days
20086 days13 days17 days2 days0 days
20100 day−1 day−4 days1 day0 day
2011−14 days−15 days−9 days−10 days−5 days
20126 days9 days1 day−3 days−2 days
Table 3. Runoff (Qtotal) and suspended sediment load (SSL) from Werenskioldbreen catchment, divided into the total amount and high discharge event values.
YearQhigh discharge events *
(106 m3)
Qtotal
(106 m3)
Part of Qtotal
(%)
SSLhigh discharge events
(kt)
SSLtotal
(kt)
Part of SSLtotal
(%)
200716.7156.373026.0043.9559
200822.1984.042688.56118.4675
2009 **23.1378.912924.3254.7144
201015.4678.352016.3737.3044
201123.9882.282929.6660.2349
201248.0098.7149108.80130.9483
* Flood episodes based on Majchrowska et al. [42]; ** estimated SSL.
Table 4. The hysteresis index (HImid) of selected floods recorded in the Breelva hydrometric station.
Flood EventQmaxQminQmidSSCrlSSCflHImid
2007 snowmelt (k = 0.5)2.1420.8511.4971.9341.1550.675
2008 rainfall (k = 0.5)3.5120.3561.9344.6492.4390.906
2012 snowmelt (k = 0.5)1.2030.3590.7811.0710.6690.601
2012 rainfall (k = 0.75)4.8240.5163.7473.7442.4920.503

