Article

Experimental Investigation of Artificial Aeration on a Smooth Spillway with a Crest Pier

by
Juan César Luna-Bahena
,
Oscar Pozos-Estrada
*,
Víctor Manuel Ortiz-Martínez
and
Jesús Gracia-Sánchez
Instituto de Ingeniería, Department of Hydraulic Engineering, Universidad Nacional Autónoma de México, Cd. Universitaria, C.P. 04510 Mexico, Mexico
*
Author to whom correspondence should be addressed.
Water 2018, 10(10), 1383; https://doi.org/10.3390/w10101383
Submission received: 22 August 2018 / Revised: 13 September 2018 / Accepted: 15 September 2018 / Published: 3 October 2018
(This article belongs to the Section Hydraulics and Hydrodynamics)

Abstract

:
Crest piers placed on overflow spillways induce standing waves at the downstream end of them and the supercritical flow expands after flowing past the rear of the pier. The expanding flow from each side of a pier will intersect and form disturbances or shock waves that travel laterally as they move downstream and eventually reach the chute sidewalls. Recently, investigations regarding crest piers are related with artificial aeration on stepped spillways to eliminate the risk of cavitation damage. However, there is a lack of studies on standing and shock waves in smooth spillways concerning the air entrainment into the flow in presence of crest piers. This paper presents the study of the combined effect on air entrainment of a crest pier and an aerator on the bottom of a smooth spillway (configuration 1). For comparison, experimental tests were developed in the spillway without pier, that is in presence of aerator only (configuration 2). The configuration 1 results show that the air concentration distribution on the spillway bottom across the width and length of the chute increases in comparison with configuration 2, reducing even more the risk of cavitation damage and enhancing the safety of the hydraulic structure.

Graphical Abstract

1. Introduction

Spillways are important hydraulic structures that provide adequate safety for dams, regulating outlet for flood control operations when reservoir levels are above the spillway crest [1]. Nevertheless, whether the discharged water flow reaches high velocities associated with low pressures, this may cause cavitation damage on the chute spillway bottom if adequate precautions are not taken [2]. Further, if the spillway invert and its sidewalls are subjected to continuous removal of the surface material, it could seriously endanger the integrity of the hydraulic structure [3].
The cavitation damage can be mitigated by a number of methods, for instance, increasing the cavitation index by removing surface irregularities [4]. Likewise, the damaging effects of cavitation erosion may be diminished by increasing the cavitation resistance of the boundary materials, such as fibrous concrete, steel lining, epoxy resins, coatings and various combinations of these. The results vary in success but steel-fiber reinforced concrete appears to be the best option [5]. However, in most cases it would be uneconomical to replace the material in the spillway for cavitation resistant materials. For this reason, other alternatives should be considered to protect the spillway surface from cavitation damage. A very effective and economic method to avoid cavitation damage is dispersing a quantity of air along the spillway invert by placing aeration devices to provide artificially air within high-velocity flows upstream of cavitation ridden zones [6,7].
The positive effects of air addition to diminish cavitation damage in hydraulic structures are known since more than seven decades ago [8,9] and have been applied for more than 40 years. However, studies focused on the amount of air needed for suitable chute protection are scarce. For instance, Peterka [10] stated that by introducing 1% to 2% of air as a layer of air bubbles next to the spillway invert cavitation, damage is reduced, while 5% to 8% entrained air damage is practically eliminated. Likewise, other researchers differ from the amount of air needed for cavitation protection. Rasmussen [11] developed a series of experiments and demonstrated that no cavitation damage occurred by adding a 0.8% to 1% of air by volume distributed as small bubbles. Semenkov and Lentiaev [12] investigated the cavitation damage experienced by concrete surfaces and found that an air concentration of at least 3% is needed to avoid damaging effects. Pylaev [13] corroborated that an air concentration of 3% is required for avoiding cavitation erosion. Russell and Sheehan [14] found that a 2.8% of air is sufficient for cavitation protection of a surface made out of concrete. Based on the above, it can be stated all authors agree that a small amount of air close to the spillway floor diminishes the risk of cavitation damage considerably.
Investigations regarding the aeration of flows and the use of aerators on spillways have been developed for many decades and there is much literature available in this field [15,16,17,18,19,20,21,22,23]. Further, several researchers have investigated model and prototype aerators over the last four decades [24,25,26,27,28,29,30,31,32,33,34,35,36,37,38,39]. Nowadays, aerators are extensively used in spillways all around the world to prevent cavitation damage. In the same way, more recently, between 2015 and 2017, Calitz [40] and Koen [41] studied the artificial aeration on stepped spillways by using various crest pier designs. They found that the bullnose pier practically eliminated the risk of cavitation damage, allowing increasing the unit discharge capacity. However, there is a lack of studies on smooth spillways concerning the air entrainment in presence of crest piers.
It is well known that in spillways with crest piers a standing wave, also called rooster tail occurs immediately at the downstream end of the pier and, moreover, the supercritical flow expands after flowing past the rear of the crest pier. The expanding flow from each side of a pier will intersect and form disturbances or shock waves that travel laterally as they move downstream and eventually reach the chute sidewalls [42,43]. These latter phenomena are shown in Figure 1. Hydraulic and geometric characteristics of standing waves generated by piers have been investigated since the early eighties of last century [42,44,45,46,47,48,49,50,51].
Nevertheless, there no exist studies on standing and shock waves regarding on air entrainment to the bottom of smooth spillways to eliminate or minimize the risk of cavitation damage. This prompts the authors to investigate the combined effect on the aeration process of both a crest pier and an aerator (configuration 1) on the physical hydraulic model of the Huites dam spillway to analyze the behavior of bottom air concentration distribution across the width and length of the chute. For comparison, experimental tests were developed in the physical model with no pier, that is in presence of aerator only (configuration 2). From the results obtained with model configuration 1, it can be observed that the crest pier generated an increase in the bottom air concentration along the chute bottom in comparison to the results achieved with model configuration 2.

2. Materials and Methods

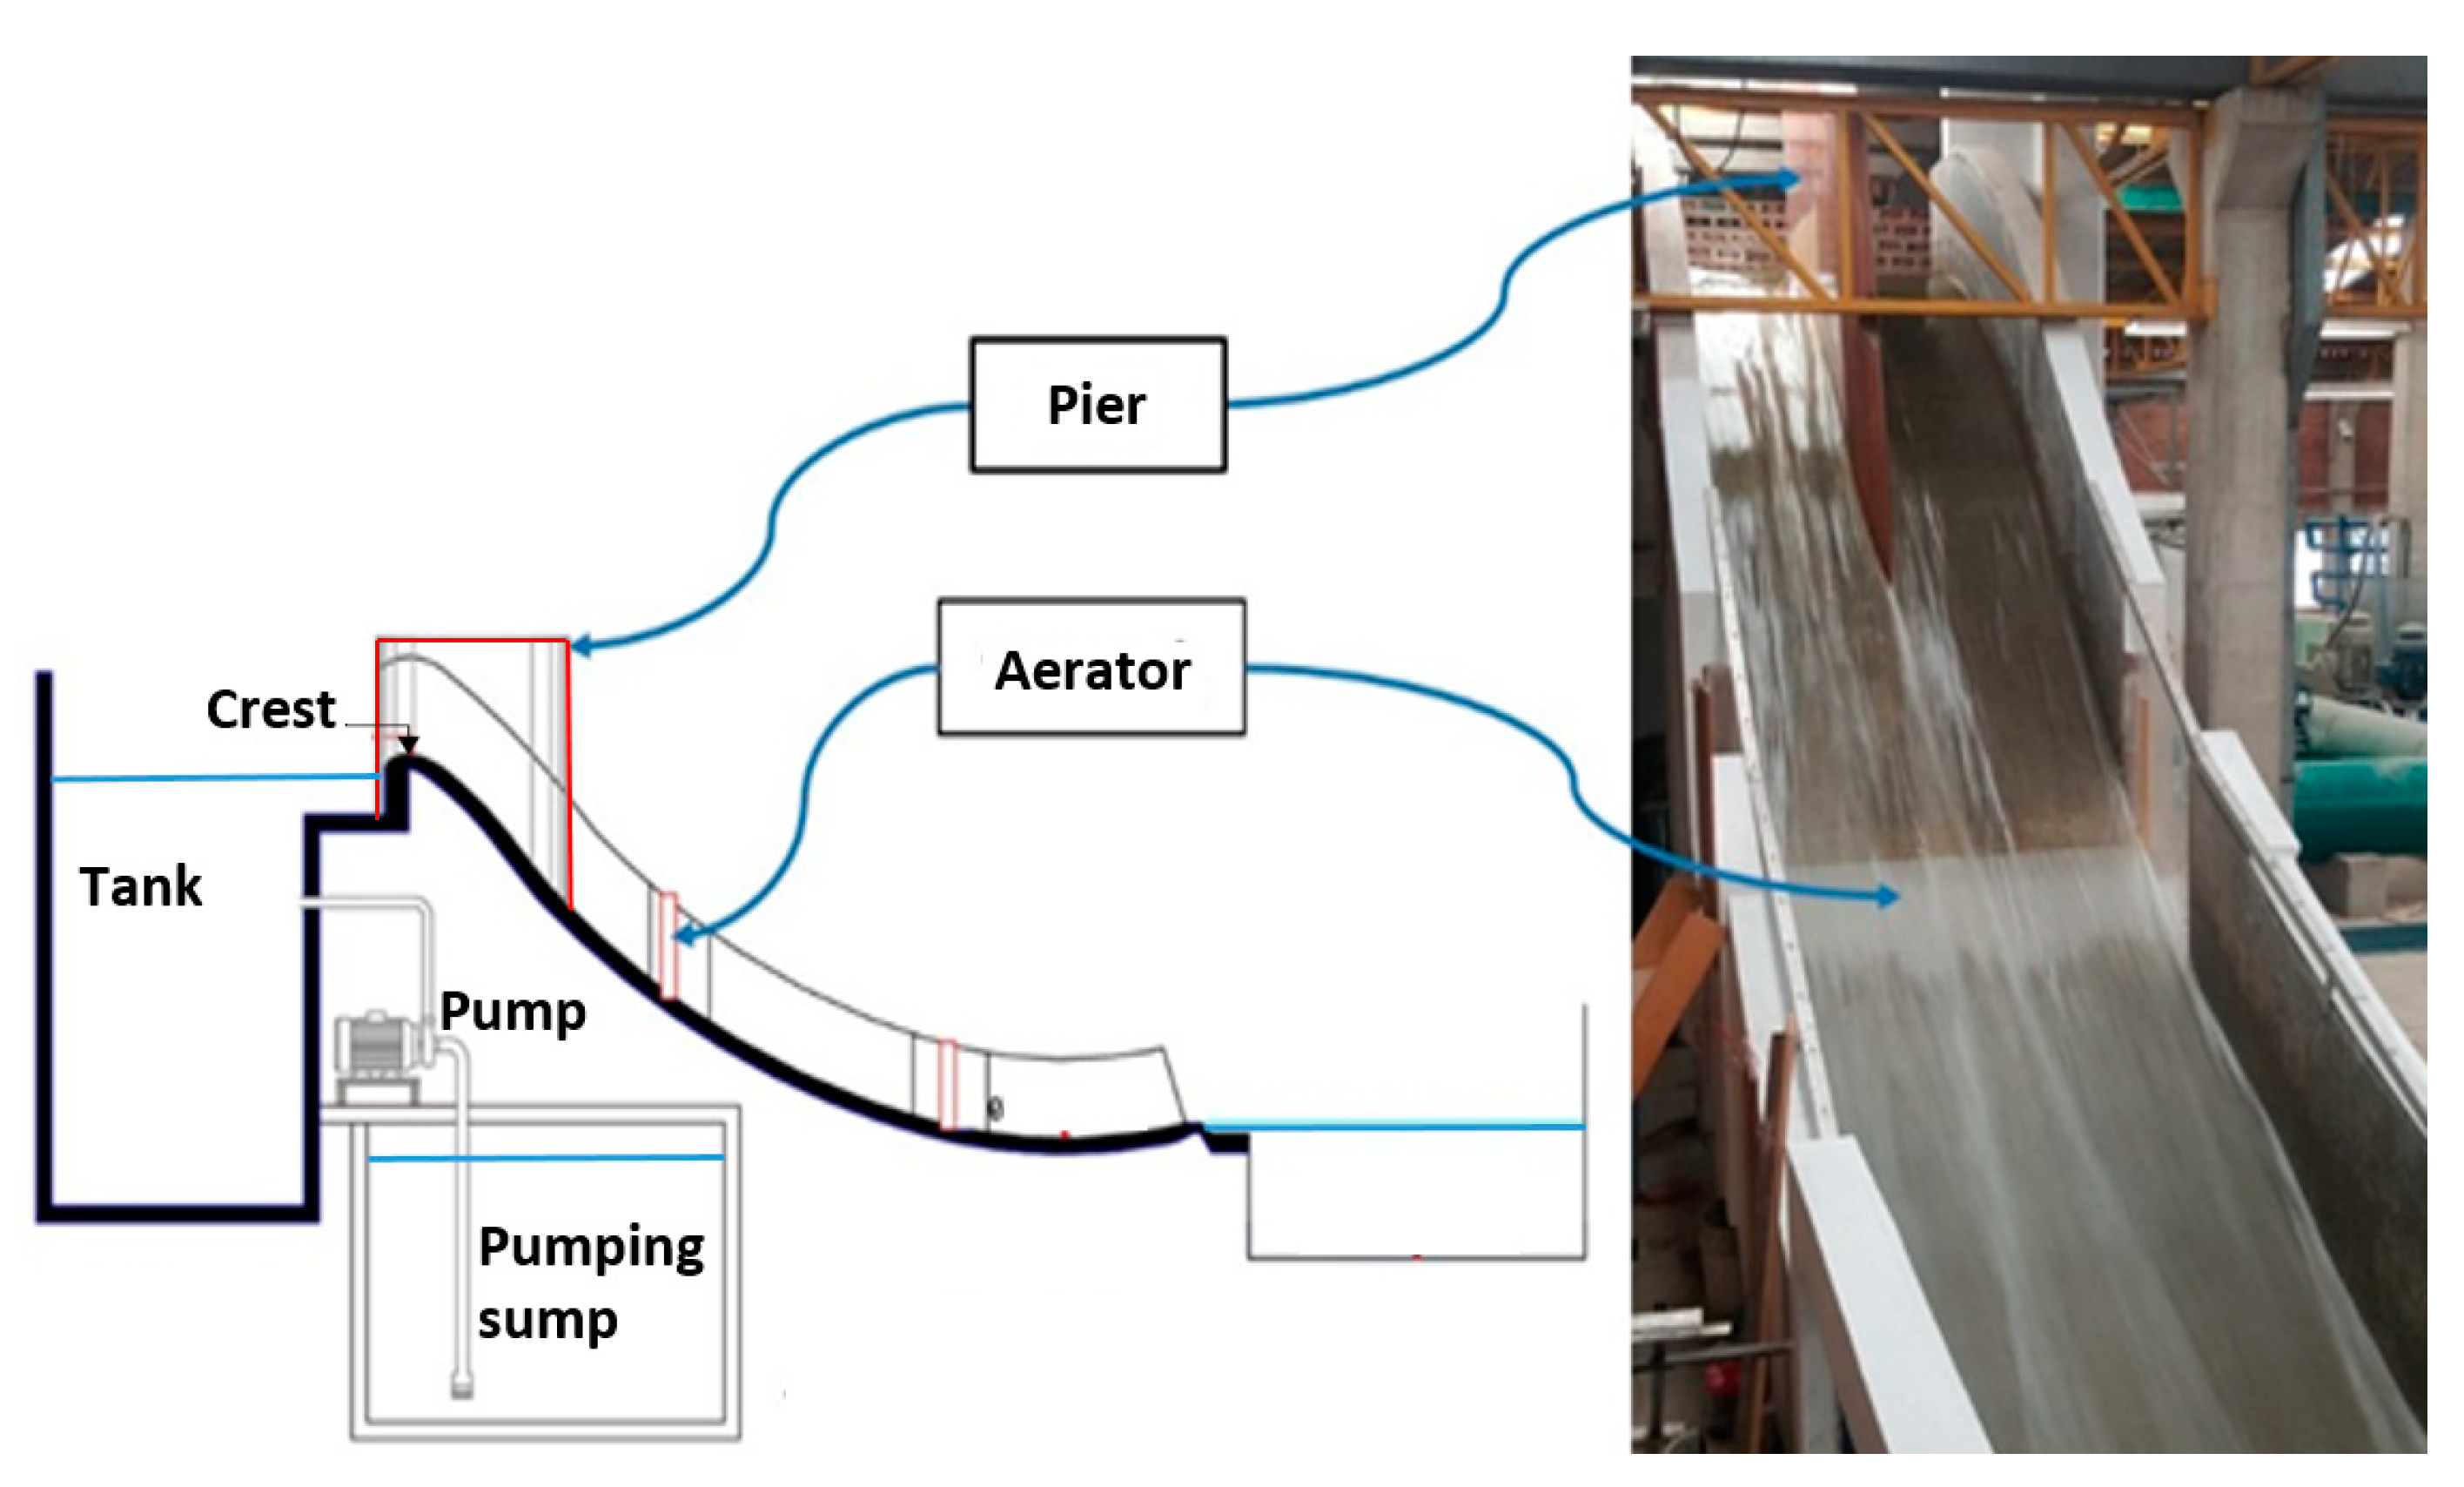
2.1. Physical Scale Spillway Model of the Huites Dam

The Huites Dam is located on the Fuerte River in northwestern Sinaloa, Mexico and is owned by the Comisión Federal de Electricidad (CFE). It is a 162 m high and 426 m long hybrid concrete arch-gravity dam. The overflow spillway has a total capacity of 11,225 m3/s, associated to a 10,000 year flood return period and its crest has an ogee profile with a vertical upstream face. It is important to highlight that the engineers of CFE designed the spillway and the aeration system based on design criteria provided by USBR [52] and Falvey [53].
The Institute of Engineering of the University of Mexico at Mexico City was commissioned by CFE to build the Huites Dam spillway model with the main aim of developing model test for analyzing the behavior of air along the spillway and assess the functionality of the aerator device for protecting the spillway bottom against cavitation damage. The model scale should be large enough to diminish hydraulic scale effects effectively. Therefore, a 1:21 scale physical model was constructed to satisfy the minimum Reynolds and Weber criteria and to mitigate the scaled aeration effects. The spillway model is 4.13 m high and has an 11.8 m long chute that is 1.71 m wide. The spillway entrance is divided by a central wedge-shape pier 0.22 m wide, 2.4 m long, with a variable height from 0.9 m to 2.5 m and made out of wood. Two 200 hp centrifugal pumps with a variable speed drive to regulate the water discharge are used to feed the model. The physical spillway model is illustrated in Figure 2.
On the physical model, the aerator is located 4.7 m downstream from the crest at the change of slope in the spillway from 39.16° to 33.29°. The deflector height (t) is 1.5 cm, the deflector angle (α) is 4° and the offset height (s) is 9 cm. The aeration ducts have been sized with two 11 × 10 cm2 air ducts in the spillway sidewalls. The height of the sidewalls was 1.2 m, the aeration ducts were made of acrylic and the spillway bed was concrete. The aeration system is shown in Figure 3.
Physical scale spillway models have been used to simulate and investigate aerated flows for several decades. Physical modelling is a mature, proven tool and its results can be used with high confidence. During the modeling of free-surface flows the Froude law is usually used, nevertheless, the modeling of high-speed air-water two-phase flows using only the ratio of inertial and gravitational forces, as well as the geometric similarity between model and prototype is impossible, since the air transport in models is affected by scale effects because surface tension expressed with the Weber number (W) is overestimated, while the internal flow turbulence represented by the Reynolds number (R) is underestimated [54,55,56]. In the same way, an adequate reproduction of the air concentrations and air transport in two-phase model flows is possible if limitations in terms of W and R are respected [57]. Pfister and Hager [58] concluded that to achieve reliable air concentrations for high-speed air-water mixture flows using the Froude similitude, minimum values of R = 1 × 10⁵ and W = 110 must be respected in the physical model. Therefore, it can be stated that the model scale 1:21 used during the present investigation is considered large enough to avoid scale effects, because it satisfies the minimum Reynolds and Weber criteria. Within the section experiments are summarized the values of the Froude, Reynolds and Weber numbers.

2.2. Instrumentation

During the investigation, measurements of air concentration have been performed by means of a double-tip conductivity probe. Conductivity probes have been used since the 1960s for different measurement applications such as the detection of air concentration [19,59,60] and velocity measurements in two-phase flows [61]. Moreover, the probes have been perfected and used in a number of investigations. At present, it is feasible to use them to measure, air content, bubble velocity, distribution of the number of bubbles, bubble count rate, air/water chord size, particle size distributions, interfacial velocity, turbulent intensity, air–water turbulent time, specific interface area, distributions of chord length, concentration of the interfacial area and bubble size [62,63,64]. In some cases, it is also possible to estimate the bubble velocity in two [65] and three directions [66].
The double-tip conductivity probe used during the investigation was equipped with two identical conductivity sensors or tips with an inner diameter of 0.8 mm and installed inside a cylindrical stainless-steel body that facilitates measurements as it provides rigidity to the instrument. The probe produces two voltage signals, one for each sensor. The signals will indicate whether the tips pierce air bubbles are at contact with water, due to the difference in electrical conductivity between water (5 mS/m) and air (almost zero). The advantage of using this measuring device lies in the ease of repair in case of failure, since the parts are readily available and the electronic component cost and the costs for the manufacture are low. This speeds up repairs while at the same time provides reliable data for evaluating air content. The probe is shown in Figure 4.
The measuring device generates an alternating current signal with low distortion and constant amplitude through an electronic circuit. A generator was connected to an operational amplifier to raise the value of the voltage; likewise, the signal is isolated by placing transformers, which are connected to the sensor receptors and through a resistor installed at each end. The probe voltage output passes through a rectifier that is later captured by a converter that sends the digital signal to a computer for post processing. The data acquisition card used allows the capture of up to 40,000 samples per second, this frequency is divided by the number of sensors installed. The reader interested in the working principles of conductivity probes is referred to Chanson and Carosi [63].
The staff of the Department of Electrical and Electronics Engineering of the Institute of Engineering constructed the conductivity probe and conducted preliminary air concentration measurements to verify its accuracy. They mounted the probe inside a test rig with the needles parallel to the flow direction pointing downward. The measuring section was a vertical circular tube made of acrylic with an inner diameter of 10 cm and length of 2 m. Clear water was used as working fluid that circulates upwards moved by a centrifugal pump, by means of a compressor air was injected to produce a vertical concurrent bubbly flow. The probe was displaced from the wall to the center of the pipe at five axial locations to register air concentration at different points. It was found that the accuracy of the probe in detecting air concentrations was about ±5%.
The flow depths were measured perpendicular to the spillway bottom, by using an acoustic metallic sensor ±0.1 mm precise, once the point of the sensor was in contact with the water surface, the electronic sound system emitted a whistle and then the measurement was taken.
The spillway discharge was measured in two ways: (1) Ultrasonic flowmeters PrimeFlo-T, Model RXG 845 with an accuracy of ±0.5% were installed on the discharge piping of the pumps. (2) A digital water level sensor (accuracy ±0.05%, operating range: from 1.0 m to 30.0 m) was located upstream of the spillway crest in the tank. The measured water levels together with the equation proposed by the USBR [52] to obtain the water discharge over an ogee crest were used to calculate the discharge. The difference between the two methods used to measure the discharge flow was around 3%.

2.3. Experiments

The physical model was used to register bottom air concentration data with and without crest pier. The main interest is in the air close to the floor of the spillway chute, where cavitation damage is a concern. In the chute of the physical model, the air concentration measurements were made at eight different cross-sections (1 to 8), 13 cm upstream of the aerator and at locations 15 cm, 45 cm, 80 cm, 120 cm, 160 cm, 200 cm and 240 cm downstream of the aerator, respectively. At each cross-section, the air content was registered at five equidistant points (A to E) located between each other at a distance of 28.5 cm. The air concentration was taken 3 mm above the spillway bottom. The measuring sections are shown in Figure 5.
The tests were performed with flow rates of 500 L/s, 1000 L/s and 1500 L/s, corresponding to 1010 m3/s, 2020 m3/s and 3030 m3/s in the prototype. The sampling rate of the data acquisition was set at 20 kHz per channel and the total sampling time was 40 s. Further, in order to corroborate that the scale effects were not substantial in the physical model, the approach flow Froude number Fo = vo/(gLref)0.5, the approach flow Reynolds number Ro = (voLref)/ν and the approach flow Weber number Wo = vo/(σ/ρ Lref)0.5, with Lref = ho for each test were obtained, where Lref is the reference length, ho is the approach flow depth, vo is the approach flow velocity, ν = 1.0 × 10⁻⁶ (m2/s) is the kinematic viscosity of water, σ = 0.00739 (kg/m) is the surface tension of water and ρ = 101.97 (kg·s2·m4) is the density of water. It is important to highlight that the approach flow depths were practically the same for each water discharge for both model configurations. These flow depths were measured at a distance of 2.4 m from the vertical upstream face of the crest, that is at the tail part of the pier. The values of the dimensionless numbers obtained for each test confirms that scale effects can be negligible in the physical model (Table 1).

2.4. Experimental Observations

Figure 6 shows a series of photographs to illustrate the flow pattern for the two investigated configurations. For the configuration 1, the standing wave or rooster tail develops directly downstream of the pier and the shock waves travel laterally reaching the chute sidewalls only for the water discharges of 1000 L/s and 1500 L/s. The angle between the shock waves has a slightly increase as the flow rate increases. Likewise, it can be seen an enhancement of the length, width and height of the standing wave with increasing discharge. In the case of the shock waves, they grow in width and height and their length remains practically constant. Further, in Figure 6a–f, it can be observed the air entrained by the chute aerator, as well as the standing waves on the sidewalls due to the upper jet nappe impinging on the low part of the aeration ducts.
It was noticed for the two configurations and all flow rates tested that a region of clear water was observed where the water enters the spillway. For the tests with no pier the free water surface is smooth and glassy upstream of the aerator and immediately downstream of the aerator the water suddenly takes on a milky appearance due to the air entrainment. Likewise, the air is distributed uniformly over the entire spillway width with minimum interference to the water flow through the chute. Conversely, when employing the pier, it introduces turbulence at the overflow crest. A turbulent boundary develops as the flow passes over the pier, Figure 6a–c clearly shows the separation point and the flow separation that form in a symmetrical fashion, as well as the longitudinal vortices downstream of the crest pier.

3. Results and Discussion

The results obtained during the present study are discussed within this section with regard to the stated objective of the investigation, which was to analyze the combined effect on air entrainment of a crest pier and an aerator on the bottom of a smooth spillway.
Figure 7 shows the measured bottom air concentration across the chute width at sections 1 to 8 for the two model configurations and all the tested discharges. The configuration 1 results show that the air concentration is slightly higher at section 1. The average air concentration for the water discharges of 500 L/s, 1000 L/s and 1500 L/s was 0.333%, 0.315% and 0.298%, while the average air concentration in model configuration 2 was 0.283%, 0.267% and 0.283% for the same discharges. The growth in concentration is due to the early onset of air entrainment into the flow by the standing wave and the longitudinal vortices generated by the crest pier. This phenomenon has also been observed for stepped spillways [40,41].
In the same way, for all the tests in both model configurations the high bottom air concentration at section 2 is due to the large amount of air entering into the flow through the lower jet in the cavity zone. The measured air concentrations ranging from 49.42% to 99.95%. It is worth noting that only part of this air is being entrained into the flow, because of the bottom rollers at the downstream end of the cavity zone trap an important portion of the air [67,68]. Further, from all the graphs, it can be seen that bottom air concentration diminishes with distance. A massive air detrainment is observed between sections 2 and 3. Note that for the three water discharges and both model configurations the average air concentration decreases significantly at section 3, ranging from 3.10% to 23.52%. The significant air concentration decrease can be associated with jet nappe impact on the spillway bottom.
In addition, the data registered at sections 4 to 8 show that the low bottom concentrations prevail further downstream. Likewise, for all the tests carried out in model configuration 1 the bottom air concentration is maintained almost constant at sections 4 to 8 with averaged values of about 1%. It might be explained by the fact that by the implementation of the pier at the crest of the spillway the turbulence intensity was increased, generating intense collisions, deformations and the collapse of the air bubbles. The result is the delayed in the rise of the bubbles that remain more time in the flow, as described previously by Volkart [69]. Conversely, in the case of model configuration 2 the bottom air concentration decreases with the distance.
From the results, it can be seen that the implementation of the pier, increased the bottom air concentration due to this structure induces artificial aeration into the flow along the spillway. Likewise, it is important to highlight that configuration 1 results show that the air concentration distribution on the spillway bottom across the width of the chute is non-uniform (Figure 7a–c). The pattern of air concentration along the spillway was similar for the three tested discharges. On the contrary, the results recorded during the configuration 2 tests show that the bottom air concentration is distributed uniformly over the entire chute width with minimum interference to the water flow across the chute cross-section (Figure 7d–f), as described previously by different researchers [17,18,29,70].
It is believed that the non-uniformity pattern of the bottom air concentration downstream of the pier and the aerator is created by the turbulent effects within the flow due to the presence of the longitudinal vortices, standing and shock waves that entrain air into the flow at the surface along its path. From the results in Figure 7a–c, it can be observed that the center of the spillway bottom was not aerated to the same percentage as were the spillway bottom sides, which was expected since the shock waves travel laterally as they move downstream. Likewise, it is important to highlight that during all the experiments developed in model configuration 1, it was observed for the three water discharges that the length, width and height of longitudinal vortices, standing and shock waves experienced small variations, resulting either in an increase or decrease in air entrainment. It might be another reason why the bottom air concentration was not symmetrically distributed across the chute width.
Figure 8 shows the development of the bottom air concentration of model configuration 1 for the test runs performed with the three flow rates, at the eight measuring sections considered previously. The air concentration values at the spillway floor were obtained by averaging measurements registered at the bottom, at the chute width at the five equidistant points (A to E) located between each other at a distance of 28.5 cm. Likewise, these values are compared with those obtained in model configuration 2.
The graphs indicate that bottom air concentration varied in a continuous fashion along the spillway length. Although the distribution of air concentration follows a trend similar, the data obtained during the tests in model configuration 1 show a greater overall aeration in comparison with the results achieved with model configuration 2, which is more evident at measuring sections downstream of the aerator for all water discharges. Further, it can be seen that as the water discharge and the flow depth increase a smaller percentage of air reached the spillway floor.
Figure 9, Figure 10 and Figure 11 show the bottom air concentration presented as contour plots, the transitions between the colors can be interpreted as equal air concentration lines. The color scale for the air concentration contour plots are indicated by the color legend with the boundary between white (100% of air) and black (0.1% of air). The contour plots were obtained by interpolating linearly the air concentration values registered 3 mm above the spillway floor across the width of the seven measuring sections downstream of the aerator.
The contour plots for the tests developed in the model configuration 1 clearly show areas with increased air concentration in comparison with the contour plots of model configuration 2. In the same way, the contour plots for the tests carried out in the spillway with no pier show a uniform distribution of the bottom air concentration across the chute width and length. In the case of the bottom air concentration contour plots obtained in both configurations for the water discharge of 500 L/s, illustrate a similar performance. On the other hand, the contour plots achieved with the data registered in the spillway model with pier and operating at the water discharges of 1000 L/s and 1500 L/s, show that the bottom air concentration across the chute width were not uniform, especially at the last 4 sections.
The air concentration results for configuration 1 with the water discharge of 500 L/s indicated a region that covers from sections 5 to 8 with a bottom air concentration distribution of about 2% (Figure 9b), while the contour plot for configuration 2 shows that air concentration decreases with distance (Figure 9a).
The air concentration contour plots for configuration 1 with the water discharges of 1000 L/s and 1500 L/s show regions between sections 5 and 8 with less air concentration at the center of the chute bottom than at its sides (Figure 10b and Figure 11b). It is believed that this pattern of air concentration occurs due to the shock waves entrain air into the flow at the surface as these travel laterally during its movement in the downstream direction.
From the above results, it is observed that the bottom air concentrations downstream of chute aerator in the spillway model with no pier can be considered sufficient to protect the chute surface against cavitation damage, since the measured air concentrations during the present investigation are into the range of the amount of air needed for cavitation protection, proposed by previous researchers [10,11,12,13,14]. This is further reinforced by Kramer [71] statement, who corroborated that a small percentage of air distributed as small bubbles next to the spillway invert is sufficient to protect a concrete surface.
On the other hand, from the results obtained with model configuration 1, it can be seen that the pier located at the spillway crest generated an increase in the bottom air concentration along the chute bottom in comparison to the results obtained with model configuration 2. Further, although the bottom air concentration across the width and length of the chute is non-uniform, it has the capacity of reducing even more the risk of cavitation damage and enhancing the safety of the hydraulic structure.
From the present investigation and the studies presented by Calitz [40] and Koen [41], it can be stated that crest piers can help in either eliminating or reducing the risk of cavitation damage in smooth and steeped spillways. The crest piers induce artificial aeration by the formation of longitudinal vortex, standing and shock waves that introduce a greater percentage of air on the spillway bottom, when compared to the spillway without pier. However, some investigations show that standing waves can produce adverse consequences. For instance, overtopping in the surface spillway, strike the spillway sidewalls that might lead to a reduced support and induce vibrations in the structures [72,73]. Under these circumstances, such waves should be subsided or eliminated to save cost and avoid potential catastrophic hazard.
It is worth mentioning that the main interest during this investigation was to study the combined effect on air entrainment of a crest pier and an aerator on a smooth spillway, since the bottom air concentration at the spillway floor is the most significant parameter for cavitation protection. Note that for this investigation, the hydraulic and geometric characteristics of the standing and shock waves were not evaluated in any further detail, as these factors did not form part of the study objective.

4. Conclusions

A physical spillway model in scale 1:21 that satisfies the Reynolds and Weber criteria was used to investigate the combined effect on air entrainment of a crest pier and an aerator on the bottom of a smooth spillway. For comparison, experimental test runs were carried out in the spillway without pier, that is in presence of aerator only.
The results show that the bottom air concentration increase at the chute spillway due to the implementation of the crest pier. From all the tests with model configuration 1, it can be observed that the standing wave and the longitudinal vortices generated an early onset of air entrainment into the flow. Likewise, configuration 1 results show that the air concentration distribution on the spillway bottom across the width and length of the chute is non-uniform. It is believed that the air entrained by shock waves produces the non-uniformity pattern of the bottom air concentration downstream of the aerator, since these waves introduce a greater percentage of air on the spillway sides than on its center. Further, even though the bottom air concentration along the spillway with pier is non-uniform, it has the capacity of reducing even more the risk of cavitation damage and enhancing the safety of the hydraulic structure. Therefore, it can be stated that for this particular spillway model the pier located at the spillway crest has an overall beneficial effect on the chute bottom by entraining a higher percentage of air. In addition, for model configuration 1, it was found that the bottom air concentration remains almost constant at the width of the chute at the measuring sections farther from the aerator.
During this investigation, it was found that by means of introducing a pier at the crest of a spillway, the bottom air concentration could be increased along the spillway chute, this will help in either eliminating or reducing the risk of cavitation damage in spillways. Conversely, standing waves generated by crest piers could be detrimental. Therefore, for a particular spillway design, it is recommended to develop a detailed and rigorous experimental investigation in order to analyze the effects of standing and shock waves in presence of crest piers.

Author Contributions

J.C.L.-B., O.P.-E., V.M.O.-M. and J.G.-S. analyzed, discussed and interpreted the results; J.C.L.-B. and O.P.-E. wrote the paper. V.M.O.-M. and J.G.-S. reviewed the manuscript.

Funding

This research received no external funding.

Conflicts of Interest

The authors declare no conflict of interest.

References

  1. Chen, S.H. Hydraulic Structures, 1st ed.; Springer: Berlin/Heidelberg, Germany, 2015. [Google Scholar]
  2. May, R.W.P. Cavitation in Hydraulic Structures: Occurrence and Prevention; Report SR 79; Hydraulics Research Limited: Wallingford, UK, 1987. [Google Scholar]
  3. Kells, J.A.; Smith, C.D. Reduction of cavitation on spillways by induced air entrainment. Can. J. Civ. Eng. 1991, 18, 358–377. [Google Scholar] [CrossRef]
  4. Chanson, H. Air Bubble Entrainment in Free-Surface Turbulent Shear Flows; Academic Press: London, UK, 1996. [Google Scholar]
  5. Pettersson, K. Design of Aerators for Prevention of Cavitation—The Höljes Dam. Master’s Thesis, Royal Institute of Technology, Stockholm, Sweden, 2012. [Google Scholar]
  6. DeFazio, F.G.; Wei, C.Y. Design of aeration devices on hydraulic structures. In Frontiers in Hydraulic Engineering; Shen, H.T., Ed.; ASCE: New York, NY, USA, 1983; pp. 426–431. [Google Scholar]
  7. Chanson, H. Aeration and deaeration at bottom aeration devices on spillways. Can. J. Civ. Eng. 1994, 21, 404–409. [Google Scholar] [CrossRef] [Green Version]
  8. Bradley, J.N. Study of Air Injection into the Flow in the Boulder Dam Spillway Tunnels—Boulder Canyon Project; Report HYD-186; Bureau of Reclamation: Denver, CO, USA, 1945. [Google Scholar]
  9. Warnock, J.E. Cavitation in hydraulic structures: Experiences of the Bureau of Reclamation. Trans. Am. Soc. Civ. Eng. 1947, 112, 43–58. [Google Scholar]
  10. Peterka, A.J. The Effect of Entrained Air on Cavitation Pitting. In Proceedings Minnesota International Hydraulic Convention; ASCE: Minneapolis, MN, USA, 1953. [Google Scholar]
  11. Rasmussen, R.E.H. Some Experiments on Cavitation Erosion in Water Mixed with Air; Symposium on Cavitation in Hydrodynamics; National Physical Laboratory: London, UK, 1956. [Google Scholar]
  12. Semenkov, V.M.; Lentiaev, L.D. Spillway with Nappe Aeration. Hydrotech. Construct. 1973, 7, 436–441. [Google Scholar] [CrossRef]
  13. Pylaev, N.I. Investigation into the Effectiveness of Air Admission as a Means to Reduce Cavitation-Erosion. Energomasinostroenie (7); Springer: Moscow, Russia, 1973. [Google Scholar]
  14. Russell, S.O.; Sheehan, G.J. Effect of entrained air on cavitation damage. Can. J. Civ. Eng. 1974, 1, 97–107. [Google Scholar] [CrossRef]
  15. De Pinto, N.L.S.; Neidert, S.H.; Ota, J.J. Aeration at High Velocity Flows. Water Power Dam Constr. 1982, 34, 34–38. [Google Scholar]
  16. Chanson, H. Study of Air Entrainment and Aeration Devices on Spillway Model; Report 88-8; University of Canterbury: Christchurch, New Zealand, 1988. [Google Scholar]
  17. Chanson, H. Study of air entrainment and aeration devices. J. Hydraul. Res. 1989, 27, 301–319. [Google Scholar] [CrossRef] [Green Version]
  18. Chanson, H. Flow downstream of an aerator—Aerator spacing. J. Hydraul. Res. 1989, 27, 519–536. [Google Scholar] [CrossRef]
  19. Chanson, H. Study of air demand on spillway aerator. J. Fluid Eng. 1990, 112, 343–350. [Google Scholar] [CrossRef]
  20. Rutschmann, P.; Hager, W.H. Air entrainment by spillway aerators. J. Hydraul. Eng. 1990, 116, 765–781. [Google Scholar] [CrossRef]
  21. Hager, W.H. Uniform aerated chute flow. J. Hydraul. Eng. 1991, 117, 528–533. [Google Scholar] [CrossRef]
  22. Ervine, D.A.; Falvey, H.T.; Kahn, A.R. Turbulent Flow Structure and Air Uptake at Aerators. Hydropower Dams 1995, 2, 89–96. [Google Scholar]
  23. Chanson, H.; Toombes, L. Air-water flows down stepped chutes: Turbulence and flow structure observations. Int. J. Multiphase Flow 2002, 28, 1737–1761. [Google Scholar] [CrossRef]
  24. Oskolkov, A.G.; Semenkov, V.M. Experience in Designing and Maintenance of Spillway Structures on Large Rivers in the USSR. Presented at the 13 ICOLD Congress, New Delhi, India, 20 October 1979. [Google Scholar]
  25. Vischer, D.L.; Volkart, P.; Siegenthaler, A. Hydraulic Modelling of Air Slots in Open Chute Spillways. In Paper Presented at the International Conference on Hydraulic Modelling of Civil Engineering Structures, Coventry, UK, September 1982; BHRA Fluid Engineering: Reading, UK, 1982. [Google Scholar]
  26. Volkart, P.; Chervet, A. Air Slots for Flow Aeration; Versuchsanstalt für Wasserbau, Hydrologie und Glaziologie; ETH Zürich: Zürich, Switzerland, 1983. [Google Scholar]
  27. Pan, S.; Shao, Y. Scale Effects in Modelling Air Demand by a Ramp Slot. Symposium on Scale Effects in Modelling Hydraulic Structures. Presented at the IAHR Symposium on Scale Effects in Modelling Hydraulic Structures, Esslingen am Neckar, Germany, 3–6 September 1984. [Google Scholar]
  28. Peng, T.T.; Wood, I.R. Model Studies of Aerators on Spillways; Research Report 84-6; University of Canterbury: Christchurch, New Zealand, 1984. [Google Scholar]
  29. Volkart, P.; Rutschmann, P. Air Entrainment Devices (Air Slots). Mitteilung 72, Versuchsanstalt für Wasserbau, Hydrologie und Glaziologie; ETH Zürich: Zürich, Switzerland, 1984. [Google Scholar]
  30. Pinto, D.S.N.L. Model Evaluation of Aerators in Shooting Flow. Symposium on Scale Effects in Modelling Hydraulic Structures. Presented at the IAHR Symposium on Scale Effects in Modelling Hydraulic Structures, Esslingen am Neckar, Germany, 3–6 September 1984. [Google Scholar]
  31. Seng, L.H.; Wood, I.R. Model Studies of Clyde Dam Spillway Aerators; Report 86-6; University of Canterbury: Christchurch, New Zealand, 1986. [Google Scholar]
  32. Koschitzky, H.-P. Dimensionierungskonzept für Sohlenbelüfter in Schussrinnen zur Vermeidung von Kavitationsschäden. Mitteilung 65; Institut für Wasserbau, Technische Universität: Stuttgart, Germany, 1987. [Google Scholar]
  33. Frizell, K.W. Chute Spillway Aerators—McPhee Dam Model/Prototype Comparison; Model-Prototype Correlation of Hydraulic Structures, Colorado Springs: Colorado, CO, USA, 1988. [Google Scholar]
  34. Rutschmann, P. Belüftungseinbauten in Schussrinnen. VAW Mitteilung 97, Versuchsanstalt für Wasserbau, Hydrologie und Glaziologie; ETH: Zürich, Germany, 1988. [Google Scholar]
  35. Pinto, D.S.N.L. Prototype Aerator Measurements. IAHR Hydraulic Structures Design Manual 4, Air Entrainment in Free-Surface Flows 115–130; Balkema: Rotterdam, The Netherlands, 1991. [Google Scholar]
  36. Balaguer, G. Sohlenbelüfter in Schussrinnen Ergänzende Untersuchungen zur Bemessung. Institut für Wasserbau und Kulturtechnik; Universität Fridericiana: Karlsruhe, Germany, 1993. [Google Scholar]
  37. Skripalle, J. Zwangsbelüftung von Hochgeschwindigkeitsströmung an Zurückspringenden Stufen im Wasserbau, Mitteilung 124. Institut für Wasserbau und Wasserwirtschaft; Technische Universität: Berlin, Germany, 1994. [Google Scholar]
  38. Kökpinar, M.A. Air-Entrainment in High Speed Free Surface Flows. Ph.D. Thesis, Middle East Technical University, Ankara, Turkey, 1996. [Google Scholar]
  39. Gaskin, S.; Aubel, T.; Holder, G. Air Demand for a Ramp-Offset Aerator as a Function of Spillway Slope, Ramp Angle and Froude Number. Presented at the 30 IAHR Congress, Thessaloniki, Greece, 24–29 August 2003. [Google Scholar]
  40. Calitz, J.A. Investigation of Air Concentration and Pressures of a Stepped Spillway Equipped with a Crest Pier. Master’s Thesis, Stellenbosch University, Stellenbosch, South Africa, 2015. [Google Scholar]
  41. Koen, J. Artificial Aeration on Stepped Spillways with Piers and Flares to Mitigate Cavitation Damage. Master’s Thesis, Stellenbosch University, Stellenbosch, South Africa, 2017. [Google Scholar]
  42. Reinauer, R.; Hager, W.H. Supercritical flow behind chute piers. J. Hydraul. Eng. 1994, 120, 1292–1308. [Google Scholar] [CrossRef]
  43. Khatsuria, R.M. Hydraulics of Spillways and Energy Dissipators; Marcel Dekker: New York, NY, USA, 2005. [Google Scholar]
  44. Koch, H.J. Schussstrahlzusammenfuehrung bei Einem Grundablass Mit Nebeneinanderliegenden Segmentschuetzen. Wasserwirtschaft; Springer: Stuttgart, Germany, 1982. [Google Scholar]
  45. Slopek, R.J.; Nunn, J.O.H. Freeboard Allowances for Chute Spillways; American Society of Civil Engineers: Niagara Falls, NY, USA, 1989. [Google Scholar]
  46. Reinauer, R.; Hager, W.H. Shockwave in air-water flows. Int. J. Multiphase Flow 1996, 22, 1255–1263. [Google Scholar] [CrossRef]
  47. Reinauer, R.; Hager, W.H. Pier waves in sloping chutes. Int. J. Hydropower Dams 1997, 4, 100–103. [Google Scholar]
  48. Vischer, D.L.; Hager, W.H. Dam Hydraulics; Wiley: Chichester, UK, 1998. [Google Scholar]
  49. Carnacina, I.; Mahmoudi-Kurdistani, S.; Palermo, M.; Pagliara, S. El Chaparral Dam Model: Rooster Tail Formation on High Sloped Spillway; University of Queensland: Brisbane, Australia, 2010. [Google Scholar]
  50. Pagliara, S.; Mahmoudi, M.S.; Roshni, T. Rooster tail wave hydraulics of chutes. J. Hydraul. Eng. 2011, 137, 1085–1088. [Google Scholar] [CrossRef]
  51. Pagliara, S.; Kurdistani, S.M.; Palermo, M. Effects of Vertical Deflectors on Rooster Tail Geometry. In Proceedings of the 2nd IAHR European Congress, Munich, Germany, 27–29 June 2012. [Google Scholar]
  52. United States Bureau of Reclamation (USBR). Design of Small Dams; U.S. Department of the Interior, Bureau of Reclamation: Denver, CO, USA, 1987.
  53. Falvey, H.T. Cavitation in Chutes and Spillways; U.S. Department of the Interior, Bureau of Reclamation: Denver, CO, USA, 1990.
  54. Pfister, M.; Hager, W.H. History and significance of the Morton number in hydraulic engineering. J. Hydraul. Eng. 2014, 140, 02514001. [Google Scholar] [CrossRef]
  55. Ervine, D.A.; Falvey, H.T. Behavior of turbulent water jets in the atmosphere and in plunge pools. Proc. Inst. Civ. Eng. 1987, 83, 295–314. [Google Scholar]
  56. Chanson, H. Turbulent air-water flows in hydraulic structures: Dynamic similarity and scale effects. Environ. Fluid Mech. 2009, 9, 125–142. [Google Scholar] [CrossRef] [Green Version]
  57. Pfister, M.; Chanson, H. Scale effects in physical hydraulic engineering models. Discussion. J. Hydraul. Res. 2012, 50, 244–246. [Google Scholar] [CrossRef]
  58. Pfister, M.; Hager, W.H. Chute aerators. I: Air transport characteristics. J. Hydraul. Eng. 2010, 136, 352–359. [Google Scholar] [CrossRef]
  59. Cain, P.; Wood, I.R. Instrumentation for aerated flow on spillways. J. Hydraul. Div. 1981, 107, 1407–1424. [Google Scholar]
  60. Chanson, H. A Study of Air Entrainment and Aeration Devices on a Spillway Model. Ph.D. Thesis, University of Canterbury, Christchurch, New Zealand, 1988. [Google Scholar]
  61. Matos, J.; Frizell, K.H.; André, S.; Frizell, K.W. On the Performance of Velocity Measurement Techniques in Air-Water Flows. Presented at the Hydraulic Measurements and Experimental Methods Specialty Conference (HMEM), Estes Park, CO, USA, 28 July–1 August 2002. [Google Scholar]
  62. Chanson, H. Air-water flow measurements with intrusive, phase-detection probes: Can we improve their interpretation? J. Hydraul. Eng. 2002, 128, 252–255. [Google Scholar] [CrossRef]
  63. Chanson, H.; Carosi, G. Advanced post-processing and correlation analyses in high-velocity air–water flows. Environ. Fluid Mech. 2007, 7, 495–508. [Google Scholar] [CrossRef] [Green Version]
  64. Chanson, H. Hydraulics of aerated flows: Qui pro quo? J. Hydraul. Res. 2013, 51, 223–243. [Google Scholar] [CrossRef]
  65. Yang, R.; Zheng, R.; Zhou, F.; Liu, R. Measurement of Two-Dimensional Bubble Velocity by Using Tri-Fiber-Optical Probe. In Proceedings of the 6th International Symposium on Measurement Techniques for Multiphase Flows, Okinawa, Japan, 15–17 December 2008. [Google Scholar]
  66. Shen, X.; Saito, Y.; Mishima, K.; Nakamura, H. Methodological improvement of an intrusive for-sensor probe for the multi-dimensional two-phase flow measurement. Int. J. Multiphase Flow 2005, 31, 593–617. [Google Scholar] [CrossRef]
  67. Bai, R.; Zhang, F.; Liu, S.; Wang, W. Air concentration and bubble characteristics downstream of a chute aerator. Int. J. Multiphase Flow 2016, 87, 156–166. [Google Scholar] [CrossRef]
  68. Wargsjö, E.; Hedehag Damberg, A. Experimental Investigation of the Air-Water Flow Properties in the Cavity Zone Downstream a Chute Aerator. Master’s Thesis, Uppsala University, Uppsala, Sweden, 2017. [Google Scholar]
  69. Volkart, P. Transition from aerated supercritical to subcritical flow and associated bubble de-aeration. Presented at the 21 IAHR Congress, Melbourne, Australia, 19–23 August 1985. [Google Scholar]
  70. Hager, W.H. Spillways-Shockwaves and Air Entrainment: Review and Recommendations. Subcommittee No. 4 of the Committee on Hydraulics for Dams; Bulletin 81; Commission Internationale des Grands Barrages: Paris, France, 1992. [Google Scholar]
  71. Kramer, K. Development of Aerated Chute Flow. Ph.D. Thesis, ETH Zurich, Zürich, Switzerland, 2004. [Google Scholar]
  72. Wu, J.H.; Cai, C.G.; Ji, W.; Ruan, S.P.; Luo, C. Experimental study on cavitation and water-wing for middle-piers of discharge tunnels. J. Hydrodyn. Ser. B 2005, 17, 429–437. [Google Scholar]
  73. Sheng, C.; Jian, Z.; Ming, H.; Hazrati, A. Experimental study on water wing characteristics induced by piers in flood drainage culverts. Sci. Iran. Trans. A Civ. Eng. 2013, 20, 1320–1326. [Google Scholar]
Figure 1. Standing and shock waves.
Water 10 01383 g001
Figure 2. Physical model of the Huites Dam spillway.
Water 10 01383 g002
Figure 3. Geometry of the spillway aeration system with model dimensions.
Water 10 01383 g003
Figure 4. Double-tip conductivity probe.
Water 10 01383 g004
Figure 5. Measuring sections.
Water 10 01383 g005
Figure 6. Flow patterns for both configurations with the three tested water discharges: (a) 500 L/s with pier, (b) 1000 L/s with pier, (c) 1500 L/s with pier, (d) 500 L/s without pier, (e) 1000 L/s without pier, (f) 1500 L/s without pier.
Water 10 01383 g006
Figure 7. Bottom air concentration across the chute width at the eight sections, (a) 500 L/s with pier, (b) 1000 L/s with pier, (c) 1500 L/s with pier, (d) 500 L/s without pier, (e) 1000 L/s without pier, (f) 1500 L/s without pier.
Water 10 01383 g007
Figure 8. Longitudinal variations of air concentration at the spillway bottom for both model configurations: (a) 500 L/s, (b) 1000 L/s, (c) 1500 L/s.
Water 10 01383 g008
Figure 9. Bottom air concentration distribution for Q = 500 L/s (a) spillway without pier, (b) spillway with pier.
Water 10 01383 g009
Figure 10. Bottom air concentration distribution for Q = 1000 L/s (a) spillway without pier, (b) spillway with pier.
Water 10 01383 g010
Figure 11. Bottom air concentration distribution for Q = 1500 L/s (a) spillway without pier, (b) spillway with pier.
Water 10 01383 g011
Table 1. Hydraulic conditions and dimensionless numbers.
Discharge (L/s)ho (m)vo (m/s)FoRoWo
5000.0426.9610.842.92 × 105167.55
10000.0866.807.415.85 × 105234.25
15000.1286.856.118.77 × 105287.88

