Article

A Feasible Data-Driven Mining System to Optimize Wastewater Treatment Process Design and Operation

1
State Key Joint Laboratory of Environment Simulation and Pollution Control, School of Environment, Tsinghua University, Beijing 100084, China
2
School of Environmental and Civil Engineering, Jiangnan University, Wuxi City 214122, China
*
Authors to whom correspondence should be addressed.
Water 2018, 10(10), 1342; https://doi.org/10.3390/w10101342
Submission received: 5 September 2018 / Revised: 23 September 2018 / Accepted: 24 September 2018 / Published: 28 September 2018
(This article belongs to the Section Wastewater Treatment and Reuse)

Abstract

:
Achieving low costs and high efficiency in wastewater treatment plants (WWTPs) is a common challenge in developing countries, although many optimizing tools on process design and operation have been well established. A data-driven optimal strategy without the prerequisite of expensive instruments and skilled engineers is thus attractive in practice. In this study, a data mining system was implemented to optimize the process design and operation in WWTPs in China, following an integral procedure including data collection and cleaning, data warehouse, data mining, and web user interface. A data warehouse was demonstrated and analyzed using one-year process data in 30 WWTPs in China. Six sludge removal loading rates on water quality indices, such as chemical oxygen demand (COD), total nitrogen (TN), and total phosphorous (TP), were calculated as derived parameters and organized into fact sheets. A searching algorithm was programmed to find out the five records most similar to the target scenario. A web interface was developed for users to input scenarios, view outputs, and update the database. Two case WWTPs were investigated to verify the data mining system. The results indicated that effluent quality of Case-1 WWTP was improved to meet the discharging criteria through optimal operations, and the process design of Case-2 WWTP could be refined in a feedback loop. A discussion on the gaps, potential, and challenges of data mining in practice was provided. The data mining system in this study is a good candidate for engineers to understand and control their processes in WWTPs.

Graphical Abstract

1. Introduction

The wastewater collection and treatment in China have been dramatically developed since 2005, resulting in 54 billion tons of wastewater per year treated by over 3500 municipal wastewater treatment plants (WWTPs) in 2013 [1,2]. As the consequence of the increasing construction of WWTPs, a number of experienced engineers are required to operate the facilities effectively and safely. Meanwhile, the discharging criteria of WWTPs are tightened for stepwise objectives to protect the surface water quality in China [1,2,3]. Thus, process upgrading was stimulated to reserve more redundancy via longer retention time and larger volume of tanks than the necessity. The complicated process and unsatisfied operation triggered the significant increase of energy use in wastewater treatment facilities. Although the average energy intensity of the WWTPs in 2009 was as low as 0.254 kWh∙m−3 [2], two-thirds of the WWTPs were in capacities of 1 × 10⁴−5 × 10⁴ m3∙d−1 with electricity consumption in the range of 0.06−1.42 kWh∙m−3 [1]. Moreover, the energy based on chemical oxygen demand (COD) removal was 1.15 ± 1.00 kWh∙kgCOD−1 in 157 cities of China [4]. Thus, to improve the process design and operation in WWTPs is still a serious challenge in China.
To deal with above challenges with limited human and capital resources in the low-income countries, a good solution is to transfer matured techniques from the scientific community to engineering practice, for example, the techniques of instrumentation, control, and automation (ICA), which had been well-established in the last century [5,6]. However, the attempts to apply ICA in WWTPs in China had encountered many challenges, for example, high investment but low maintenance of instruments, lack of skilled operators with ICA knowledge, conflicts between designers and operators, and so on. Currently, most of the central control systems in WWTPs in China are only capable of acquiring data rather than taking actions in the process [3]. Without necessary experience and sufficient technical supports, operators in WWTPs may often lose their trust on ICA system when failure responses appeared, for example, fault signals of instruments without regular maintenance. This critical situation requests more feasible methods to restore the engineers’ trust by involving them in the technical development, rather than offering them a sound solution to plug and play.
Data mining, usually as the core component of a data-driven decision support system, follows the concept of knowledge discovery in databases and has gained increasing interest in optimizing WWTP processes [7]. Data mining contains a series of technologies to extract useful information from a large database or data warehouse to figure out hidden correlations and possible rules [7]. The data mining procedure is highly affiliated with engineers’ operations and habits; thus, both scientists and engineers could share their interests on such a kind of optimizing tool. Data-driven models can support and deepen our understandings of process operations via various mathematical and empirical tools, including artificial intelligence, machine learning, induction learning, and statistical analysis [8,9]. Even using a very simple type of data mining, such as statistical analysis, could be effective to solve painful problems in practice [10].
Data mining in WWTPs has been intensively explored in the past, including pumping station control [11,12,13,14], aeration control [15,16,17], anaerobic digester operation [18,19,20], plant-wide process operation [20,21,22], and effluent water quality prediction [23,24,25]. The data-driven model is free of mechanism and lack of general descriptions of the process dynamics; thus, integrating data mining techniques with mathematic models and the expert systems has become a reasonable choice [26,27,28]. However, although scientific research provided sufficient powerful tools, process operators and managers hesitated to use the tools in their daily operations. As pointed out by a critic review of knowledge-based systems in WWTPs, currently matured and productive data-driven techniques are still limited in simple and classic models [28]. Thus, developing a simple and effective data mining system to satisfy the demands from process engineers is quite necessary to apply such a state-of-art scientific tool to deal with more critical and challenging process operations in WWTPs than ever.
In this study, a data mining system was implemented to optimize the process design and operation of WWTPs in China. In order to develop a feasible data mining system under current constraints, the following two features of the system were focused on: a simple and effective algorithm that is capable of running on the database from small scales to big data platforms; and a friendly web user interface (UI) for users to operate, maintain, and update the data warehouse online. An integral procedure of data mining was proposed for implementation, including data collection and cleaning, data warehouse, data mining, and web UI. A data warehouse was demonstrated on the one-year process data in 30 WWTPs. The performance of data mining was verified in two case WWTPs, in which the effluent water quality and process design were improved. Lastly, the gaps, potentials, and challenges of data mining system in practice were briefly discussed.

2. Methods

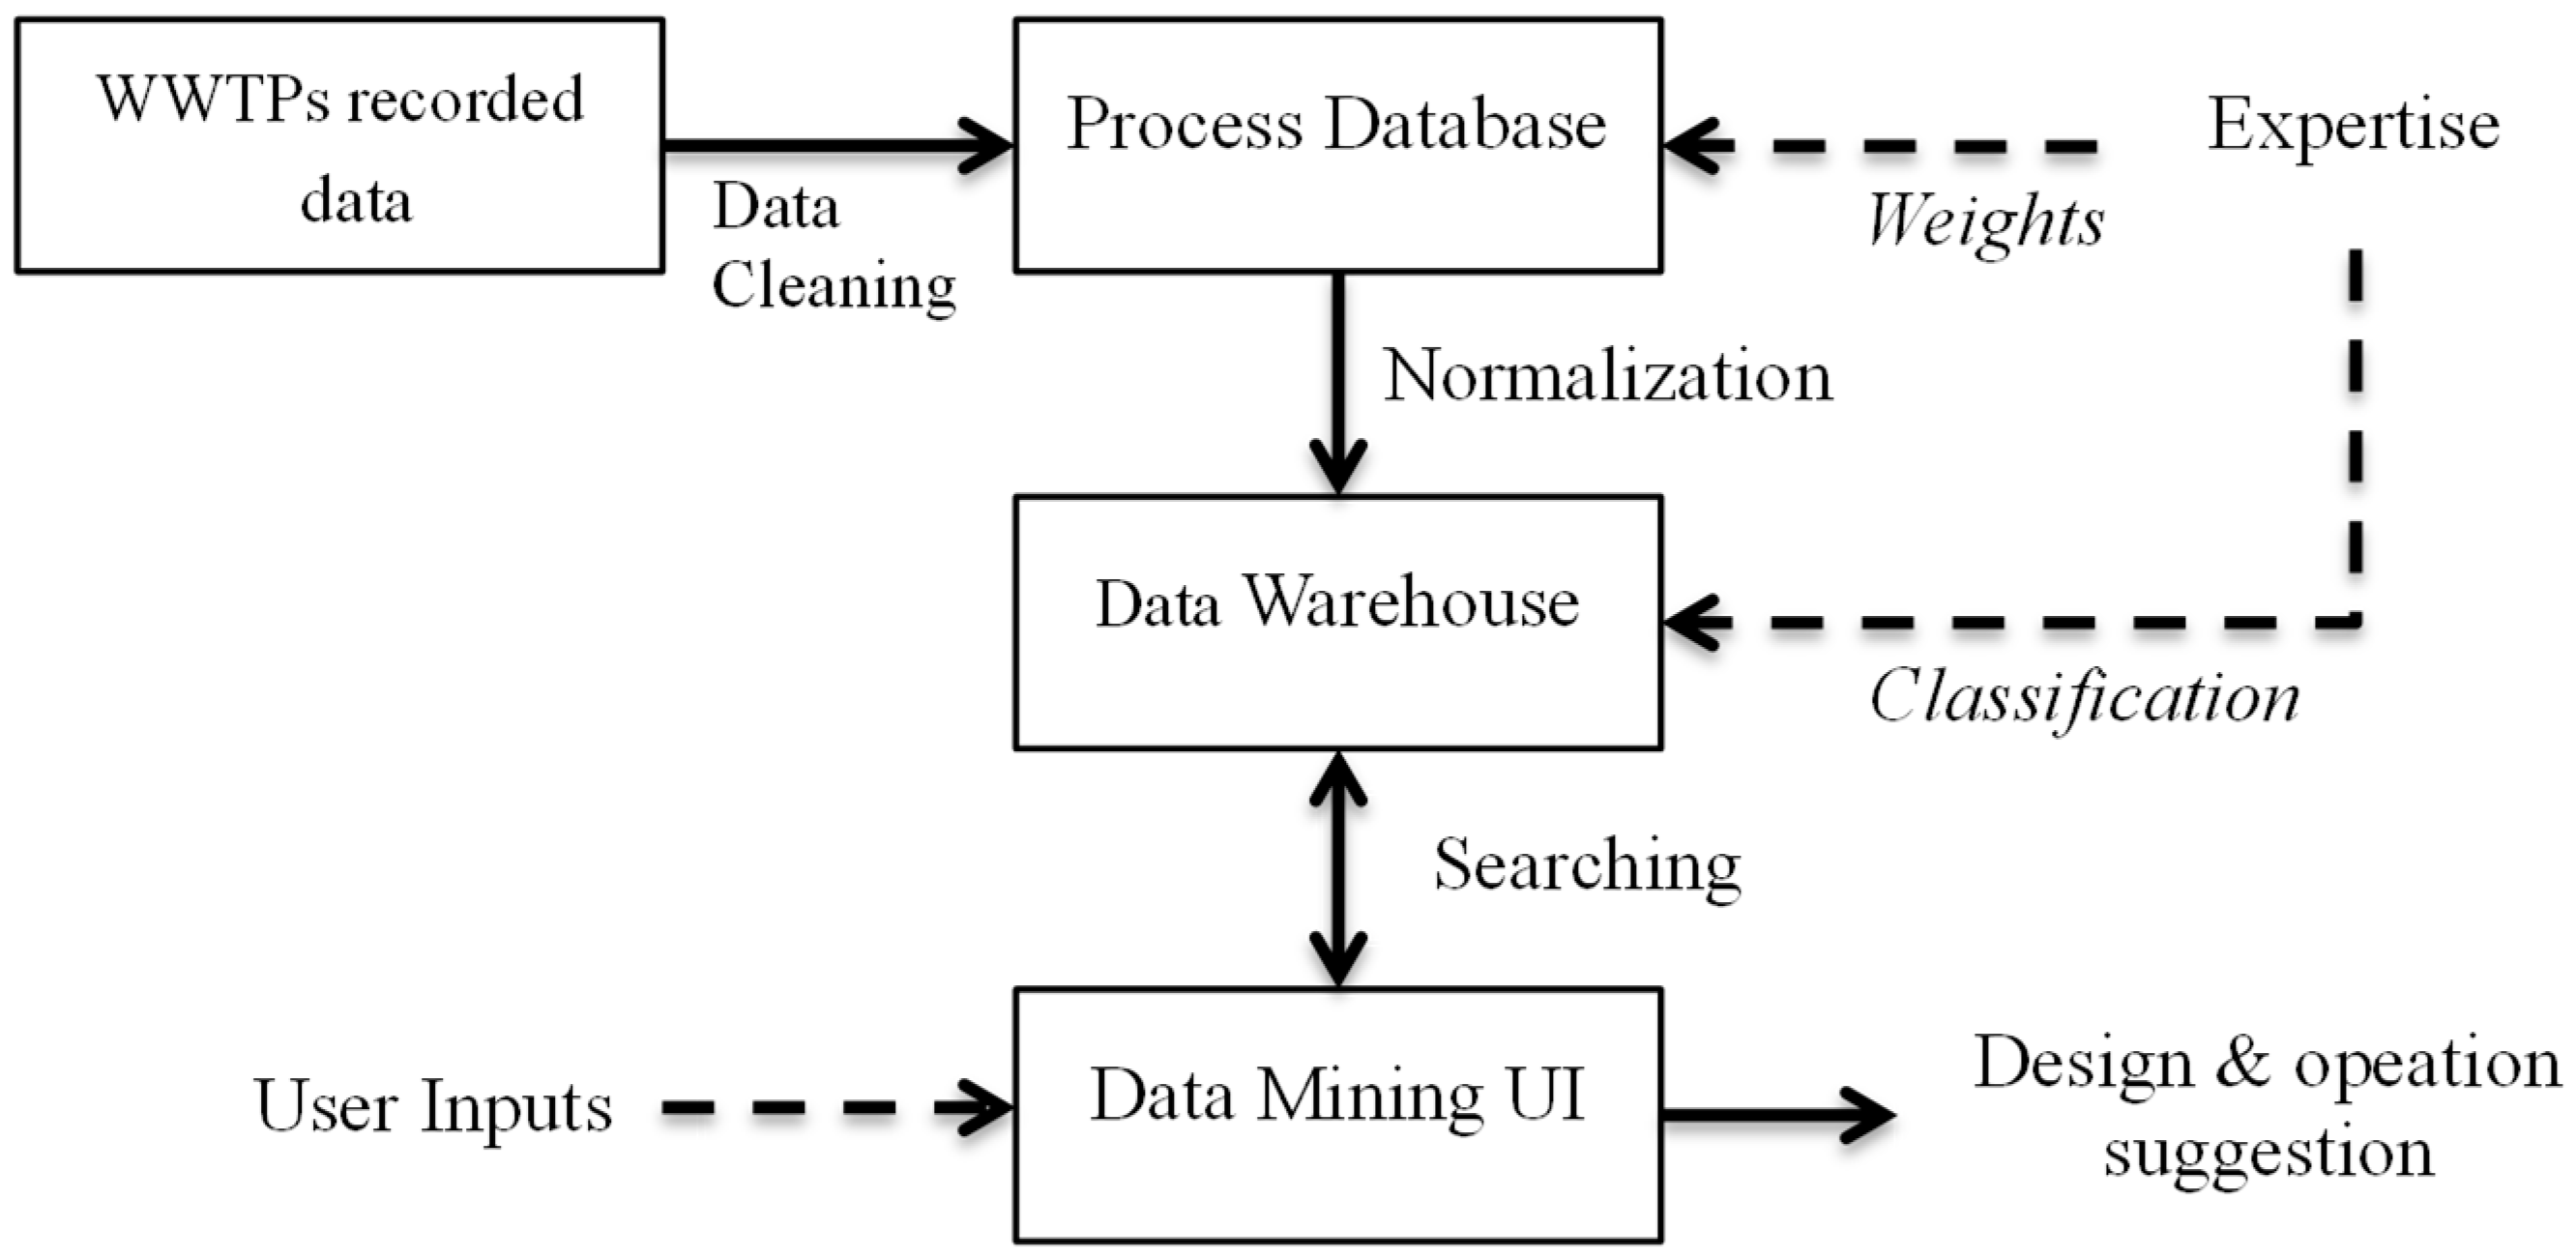
2.1. Protocol of Data Mining System

Figure 1 shows the conceptual scheme of a data mining system in WWTP. The system consists of data collection, cleaning, warehouse, and mining. First, the process information and raw data were collected from the WWTPs. Data cleaning rules were applied to identify the data missing events, typos, and other mistakes for data quality control. Second, after cleaning, the data were organized into a process database that consisted of the process information, state variables, water quality, and operational parameters. Six derived parameters as sludge removal loading rates were calculated from original variables (Section 2.2 and Section 3.1). Third, a series of fact sheets were generated from the process data and compiled into a data warehouse for data mining. Five classification rules from expertise were used as constraints to accelerate the searching algorithm (Section 2.3 and Section 3.2). Fourth, a searching algorithm was programmed to find out the best fits of the input scenario in the data warehouse. Usually, five records in the data warehouse with the highest matching rates were selected as the suggestions (Section 2.4). Finally, a friendly web UI was developed to assist the users to input target scenario, execute data mining, and interpret the system outputs (Section 2.5). The system outputs can be used for process design and operation, as explained in case studies in Section 3.3 and Section 3.4.

2.2. Data Collection and Cleaning

The raw data were collected from the online database available in WWTPs, as well as the laboratory analysis in field surveys in necessity. The scope of the data collection covered the process information, operational parameters, state variables, influent and effluent water quality, and so on. For example, the process data may consist of hydraulic retention time (HRT), dissolved oxygen (DO), mixed liquor suspended solids (MLSS), flow rates of return sludge (RS) and mixed liquor (IR), chemical oxygen demand (COD), suspended solids (SS), and so on. Because of the different intervals of online data and laboratory analysis, daily average values were used in this study. An example of the raw data in one month is shown in Table S1.
Data cleaning mainly deals with the challenge of missing data. For example, the online data recording might be interrupted, some parameters might be absent in daily laboratory analysis, and outliers often occurred as a result of the process faults or instrumental calibration. There were many efforts against data loss by improving analytical tools of process parameters, for example, the various methods to monitor biological oxygen demand in five days (BOD5) [29]. However, very few of the conceptual sensors have been applied in practice. As one of the alternatives, influent BOD5 could be accurately predicted from regularly analyzed parameters using soft sensor algorithms like an artificial neural network (ANN) and multiple linear regressions (MLR) [23]. For simplicity, an equation like BOD5 = a∙COD + b could be used to interpolate the missing data [30]. Moreover, a statistical method was helpful to remove the outliers by three times the standard deviation from the average values.

2.3. Data Warehouse Construction

The data warehouse is organized in a database with fact sheets for searching the best matches of the input scenario (Supplementary M1 and Tables S2–S5). Six derived variables (Equation (1)), as sludge removal loading rates (Ls), were calculated from the original variables in the process database (Table S6). The water quality indices for calculation consisted of COD, BOD5, SS, ammonia nitrogen (NH3-N), total nitrogen (TN), and total phosphorus (TP). Only the derived variables instead of all the original variables in the data warehouse were used for data mining, in order to simplify the complexity of the data searching algorithm.
Ls,i = Q ∙ (Cinf,i − Ceff,i)/(MLSS∙V) = (Cinf,i − Ceff,i)/(MLSS∙HRT)
where Ls,i is the sludge loading rates as the ith derived variable; Q is the influent flow rate; V is the volume of bioreactors; HRT is the hydraulic retention time of the process, which equal to V/Q; MLSS is the concentrations of mixed liquor suspended solids in the bioreactor; Cinf,i and Ceff,i are concentrations of ith derived variable in influent and effluent, respectively. The index i is in range of 1−6, representing COD, BOD5, SS, NH3-N, TN, and TP, respectively.
Classification of WWTPs in the data warehouse was applied to set constraints to narrow the data searching field during data mining. Instead of searching all the records in the data warehouse, only the records of WWTPs in the similar classification with the input scenario were firstly searched for matching the user’s input. With valuable suggestions from both scientists and engineers, five classification rules were selected to group the WWTPs in the data warehouse (Table S7): (1) Presence of primary settling tank or not. (2) The ratio of industrial wastewater flow over influent flow is ≤40% or >40%. (3) Process types, including anaerobic–anoxic–oxic (AAO), sequence batch reactor (SBR), oxidation ditch (OD), membrane bio-reactor (MBR), and other processes. (4) Location at six geometric zones in China. (5) Seasons including summer and winter.
The data organization in the input scenario, fact sheet, and data warehouse is described as follows. Detailed explanation is provided in the Supplementary Method M1.
Input: I = {{Ck|k = 1, …, 5}, {xi|i = 1, …, 6}}
Fact Sheet: F = {index, {WTPj|j = 1, …, 30}, {Ck|k = 1, …, 5}, {(t, yi)|i = 1, …, 6}}
Data warehouse: D = {F, {(t, PRm)|m = 1, …, 24}}
where I, F, and D represent the data organization for input scenario, fact sheets, and data warehouse, respectively. WTPj is the information of the jth WWTP, PRm is the value of the mth original process variable in the date t, Ck is the value of the kth classification index, xi is the ith derived variable (as sludge removal loading rate) calculated from the input scenario, and (t, yi) is the ith derived variable calculated from the original variables in data warehouse at date t. There are 30 WWTPs, 6 derived variables, 5 classification indices, and 24 original parameters in the demonstrated data warehouse. Thus, subscript i, j, k, and m in this study are 6, 30, 5, and 24, respectively.

2.4. Data Mining

The simple idea of data mining in this study is to dig out the most similar records in the data warehouse to the user’s scenario. Here, the similarity was estimated by the Manhattan distance of the six derived variables as sludge removal loading rates (Table S6). An input scenario from different users generally consisted of process information, influent characteristics, and effluent criteria. The five classification indices and six derived variables could be determined by the process shown in the Supplementary Method M1.
The data mining algorithm was given in Supplementary Method M1 and Figure S1. Briefly, it includes six steps. First, penalty function of the input scenario (Equation (3)) was given according to the five WWTP classification rules, which helps to change the optimization with constraints to a non-constrain minimization question. Second, the Manhattan distance between the input scenario and each record in the data warehouse was calculated through Equation (4). Third, the sum of the Manhattan distance and penalty function was determined as the objective function via Equation (5). Fourth, the five best-hits were sorted up using the quick sorting of the objective function values. Fifth, the derived parameters of the best-hits were normalized into a single matching rate in percentile (Equation (6)), which was ranked again through sorting algorithm to obtain the final output. At last, the five best-hit records were shown in the sequence of the matching rates.
Wj = Σi | gi,k |
Ej = Σi=6 | (xiyi,j)/xi |
minn=5 OFj = Ej + Wj
Tn = | 1 − Σi=6[wi ∙ (xiyi,n)/xi]/6 | · 100%
where W, E, OF, and T are the penalty, Manhattan distance, objective function, and matching rate, respectively; minn=5 means searching five records with minimized OF values; x and y represent values of second parameters in the input scenario and data warehouse; i is the index of second parameters and ranged from 1 to 6; j is the index of records in the data warehouse and reaches up to 10,000; g is the penalty constant, which is 1 in case of true classification (e.g., processes are same) and 0 if false; k is the index of classification rules from 1 to 5; n is the index of the best hits from 1 to 5; yi,n is the nth hit in the outputs; wi is the weight for the ith derived variable and is 1 in this study; and Tn in percentile is the matching rate of the nth hit to the input scenario.

2.5. Web User Interface

A web-based and friendly UI of the data mining system was developed as a website application by a commercial coding company in Beijing of China. The data mining software consists of a server subsystem and a client subsystem, the structure of which is shown in Figure S2. The server subsystem was used for data input, storage, calculation, and data warehouse design, and the client subsystem was designed for the users to input WWTP information, to execute the sorting, and to review the output parameters. The client subsystem was developed in HyperText Markup Language (HTML 5), and the server was programmed using the MongoDB Application Programming Interface (API). A web UI as shown in Figure S3 offered users to input the scenario and review the outputs on the website.

2.6. Verification by Case Study

Two WWTPs in Wuxi City, Jiangsu Province of eastern China were selected to verify data mining. Case-1 WWTP has the total capacity of 45,000 m3∙d−1 using the anaerobic–anoxic–oxic (AAO) process. The industrial wastewater accounts for 15% of the influent, the variation coefficient of which was designed as 1.3. The process operation was poor because of the overloading of influent and lack of experienced engineers, resulting in frequent violation of the discharging criteria. Thus, the purpose of data mining is to optimize the process operation to improve the effluent water quality.
Case-2 WWTP has a total capacity of 40,000 m3∙d−1 and industrial wastewater is about 40% of the process influent. The WWTP was requested to upgrade the conventional activated sludge (CAS) process to AAO process for the sake of enhancing biological nutrient removal to meet the Grade I-A criteria. Thus, data mining in this case is to assist the process designers to determine the key process parameters. The influent water quality and discharge criteria for the two cases are shown in Supplementary Table S8.

3. Results

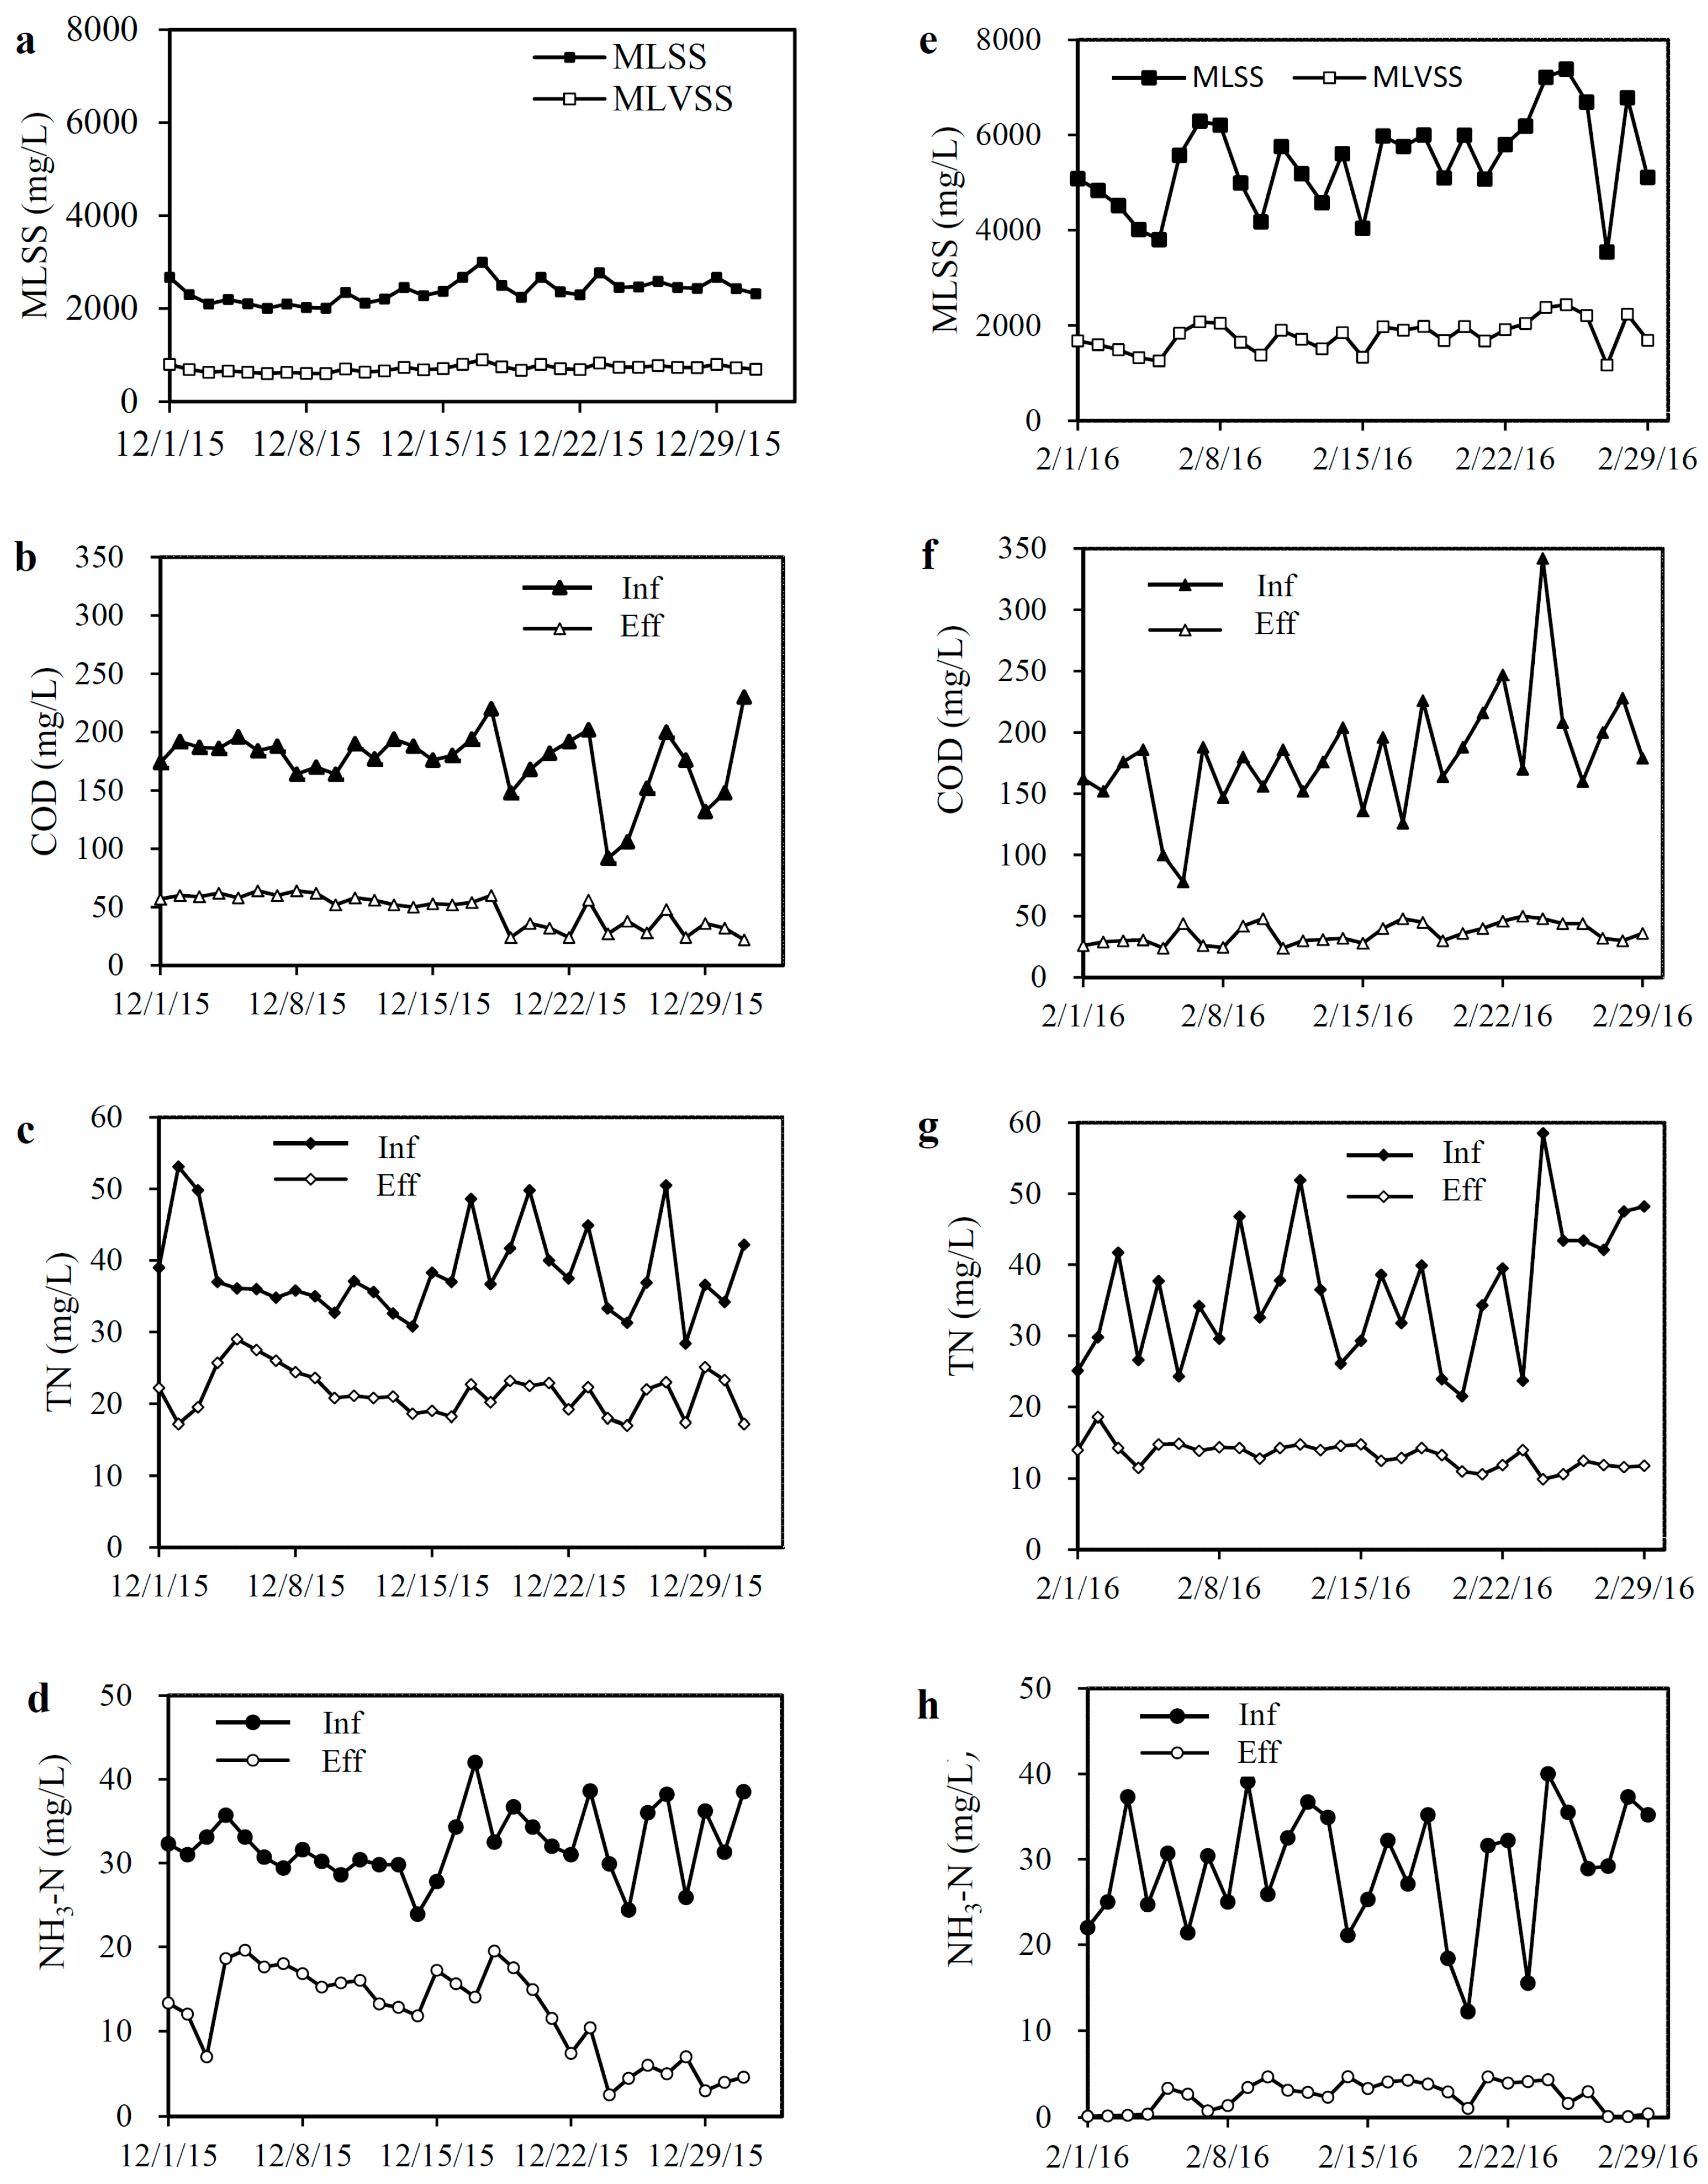
3.1. Data Collection and Cleaning

In total, 30 WWTPs in a good operational state were selected to build the data warehouse for demonstration (Table S9). The dominant process type was AAO, which was operated in 18 WWTPs. SBR, OD, and MBR processes were used in six, four, and two WWTPs, respectively. In the 30 WWTPs, there were 11 WWTPs that had no primary clarifier, 10 WWTPs that had an industrial influent ratio higher than 40%, and 21 WWTPs that were located in eastern China. The daily process data of the 30 WWTPs in 2014–2015 were collected to prepare a database with original variables.
Missing data were recognized and compensated as described in Section 2.2. For example, BOD5 was often not recorded on weekends, thus a linear correlation between BOD5 and COD was used to interpolate the missing data. The ratio of BOD5/COD is varied in a small range in WWTPs [1,3], for example, 0.3−0.6 in influent and 0.2−0.5 in effluent of the WWTPs in China [30]. Assuming BOD5/COD as constant in a short period such as in a week, the missing BOD5 can be approximated from the COD value in the same day.
After the data cleaning, the original variables were cross-checked to identify possible mistakes like typos. The first rule is that partial concentration should be lower than the total one, for example, BOD5 < COD, NH3-N < TN, and PO4-P < TP. The second rule is that ratios of influent concentrations of combined water quality indices over COD were in a reasonable range. For example, the ratio of BOD5/COD, SS/COD, TN/COD, and TP/COD can be used to identify the abnormal inputs and typos.

3.2. Data Warehouse and Analysis

The demonstrated data warehouse contained about 10,000 pieces of records in one-year daily data of 30 WWTPs. Each record documented 30 variables including 24 original variables and 6 derived variables (Supplementary Method M1). Figure 2 shows the bi-correlation of the derived variables in the data warehouse. Generally, a weak correlation existed among COD, BOD5, and SS. The correlation is related to the COD components, in which biodegradable suspended solid is the major component in influent COD. TN had a weak correlation to NH3-N because of the similar reason between COD and BOD5. Although the derived variables showed weak and positive bi-correlation, all the plots had a dispersed distribution of points, indicating that the six derived variables could be approximated as independent variables for data mining.
When calculating the Manhattan distances, setting x as zero in Equation (3), we can get the maximum Manhattan distance, which represents the essential operational state of the WWTP process. Thus, the deviation of the maximum Manhattan distances of each WWTP reflects its unique feature. As shown in Figure 3, the absolute value of the maximum Manhattan distance indicates the influent loading level of the process, whereas the box shape implies the dispersion and limits of the loadings. In the Figure, No. 11 WWTP had the largest height of the box, which implied a strong variation of influent loadings. The process applied in No. 11 WWTP was Orbal oxidation ditch with the capacity of 50,000 m3∙d−1. Because of the large influent fluctuation, a surface aeration control system had been developed using an optimal energetic model to compromise the aeration and impelling of the aerators [31]. The smallest height of the box was in No. 5 WWTP, which applied AAO process with almost constant influent at 2000 m3∙d−1. All the plants had some outlier points in the cross label in the figure, indicating possible abnormal operational states during the period, for example, shocking influent flow rate, very high COD and SS influent due to illegal discharge, and so on.

3.3. Data Mining for Operational Optimization

Figure 4 shows the operational parameters of Case-1 WWTP. In December 2015, the influent flow rates fluctuated in the range of 55,000–89,000 m3∙d−1, with the average at 65,000 m3∙d−1. The volatile suspended solids in mixed liquor (MLVSS) and MLSS were close to 650 and 2400 mg∙L−1, respectively. The typical DO concentration in the aerobic tank was 2.1 mg∙L−1. The effluent water quality of COD, TN, and NH3-N was about 50, 25, and 12 mg∙L−1, respectively (Figure 4a–d), which often violated the Grade I-A discharging criteria (Table S8).
A data mining system was used to assist the operators to optimize the process operation. The input parameters included influent water quality, process type, volumes of reactors, MLSS, and discharging criteria. The output data (Table 1) consisted of five best-hit records to the input scenario, including process parameters (ORP, DO, MLSS, RS, and IR), HRT (anaerobic, anoxic, and aerobic), and effluent quality (COD, SS, TN, TP, and NH3-N).
The possible suggestions for process operations were identified by comparing the current state and the recommended states. For example, the activated sludge should be increased from 2400 mg∙L−1 to over 4000 mg∙L−1, which was possible by reducing the discharge of excessive sludge or by adding coagulants before the second clarifier to enhance the sedimentation. Moreover, the DO concentration should be increased to be higher than 3 mg∙L−1 to enhance the nitrification, which could be achieved by supplying more air flow to the bioreactors. The flow rates of RS and IR can also be optimized according to the recommendation. After one month of practicing (Figure 4e–h), the MLSS was improved to over 5000 mg∙L−1 and effluent water quality indices were better than the discharging criteria.

3.4. Data Mining for Process Design

Table 2 shows the output of the data mining system for the process design in Case-2 WWTP. HRT, RS, and IR were almost the same in the five best-hits, implying that the designed process parameters are similar to the configuration of the WWTPs in the data warehouse. Effluent water quality of COD, SS, and TP was also similar in the output, indicating effective removal of such contaminants by the designed process. However, there were still obvious differences between input and hits on operational parameters (ORP, DO, and MLSS) and effluent water quality (TN and NH3-N), especially after considering the seasonal effects. Values of ORP, DO, and MLSS in winter were all higher than those in summer, partially because of the excessive aeration and accumulated biomass in the bioreactors. Such a process operation is very popular in practice to enhance the nitrification, the efficiency of which would be inhibited by the low temperature in winter. In general, the optimal strategy in the mind of process operators can be reflected but also hidden in the records of the data warehouse.
The suggestions on HRT are also important for process designers because HRT can determine the size of tanks, which is strongly associated with capital investments. The operational parameters in the output suggested flexible and resilient process designs, which were helpful to provide possibility and convenience to operators to control the process. Using the data mining output as a feedback suggestion to the proposed process design, the process designers are able to improve their design works continuously.

4. Discussion

4.1. Gaps between Scientific Knowledge and Practical Demands

The current studies of data-driven models in WWTPs mainly focused on intelligent algorithms. For example, five optimization algorithms have been compared to predict effluent suspended solids [24], including multi-layered perceptron, k-nearest neighbor, multivariate adaptive regression spline, support vector machine, and the random forest. Similar optimizing algorithms have been applied to control pumps to save energy, for example, data-driven prediction model [11] and neuro-fuzzy inference system algorithm [12]. Process operation and control was also a concern of the researchers. A data mining method has been already developed in anaerobic treatment processes to predict methane production [19], for example, using an adaptive neuro-fuzzy inference system algorithm [32] and neural network with a particle swarm optimization algorithm [18]. The algorithm using self-organizing maps (SOM) and neural gas (NG) was used to optimize plant-wide process control [33]. Although accurate models and various systems have been developed to optimize the WWTP process, most tools have not been applied by the process operators and managers in China. They seemed to be frequently challenged by uncertain effluent water quality and maintenance of instruments, thus ignored learning and applying advanced techniques.
A feasible solution to heal the gaps between scientific knowledge and practical demands is to screen the matured techniques from candidates. A critic review of knowledge-based techniques in WWTPs suggested simple but productive techniques using a Gartner hype cycle graph, including classic intelligent models (artificial neural network and fuzzy logic), simple statistical analysis (regression, principal component analysis, and partial least square fitting), and non-smart tools (mass balance and control chart) [28]. The above techniques have been well-established and applied in practice. For example, an artificial neural network with rule induction has been successfully verified in the TELEMAC project of the European Union, which improved the control efficiency and sensor reliability in WWTPs [19]. Principle component analysis has been used to decompose the multi-dimensional data for process visualization in order to diagnose process faults [19]. Partial least square fitting has already been popularly applied in sensor calibration [34]. Clustering based on rules has been used to integrate artificial intelligence and statistic tools into an explicit knowledge model to supply a holistic operation and description of the process [21]. In general, face to face between scientist and engineer is necessary to diffuse the state-of-art tools, such as data mining, to the designers, operators, and managers in WWTPs [35], which is also the incentive of this study.

4.2. Advances in the Data-Driven Models in WWTPs

Opposite to mathematical models, which ignore unimportant physical and anthropic details during the abstract of the physical world, data-driven models describe process dynamics from the process states containing sophisticated effects from diverse sources. Data-driven models have been examined in certain units of WWTPs, for example, data mining coupled with an artificial immuno-neural network to control pumping stations [11,12], and neural network-particle swarm optimization to maximize methane production in anaerobic digester [18]. Soft-sensors have been also developed via data mining to estimate the indirect signals, for example, a BOD soft sensor was developed to avoid absence of aeration in bioreactors [23]. Data mining techniques had the functions of illustrating trends of time-series variables, predicting effluent water quality, and suggesting optimal [25]. An impressive example was using time-series data mining to estimate the leakage of the sewer system, which has been successfully implemented in Brussel City [36].
Although data-driven models could favor process optimization and control, risks and faults might also be introduced to the process from improper records in data warehouse. The data-driven models were free of mechanism and lack of general description of the process dynamics; thus, integration of mechanism models, data-driven techniques, and expertise were in urgent need. The description of processes could be more accurate and robust by using an integral system rather than individual techniques, which has been verified in two full-scale WWTPs in 2002 [26]. Another interesting attempt to deal the challenge was to apply the multi-agent algorithm to extract data from the database to generate real-time decisions autonomously [37]. It was still necessary for an expert system to be online 24 h/7 d to notice the operators and supervise the decision-making process. In summary, the fusion of data-driven models with mathematic models and the expert systems represent a promising direction to explore new solutions to optimize the process in WWTPs.

4.3. Potential of Data Mining in the Control of WWTP

Aeration and pumping occupied about 50% and 15% of total electricity consumption in typical municipal WWTPs, respectively [3], demanding optimal control of the two units. The potential of data mining techniques on process control in WWTPs has been revealed by previous studies [28], but most currently available studies remained in the stage of process simulation and theoretical analysis. For pumping station control, optimization algorithms included artificial neural network with mixed-integer nonlinear programming [13], artificial neural network with particle swarm optimization [14], and artificial immuno-neural network with diverse optimization algorithm [11,12]. For aeration process control, optimal airflow could be determined from historical data through data mining [15], for example, using autonomous regression spline model to achieve very low aeration intensity in a WWTP in the Mideast area [16]. Another example was using a model-free reinforcement learning agent to optimize the DO set points in bioreactors [17]. Although the performance of the above systems was inspiring, it was quite difficult to apply the data-driven models in practice because of the sophisticated calculation and background knowledge required. A successful example might be the simple fuzzy logic model with a web UI in a WWTP in German, where operational decisions on pumps were generated daily to save energy up to 18.5% [22].
The simplest model performs the best in practice. A statistical analysis revealed that optimal control of aeration and pumps could achieve the sustainable goal of 20–40% energy saving [38]. In actual fact, the simple and classic algorithms worked well in WWTPs [39], for example, feedforward–feedback aeration control in MBR saved 20% of energy consumption [40] and a surface aeration control in OD achieved energy saving of 10% [31]. Energy saving of up to 25% was reported using a decision support system with daily energy auditing [41]. The system consisted of charts, key performance indices, scenario analysis, fully logic induction, and supports from experts. The simple and effective data mining system in this study is also a meaningful step of marching through the Gartner hype cycle graph of knowledge-based techniques in WWTPs [28].

4.4. Challenges and Perspectives

Although the data mining system has good potential in practice, there are still serious challenges with its application. First, the performance of data mining strongly depends on the data volume and data quality. The data warehouse demonstrated in this study only emphasized the removal efficiency, which was the current concern of the operators. Considering the new ambitions of WWTPs such as energy-neutral operation, more valuable variables in high data quality need to be included in the data warehouse to achieve solid analyses and generate multiple suggestions. For example, energy performance indices, process variables (SRT, oxygen uptake rates, etc.), and environmental impacts (biogas production and various emissions) could be selected as new derived variables for searching. The open structure of the database in this study allows extension of new variables in the data warehouse.
Second, the uncertainty of data mining should be concerned and clarified. The outputs of data mining were strongly related to the structure of data warehouse. For example, the dominant scenarios in the data warehouse in this study were AAO process (18 out of 30) and location of eastern China (21 out of 30), which were in the simlar classification to the two case WWTPs. This accordance supported the data mining to cover enough records in the data warehouse. For other processes or locations, data mining might fail because of the limited volume of records. Moreover, the noise in the process data without careful identification, such as operational faults and improper decisions, may introduce disturbances into the operation. Data quality in the data warehouse should be more of a concern in future studies, requiring new methods to quantify and control the quality. Anyway, data quality control and data volume expansion usually had to be compromised in a limited investment in practice. As the experience of this study, data mining in about 7000 records (one-year data of 18 WWTPs) can generate a reasonable suggestion, although it might be far from an accurate suggestion. With the increasing volume and quality of the data warehouse, the data mining outputs could be more accurate and reliable than the current stage.
Third, data mining needs to be oriented to and collaborative with the process operators. Current data mining techniques are not smart enough to deal with sophisticated scenarios. For example, it is easy to extract the seasonal variation from influent flow by cluster analysis [42], but it is quite difficult for data-driven models to identify process malfunction or wrong operation. WWTPs are difficult to control because of their complicated, dynamic, and large delay features [3], thus subjective judgment from engineers’ experience is necessary to find out the solution. Joining the process engineers in the development of a data mining system can build the trust of process engineers on the techniques, making the data mining more acceptable and applicable in practice.

5. Conclusions

In this study, data mining technology has been applied to optimize the design and operation of wastewater treatment processes. An integral procedure was proposed to implement the system, which includes data collection and cleaning, data compiling and warehouse, data mining, and web UI. Currently, a demonstration data warehouse was established from the process data in 30 WWTPs in China. Sludge removal loading rates of key water quality indices were selected as derived parameters for data mining. The bi-correlations and distribution properties of derived parameters in the data warehouse were illustrated and analyzed. As a decision support tool for operators and designers, the data mining system was verified in two case studies, including one case for optimizing process operation and one case for improving process design. A detailed discussion was provided on the gaps, potentials, and challenges of data mining, as well as other data-driven models, in practice. The data mining system in this study is a good example and also a verified solution for engineers to understand and control their processes in WWTPs.

Supplementary Materials

The following are available online at https://www.mdpi.com/2073-4441/10/10/1342/s1, Method M1: Organization of data warehouse and an example of data mining; Method M2: Data mining algorithm; Figure S1 Brief description of the algorithm of data mining; Figure S2 User interface (UI) of the web application to achieve human–machine interface; Figure S3 Typical software interface of the supervisory data mining system for WWTPs; Table S1 An example of collected process raw data from WWTPs; Table S2 Process information of the WWTPs in data warehouse; Table S3 The classification from the process information of the WWTPs; Table S4 The original variables in records of the data warehouse after data cleaning; Table S5 The derived variables in records of the data warehouse for searching; Table S6 Six derived parameters in the data warehouse for mining; Table S7 Five indices of WWTP classification and the values; Table S8 Influent characteristics of Case WWTPs for data mining verification; Table S9 Brief information of the 30 WWTPs for a demonstration of data mining.

Author Contributions

H.S. and J.L. conceived the idea. H.S. and Y.Q. designed the protocol. J.L. and Y.Q. collected the data and conducted the analysis. Y.Q. and J.L. drafted the paper. H.S. and X.H. gave critic proofreading. Y.Q. and X.H. revised the manuscript. J.L. and H.S. managed projects to offer financial supports. All authors gave final approval for publication.

Funding

National Natural Science Foundation of China (51778325), Major Science and Technology Program for Water Pollution Control and Treatment (2014ZX07305-001), Science and Technology Project in Jiangsu Province (BE2015622), Research Institute of Tsinghua University—Beijing Enterprises Water Group, and Volvo Group project in the Research Center for Green Economy and Sustainable Development of Tsinghua University.

Acknowledgments

The authors thank Wang Shuo, Wang Yan, and Zheng Kaikai from Jiangnan University for their support on data collection and analysis. The authors also thank Wen Xianghua, Liang Peng, Zhang Xiaoyuan, and Liu Yanchen at Tsinghua University for their comments on the study. The authors are grateful to the reviewers and editor who provided valuable comments on the manuscript.

Conflicts of Interest

The authors declare no conflict of interest.

References

  1. Zhang, Q.H.; Yang, W.N.; Ngo, H.H.; Guo, W.S.; Jin, P.K.; Dzakpasu, M.; Yang, S.J.; Wang, Q.; Wang, X.C.; Ao, D. Current status of urban wastewater treatment plants in China. Environ. Int. 2016, 92–93, 11–22. [Google Scholar] [CrossRef] [PubMed]
  2. Smith, K.; Liu, S. Energy for Conventional Water Supply and Wastewater Treatment in Urban China: A Review. Glob. Chall. 2017, 1, 1600016. [Google Scholar] [CrossRef] [Green Version]
  3. Yong, Q.; Han-chang, S.; Miao, H. Nitrogen and Phosphorous Removal in Municipal Wastewater Treatment Plants in China: A Review. Int. J. Chem. Eng. 2010, 914110–914159. [Google Scholar] [CrossRef]
  4. Dong, X.; Du, X.; Li, K.; Zeng, S.; Bledsoe, B.P. Benchmarking sustainability of urban water infrastructure systems in China. J. Clean. Prod. 2018, 170, 330–338. [Google Scholar] [CrossRef]
  5. Olsson, G. Advancing Ica Technology by Eliminating the Constraints. Water Sci. Technol. 1993, 28, 1–7. [Google Scholar] [CrossRef]
  6. Kim, C.; Park, T.J.; Ko, J.H. Instrumentation, control and automation for water and wastewater treatment and transport systems. Water Sci. Technol. 2006, 53, 9–10. [Google Scholar]
  7. Sang, J.; Siau, K. A review of data mining techniques. Ind. Manag. Data Syst. 2001, 1, 41–46. [Google Scholar]
  8. Kusiak, A. Data mining: Manufacturing and service applications. Int. J. Prod. Res. 2006, 44, 4175–4191. [Google Scholar] [CrossRef]
  9. Stankovski, V.; Swain, M.; Kravtsov, V.; Niessen, T.; Wegener, D.; Kindermann, J.; Dubitzky, W. Grid-enabling data mining applications with DataMiningGrid: An architectural perspective. Future Gen. Comput. Syst. Int. J. Grid Comput. Theory Methods Appl. 2008, 24, 259–279. [Google Scholar] [CrossRef]
  10. Rayward-Smith, V.J. Statistics to measure correlation for data mining applications. Comput. Stat. Data Anal. 2007, 51, 3968–3982. [Google Scholar] [CrossRef]
  11. Zhang, Z.; Kusiak, A.; Zeng, Y.; Wei, X. Modeling and optimization of a wastewater pumping system with data-mining methods. Appl. Energy 2016, 164, 303–311. [Google Scholar] [CrossRef]
  12. Kusiak, A.; Zeng, Y.; Zhang, Z. Modeling and analysis of pumps in a wastewater treatment plant: A data-mining approach. Eng. Appl. Artif. Intell. 2013, 26, 1643–1651. [Google Scholar] [CrossRef]
  13. Zhang, Z.; Zeng, Y.; Kusiak, A. Minimizing pump energy in a wastewater processing plant. Energy 2012, 47, 505–514. [Google Scholar] [CrossRef]
  14. Zhang, Z.; He, X.; Kusiak, A. Data-driven minimization of pump operating and maintenance cost. Eng. Appl. Artif. Intell. 2015, 40, 37–46. [Google Scholar] [CrossRef]
  15. Chen, J.; Chang, N. Mining the fuzzy control rules of aeration in a submerged biofilm wastewater treatment process. Eng. Appl. Artif. Intell. 2007, 20, 959–969. [Google Scholar] [CrossRef]
  16. Asadi, A.; Verma, A.; Yang, K.; Mejabi, B. Wastewater treatment aeration process optimization: A data mining approach. J. Environ. Manag. 2017, 203, 630–639. [Google Scholar] [CrossRef] [PubMed]
  17. Hernandez-del-Olmo, F.; Gaudioso, E.; Nevado, A. Autonomous Adaptive and Active Tuning Up of the Dissolved Oxygen Setpoint in a Wastewater Treatment Plant Using Reinforcement Learning. IEEE Trans. Syst. Man Cybern. Part C-Appl. Rev. 2012, 42, 768–774. [Google Scholar] [CrossRef]
  18. Kusiak, A.; Wei, X. A data-driven model for maximization of methane production in a wastewater treatment plant. Water Sci. Technol. 2012, 65, 1116–1122. [Google Scholar] [CrossRef] [PubMed]
  19. Dixon, M.; Gallop, J.R.; Lambert, S.C.; Healy, J.V. Experience with data mining for the anaerobic wastewater treatment process. Environ. Model. Softw. 2007, 22, 315–322. [Google Scholar] [CrossRef]
  20. Dixon, M.; Gallop, J.R.; Lambert, S.C.; Lardon, L.; Healy, J.V.; Steyer, J. Data mining to support anaerobic WWTP monitoring. Control Eng. Pract. 2007, 15, 987–999. [Google Scholar] [CrossRef]
  21. Gibert, K.; Rodriguez-Silva, G.; Rodriguez-Roda, I. Knowledge discovery with clustering based on rules by states: A water treatment application. Environ. Model. Softw. 2010, 25, 712–723. [Google Scholar] [CrossRef]
  22. Torregrossa, D.; Hansen, J.; Hernandez-Sancho, F.; Cornelissen, A.; Schutz, G.; Leopold, U. A data-driven methodology to support pump performance analysis and energy efficiency optimization in Waste Water Treatment Plants. Appl. Energy 2017, 208, 1430–1440. [Google Scholar] [CrossRef]
  23. Zhu, J.; Kang, L.; Anderson, P.R. Predicting influent biochemical oxygen demand: Balancing energy demand and risk management. Water Res. 2018, 128, 304–313. [Google Scholar] [CrossRef] [PubMed]
  24. Verma, A.; Wei, X.; Kusiak, A. Predicting the total suspended solids in wastewater: A data-mining approach. Eng. Appl. Artif. Intell. 2013, 26, 1366–1372. [Google Scholar] [CrossRef]
  25. Haimi, H.; Mulas, M.; Corona, F.; Vahala, R. Data-derived soft-sensors for biological wastewater treatment plants: An overview. Environ. Model. Softw. 2013, 47, 88–107. [Google Scholar] [CrossRef]
  26. Duerrenmatt, D.J.; Gujer, W. Data-driven modeling approaches to support wastewater treatment plant operation. Environ. Model. Softw. 2012, 30, 47–56. [Google Scholar] [CrossRef]
  27. Hernandez-del-Olmo, F.; Gaudioso, E.; Dormido, R.; Duro, N. Energy and Environmental Efficiency for the N-Ammonia Removal Process in Wastewater Treatment Plants by Means of Reinforcement Learning. Energies 2016, 9, 755. [Google Scholar] [CrossRef]
  28. Corominas, L.; Garrido-Baserba, M.; Villez, K.; Olsson, G.; Cortes, U.; Poch, M. Transforming data into knowledge for improved wastewater treatment operation: A critical review of techniques. Environ. Model. Softw. 2018, 106, 89–103. [Google Scholar] [CrossRef]
  29. Jouanneau, S.; Recoules, L.; Durand, M.J.; Boukabache, A.; Picot, V.; Primault, Y.; Lakel, A.; Sengelin, M.; Barillon, B.; Thouand, G. Methods for assessing biochemical oxygen demand (BOD): A review. Water Res. 2014, 49, 62–82. [Google Scholar] [CrossRef] [PubMed]
  30. Sun, Y.; Chen, Z.; Wu, G.; Wu, Q.; Zhang, F.; Niu, Z.; Hu, H. Characteristics of water quality of municipal wastewater treatment plants in China: Implications for resources utilization and management. J. Clean. Prod. 2016, 131, 1–9. [Google Scholar] [CrossRef]
  31. Qiu, Y.; Zhang, C.; Li, B.; Li, J.; Zhang, X.; Liu, Y.; Liang, P.; Huang, X. Optimal Surface Aeration Control in Full-Scale Oxidation Ditches through Energy Consumption Analysis. Water 2018, 10, 945. [Google Scholar] [CrossRef]
  32. Kusiak, A.; Wei, X. Prediction of methane production in wastewater treatment facility: A data-mining approach. Ann. Oper. Res. 2014, 216, 71–81. [Google Scholar] [CrossRef]
  33. Machon-Gonzalez, I.; Rodriguez-Iglesias, J.; Lopez-Garcia, H.; Castrillon-Pelaez, L.; Maranon-Maison, E. Knowledge extraction from a nitrification denitrification wastewater treatment plant using SOM-NG algorithm. Environ. Technol. 2017, 38, 1548–1553. [Google Scholar] [CrossRef] [PubMed]
  34. Zhu, B.; Chen, Z.; He, Y.; Yu, L. A novel nonlinear functional expansion based PLS (FEPLS) and its soft sensor application. Chemom. Intell. Lab. Syst. 2017, 161, 108–117. [Google Scholar] [CrossRef]
  35. Li, Y.; Shi, L.; Qian, Y.; Tang, J. Diffusion of municipal wastewater treatment technologies in China: A collaboration network perspective. Front. Environ. Sci. Eng. 2017, 11, 11. [Google Scholar] [CrossRef]
  36. de Ville, N.; Le, H.M.; Schmidt, L.; Verbanck, M.A. Data-mining analysis of in-sewer infiltration patterns: Seasonal characteristics of clear water seepage into Brussels main sewers. Urban Water J. 2017, 14, 1090–1096. [Google Scholar] [CrossRef]
  37. Hernandez-del-Olmo, F.; Llanes, F.H.; Gaudioso, E. An emergent approach for the control of wastewater treatment plants by means of reinforcement learning techniques. Exp. Syst. Appl. 2012, 39, 2355–2360. [Google Scholar] [CrossRef]
  38. Henriques, J.; Catarino, J. Sustainable value—An energy efficiency indicator in wastewater treatment plants. J. Clean. Prod. 2017, 142, 323–330. [Google Scholar] [CrossRef]
  39. Li, B.; Qiu, Y.; Zhang, C.; Chen, L.; Shi, H. Understanding biofilm diffusion profiles and microbial activities to optimize integrated fixed-film activated sludge process. Chem. Eng. J. 2016, 302, 269–277. [Google Scholar] [CrossRef]
  40. Sun, J.; Liang, P.; Yan, X.; Zuo, K.; Xiao, K.; Xia, J.; Qiu, Y.; Wu, Q.; Wu, S.; Huang, X.; et al. Reducing aeration energy consumption in a large-scale membrane bioreactor: Process simulation and engineering application. Water Res. 2016, 93, 205–213. [Google Scholar] [CrossRef] [PubMed]
  41. Torregrossa, D.; Hernandez-Sancho, F.; Hansen, J.; Cornelissen, A.; Popov, T.; Schutz, G. Energy saving in wastewater treatment plants: A plant-generic cooperative decision support system. J. Clean. Prod. 2017, 167, 601–609. [Google Scholar] [CrossRef]
  42. Zhao, Y.; Guo, L.; Liang, J.; Zhang, M. Seasonal artificial neural network model for water quality prediction via a clustering analysis method in a wastewater treatment plant of China. Desalin. Water Treat. 2016, 57, 3452–3465. [Google Scholar] [CrossRef]
Figure 1. The scheme of a data mining system for optimizing the process design and operation in wastewater treatment plants. The solid lines represent automatic procedure and dash lines are involved with expert knowledge. WWTPs—wastewater treatment plants; UI—user interface.
Water 10 01342 g001
Figure 2. Cross-correlation is diverse between the six derived parameters (sludge removal loading rates) in the data warehouse. The parameters are normalized to [0,1] by interpolating the parameter over the range of minimum to maximum values in the data warehouse. BOD—biological oxygen demand; COD—chemical oxygen demand; SS—suspended solids; TP—total phosphorus; TN—total nitrogen; NH3-N—ammonia nitrogen.
Water 10 01342 g002
Figure 3. The maximum Manhattan distance of derived parameters in the data warehouse for part of the WWTPs.
Water 10 01342 g003
Figure 4. The water quality in Case-1 WWTP before and after the optimization through data mining. (ad) MLSS, MLVSS, COD, TN, and NH3-N in December 2015 before the optimization; (eh) MLSS, MLVSS, COD, TN, and NH3-N in February 2016 after the optimization. MLVSS—suspended solids in mixed liquor; MLVSS—volatile suspended solids in mixed liquor; Inf—influent; Eff—effluent.
Water 10 01342 g004
Table 1. Data mining outputs for the process operational optimization in Case-1 wastewater treatment plants (WWTP).
No.Operation aHRT (h) bEffluent Water Quality (mg∙L−1) cT % d
ORPDOMLSSRS%IR%AnaAnoOxicCODSSTNNH3-NTP
1−372.93876701500.823.88.628814.82.120.3082
2−64.54228701500.793.57.824713.93.820.2381
3−962.94272701500.843.88.626614.54.750.1270
4−1006.64562701500.803.68.226614.54.750.1264
5−594.64130701500.793.57.832811.32.200.2249
Note: a ORP is oxidative-reduction potential in mV; DO is dissolved oxygen in mg∙L−1; MLSS is mixed liquor suspended solids concentration in mg∙L−1; RS is the ratio of return activated sludge over influent flowrate; IR is the ratio of internal return of mixed liquor over influent flow rate. b HRT is the hydraulic retention time of bioreactor in h. Ana, Ano, and Oxic represent the anaerobic, anoxic, and aerobic zones in the bioreactor. c COD, SS, TN, NH3-N, and TP are water quality indices for chemical oxygen demand, suspended solids, total nitrogen, ammonia nitrogen and total phosphorous, respectively. d T is the matching rate as shown in Equation (6), 100% means a perfect match.
Table 2. Data mining outputs for the process design in Case-2 WWTP.
Time aOperationHRT (h)Effluent Water Quality (mg∙L−1)T %
ORPDOMLSSRS%IR%AnaAnoxOxicCODSSTNNH3-NTP
Sum−1753.43960701500.803.68.222611.20.260.4181
−1744.14340701500.823.78.922611.20.260.4175
−1443.14230701500.833.88.624714.20.720.2971
−1803.24790701500.823.88.627814.01.400.2569
−1883.63770701500.853.98.621814.60.790.3159
Win−105.64550701500.813.68.222812.21.120.2083
−52.74820701500.823.88.624713.62.540.2282
−504.24930701500.813.78.923814.21.760.2273
−53.34920701500.843.88.622812.21.120.2072
−144.44360701500.793.57.819712.50.410.2067
Note: a Sum and Win are summer and winter, respectively. Other variables are the same as in Table 1.

