Article

Inundated Areas Extraction Based on Raindrop Photometric Model (RPM) in Surveillance Video

1
Faculty of Information Engineering, China University of Geosciences, Wuhan 430074, China
2
School of Urban Design, Wuhan University, Wuhan 430079, China
3
Key Laboratory of Digital Earth Science, Institute of Remote Sensing and Digital Earth, Chinese Academy of Sciences, Beijing 100094, China
*
Author to whom correspondence should be addressed.
Water 2018, 10(10), 1332; https://doi.org/10.3390/w10101332
Submission received: 24 July 2018 / Revised: 14 September 2018 / Accepted: 22 September 2018 / Published: 26 September 2018
(This article belongs to the Section Hydrology)

Abstract

:
Monitoring and assessing urban flood disasters is the key to reducing the damage of this hazard. The urban surveillance video, with the advantages of flexibility and low cost, has been used as an effective real-time data source to monitor urban flooding. The paper presents an inundated area extraction method based on raindrop photometric model. The proposed method operates on the video and divides the task into two steps: (1) extracting water surface, followed by (2) refining inundated areas. At the first step in the process, the water covered areas are extracted from the variation of video in time series. This procedure was an improved version of the raindrop photometric model. Constrained information, especially road ranges, was obtained from video background image which has eliminated interference factors. Then inundated areas can be refined with the constraint information. Experiments performed on different locations show that the proposed method can provide more reliable results than the traditional method based on spectral features.

1. Introduction

With the acceleration of the hydrological cycle resulting from climate change and urbanization, urban flood disasters will happen more frequently [1,2]. It not only results in disruption of transport and loss of economy but also may harm people’s safety. Damages and losses cannot be completely avoided when the urban floods occur, nonetheless monitoring and assessing flood cases can help to reduce both damages and losses [3]. The timeliness and accuracy, as the requirements for preparing and monitoring urban flood disaster [4], are crucial parts of the relevant researches.
In general, methods for predicting and assessing flood information rely on the hydrodynamic models [5,6,7], which include one-dimensional (1D) numerical model, two-dimensional (2D) numerical model, mixture models, etc. Due to the fact that the 1D model cannot be adequate to express the floodwater spilling into the urban areas, people would like to employ the 2D model or mixture model for urban flood management [8,9]. Furthermore, using historical disaster data to assess the risk of flood is a practical approach with the advantages of briefness and fewer calculations [10,11]. However, these hydrodynamic models usually need the high-resolution topographic data in the study areas to support the process of modeling. The topographic data may contain highly irregular geometries from terrains, vegetation, and man-made buildings, which makes it difficult to obtain those data [12]. The method based on historical disaster data requires more data, such as the information on flood risk on a large scale and social economy [10]. It is undoubted that the requirements in the various data increase the difficulty of operating those methods. A lack of certain data may lead to the method failing or not running. In the recent decades, monitoring and assessing urban flood disaster by remote sensing technology have received increasing attention. This burgeoning technology, by virtue of its advantages of speediness and powerful spatial analysis capability, meet the requirement of urban flood management in a certain degree [13,14]. Some moderate-spatial-resolution satellite images, such as the moderate-resolution imaging spectroradiometer (MODIS) and Landsat, served to monitor and assess urban flood disasters [15,16]. With the satellite sensors developing, high-resolution and microwave remote sensing images also provided more methods for the urban flood management [17,18]. However, due to the inherent limitations of remote sensing data acquisition that satellite images are obtained at a fixed time, these methods based on remote sensing technology are more suitable for assessment of pre-disaster risk [19,20] and post-disaster damages [21], while they do not meet the requirements of real-time flood disaster monitoring.
Except for basic function, urban surveillance video has gained concern in many other fields, such as behavior understanding [22,23] and target tracking [24,25], for its advantages of high temporal resolution, easy access, and moderate spatial scale. Also, some researchers had a try to monitor flood disasters using the surveillance video [26,27,28,29]. Lai et al. [26] converted video image into the HSV (hue, saturation, and intensity) color system (spatial domain), and checked the histogram of saturation/intensity to monitoring flood information. However, this method only judged whether floods occurred rather than extracting the inundated areas. Moreover, Lo et al. [27] and Borges et al. [28] extracted the inundated areas on the basis of the color characteristic. They counted and summarized the common visual feature of the water surface, and accorded to this feature to extract inundation. Miguel et al. [29] improved the features on the basis of the color characteristic and introduced size and edge density into the extracting method. However, these methods extract the inundated area based on the color or grayscale feature, which is uncertain for extracting the inundation caused by the urban flood. Various changes in actual conditions, such as illumination, surrounding ground objects and acquisition angles may cause poor results. For flood monitoring problem using surveillance video, there is no explicit and effective way to detect flood via video processing techniques [26].
Generally, monitoring urban floods includes extracting the inundated areas, the types of inundated objects, the depth of water, etc. In this paper, we present an inundated area extraction method based on raindrop photometric model (RPM). The proposed method extracts water covered areas from the variation tendency, which is caused by raindrops in the time series images. Then the inundated areas can be refined by spatial constrained information from video background images. The inundation information obtained from the surveillance video would provide support for predicting and monitoring the urban flood disaster. To evaluate the effectiveness of the proposed method from various aspects, discernibility analysis, comparison of supervised classification and precision evaluation are employed in the discussion.

2. Methods

The proposed method mainly includes two parts: (1) extracting the water surface, and (2) refining inundated areas with spatial information. Part 1 aims to detect the undetermined water covered areas in the video scene, and part 2 combines spatial information with the results of part 1 to attain the inundated areas accurately. The flowchart follows in Figure 1.

2.1. Raindrop Photometric Model (RPM)

The RPM, proposed by Garg in 2004 [30,31], would initially be targeted against the “rain line” phenomenon, which was caused by the persistence of vision in the camera when raindrops pass in the front of the camera. Due to the precise explanation of raindrops, this model was frequently used to detect or remove raindrops in the video images [32,33,34,35,36]. This paper, considering the similarity between the rain dropping into the water surface and “rain line” in the video, improved the RPM and extended its application to extracting the inundated areas.
RPM considers raindrops to be a set of randomly distributed water droplets whose shape present as spheres or ellipsoids. The raindrops optically show up as a refraction and reflection in the image. The light refracted by the raindrops will irradiate the camera directly so that raindrops-covered parts are often much brighter than the background [30,31,37]. In the video images taken in the rain condition, a positive and instantaneous fluctuation occurs in the pixels affected by the raindrops, as shown in Figure 2 and Figure 3.
To locate the pixels covered by raindrops in the nth frame from the time series images, it is necessary to consider whether the each pixel’s digital number (DN)—the brightness value of a pixel at the digital image, at the n − 2th, nth and n + 2th frame, meet the constraint as
D N 1 = D N n D N n 2 = D N n D N n + 2 > C 1
where C 1 is a threshold that indicates the minimum amount of pixel change, whose purpose is to eliminate noise interference of the pixels in the image.

2.2. Water Surface Extraction Based on the RPM

For inundated area extraction, it is a key issue to detect the water surface in the video images. When raindrops fall on the water surface, the surface will be affected by the kinetic energy of raindrops under gravity, and then the affected surface will be out of shape as a small groove. Different from the flat water surface, the small groove causes a specific light’s reflection shown in Figure 4. Moreover, when the ground is only wet rather than being inundated, the water flow above ground is not enough to produce this phenomenon. The deeper the water surface is and the heavier the rains occur, the more obvious this phenomenon becomes on the reason of the raindrops and water surface’s shape change increasing.
Only the water surface produces the above phenomenon, so it can be received from its variation tendency. As the specific reflection, spectral changes for the pixels covered by water surface are similar to that of raindrops-covered in the time series images. Besides, it has two individual characteristics: (1) the intensity fluctuation may be positive or negative due to different lighting conditions and observation angles while there is only positive intensity in raindrop monitoring; (2) the covered pixels’ DN value will return to the original value within a short time. When moving objects pass through the scene, a similar DN change may happen in the time series images. Different from the raindrops falling on the water surface, the change will sustain dozens of frames instead of a few frames because of the size of moving objects. Therefore, we can optimize the constraints to detect the water surface.
I 1 = | I n I n 2 | = | I n I n + 2 | > C 1
I 2 = | I n + 2 I n 2 | < C 2
where C 1 is the minimum change in light intensity to exclude video’s noise, and C 2 is the maximum change in the I before and after the water surface deformation. C 2 is a key parameter to preclude interference from moving objects, such as pedestrians and vehicles. I is the intensity of the pixel, it represents the degree of bright and is calculated as:
I = ( R + G + B ) / 3
where R , G , and B is the DN value of pixel in the red, green and blue bands.
Furthermore, to eliminate other interference factors, such as camera shake and leaf swing, it is necessary to add a constraint of times, which refers to the count times that a pixel is treated as the water surface, and the pixel can be detected as the real water surface covered when the frequency value is over a given threshold.

2.3. Inundated Areas Refinement with Spatial Constrained Information

Typically, urban surveillance cameras are mounted on the fixed positions along the road, and surveillance images usually present as a street scene with a mixture of various features. As Figure 5 shown, a typical urban surveillance image is mainly composed of a road, vegetation, buildings, and random pedestrians and vehicles etc.
When a flood occurs, inundation mostly is concentrated in low terrain areas, such as roads and those areas near the road. Surrounding vegetation and buildings are the stereoscopic objects at the spatial scale. So it is impossible that the inundated areas appear in the region of vegetation and buildings. The ground around the vegetation and buildings has more probabilities to be inundated. Thus, spatial constraints can be employed to reclassify water surface in the road range as inundated areas. This constraint can reduce intervention of the surrounding vegetation and buildings, and make the method’s process focus on the inundated places in maximum probability, which includes two steps: (1) obtaining video background image and (2) extracting road ranges based on linear perspective features. Then the inundated regions are obtained by intersecting water surface and road range areas.

2.3.1. Video Background Image Extraction

The background information refers to the immutable objects in the video. The phenomenon, moving pedestrians and vehicles appear on the road sporadically, makes it difficult to extract road range. It can be treated as foreground information and need to eliminate. Currently, several algorithms have been used to generate background images, including the multi-frame image averaging method, statistical histogram method, statistical median method, and continuous frame difference method.
For the above methods of background extraction, multi-frame image averaging method is suitable for low-cost general applications, especially when the quality of camera is not very good [38,39]. However, its disadvantage is tailing effects for fast moving objects. Statistical histogram method and statistical median method use the principles of statistics to obtain the background information. These two methods have certain requirements for video duration [40,41]. The difference is that statistical histogram method and statistical median method separately use mode and median as the index. The continuous frame difference method needs a stable optical condition in the video scene [42]. As mentioned above and considering the actual scene, the probability that pedestrians or vehicles of the same color appear consecutively and pass along the same path is relatively low, which has little influence on the statistical histogram method. Therefore, the statistical histogram method is employed in this study. When the times that each DN value appears in a particular period in each pixel position are counted, the DN value with the most occurrences is selected as the background value. To eliminate the effect of noise in the background image, the final background value will be calculated by weight as
B a c k g r o u n d ( i , j ) = ( k = 1 N D N k ( i , j ) × C k ) ÷ k = 1 N C k
B a c k g r o u n d ( i , j ) is the DN value of the background image at the pixel. For the image coordinate ( i , j ) , each DN value’s present frequency of all the frames in the video can be counted, N is the top rank number sorted by descending. When k varies from 1 to N, the correspond DN value at the k rank can be present as D N k ( i , j ) . C k refers to the number of occurrences of the D N k .

2.3.2. Road Range Extraction Based on Linear Perspective Features

When video background images are ready, the road range can be extracted by the features such as colors, textures, and road lines. Comparing other objects, which have different spectral and texture features in various scenes, road lines can be easily detected with good stability. The procedure for road lines extraction [43,44] involves three stages: (1) image threshold segmentation; (2) Canny edge detection and (3) Hough transformation extracting line features. The first stage is to simplify the information of the video image and emphasize the line features. The second and third stages use the image processing algorithms to extract the line features.
Maximum entropy threshold method has high effectiveness and is employed in our method. This segmentation method, based on the maximum entropy principle, uses both spatial information as well as gray-level distribution [45]. It is sensitive to the image’s high luminance value region and suitable for this experiment’s needs [46]. Canny edge detection and Hough transformation, as the traditional methods in picture processing, have great influence and popularity. Canny edge detection, introduced by Canny in 1986 [47], is a multistage edge detection algorithm, which also proposed the computation theory of edge detection. The theory includes three codes: getting more edge, accurate positioning and marking at a time. Those strict definitions make Canny method become one of the most stable and effective methods of edge detection. Hough transformation is proposed by Hough [48] and used to detect the curve which can be described by function relation, such as line, circle parabola and ellipse. Its insensitivity towards the broken line meets the requirement of the proposed method.
For the urban surveillance video, the farther the camera is installed, the smaller size of objects in the image is. This imaging rule is due to the image size of the object on the retina of humans’ eyes being inversely proportional to the distance. So the two sides of a road converge into one point in the distance, which is called “Foreshortening” or linear perspective, shown in Figure 6. The features of linear perspective are often used to indicate the object interval, including depth information in the scene [19].
In Figure 6b, the straight lines of the road converge on one point, which is defined as Vanishing Point (VP). The lines that cross the vanishing point are defined as Vanishing Lines (VL). Based on the results of road lines extraction, the lines can be identified as algebraic expression and their cross-points can be calculated further. The point with the most convergence is the VP of road lines, and the VP and the road lines connecting VP are recorded. There are two conditions, shown in Figure 7, among which the VP is located in the middle of road lines or at the side of road lines. In response to the first condition, the areas which start from the vertical line of VP and ends up with the outermost road lines or image boundary are detected as the road ranges. In another condition, the two sides on the basis of the vertical line of VP in the image are detected, and the areas which start from the road line nearest to the vertical line of VP and ends up with the outermost road lines or image boundary are detected as the road ranges. Based on previous processing results, the interference of surrounding vegetation and building is less and can be neglected. Then the water surface in the road range can be refined to inundated areas.

3. Experiment and Discussion

3.1. Study Area

Wuhan is located in the middle and lower reaches of the Yangtze River in China. Due to its subtropical monsoon humid climate, it has a relatively large amount of rain during the early summer. In the summer of 2010, 2013 and 2016, Wuhan experienced severe urban floods. Considering the availability of surveillance images, two experimental locations (location 1 and 2), which were distributed on the campus of China University of Geosciences (Wuhan), were selected. These two locations had different traffic and sharpness levels, and the corresponding video image’s acquisition angle and quality were representatives.
Videos were acquired on 25 April 2017, whose weather conditions in the morning were cloudy. It began to rain around at 9:00 a.m. Experiment selected three time periods in this day, which separately represented non-water, wet and inundated conditions. The non-water video was used to extract the road ranges for constraint, and the video in inundated condition served as the basis of the proposed method to extract inundated areas. Finally, the video in wet condition was used to test the method’s discernibility about wet and inundated areas. The properties of the video images are shown in the following Table 1.

3.2. Experimental Results

3.2.1. Road Range Extraction

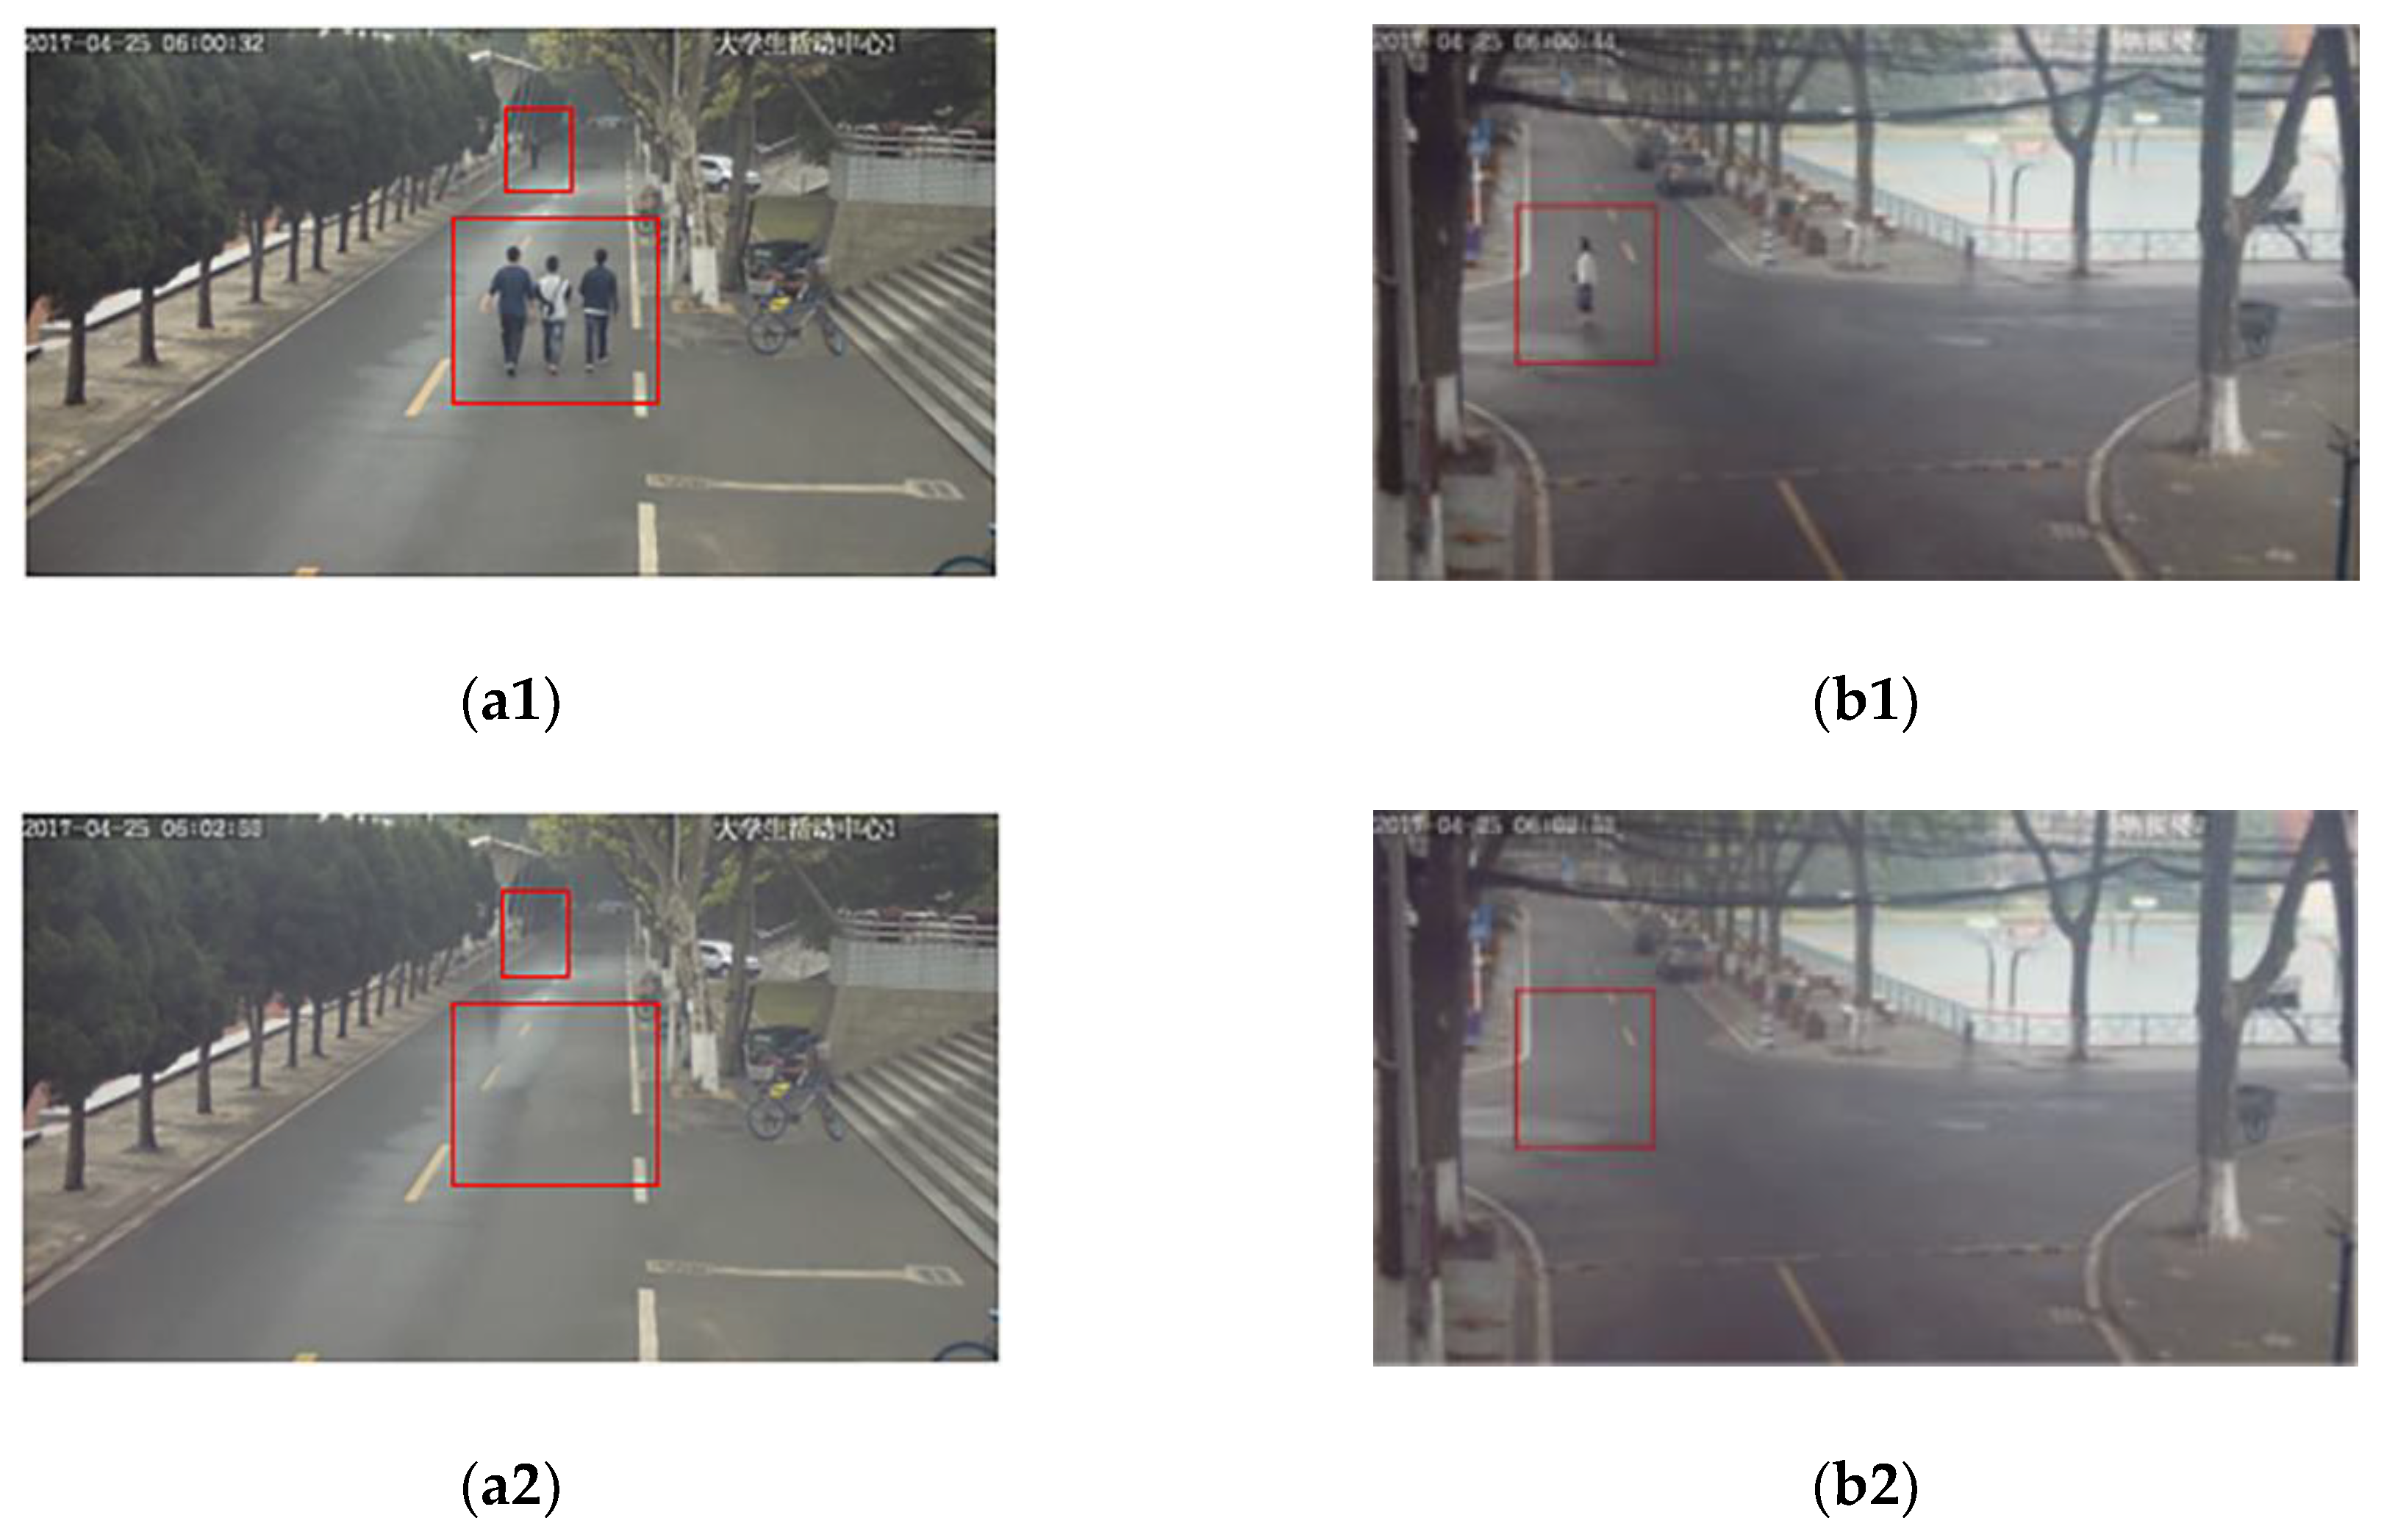
The background images of the non-water video were extracted from two videos of different locations (shown in Figure 8). The information of moving pedestrians and vehicles in the original video images (the areas marked by the line box in Figure 8a1,b1) was eliminated by extracting the background images. The background images only included immutable factors, which was ideal for road range extraction. It meant that no matter how many pedestrians and vehicles there are in the videos, the proposed method finally had an ideal background image without random moving factors.
As the key of road range extraction, the results of threshold segmentation greatly affected the accuracy of extraction [49]. The experiment used maximum entropy threshold method to reduce the image’s information on the basis of background images. Then, Canny edge detection and Hough transformation were employed to get the linear elements in the images. Finally, the road ranges were extracted by the method which was described in Section 2.3.2, following as Figure 9.
The above results showed the three key steps of the road ranges extraction (threshold segment, linear elements extraction and road ranges). Through the maximum entropy threshold algorithm, the diversity of information greatly decreased in the images, shown in Figure 9a1,a2. The images appeared on binarization, and the linear features that took on the shape of a road clearly appeared. They provided the conditions to extract the road linear feature further. After the Canny edge detection and Hough transformation, the major lines in the images were emphasized. In addition to the road’s linear features required, shown in Figure 9b1,b2, image identification, wires, and tree stem also showed up similar linear features and would be detected. These linear segments most often appeared as horizontal and parallel form, which were significantly different from the road linear factors. They would be eliminated in the next step, which had fewer influences on the process of road range extraction (shown in Figure 9c1,c2). Via road line features and the linear perspective principle, the road ranges, obtained by the proposed method were identical to the actual road ranges. The extraction results, extracted from foreshortening theory, were aligned with humans’ visual inertia, which covered road and adjacent cities. They accorded with the trait that inundated areas would appear on the flat and low places. It offered a reliable spatial constraint and made the proposed method focus on the low terrain areas with more which were likely to be inundated.

3.2.2. Inundated Area Extraction based on RPM

Combined the road ranges in the images as spatial constraints, the water surface calculated by RPM in the road range could be defined as inundated areas. Exactly as Section 2.2 described, the water surface’s threshold of frequency was determined according to the duration of the input video image. Through testing in the different threshold of frequency, it could be recognized that the frequency of water surface identified and the number of video frames existed positive correlation. That was to say, the threshold of frequency should be decided according to the numbers of video frames. When the ratio of them was excess, water surface could not be monitored completely so that its accuracy would decrease. In contrast, the deficient ratio would cause that the changed pixels by camera shaking and leaf swing were extracted, further resulting in misclassification. It was appropriate that the ratio was determined as about 1:20 in the method (Figure 10).
Observation of the original image and extraction results illustrated the inundated area under the trees on the left side of the image had been relatively wholly extracted in the location 1. The trees were excluded and the disturbance caused by vegetation had been effectively avoided. Meanwhile, the motionless objects, such as the vehicles in the location 1, were effectively eliminated for the insensitivity toward the proposed method. On the other hand, because the proposed method relied on the visible information in the video, those areas which were sheltered by mutable objects could not get efficient handing and prediction. For the wet and inundated areas, it could be observed that the middle parts in the roads, which were wet and no inundation, were not considered as inundated areas at the results.
Besides, the proposed method was sensitive to moving objects, which also caused slight noise in the results. The noise came from the shake of the camera caused by wind and rain. It is an unavoidable factor when the videos were acquired on a rainy day. However, the slight noise is in the form of discrete points appearing on the result, which had great difference from inundated areas. At the bottom part of the two images, inundated areas were clearly extracted and affected less by other factors. The reason for this phenomenon was that the bottom part of images closed to the camera, which led to increased image sharpness and improved the used method.

3.3. Discussion

To test our method, this paper evaluated from three aspects. First one inspected the discernibility of wet and inundated conditions. The second was to compare with the supervised classification based on the color. Last was the precision evaluation which used the confusion matrix.

3.3.1. Discernibility Analysis

For monitoring urban flood, wet and inundated areas were two different degrees which were easy to confuse. The wet areas occurred at the beginning of raining and had little impact. As the rainfall increased, some of the ground was inundated and interfered with people’s lives. Effectively distinguishing the two conditions was one of the most important indexes for evaluating the method. To prove the actual difference between the two classes in the video and analyze the discernibility of the proposed method, the experiment chose the video in the wet condition as the comparison. We selected the interest region of size 50 × 50 in the two different time videos in the location 1. The interest region was set in the previous video (the wet video) and inundated in the latter video (the inundated video). Ten pictures of the interest region, which have two frames interval with each other, were counted from two videos. Furthermore, we selected the four vertices, the midpoint of four sides, and the center point in the interest region as the sample point, following as Figure 11.
The intensity values of nine sample points were counted and expressed into a line chart. The changing trend of these points’ intensity value was displayed obviously, shown in Figure 12.
Comparing the two line charts, there was the obvious difference between the changing trends of two condition. For the inundated area, the intensity value appeared intense undulations along with time. The intensity value was on the standard of the certain value and increased or decreased. Moreover, this change lasted for several frames (twenty-four frames per second), which was a short time. The change trend was identical to the two individual characteristics described as Section 2.2. Furthermore, with the rainfall intensity enhancing, the amplitude and frequency of the change would increase distinctly. In contrast, the intensity value of wet areas had little undulations along with time. The most lines were smooth and rarely varied. Some changed under the influence of the moving objects. Due to the size of moving objects was much larger than the raindrop, the change of intensity value usually kept up a long time. It covered a lot of frames and presented as a stair at the line chart.
Reflected in the video, the intensity value of wet areas was regarded as the static state while the intensity value of inundated areas was dynamic. The difference between the static and dynamic forcefully supported the proposed method to distinguish wet and inundated areas effectively. In fact, the proposed method not simply considered the road ranges as the inundation and excluded the adverse effect of the wet areas in the results (Figure 10). Furthermore, experiment tested the videos whose road ranges were wet and not enough to form large inundation, shown in Figure 13a1,b1, and set the same method to process videos and obtained the results, shown in Figure 13a2,b2.
The proposed method avoided the wet areas in the video. There were fewer areas deemed as the inundation. Also, the extracted areas were slightly inundated and had the tendency to become the serious inundated areas. The wet and inundated areas had the similar characteristic in the color, which displayed darker color than non-water and reflected the surrounding objects. It was so difficult to distinguish them based on the color only. The proposed method, especially the RPM, counted the specific changed trend in the video streaming. The dynamic information of the inundated areas caused by the rain in the video had a great distinction from the wet areas which was static and ensured the method extract the inundated areas under the inference of wet areas.

3.3.2. Comparison of Spectral Classification

On the other hand, the experiment used the supervised classification for extracting the inundated areas in the rainy image. The background images, which had no moving pedestrians and vehicles were set as the basic images. Maximum likelihood classification method, a simple and widely used method for classification, was employed in the process. The classification method built five samples in the rainy images, including the inundated areas, non-inundated areas in the ground, building, vegetation, and sky. Then classifier classed the pixels into five classes according to the color characteristic. It was to simulate the existing extracting methods based on the color. Finally, the extracted inundated area was solely presented from the classification results for analysis and evaluation (shown in Figure 14).
In the results of supervised classification, the part (1) was the caption text about the video and was considered as the inundated areas. Generally, the caption text was bright and similar to the inundation in the spectrum, which caused the misclassification. In the part (2) and (3), the varying light reflection of rains on the road surface elicited a large number of the phenomenon of “the same object with different spectrum” and “the different objects with the same spectrum” within real-time images. The bright and dark blocks mixed in the image, which decreased classification accuracy. Otherwise, the vehicle window in the part (4) reflected the sky and surrounding objects, similar to the reflection of the water surface, which made the misclassification in the classification. In supervised classification, if the water in the area was taken as a sample, it would probably lead to the misclassification of surrounding objects. This object uncertainty also made it impossible to establish representative samples within a traditional supervised classification process. Samples of different scenes, times, and traffic in the view of the single camera must be manually selected according to producers’ experience, which was inconsistent with the needs for real-time, rapid applications of urban flood disaster monitoring. Individuality caused by different objects was also the primary reason supervised classification was not seriously considered.
Compared with supervised classification, the proposed method used the specific characteristic of inundated areas instead of the spectral characteristic. It avoided the uncertainty from the objects’ spectral features in the rainy days and make use of the dynamic information from video. Moreover, the accuracy of results enhanced in a degree through the spatial constraint. On the whole, the experiment proved that this method was able to extract inundated areas quickly and accurately. The individual phenomenon caused by rainfall should be used in the algorithm so that the bad weather would not affect the algorithm’s validity.

3.3.3. Precision Evaluation

To quantitatively analyze the accuracy of the above two methods further, the extraction results of different methods were compared with the reference results selected by human interpretation and field trips. The measure of overall classification accuracy (OA), average producer accuracy (APA), average user accuracy (AUA), and Kappa coefficient based on confusion matrices were used to assess the method. All pixels in the image included two classes in the extraction result representing inundation and non-inundation respectively. Therefore, the confusion matrix was a 2 × 2 matrix whose element p(i, j) represented the proportion of area in the extracting class i and the reference class j. OA, APA, AUA, Kappa were calculated according to the corresponding formulas based on the confusion matrix [50,51], shown as Table 2.
The OA, APA, and AUA described classification accuracy of inundated areas from different perspectives, while the Kappa coefficient determined the coincidence degree between the two figures. As shown above, the inundated areas obtained from the proposed method had a larger improvement than that of the traditional classification method based on the spectral characteristic. The two key indexes, OA and Kappa, represented the overall accuracy of the whole classes. It was clearly that these two indexes of the proposed method were better than the classification method’s. Based on the above analysis, we concluded that the proposed method had strong ability to distinguish the wet and inundated conditions. The changing characteristic in the time dimension, which was more reliable and had greater identification, were employed. The variation characteristic of video worked better than spectrum in inundated areas extraction.

4. Conclusions

This research aims to address the current predicting and monitoring methods’ real-time inadequacy during urban flood disasters, by adding urban surveillance video data as a supplement. Based on spatial constraint and the RPM, this paper proposes a method to extract inundated areas from urban surveillance video, whose feasibility is verified with two different study locations. Results show that the proposed method provides high reliability and avoids the interference caused by rains. Using the dynamic information makes the method truly distinguish the wet and inundated areas. This process was compared with the traditional supervised classification method, and visual interpretation was employed to establish a confusion matrix. The process evaluated the accuracy and identified the method’s current deficiencies. Experimental results demonstrated the method’s effectual extraction for inundated areas, which shows the good ability for disaster monitoring and assessment in the cities. The method’s theory, which uses the images’ change trait in time series instead of spectral characteristic, offers a new thought for urban floods monitoring.
The method in this paper achieves the higher accuracy when compared with the extracting method based on color characteristic. The results and various evaluations shows the feasibility of the proposed method. However, limitations do exist in the process of the proposed method. Firstly, the method in the paper employs the dynamic information in the rainy video. It means the proposed method is unable to function when it is not raining. Then the mutable objects, which rest on the video image over a long time, are considered as the stationary objects. The road ranges which are covered by those mutable objects are neglectful because of no information. Finally, most of the errors are caused by shaking of the camera. High requirements for the stability of camera are put forward.
The paper proves the feasibility of the method in the current inundated case. Future research will evaluate the various cases and videos to realize the universality, such as the heavier inundated condition. The method will be further refined to achieve greater practicality, which considers pedestrians’ tendency to avoid trampling water while walking, judge the field of rains through the interpretation of the trajectory of pedestrians, and correct for pedestrians’ interference with the RPM. On the other hand, it will further extract the inundated areas quantitatively. Though analyzing the ratio of the inundation acreages and the whole ground acreages, real-time predicting and monitoring the urban flood disaster will be achieved.

Supplementary Materials

The following are available online at https://www.mdpi.com/2073-4441/10/10/1332/s1, Video S1: Study videos location 1 wet, Video S2: Study videos location 1 inundated, Video S3: Study videos location 1 non-water, Video S4: Study videos location 2 inundated, Video S5: Study videos location 2, Video S6: Study videos location 2 non-water.

Author Contributions

Y.L., W.G. and C.Y. came up with the primary idea of this paper, then considered several methods of extraction. Y.L. and C.Y. conceived the idea for the project, and designing the approach, performing the experiments. W.G. offered proposals and improved the process of experiments. N.W. collected the correlative data. All authors participated in the editing of the paper.

Funding

This research received no external funding.

Conflicts of Interest

The authors declare no conflict of interest.

References

  1. Ziegler, A.D. Water management: Reduce urban flood vulnerability. Nature 2012, 481, 145. [Google Scholar] [CrossRef] [PubMed]
  2. Chen, Y.B.; Zhou, H.L.; Zhang, H.; Du, G.M.; Zhou, J.H. Urban flood risk warning under rapid urbanization. Environ. Res. 2015, 139, 3–10. [Google Scholar] [CrossRef] [PubMed]
  3. Schelfaut, K.; Pannemans, B.; Craats, I.V.D.; Krywkow, J.; Mysiak, J.; Cools, J. Bringing flood resilience into practice: The FREEMAN project. Environ. Sci. Policy 2011, 14, 825–833. [Google Scholar] [CrossRef]
  4. Li, J.L.; Cao, L.D.; Pu, R.L. Progresses on monitoring and assessment of flood disaster in remote sensing. J. Hydraul. Eng. 2014, 45, 253–260. [Google Scholar]
  5. Wang, M.Y.; Lei, X.H.; Liao, W.H.; Shang, Y.Z. Analysis of changes in flood regime using a distributed hydrological model: A case study in the Second Songhua River basin, China. Int. J. Water Resour. Dev. 2018, 34, 386–404. [Google Scholar] [CrossRef]
  6. Dottori, F.; Todini, E. Testing a simple 2D hydraulic model in an urban flood experiment. Hydrol. Process. 2013, 27, 1301–1320. [Google Scholar] [CrossRef]
  7. Fan, Y.Y.; Ao, T.Q.; Yu, H.J.; Huang, G.R.; Li, X.D. A Coupled 1D-2D Hydrodynamic Model for Urban Flood Inundation. Adv. Meteorol. 2017, 2017, 1–12. [Google Scholar] [CrossRef] [Green Version]
  8. Mark, O.; Weesakul, S.; Apirumanekul, C.; Aroonnet, S.B.; Djordjević, S. Potential and limitations of 1D modelling of urban flooding. J. Hydrol. 2004, 299, 284–299. [Google Scholar] [CrossRef]
  9. Chen, A.S.; Evans, B.; Djordjević, S.; Savić, D.A. Multi-layered coarse grid modelling in 2D urban flood simulations. J. Hydrol. 2012, 470–471, 1–11. [Google Scholar] [CrossRef] [Green Version]
  10. Huang, D.P.; Liu, C.; Peng, S.F. Progress on Assessment and Regionalization of Flood Risk. Prog. Geogr. 2007, 26, 11–22. [Google Scholar]
  11. Chen, H.R.; Wang, S.L. Research on Flood Risk Assessment Model at Regional Scale. In Proceedings of the Fourth International Conference on Intelligent Systems Design and Engineering Applications, Zhangjiajie, China, 6–7 November 2013; pp. 472–478. [Google Scholar]
  12. Meesuk, V.; Vojinovic, Z.; Mynett, A.E.; Abdullah, A.F. Urban flood modelling combining top-view LiDAR data with ground-view SfM observations. Adv. Water Resour. 2015, 75, 105–117. [Google Scholar] [CrossRef]
  13. Pradhan, B.; Shafiee, M.; Pirasteh, S. Maximum flood prone area mapping using RADARSAT images and GIS: Kelantan river basin. Int. J. Geoinform. 2009, 5, 11–20. [Google Scholar]
  14. Haq, M.; Akhtar, M.; Muhammad, S.; Paras, S.; Rahmatullah, J. Techniques of Remote Sensing and GIS for flood monitoring and damage assessment: A case study of Sindh province, Pakistan. Egypt. J. Remote. Sens. Space Sci. 2012, 15, 135–141. [Google Scholar] [CrossRef]
  15. Kuenzer, C.; Guo, H.; Schlegel, I.; Tuan, V.Q.; Li, X.; Dech, S. Varying Scale and Capability of Envisat ASAR-WSM, TerraSAR-X Scansar and TerraSAR-X Stripmap Data to Assess Urban Flood Situations: A Case Study of the Mekong Delta in Can Tho Province. Remote. Sens. 2013, 5, 5122–5142. [Google Scholar] [CrossRef] [Green Version]
  16. Zhang, F.; Zhu, X.L.; Liu, D.S. Blending MODIS and Landsat images for urban flood mapping. Int. J. Remote. Sens. 2014, 35, 3237–3253. [Google Scholar] [CrossRef]
  17. Giustarini, L.; Hostache, R.; Matgen, P.; Schumann, G.; Bates, P.D.; Mason, D.C. A change detection approach to flood mapping in urban areas using very high-resolution microwave remote sensing imagery. In Proceedings of the EGU General Assembly Conference, Vienna, Austria, 22–27 April 2012. [Google Scholar]
  18. Trigg, M.A.; Michaelides, K.; Neal, J.C.; Bates, P.D. Surface water connectivity dynamics of a large scale extreme flood. J. Hydrol. 2013, 505, 138–149. [Google Scholar] [CrossRef] [Green Version]
  19. Islam, M.M.; Sado, K. Development Priority Map for Flood Countermeasures by Remote Sensing Data with Geographic Information System. J. Hydrol. Eng. 2002, 7, 346–355. [Google Scholar] [CrossRef]
  20. Li, L.T.; Xu, Z.X.; Bo, P.; Liu, L. Flood risk zoning in China. J. Hydrol. Eng. 2012, 43, 22–30. [Google Scholar]
  21. Ding, Y.L.; Du, Z.Q.; Zhu, Q. Adaptive Water Level Correction Algorithm for Flooding Analysis. Acta Geod. Cartogr. Sin. 2013, 42, 546–553. [Google Scholar]
  22. Cristani, M.; Raghavendra, R.; Bue, A.D.; Murino, V. Human behavior analysis in video surveillance: A Social Signal Processing perspective. Neurocomputing 2013, 100, 86–97. [Google Scholar] [CrossRef] [Green Version]
  23. Vishwakarma, S.; Agrawal, A. A survey on activity recognition and behavior understanding in video surveillance. Vis. Comput. 2013, 29, 983–1009. [Google Scholar] [CrossRef]
  24. Kim, J.S.; Dong, H.Y.; Joo, Y.H. Fast and robust algorithm of tracking multiple moving objects for intelligent video surveillance systems. IEEE Trans. Consum. Electron. 2011, 57, 1165–1170. [Google Scholar] [CrossRef]
  25. Pantrigo, J.J.; Hernández, J.; Sánchez, A. Multiple and variable target visual tracking for video-surveillance applications. Pattern Recognit. Lett. 2010, 31, 1577–1590. [Google Scholar] [CrossRef]
  26. Lai, C.L.; Yang, J.C.; Chen, Y.H. A Real Time Video Processing Based Surveillance System for Early Fire and Flood Detection. In Proceedings of the Instrumentation and Measurement Technology Conference, Warsaw, Poland, 1–3 May 2007. [Google Scholar]
  27. Lo, S.W.; Wu, J.H.; Lin, F.P.; Hsu, C.H. Cyber Surveillance for Flood Disasters. Sensors 2015, 15, 2369–2387. [Google Scholar] [CrossRef] [PubMed] [Green Version]
  28. Borges, P.V.K.; Mayer, J.; Izquierdo, E. A probabilistic model for flood detection in video sequences. In Proceedings of the IEEE International Conference on Image, San Diego, CA, USA, 12–15 October 2008. [Google Scholar]
  29. Miguel, M.J.P.S.; Ruiz, C.R., Jr. A Flood Detection and Warning System Based on Video Content Analysis; Springer International Publishing: New York, NY, USA, 2016; pp. 65–74. [Google Scholar]
  30. Garg, K.; Nayar, S.K. Detection and Removal of Rain from Videos. In Proceedings of the EEE Computer Society Conference on Computer Vision and Pattern Recognition, Washington, DC, USA, 27 June–2 July 2004. [Google Scholar]
  31. Garg, K.; Nayar, S.K. When does a camera see Rain. In Proceedings of the IEEE Computer Society Conference on Computer Vision and Pattern Recognition, San Diego, CA, USA, 20–26 June 2005. [Google Scholar]
  32. Barnum, P.C.; Narasimhan, S.; Kanade, T. Analysis of Rain and Snow in Frequency Space. Int. J. Comput. Vis. 2010, 86, 256–274. [Google Scholar] [CrossRef]
  33. Calderara, S.; Piccinini, P.; Cucchiara, R. Vision based smoke detection system using image energy and color information. Mach. Vis. Appl. 2011, 22, 705–719. [Google Scholar] [CrossRef]
  34. Huang, K.Q.; Wang, L.S.; Tan, T.N.; Maybank, S. A real-time object detecting and tracking system for outdoor night surveillance. Pattern Recognit. 2008, 41, 432–444. [Google Scholar] [CrossRef]
  35. Yu, J.; Xu, D.B.; Liao, Q.M.; University, T. Image defogging: A survey. J. Image Graph. 2011, 16, 1561–1576. [Google Scholar]
  36. Zhang, X.P.; Li, H.; Qi, Y.Y.; Leow, W.K.; Ng, T.K. Rain Removal in Video by Combining Temporal and Chromatic Properties. In Proceedings of the IEEE International Conference on Multimedia and Expo, Toronto, ON, Canada, 9–12 July 2006. [Google Scholar]
  37. Zhang, Y.X. The rain drops are measured and get rid of the method to study in the video picture. Microcomput. Appl. 2007, 12, 16–20. [Google Scholar]
  38. Guo, H.X.; Dou, Y.L.; Tian, T.; Zhou, J.L.; Yu, S.S. A robust foreground segmentation method by temporal averaging multiple video frames. In Proceedings of the International Conference on Audio, Shanghai, China, 7–9 July 2008. [Google Scholar]
  39. Xie, Q.L.; Hong, C. Image Denoising Based on Adaptive Filtering and Multi-frame Averaging Filtering. Int. Conf. Artif. Intell. Comput. Intell. 2009, 3, 523–526. [Google Scholar]
  40. Kuo, C.M.; Chang, W.H.; Wang, S.B.; Liu, C.S. An Efficient Histogram-Based Method for Background Modeling. In Proceedings of the International Conference on Innovative Computing, Information and Control, Kaohsiung, Taiwan, 7–9 December 2009. [Google Scholar]
  41. Wang, H.Z.; Suter, D. A novel robust statistical method for background initialization and visual surveillance. In Proceedings of the Asian Conference on Computer Vision, Hyderabad, India, 13–16 January 2006. [Google Scholar]
  42. Qu, J.J.; Xin, Y.H. Combined continuous frame difference with background difference method for moving object detection. Acta Photonica Sin. 2014, 43, 213–220. [Google Scholar]
  43. Hou, D.X. Approach for road detection based on video image. Chin. J. Sci. Instrum. 2006, 1, 324–339. [Google Scholar]
  44. Lai, A.H.S.; Yung, N.H.C. Lane detection by orientation and length discrimination. IEEE Trans. Syst. Man Cybern. Part B Cybern. 2000, 30, 539–548. [Google Scholar] [CrossRef] [PubMed] [Green Version]
  45. Wong, A.K.C.; Sahoo, P.K. A gray-level threshold selection method based on maximum entropy principle. IEEE Trans. Syst. Man Cybern. 1989, 19, 866–871. [Google Scholar] [CrossRef]
  46. Zheng, L.P.; Li, G.Y.; Bao, Y. Improvement of grayscale image 2D maximum entropy threshold segmentation method. Int. Conf. Logist. Syst. Intell. Manag. 2010, 1, 324–328. [Google Scholar]
  47. Canny, J. A Computational Approach to Edge Detection. IEEE Trans. Pattern Anal. Mach. Intell. 1986. [Google Scholar] [CrossRef]
  48. Hough, P.V.C. Method and Means for Recognizing Complex Patterns. U.S. Patent US3069654A, 18 December 1962. [Google Scholar]
  49. Xu, LI.; Bao, F.; Qiao, G. Lane Detection Method Based on Two-Dimensional Renyi’s Entropy from MMS Images. Geomat. Spat. Inf. Technol. 2013, 1, 30–36. [Google Scholar]
  50. Foody, G.M. Status of land cover classification accuracy assessment. Remote. Sens. Environ. 2002, 80, 185–201. [Google Scholar] [CrossRef]
  51. Liu, C.; Razier, P.; Kumar, L. Comparative assessment of the measures of thematic classification accuracy. Remote. Sens. Environ. 2006, 107, 606–616. [Google Scholar] [CrossRef]
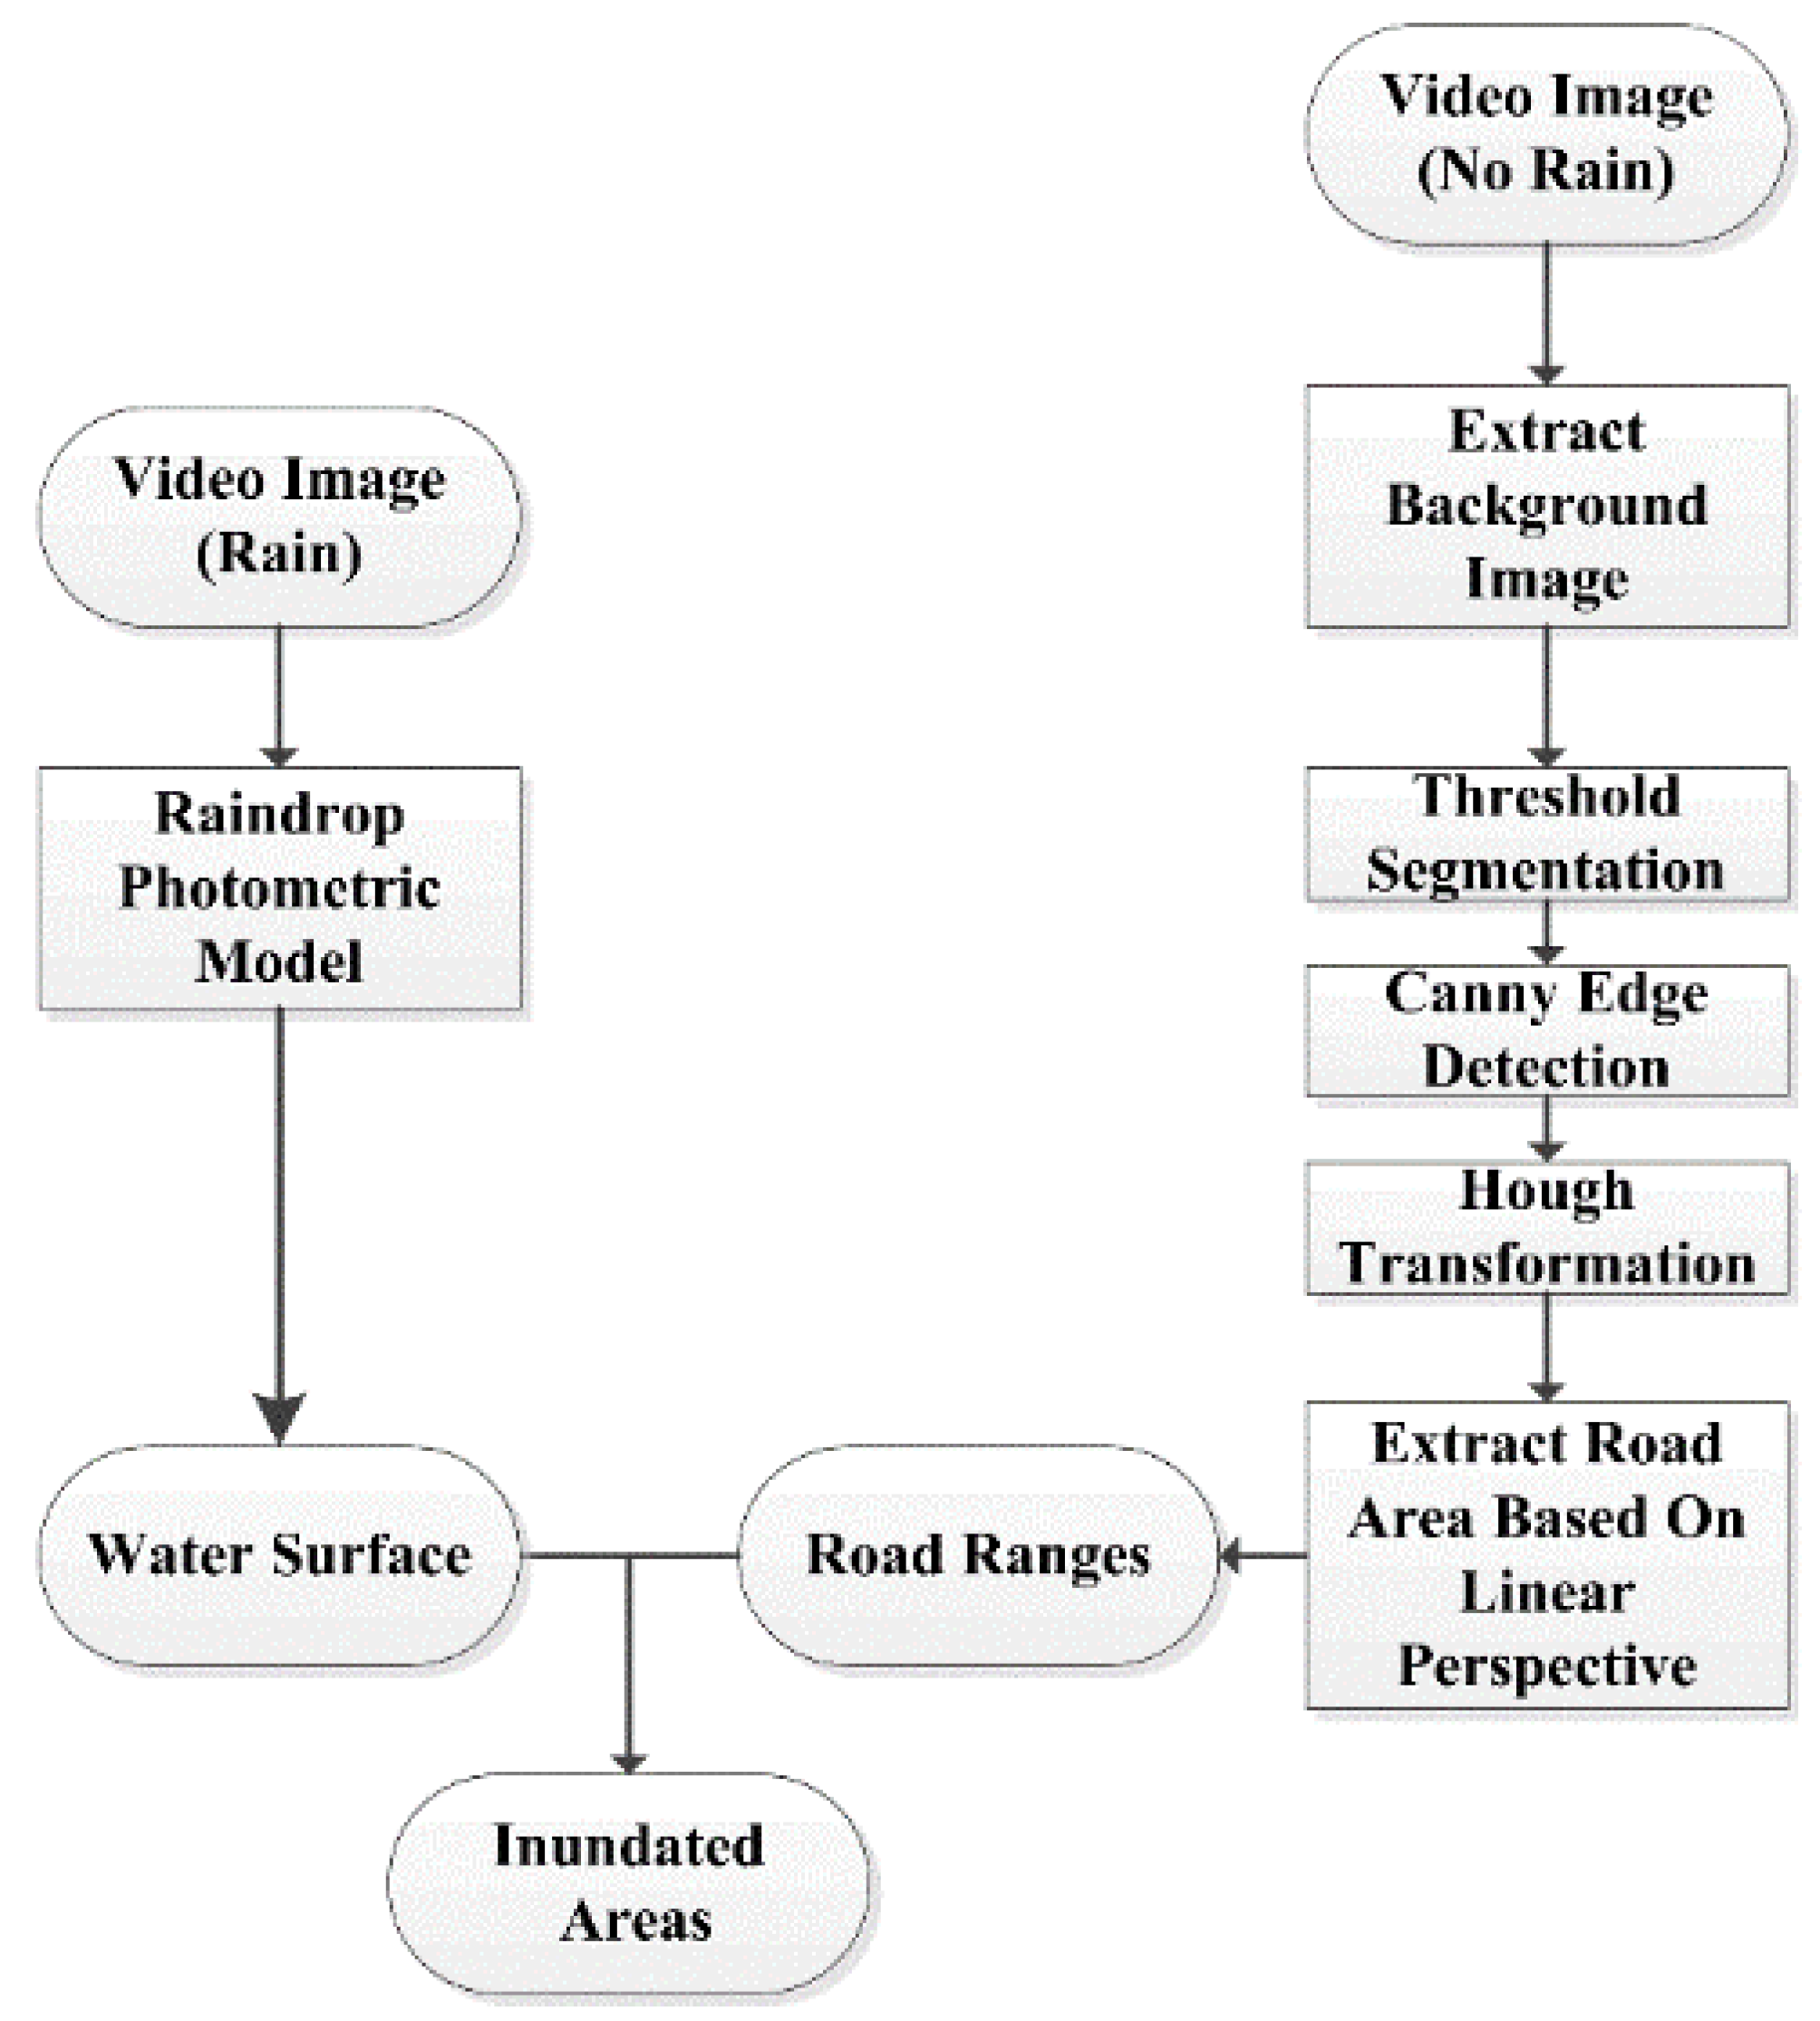
Figure 1. Flowchart of inundated areas extraction.
Water 10 01332 g001
Figure 2. Change of raindrop coverage pixels.
Water 10 01332 g002
Figure 3. Change of pixels in a torrential rainstorm.
Water 10 01332 g003
Figure 4. Raindrops landing on the water surface: before (a) and after (b) the rain drop.
Water 10 01332 g004
Figure 5. Surveillance video scene.
Water 10 01332 g005
Figure 6. Linear perspective: the performance of linear perspective in theory (a) and in the real image (b).
Water 10 01332 g006
Figure 7. Road ranges extraction.
Water 10 01332 g007
Figure 8. The results of background images extraction: Original Images (a1,b1) and Background Images (a2,b2).
Water 10 01332 g008
Figure 9. Road ranges extraction: Threshold segmentation (a1,a2), Linear elements (b1,b2) and Road ranges (c1,c2).
Water 10 01332 g009
Figure 10. Inundated areas extraction: Origin images (a1,b1) and Results of inundated area extraction (a2,b2).
Water 10 01332 g010
Figure 11. Image series in different conditions: wet areas (a) and inundated areas (b), and the position of sample points (c).
Water 10 01332 g011
Figure 12. Line charts of sample points’ intensity value: wet areas (a) and inundated areas (b).
Water 10 01332 g012
Figure 13. The extraction of the wet videos: Origin images (a1,b1) and Results (a2,b2).
Water 10 01332 g013
Figure 14. The results of supervised classification.
Water 10 01332 g014
Table 1. Video Data Properties.
Location 1Location 2
Start time6:00 (non-water)
12:00 (wet)
18:20 (inundated)
Duration30 s (each video)
WeatherCloudy (non-water)
Heavy rain (wet and inundated)
Cloudy (non-water)
Heavy rain (wet and inundated)
TrafficLight (non-water)
Heavy (wet and inundated)
Light (non-water)
Medium (wet and inundated)
Image clarityClearMedium
Inundation sizeLargeSmall
Table 2. Accuracy evaluation.
The Results of the Proposed MethodThe Results of Supervised Classification
OAAPAAUAKappaOAAPAAUAKappa
Location 179.04%68.81%78.54%0.789875.04%62.95%71.05%0.7404
Location 278.86%60.34%74.84%0.778774.42%60.49%67.42%0.7235