Identifying Surface Runoff Pathways for Cost-Effective Mitigation of Pollutant Inputs to Drinking Water Reservoir


Abstract
:1. Introduction
2. Materials and Methods
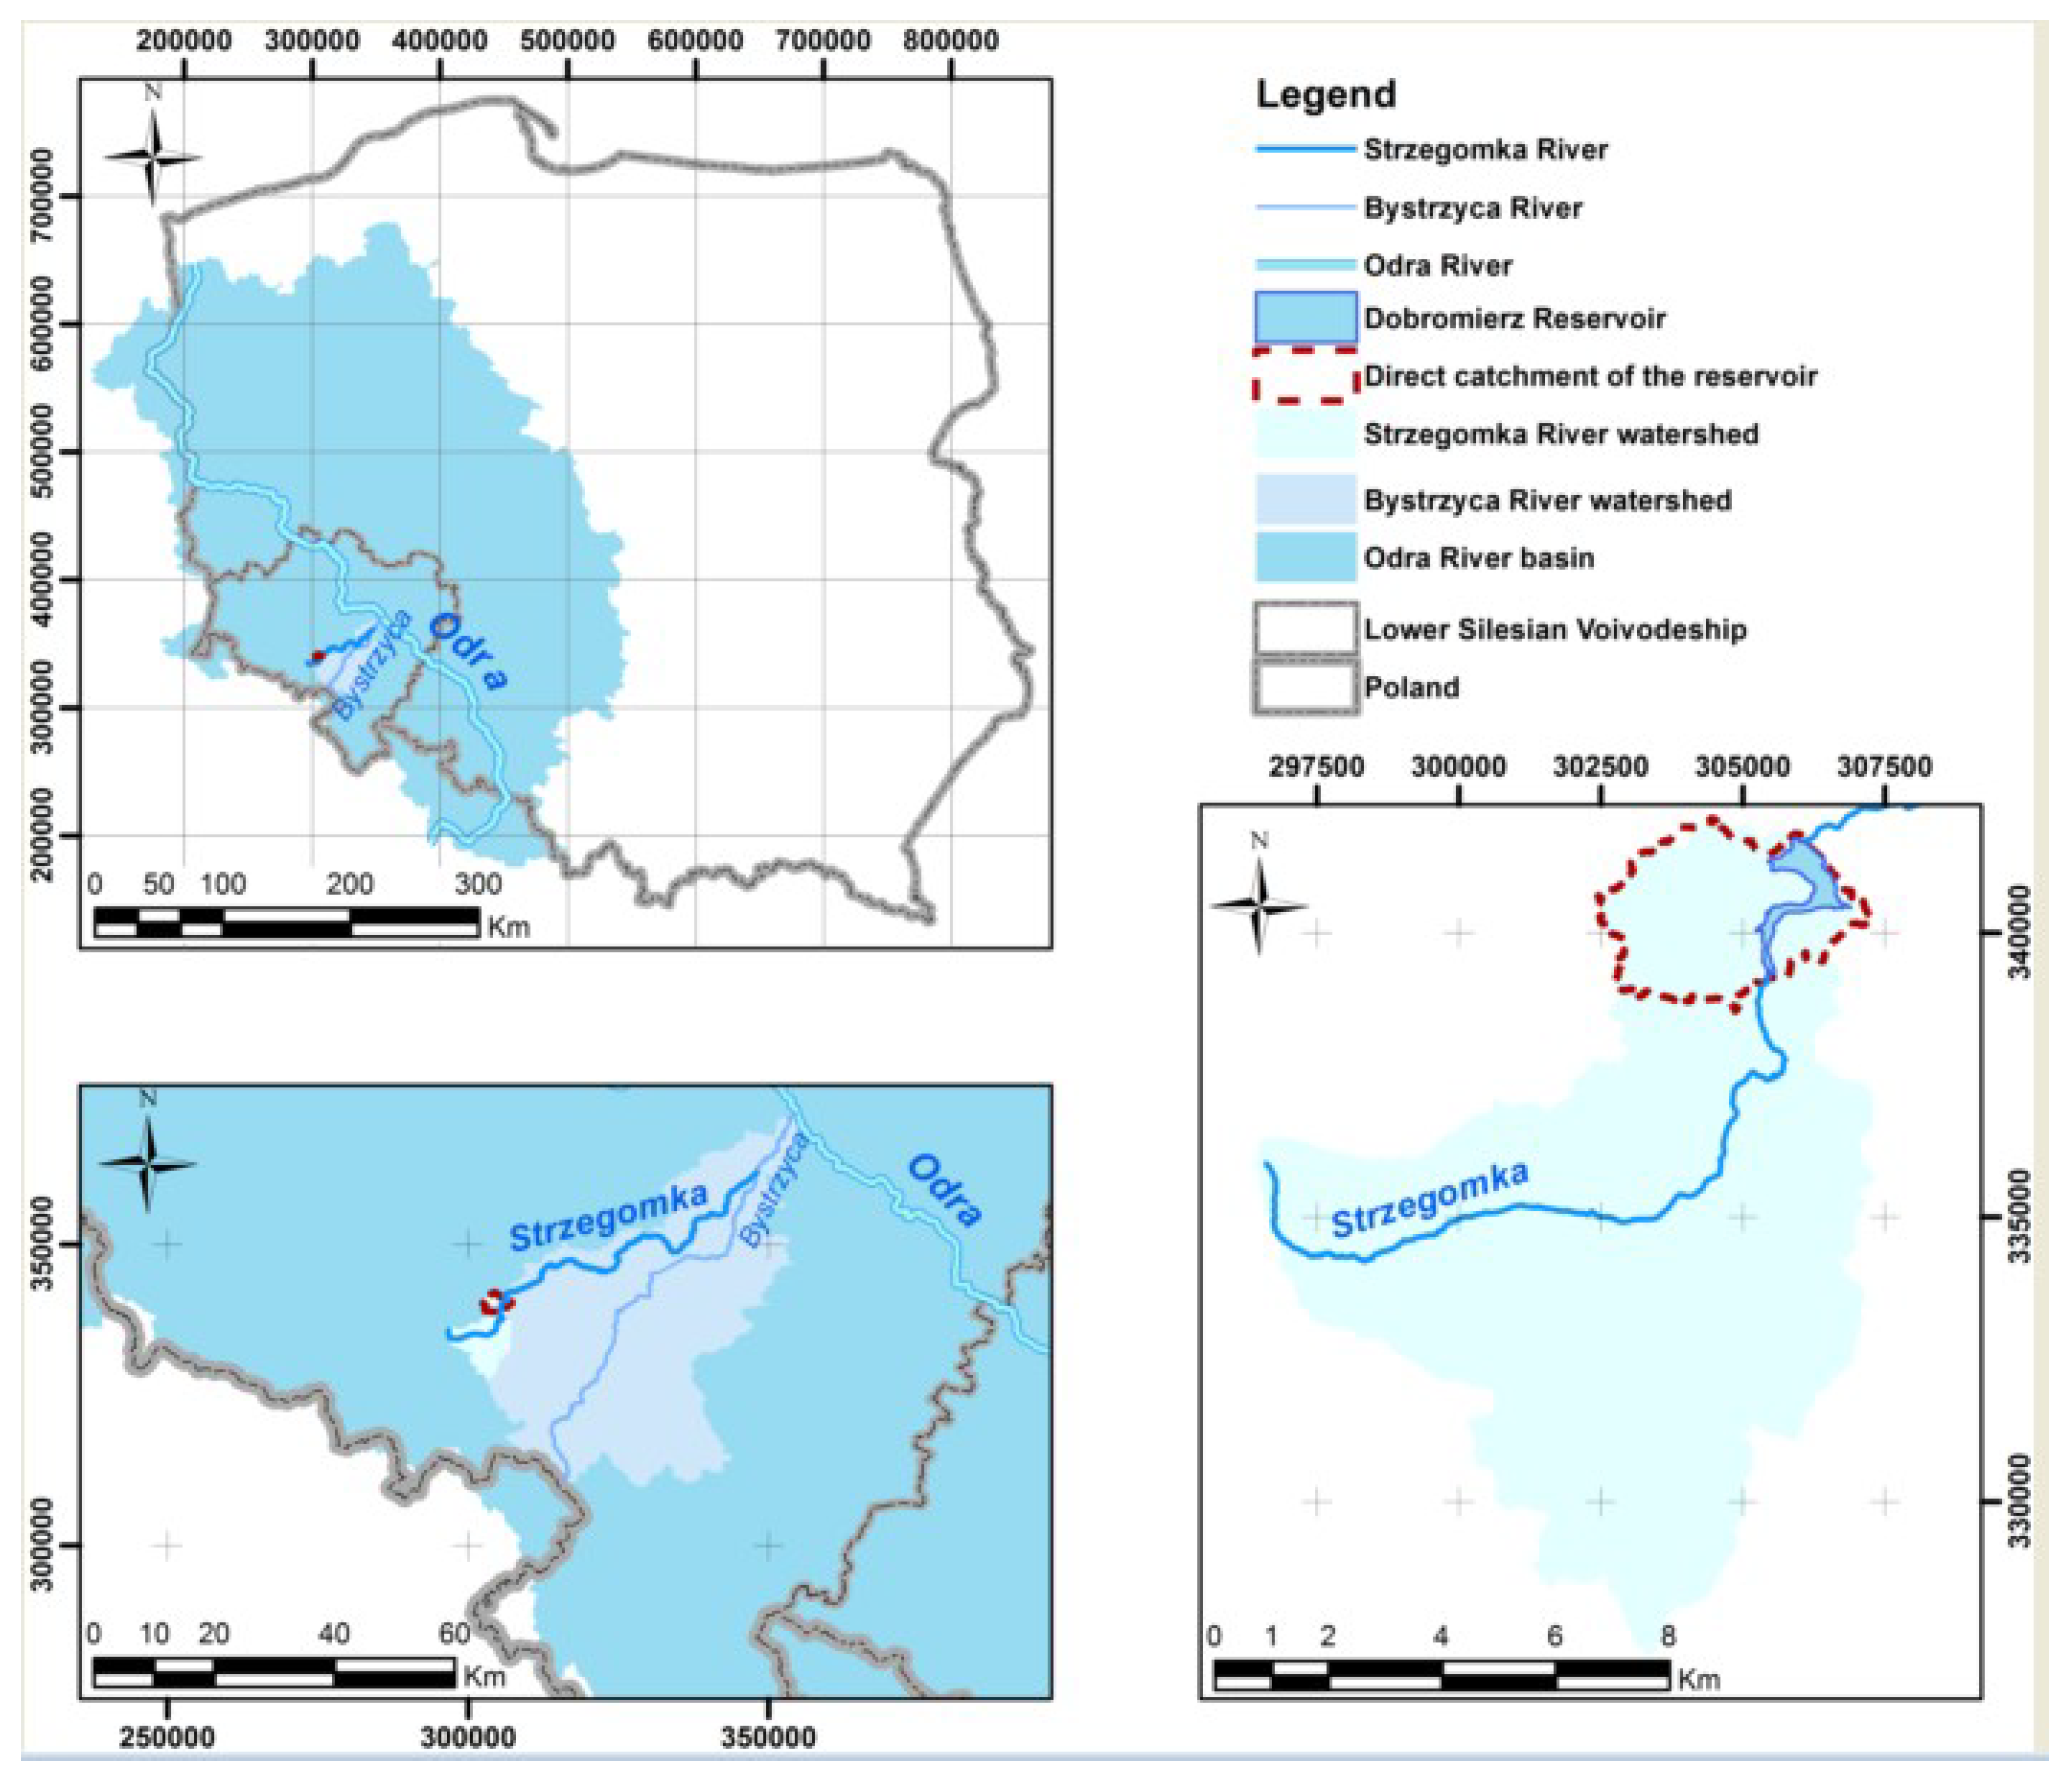
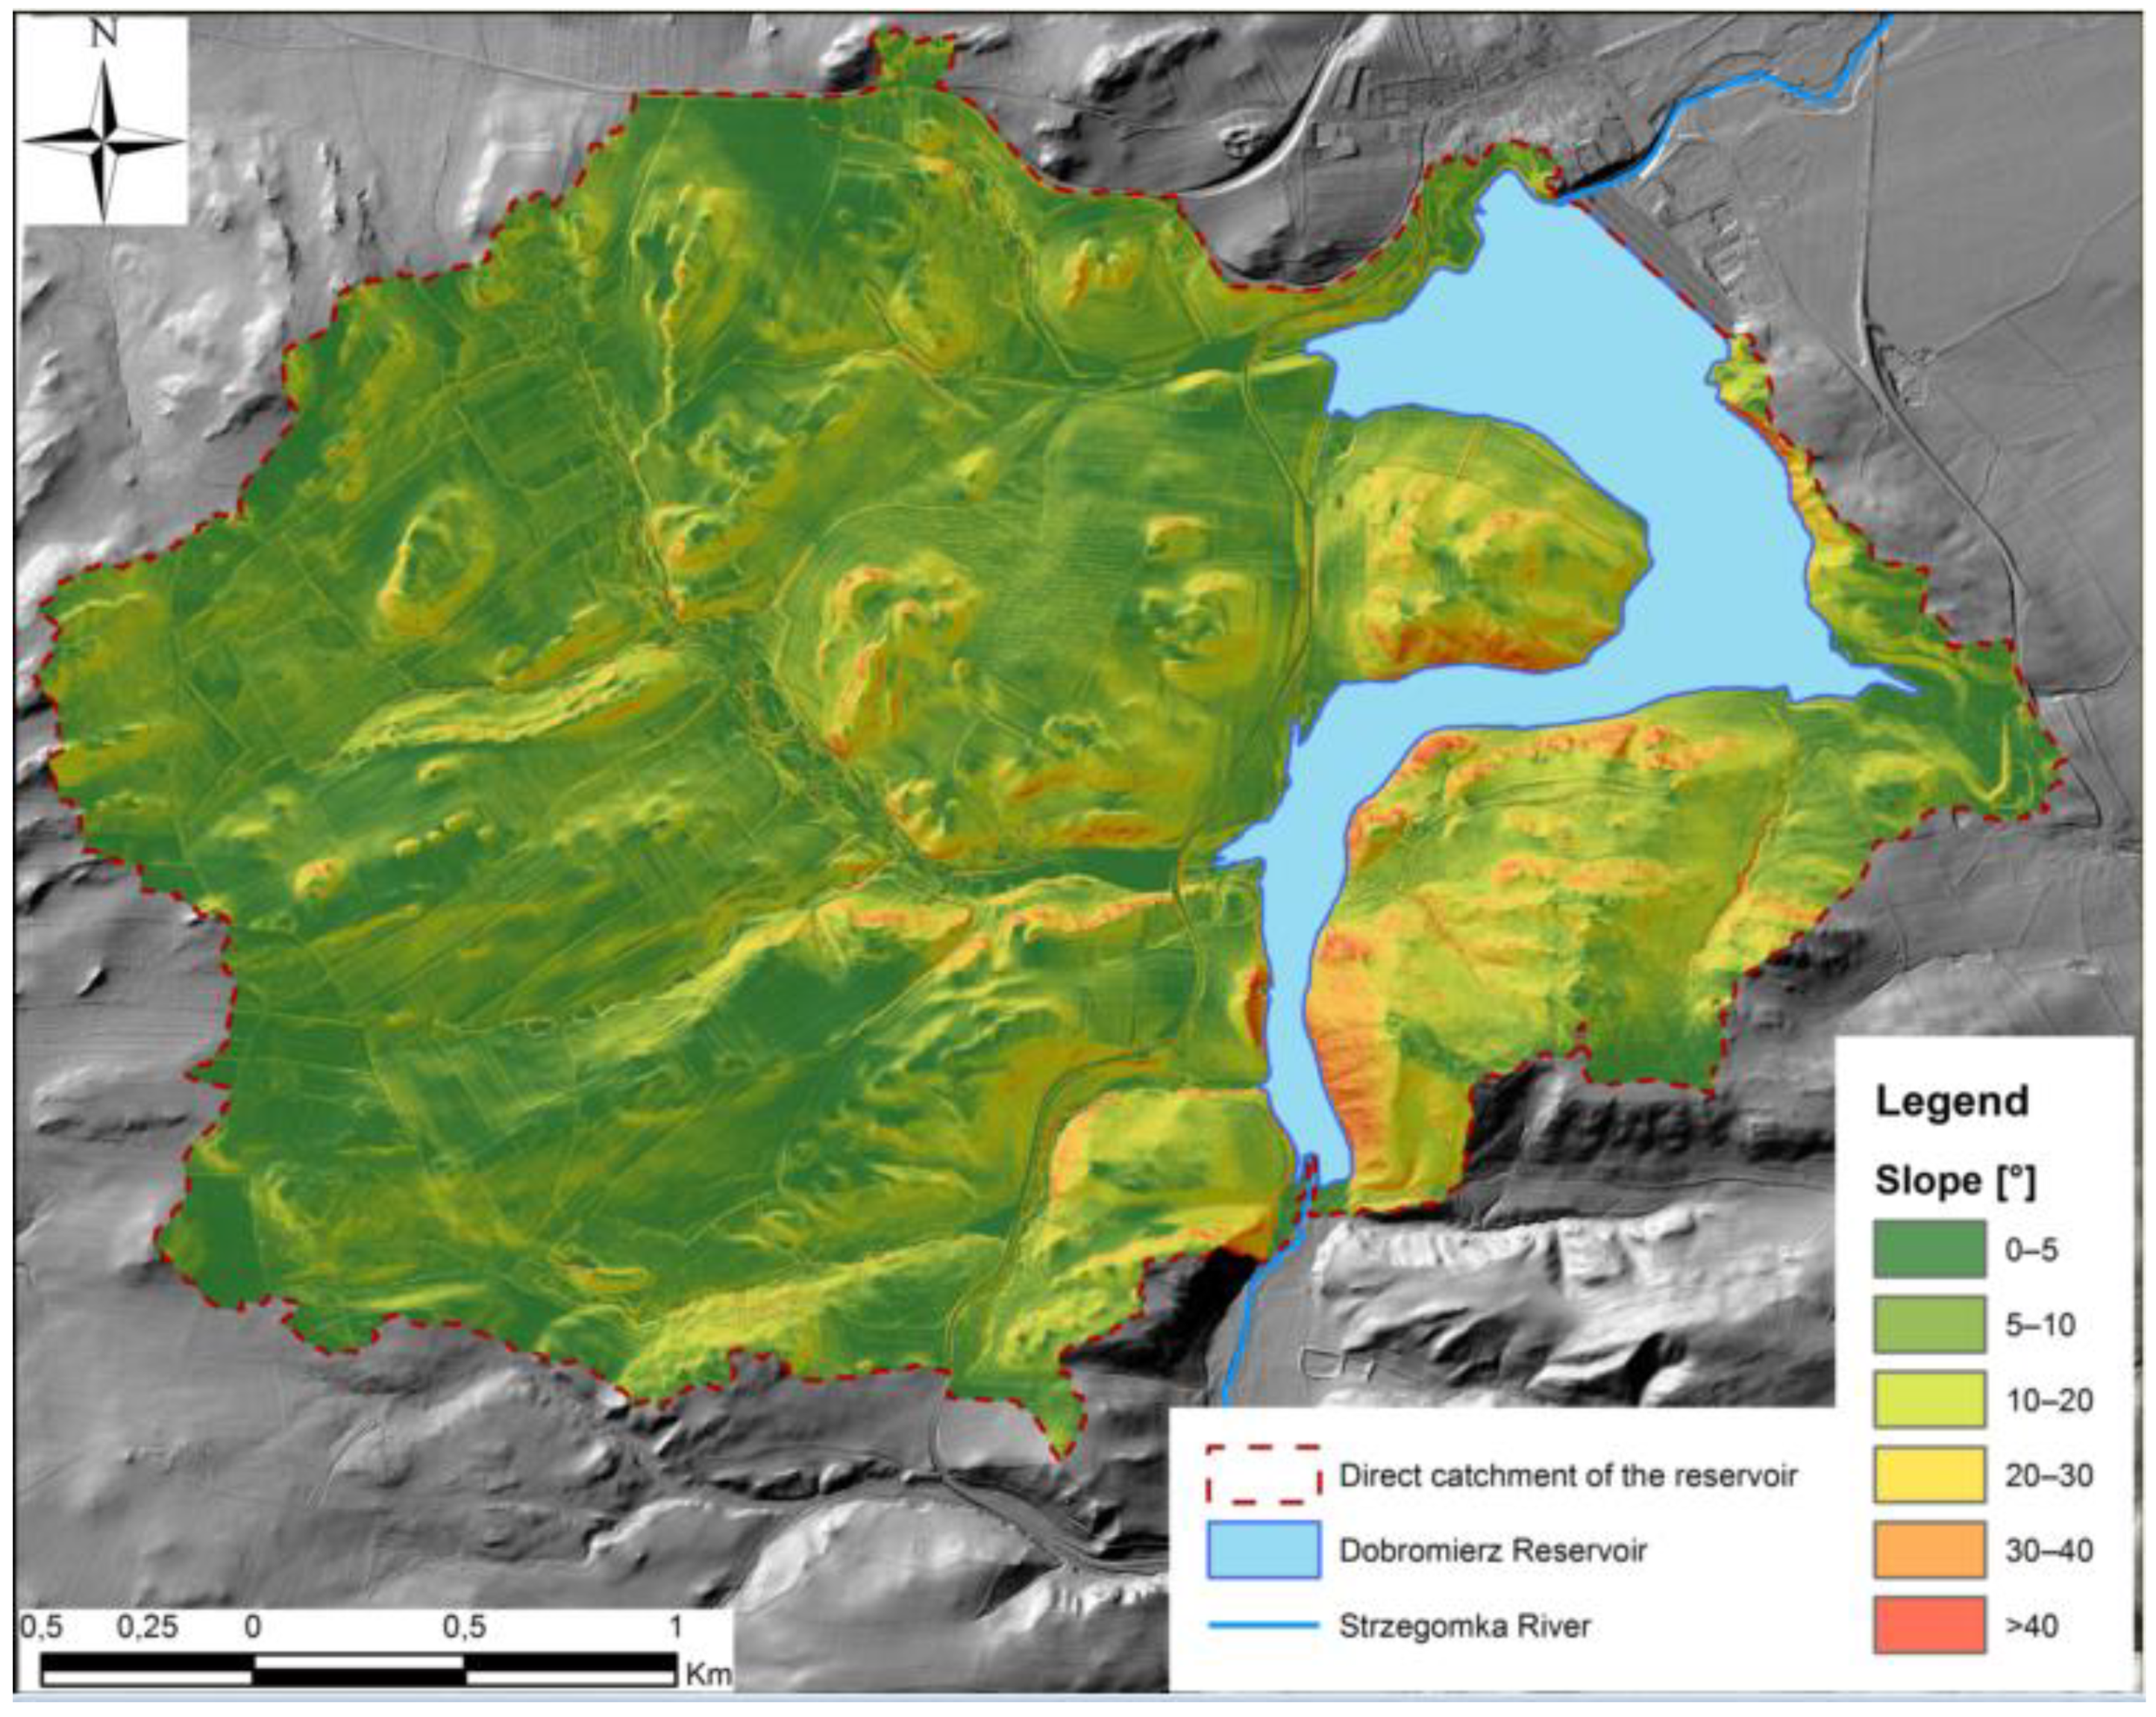
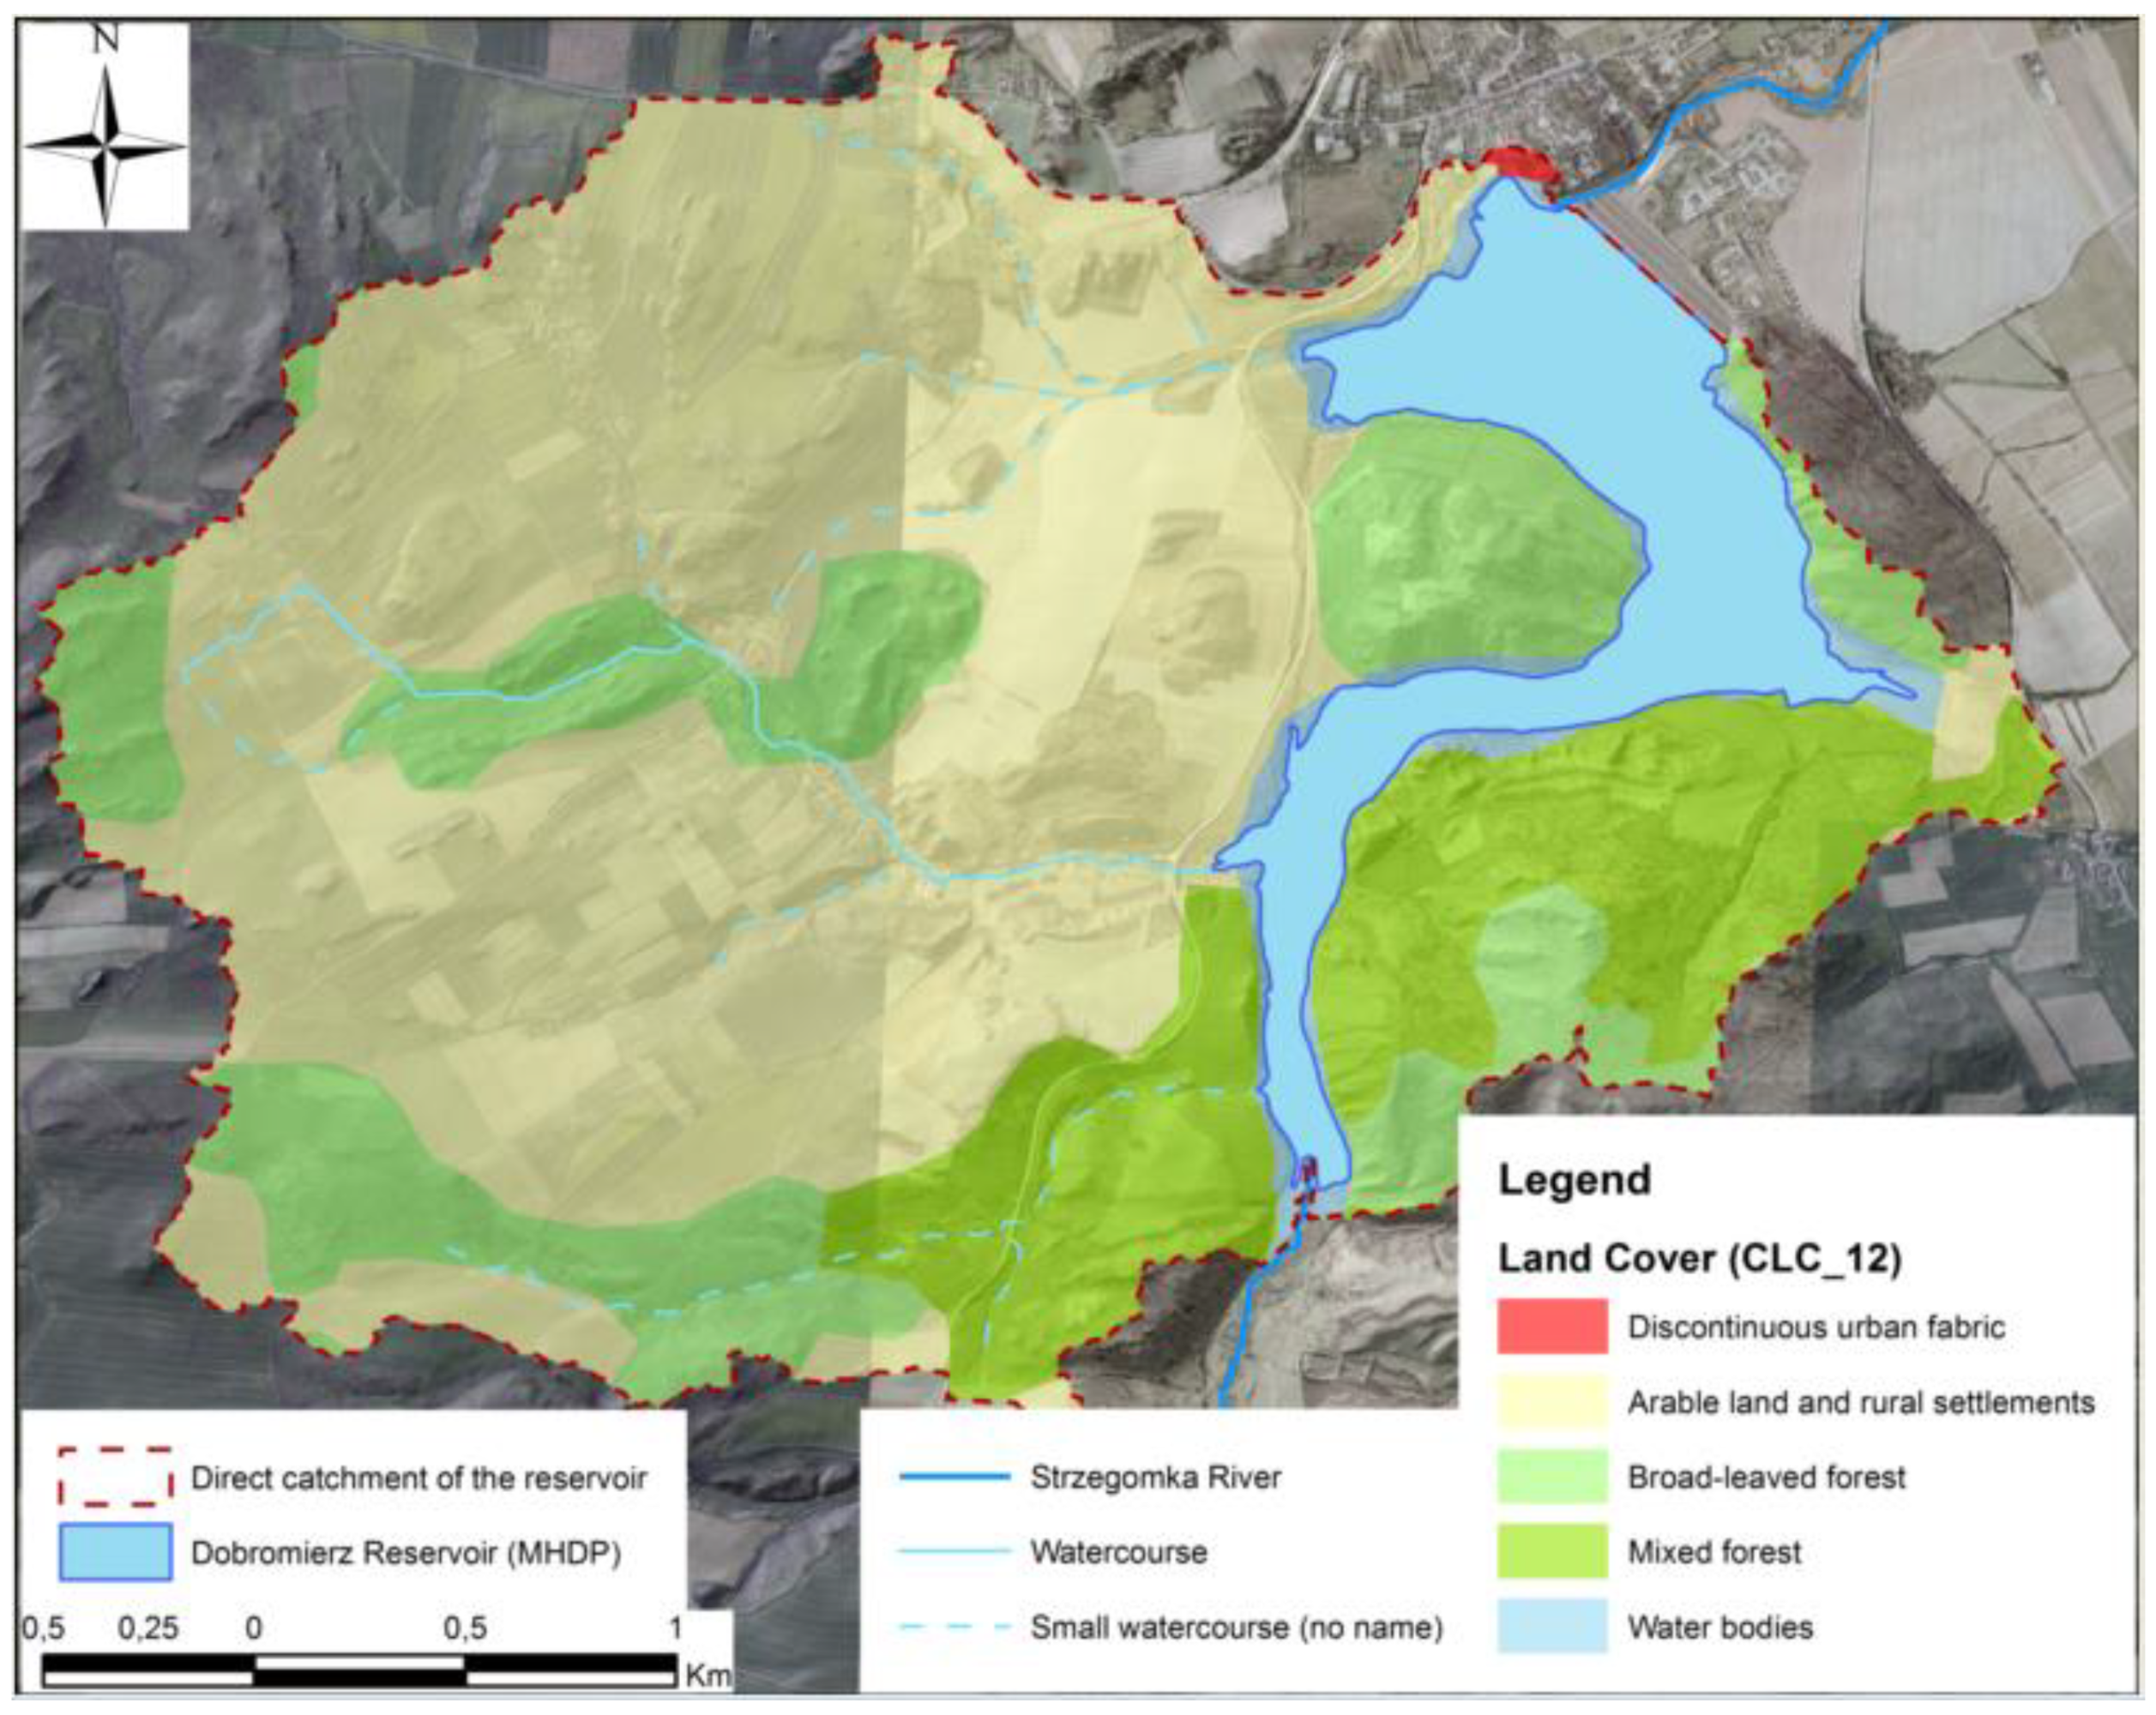
2.1. Study Area
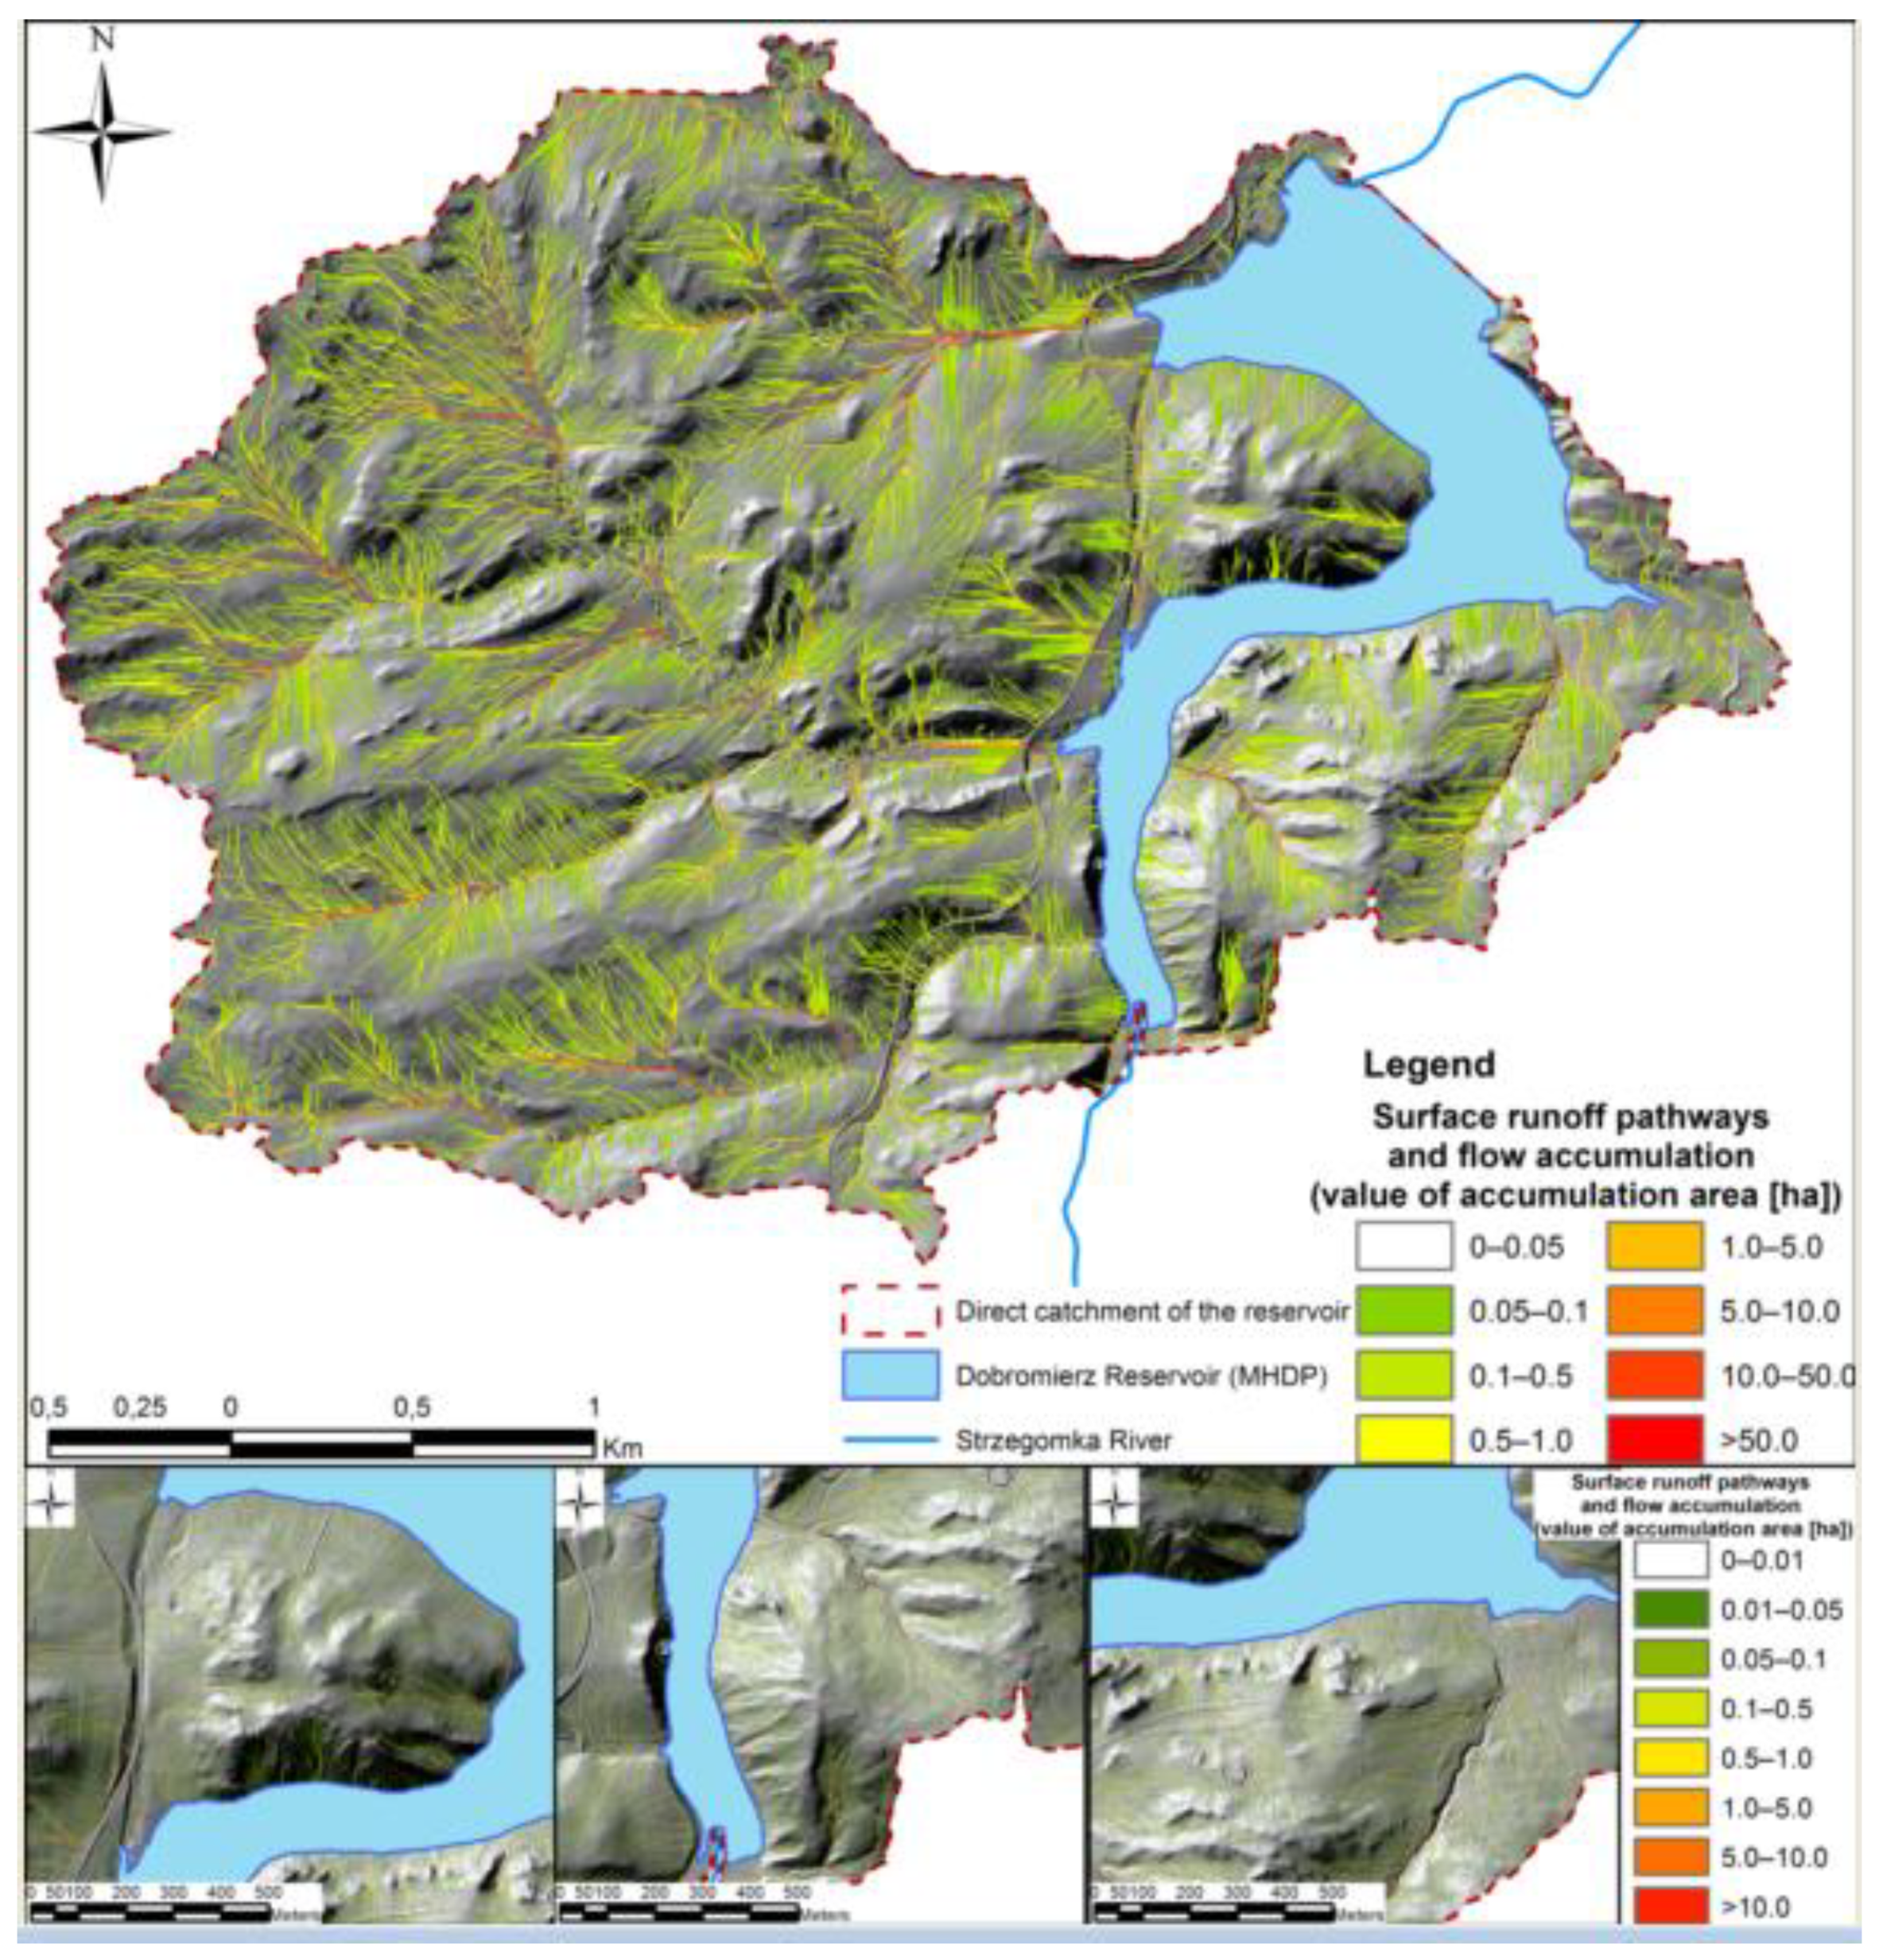
2.2. Geospatial Data and Digital Terrain Analysis
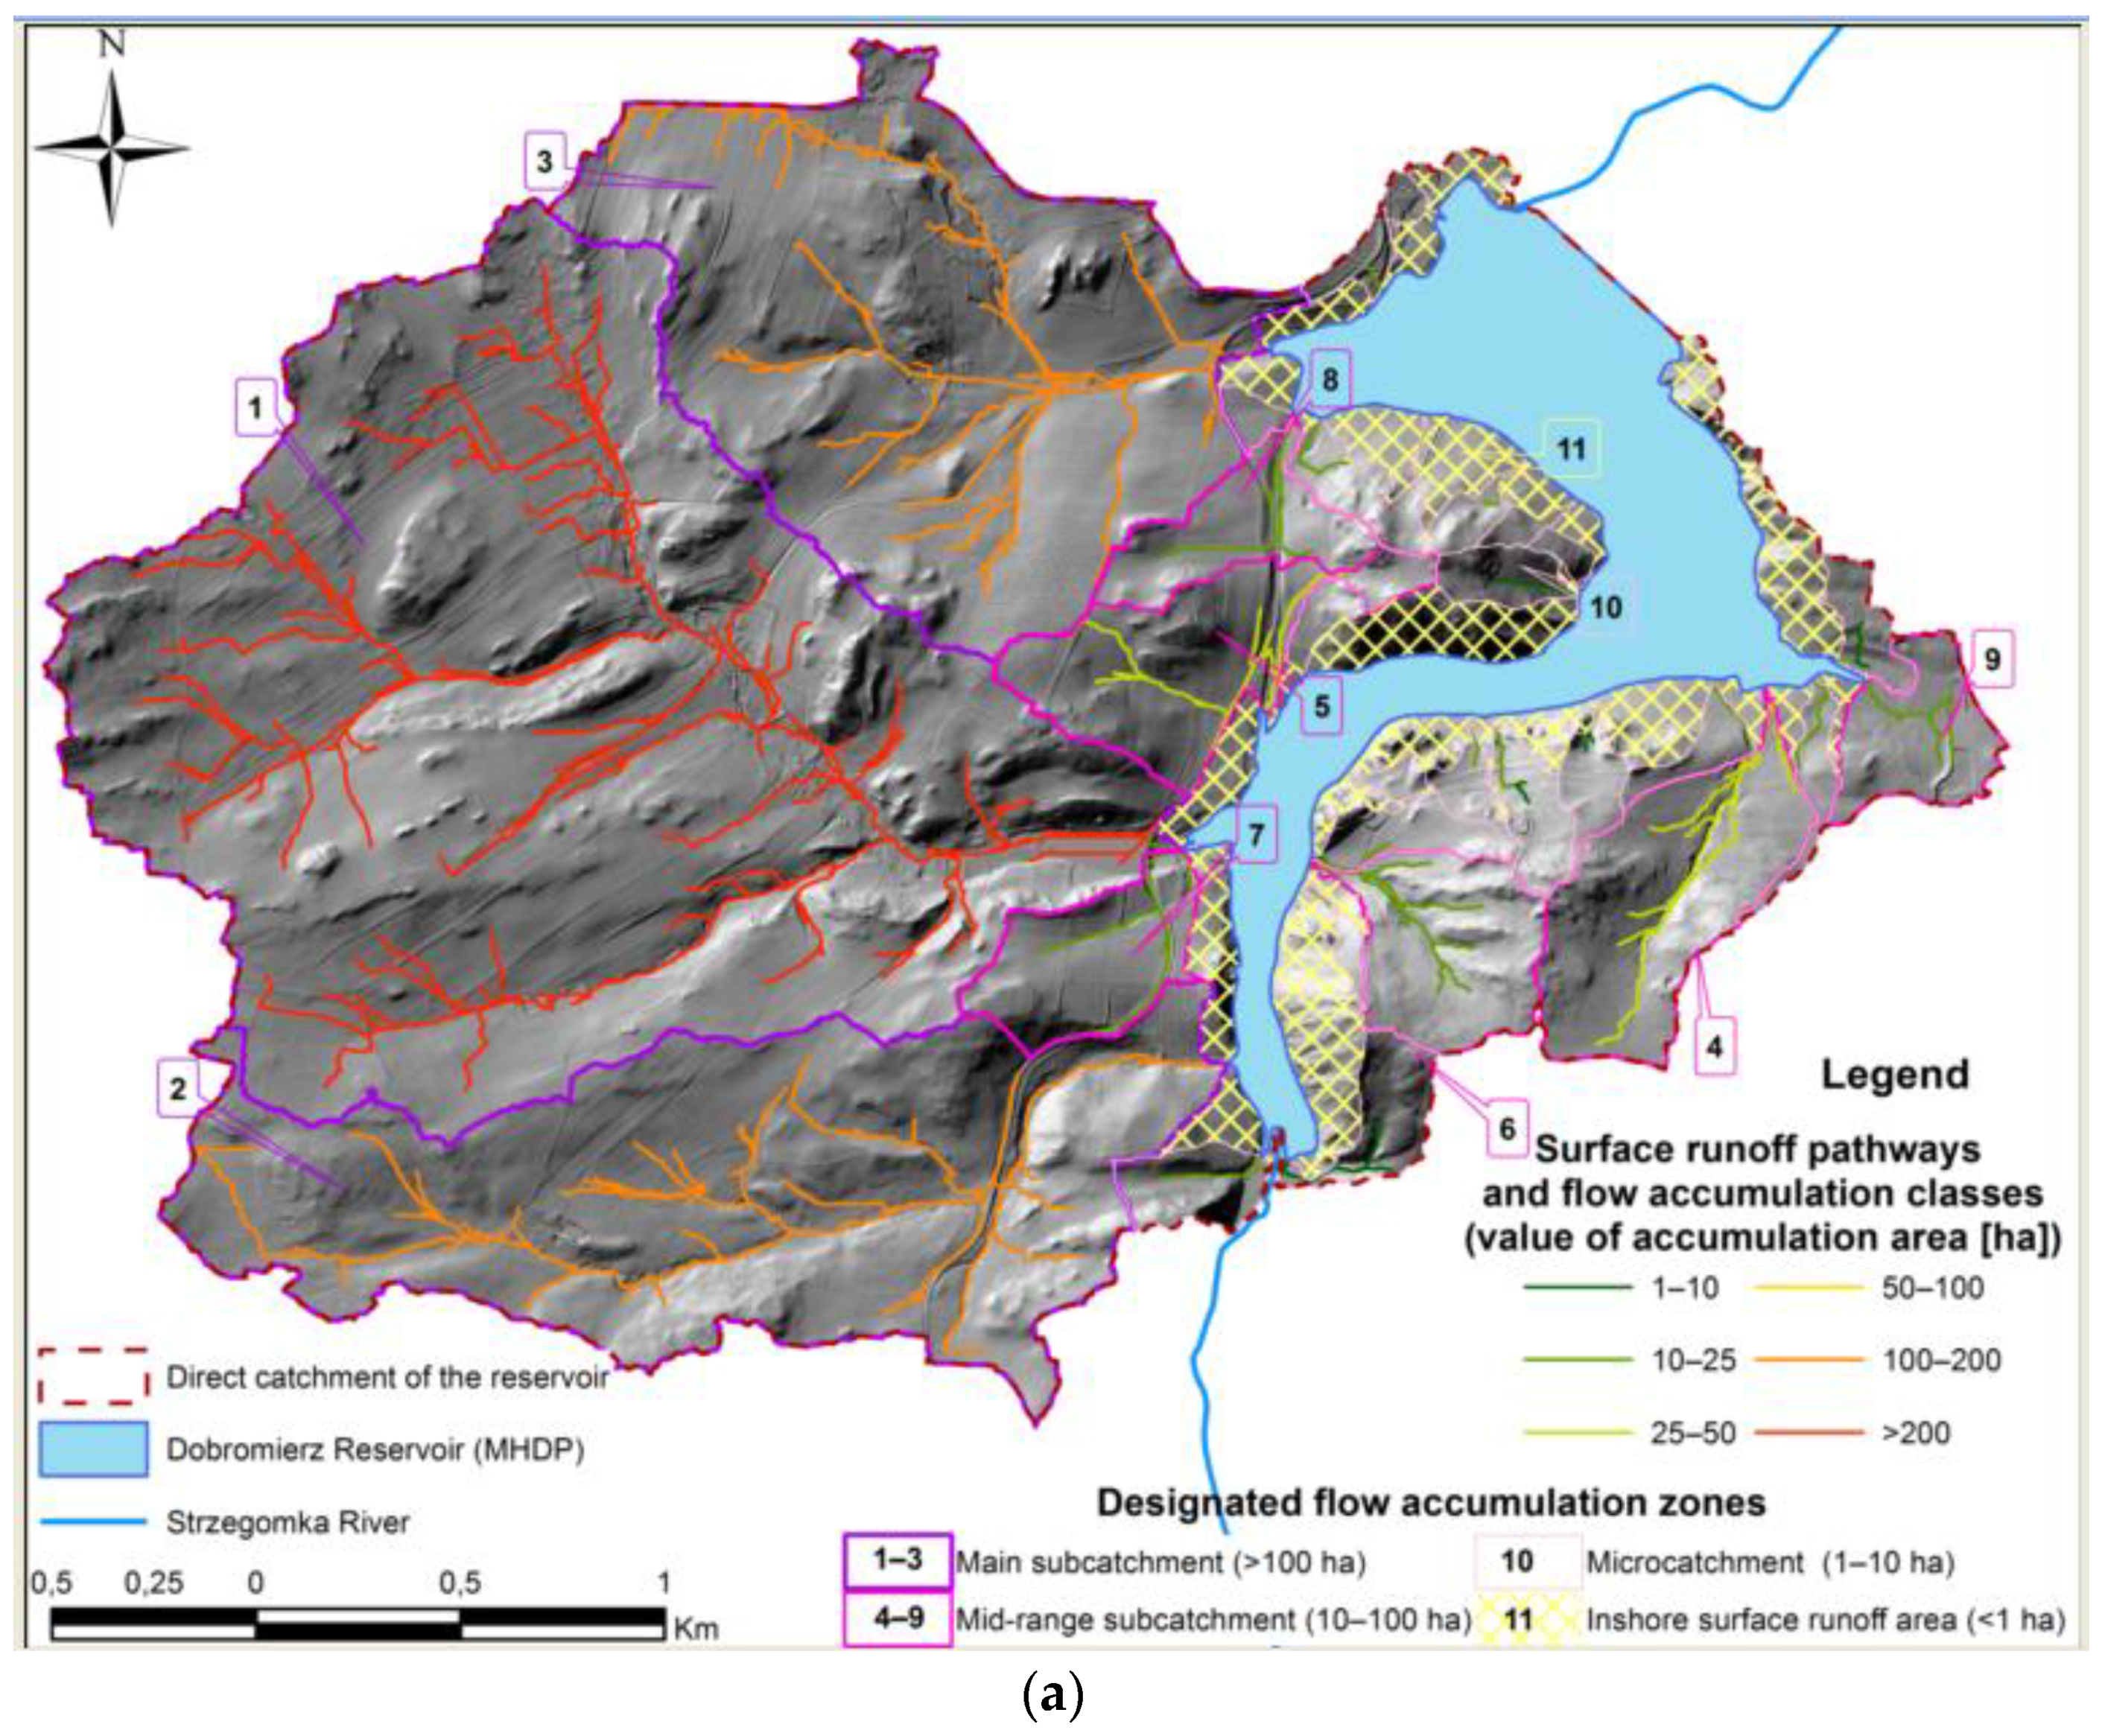
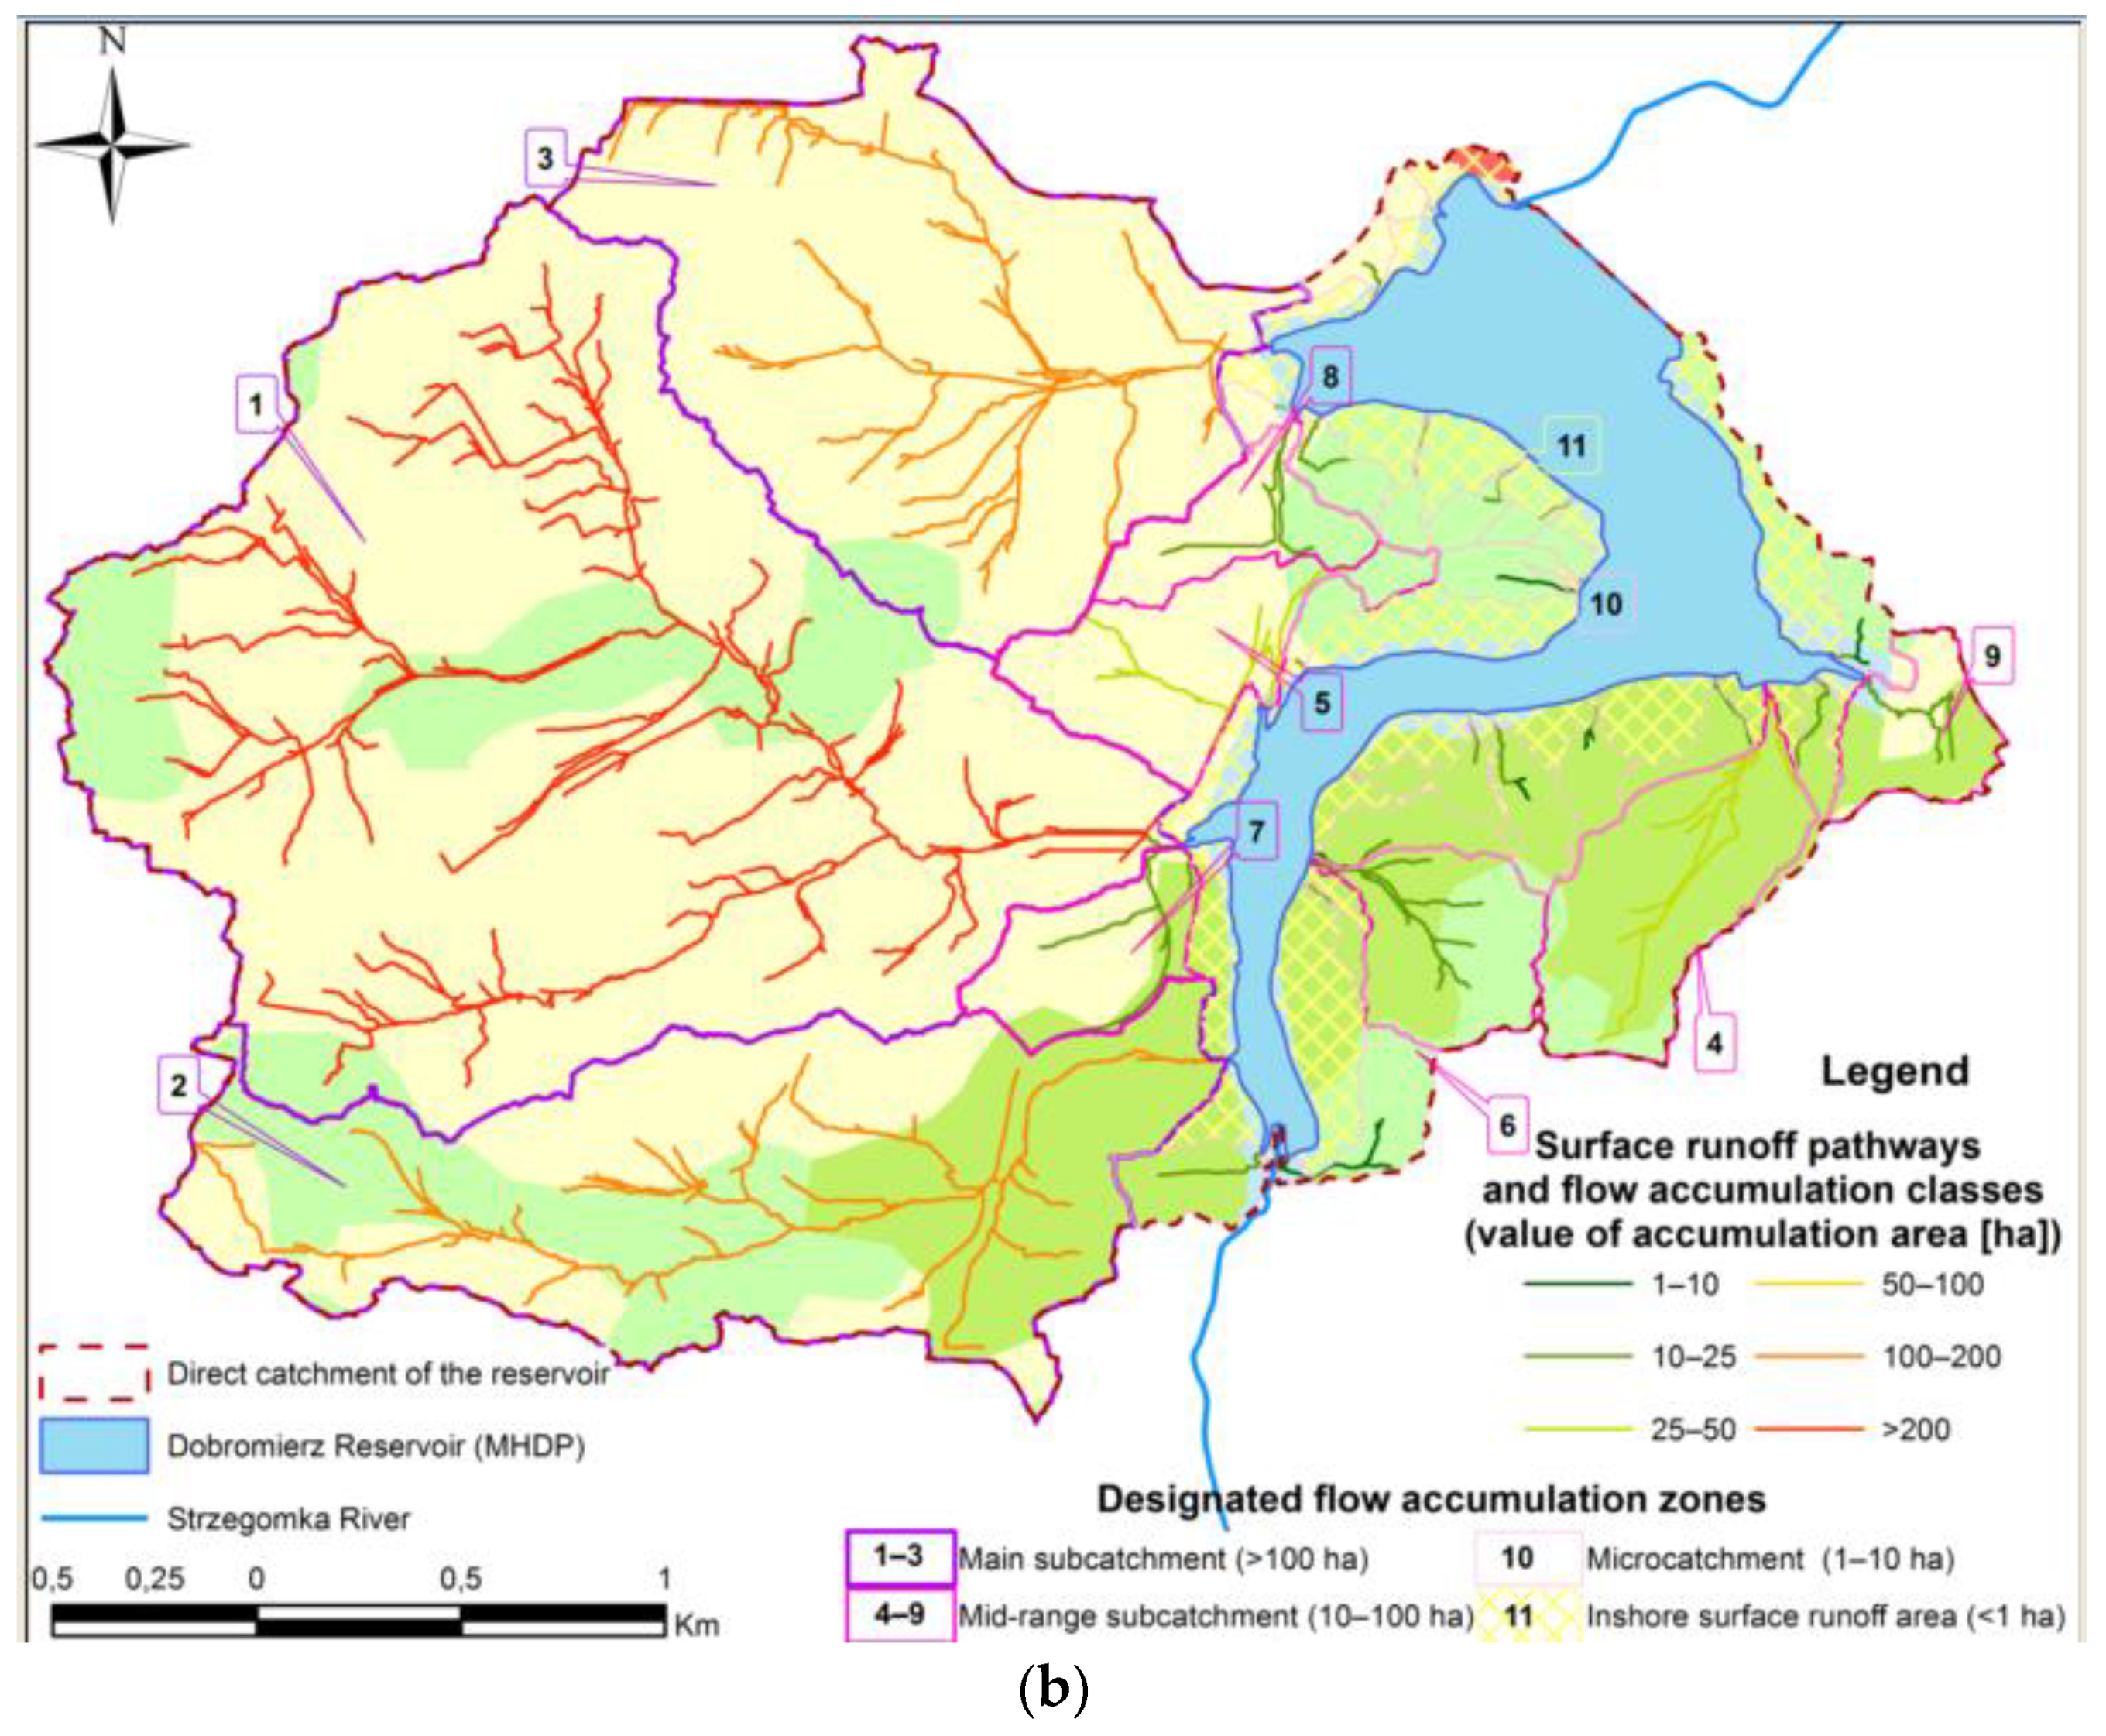
- Main surface runoff areas (main subcatchments) >100 ha
- Class > 200 ha
- Class 100–200 ha
- Mid-range subcatchments 10–100 ha
- Class 50–100 ha
- Class 25–50 ha
- Class 10–25 ha
- Microcatchments 0–10 ha
- Class 1–10 ha
3. Results and Discussion
4. Conclusions
Author Contributions
Funding
Acknowledgments
Conflicts of Interest
References
- Kim, K.; Kim, B.; Eum, J.; Seo, B.; Shope, C.L.; Peiffer, S. Impacts of land use change and summer monsoon on nutrients and sediment exports from an agricultural catchment. Water 2018, 10, 544. [Google Scholar] [CrossRef]
- Almaarofi, H.; Etemad-Shahidi, A.; Stewart, R.A. Strategic evaluation tool for surface water quality management remedies in drinking water catchments. Water 2017, 9, 738. [Google Scholar] [CrossRef]
- Smith, V.H.; Joye, S.B.; Howarth, R.W. Eutrophication of freshwater and marine ecosystems. Limnol. Oceanogr. 2006, 51, 351–355. [Google Scholar] [CrossRef] [Green Version]
- Spanhoff, B.; Bischof, R.; Bohme, A.; Lorenz, S.; Neumeister, K.; Nothlich, A.; Kusel, K. Assessing the impact of effluents from a modern wastewater treatment plant on breakdown of coarse particulate organic matter and benthic macroinvertebrates in a lowland river. Water Air Soil Pollut. 2007, 180, 119–129. [Google Scholar] [CrossRef]
- Knight, K.W.; Schultz, R.C.; Mabry, C.M.; Isenhart, T.M. Ability of emnant riparian forests, with and without grass filters, to buffer concentrated surface runoff. J. Am. Water Resour. Assoc. 2010, 46, 311–322. [Google Scholar] [CrossRef]
- Agnew, L.J.; Lyon, S.W.; Gerard-Marchant, P.; Collins, V.B.; Lembo, A.J.; Steenhuis, T.S.; Walter, M.T. Identifying hydrologically sensitive areas: Bridging the gap between science and application. J. Environ. Manag. 2006, 78, 63–76. [Google Scholar] [CrossRef] [PubMed]
- Mellander, P.E.; Jordan, P.; Shore, M.; Melland, A.R.; Shortle, G. Flow paths and phosphorus transfer pathways in two agricultural streams with contrasting flow controls. Hydrol. Process. 2015, 29, 3504–3518. [Google Scholar] [CrossRef]
- Ahmad, N. Nitrogen Economy in Tropical Soils; Kluwer Academic Publishers: Dordrech, The Netherlands, 1996; Volume 69. [Google Scholar]
- Sharpley, A.N.; Chapra, S.C.; Wedepohl, R.; Sims, J.T.; Daniel, T.C.; Reddy, K.R. Managing agricultural phosphorus for protection of surface waters: Issues and options. J. Environ. Qual. 1994, 23, 437–451. [Google Scholar] [CrossRef]
- Thomas, I.A.; Jordan, P.; Mellander, P.E.; Fenton, O.; Shine, O.; Huallachain, D.O.; Creamer, R.; McDonald, N.T.; Dunlop, P.; Murphy, P.N.C. Improving the identification of hydrologically sensitive areas using LiDAR DEMs for the delineation and mitigation of critical source areas of diffuse pollution. Sci. Total Environ. 2016, 556, 276–290. [Google Scholar] [CrossRef] [PubMed]
- El Kateb, H.; Zhang, H.F.; Zhang, P.C.; Mosandl, R. Soil erosion and surface runoff on different vegetation covers and slope gradients: A field experiment in Southern Shaanxi Province, China. Catena 2013, 105, 1–10. [Google Scholar] [CrossRef]
- Huber, U.M.; Bugmann, H.K.M.; Reasoner, M.A. Global Change and Mountain Regions: An Overview of Current Knowledge; Springer: Dordrecht, The Netherlands, 2005; p. 650. [Google Scholar]
- Cassidy, R.; Jordan, P. Limitations of instantaneous water quality sampling in surface-water catchments: Comparison with near-continuous phosphorus time-series data. J. Hydrol. 2011, 405, 182–193. [Google Scholar] [CrossRef]
- Sharpley, A.N.; Gburek, W.J.; Folmar, G.; Pionke, H.B. Sources of phosphorus exported from an agricultural watershed in Pennsylvania. Agric. Water Manag. 1999, 41, 77–89. [Google Scholar] [CrossRef]
- Ockenden, M.C.; Hollaway, M.J.; Beven, K.J.; Collins, A.L.; Evans, R.; Falloon, P.D.; Forber, K.J.; Hiscock, K.M.; Kahana, R.; Macleod, C.J.A.; et al. Major agricultural changes required to mitigate phosphorus losses under climate change. Nat. Commun. 2017, 8. [Google Scholar] [CrossRef] [PubMed]
- Adu, J.T.; Kumarasamy, M.V. Assessing Non-Point Source Pollution Models: A review. Pol. J. Environ. Stud. 2018, 27, 1913–1922. [Google Scholar] [CrossRef]
- Thomas, I.A.; Jordan, P.; Shine, O.; Fenton, O.; Mellander, P.E.; Dunlop, P.; Murphy, P.N.C. Defining optimal DEM resolutions and point densities for modelling hydrologically sensitive areas in agricultural catchments dominated by microtopography. Int. J. Appl. Earth Obs. Geoinf. 2017, 54, 38–52. [Google Scholar] [CrossRef]
- Dupas, R.; Delmas, M.; Dorioz, J.M.; Garnier, J.; Moatar, F.; Gascuel-Odoux, C. Assessing the impact of agricultural pressures on N and P loads and eutrophication risk. Ecological Indic. 2015, 48, 396–407. [Google Scholar] [CrossRef]
- Lee, J.; Rai, P.K.; Jeon, Y.J.; Kim, K.H.; Kwon, E.E. The role of algae and cyanobacteria in the production and release of odorants in water. Environ. Pollut. 2017, 227, 252–262. [Google Scholar] [CrossRef] [PubMed]
- Yan, C.; Song, X.; Yu, M.; Tong, Y.; Zhang, W. Determining the effects of polyaluminum chloride alkalinities and dosage treatments on various microalgal growth phases for the treatment of microalgae-laden water. Sep. Purif. Technol. 2019, 209, 202–210. [Google Scholar] [CrossRef]
- He, X.X.; Liu, Y.L.; Conklin, A.; Westrick, J.; Weavers, L.K.; Dionysiou, D.D.; Lenhart, J.J.; Mouser, P.J.; Szlag, D.; Walker, H.W. Toxic cyanobacteria and drinking water: Impacts, detection and treatment. Harmful Algae 2016, 54, 174–193. [Google Scholar] [CrossRef] [PubMed]
- Wang, X.; Xie, H. A Review on Applications of Remote Sensing and Geographic Information Systems (GIS) in Water Resources and Flood Risk Management. Water 2018, 10, 608. [Google Scholar] [CrossRef]
- Joshi, N.; Baumann, M.; Ehammer, A.; Fensholt, R.; Grogan, K.; Hostert, P.; Jepsen, M.R.; Kuemmerle, T.; Meyfroidt, P.; Mitchard, E.T.A.; et al. A review of the application of optical and radar remote sensing data fusion to land use mapping and monitoring. Remote Sens. 2016, 8, 70. [Google Scholar] [CrossRef]
- Kaluza, T.; Tymkow, P.; Strzelinski, P. Use of remote sensing for investigating riparian shrub structures. Pol. J. Environ. Stud. 2012, 21, 115–122. [Google Scholar]
- Holman, F.H.; Riche, A.B.; Michalski, A.; Castle, M.; Wooster, M.J.; Hawkesford, M.J. High throughput field phenotyping of wheat plant height and growth rate in field plot trials using UAV based remote sensing. Remote Sens. 2016, 8, 1031. [Google Scholar] [CrossRef]
- Tokarczyk-Dorociak, K.; Kazak, J.; Szewranski, S. The Impact of a Large City on Land Use in Suburban Area - The Case of Wroclaw (Poland). J. Ecol. Eng. 2018, 19, 89–98. [Google Scholar] [CrossRef]
- Szewranski, S.; Chruscinski, J.; Kazak, J.; Swiader, M.; Tokarczyk-Dorociak, K.; Zmuda, R. Pluvial flood risk assessment tool (PFRA) for rainwater management and adaptation to climate change in newly urbanised areas. Water 2018, 10, 386. [Google Scholar] [CrossRef]
- Dabek, P.; Zmuda, R.; Cmielewski, B.; Szczepanski, J. Analysis of water erosion processes using terrestrial laser scanning. Acta Geodyn. Geomater. 2014, 11, 45–52. [Google Scholar] [CrossRef]
- Woodrow, K.; Lindsay, J.B.; Berg, A.A. Evaluating DEM conditioning techniques, elevation source data and grid resolution for field-scale hydrological parameter extraction. J. Hydrol. 2016, 540, 1022–1029. [Google Scholar] [CrossRef]
- Mander, U.; Tournebize, J.; Tonderski, K.; Verhoeven, J.T.A.; Mitsch, W.J. Planning and establishment principles for constructed wetlands and riparian buffer zones in agricultural catchments. Ecol. Eng. 2017, 103, 296–300. [Google Scholar] [CrossRef]
- Correll, D.L. Principles of planning and establishment of buffer zones. Ecol. Eng. 2005, 24, 433–439. [Google Scholar] [CrossRef]
- Lee, K.H.; Isenhart, T.M.; Schultz, R.C. Sediment and nutrient removal in an established multi-species riparian buffer. J. Soil Water Conserv. 2003, 58, 1–8. [Google Scholar]
- Dabrowska, J.; Kaczmarek, H.; Markowska, J.; Tyszkowski, S.; Kempa, O.; Galeza, M.; Kucharczak-Moryl, E.; Moryl, A. Shore zone in protection of water quality in agricultural landscape-the Msciwojow Reservoir, southwestern Poland. Environ. Monit. Assess. 2016, 188, 467. [Google Scholar] [CrossRef] [PubMed]
- Dosskey, M.G.; Helmers, M.J.; Eisenhauer, D.E.; Franti, T.G.; Hoagland, K.D. Assessment of concentrated flow through riparian buffers. J. Soil Water Conserv. 2002, 57, 336–343. [Google Scholar]
- Putowski, M. Instruction Manual for the Maintenance and Water Management of the Dobromierz Retention Reservoir; Regional Water Management Board in Wrocław: Wrocław, Poland, 2002; pp. 1–48. [Google Scholar]
- Dabrowska, J.; Lejcus, K.; Kusnierz, M.; Czamara, A.; Kaminska, J.; Lejcus, I. Phosphate dynamics in the drinking water catchment area of the Dobromierz Reservoir. Desalin. Water Treat. 2016, 57, 25600–25609. [Google Scholar] [CrossRef]
- Lejcus, K. Nitrate concentration changeability under strong anthropopressure in the Strzegomka River and Dobromierz Reservoir. Arch. Environ. Prot. 2004, 30, 63–72. [Google Scholar]
- Dabrowska, J.; Moryl, A.; Kucharczak-Moryl, E.; Zmuda, R.; Lejcus, I. Content of nitrogen compounds in the waters of the Strzegomka river above the Dobromierz Reservoir. Acta Sci.Pol. Form. Cir. 2016, 15, 57–69. [Google Scholar] [CrossRef]
- Wechsler, S.P. Uncertainties associated with digital elevation models for hydrologic applications: A review. Hydrol. Earth Syst. Sci. 2007, 11, 1481–1500. [Google Scholar] [CrossRef]
- Brubaker, K.M.; Myers, W.L.; Drohan, P.J.; Miller, D.A.; Boyer, E.W. The use of LiDAR terrain data in characterizing surface roughness and microtopography. Appl. Environ. Soil Sci. 2013, 2013, 1–13. [Google Scholar] [CrossRef]
- Jenson, S.K.; Domingue, J.O. Extracting topographic structure from digital elevation data for geographic information-system analysis. Photogramm. Eng. Remote Sens. 1988, 54, 1593–1600. [Google Scholar]
- Akbarimehr, M.; Naghdi, R. Reducing erosion from forest roads and skid trailsby management practices. J. For. Sci. 2012, 58, 165–169. [Google Scholar] [CrossRef]
- Dabek, P.B.; Zmuda, R.; Kowalczyk, T.; Dabrowska, J.; Moryl, A.; Kucharczak-Moryl, E. Forest roads system in mountain relief: Indicator evaluation of water-erosion risk. EJPAU 2017, 20. [Google Scholar] [CrossRef]
- Bajkiewicz-Grabowska, E. Assessment of the ecological state of lakes as proposed by the Polish Limnological Society. Limnol. Rev. 2010, 10, 105–116. [Google Scholar] [CrossRef]
- European Environment Agency. Water-Retention Potential of Europe’s Forests: A European Overview to Support Natural Water-Retention Measures; European Environment Agency: Copenhagen, Denmark, 2015; pp. 1–46. Available online: https://www.eea.europa.eu/publications/water-retention-potential-of-forests (accessed on 21 September 2018).
- Chandler, K.R.; Stevens, C.J.; Binley, A.; Keith, A.M. Influence of tree species and forest land use on soil hydraulic conductivity and implications for surface runoff generation. Geoderma 2018, 310, 120–127. [Google Scholar] [CrossRef]
- Liberacki, D.; Korytowski, M.; Kozaczyk, P.; Stachowski, P.; Stasik, R. Effects of implementation of small retention programme on the example of two forest districts of lowland area. Rocz. Ochr. Sr. 2016, 18, 428–438. [Google Scholar]
- Haygarth, P.M.; Condron, L.M.; Heathwaite, A.L.; Turner, B.L.; Harris, G.P. The phosphorus transfer continuum: Linking source to impact with an interdisciplinary and multi-scaled approach. Sci. Total Environ. 2005, 344, 5–14. [Google Scholar] [CrossRef] [PubMed] [Green Version]
- Hancock, G.; Hamilton, S.E.; Stone, M.; Kaste, J.; Lovette, J. A geospatial methodology to identify locations of concentrated runoff from agricultural fields. J. Am. Water Resour. Assoc. 2015, 51, 1613–1625. [Google Scholar] [CrossRef]
- Tiwari, T.; Lidman, F.; Laudon, H.; Lidberg, W.; Agren, A.M. GIS-based prediction of stream chemistry using landscape composition, wet areas and hydrological flow pathways. J. Geophys. Res. Biogeosci. 2017, 122, 65–79. [Google Scholar] [CrossRef]
- Lou, H.Z.; Yang, S.T.; Zhao, C.S.; Shi, L.H.; Wu, L.N.; Wang, Y.; Wang, Z.W. Detecting and analyzing soil phosphorus loss associated with critical source areas using a remote sensing approach. Sci. Total Environ. 2016, 573, 397–408. [Google Scholar] [CrossRef] [PubMed]
- Shore, M.; Jordan, P.; Mellander, P.E.; Kelly-Quinn, M.; Wall, D.P.; Murphy, P.N.C.; Melland, A.R. Evaluating the critical source area concept of phosphorus loss from soils to water-bodies in agricultural catchments. Sci. Total Environ. 2014, 490, 405–415. [Google Scholar] [CrossRef] [PubMed]
- Ockenden, M.C.; Tych, W.; Beven, K.J.; Collins, A.L.; Evans, R.; Falloon, P.D.; Forber, K.J.; Hiscock, K.M.; Hollaway, M.J.; Kahana, R.; et al. Prediction of storm transfers and annual loads with data-based mechanistic models using high-frequency data. Hydrol. Earth Syst. Sci. 2017, 21, 6425–6444. [Google Scholar] [CrossRef] [Green Version]
- Zhou, Q.Q. A review of sustainable urban drainage systems considering the climate change and urbanization impacts. Water 2014, 6, 976–992. [Google Scholar] [CrossRef]

| Parameter | Unit | Amount |
|---|---|---|
| Normal Water Level (NWL) | m a.s.l. | 298.50 |
| Full Reservoir Level (FRL) | m a.s.l. | 299.70 |
| Maximum Water Level (Highest Flood Level (MWL)) | m a.s.l. | 300.10 |
| Mean Annual Flow | m3·s−1 | 0.781 |
| Surface of the Reservoir at NWL | ha | 103.00 |
| Surface of the Reservoir at FRL | ha | 111.00 |
| Surface of the Reservoir at MWL | ha | 114.50 |
| Water Surface Elevation at NWL | m | 25.5 |
| Water Surface Elevation at FRL | m | 26.7 |
| Mean Depth at NWL | m | 10.0 |
| Dead Capacity | million m3 | 1.0 |
| Useful Capacity at NWL | million m3 | 9.0 |
| Flood Reserve Capacity | million m3 | 1.35 |
| Capacity at FRL | million m3 | 11.35 |
| Surcharge Storage | million m3 | 0.40 |
| Maximum Capacity at MWL | million m3 | 11.75 |
| Month | I | II | III | IV | V | VI | VII | VIII | IX | X | XI | XII |
|---|---|---|---|---|---|---|---|---|---|---|---|---|
| Precipitation | 43.1 | 34.6 | 47.0 | 45.5 | 85.8 | 80.0 | 121.4 | 113.4 | 71.6 | 39.0 | 43.7 | 40.4 |
| Temperature | −1.6 | −0.8 | 2.4 | 8.1 | 13.0 | 16.0 | 18.1 | 17.2 | 12.4 | 8.3 | 4.4 | −0.4 |
| Year | 2000 | 2001 | 2002 | 2003 | 2004 | 2005 | 2006 | 2007 | 2008 | 2009 | 2010 | 2011 | 2012 | 2013 | 2014 |
|---|---|---|---|---|---|---|---|---|---|---|---|---|---|---|---|
| Mean Annual Flow | N/D | N/D | N/D | 0.56 | 0.49 | 0.63 | 1.12 | 0.58 | 0.47 | 0.66 | 0.79 | 0.69 | 0.36 | 0.85 | 0.38 |
| Number | Type of Designed Flow Accumulation Area | Surface Area (ha) | Mean Slope (°) | Slope Aspect (Majority) | Land Use Pattern | Surface Runoff Concentration | Level of Agricultural Diffuse Pollution | Possibility of Reducing the Surface Runoff Generation by the Forest | ||
|---|---|---|---|---|---|---|---|---|---|---|
| Arable land | Forests | Others | ||||||||
| Main surface runoff areas (main subcatchments) >100 ha | ||||||||||
| 1 | Single area of >200 ha | 353.09 | 8.2 | NW | 82.7 | 17.3 | 0.0 | High | High | Low |
| 2 | Single area of 100–200 ha | 152.03 | 8.0 | NW | 38.3 | 61.7 | 0.0 | High | Medium | Medium |
| 3 | Single area of 100–200 ha | 146.81 | 8.0 | W | 96.5 | 3.4 | 0.1 | High | High | Low |
| Mid-range subcatchments 10–100 ha | ||||||||||
| 4 | Single area of 25–50 ha | 30.64 | 11.2 | SW | 0.0 | 100.0 | 0.0 | Medium | Low | High |
| 5 | Single area of 25–50 ha | 26.35 | 10.1 | NW | 87.0 | 12.2 | 0.8 | Medium | High | Low |
| 6 | Single area of 10–25 ha | 19.28 | 15.4 | SE | 0.0 | 100.0 | 0.0 | Medium | Low | High |
| 7 | Single area of 10–25 ha | 16.62 | 8.8 | SW | 71.5 | 28.5 | 0.0 | Medium | High | Low |
| 8 | Single area of 10–25 ha | 13.32 | 9.8 | S | 74.2 | 25.4 | 0.4 | Medium | High | Low |
| 9 | Single area of 10–25 ha | 12.05 | 6.8 | SE | 35.4 | 59.8 | 4.8 | Medium | Medium | Medium |
| Microcatchments 0–10 ha | ||||||||||
| 10 | 21 areas of 1–10 ha; Total area: 61.85 | Single area 1–10 ha | 13.7 | N | 9.6 | 86.7 | 3.7 | Low | Low | High |
| 11 | The area includes several dozens of microcatchments, 0–1 ha each; Total area: 74.05 | Single area <1 ha | 17.0 | N | 8.2 | 67.5 | 24.3 (out of which 23% are water bodies) | Low | Low | High |
© 2018 by the authors. Licensee MDPI, Basel, Switzerland. This article is an open access article distributed under the terms and conditions of the Creative Commons Attribution (CC BY) license (http://creativecommons.org/licenses/by/4.0/).
Share and Cite
Dąbrowska, J.; Dąbek, P.B.; Lejcuś, I. Identifying Surface Runoff Pathways for Cost-Effective Mitigation of Pollutant Inputs to Drinking Water Reservoir. Water 2018, 10, 1300. https://doi.org/10.3390/w10101300
Dąbrowska J, Dąbek PB, Lejcuś I. Identifying Surface Runoff Pathways for Cost-Effective Mitigation of Pollutant Inputs to Drinking Water Reservoir. Water. 2018; 10(10):1300. https://doi.org/10.3390/w10101300
Chicago/Turabian StyleDąbrowska, Jolanta, Paweł B. Dąbek, and Iwona Lejcuś. 2018. "Identifying Surface Runoff Pathways for Cost-Effective Mitigation of Pollutant Inputs to Drinking Water Reservoir" Water 10, no. 10: 1300. https://doi.org/10.3390/w10101300
APA StyleDąbrowska, J., Dąbek, P. B., & Lejcuś, I. (2018). Identifying Surface Runoff Pathways for Cost-Effective Mitigation of Pollutant Inputs to Drinking Water Reservoir. Water, 10(10), 1300. https://doi.org/10.3390/w10101300