Abstract
The accurate estimation of soil hydraulic parameters (θs, α, n, and Ks) of the van Genuchten–Mualem model has attracted considerable attention. In this study, we proposed a new two-step inversion method, which first estimated the hydraulic parameter θs using objective function by the final water content, and subsequently estimated the soil hydraulic parameters α, n, and Ks, using a vector-evaluated genetic algorithm and particle swarm optimization (VEGA-PSO) method based on objective functions by cumulative infiltration and infiltration rate. The parameters were inversely estimated for four types of soils (sand, loam, silt, and clay) under an in silico experiment simulating the tension disc infiltration at three initial water content levels. The results indicated that the method is excellent and robust. Because the objective function had multilocal minima in a tiny range near the true values, inverse estimation of the hydraulic parameters was difficult; however, the estimated soil water retention curves and hydraulic conductivity curves were nearly identical to the true curves. In addition, the proposed method was able to estimate the hydraulic parameters accurately despite substantial measurement errors in initial water content, final water content, and cumulative infiltration, proving that the method was feasible and practical for field application.
1. Introduction
Soil hydraulic properties are essential characteristics for describing field-scale water flow and solute transport processes [1,2,3]. Therefore, the accuracy and rapid estimation of soil hydraulic parameters are vital [4]. Several direct methods have been developed to estimate the hydraulic properties of unsaturated soils [5,6,7]. Unfortunately, direct methods have various limitations such as being time consuming and tedious, as well as being difficult for use in the field because of spatial variations in soil hydraulic properties [8,9,10].
The development of computer technology has led to an increased interest in indirect methods. Zachmann et al. [11,12] were the first to study the estimation of hydraulic properties using transient flow experiments in the laboratory. Since then, studies have developed inverse methods for estimating soil hydraulic parameters using in situ or laboratory experiments and silico simulation, such as one-step outflow and multistep outflow experiments [13,14,15], and evaporation experiments [16,17,18]; studies have proposed estimation devices, such as the tension disc infiltrometer [19,20], the modified cone penetrometer [21,22], and the field multiple extraction device [23].
The nonuniqueness and instability of parameter solutions in inverse methods are the key problems considered in most relevant studies. Most inverse methods use multitarget optimization algorithms, which utilize various data to improve the stability of solutions. Toorman et al. [19] evaluated inverse methods related to the one-step outflow method from the perspective of various objective functions, including combinations of matric potential, water content, and outflow data; specifically, they discovered that the matric potential data could greatly improve the sensitivity of parameter estimation. Dam et al. [24] concluded that, based on the multistep outflow method, the use of cumulative output alone can easily lead to a nonunique solution; however, with the addition of water content, a reliable parameter solution can be obtained. Eching and Hopmans [25] and Eching et al. [26] determined that the calibration of the parameters of the soil water retention curve was greatly improved using cumulative transient outflow data with simultaneously measured soil matric potential data; furthermore, they discovered that the addition of automatically measured soil pressure head data provided unique parameters in their multistep outflow experiment. Vereecken et al. [27] analyzed the effect of four parameters on the estimation of hydraulic functions based on multistep outflow experiments; they obtained an improved estimation with the addition of moisture retention characteristic data sets obtained directly from an outflow experiment. Vrugt et al. [28] proposed the parameter identification method based on the localization of information, which can be used in multistep outflow experiments to improve the uniqueness and stability of inverse parameters.
Tension disc infiltration has the advantages of short measurement time, wide availability of measured data sets, and easy application. Given these advantages, an in silico experiment was conducted to simulate tension disc infiltration. In this study, we first analyzed the synergistic effects of θs, α, n, and Ks by the objective functions of cumulative infiltration (Q), infiltration rate (v), and final water content (θfinal) using the van Genuchten–Mualem [29] model. Then, based on a hybrid vector-evaluated genetic algorithm (VEGA) [30] and particle swarm optimization (PSO) method [31], we proposed a new inverse method of soil hydraulic parameters named the “two-step method” under in silico experiments of tension disc infiltration, which first searches the hydraulic parameter θs by the objective function of θfinal, and then searches the soil hydraulic parameters α, n, and Ks using the hybrid VEGA and PSO method by the objective functions of Q and v. Subsequently, because of the existence of local multiminimum domains of the objective functions in a tiny range of the true values, we analyzed the uniqueness and multiminimum values of the inverse method, as well as the stability and robustness of the inverse method. Finally, we analyzed the feasibility and stability of the proposed method in the presence of measurement errors.
2. Theory
2.1. Unsaturated Flow Governing Equation
The governing flow equation for radially symmetric isothermal Darcy flow in a variably saturated isotropic rigid porous medium, assuming that the air phase plays an insignificant role in the liquid flow process, is provided in the following modified form of the Richards equation [32]:
where θ is the volumetric water content (cm3 cm−3); h is the matric potential induced by capillary action (cm); K(h) is the hydraulic conductivity (cm min−1); z is the depth from the soil surface (cm) measured with positive values in a downward direction; r is the radial coordinate (cm); and t is time (min).
2.2. Initial and Boundary Condition
In Equation (1), we did not consider root water uptake by plant roots and assumed that the porous medium was isotropic; in addition, we assumed that the initial water content (θinitial) and the initial matric potential (hi) were the same in the vertical direction. The following initial and boundary equations (Equations (2)–(5)) were used when Equation (1) was solved numerically.
where hi is the initial matric potential (cm), h0 is the time-variable supply matric potential (cm); and r0 is the disc radius (cm). Equation (1), subject to the abovementioned initial and boundary conditions, was solved using a quasi-three-dimensional finite element model, SWMS-2D, developed by Šimůnek et al. [33]. The numerical solution was based on the mass-conservative iterative scheme proposed by van Genuchten et al. [34].
2.3. van Genuchten–Mualem Model
The soil water retention curve (SWRC), h(θ), and soil water conductivity curve (SWCC), K(θ), are described by Equations (6)–(8) [29]:
where θr and θs are the residual and saturated water content levels (cm3 cm−3), respectively; Ks is the saturated hydraulic conductivity (cm min−1); α is an empirical parameter that is inversely related to the air-entry pressure value (cm−1); n is an empirical parameter related to the pore-size distribution; l is an empirical shape parameter, normally equal to 0.5; m = 1 − 1/n; and Se is the effective saturation.
3. Inverse Method
3.1. Formulation of the Inverse Problem
As evidenced in the previous analysis, h(θ) (Equations (6) and (8)) and K(θ) (Equations (7) and (8)) are highly dependent on the effective saturation, Se. In addition, from Equation (8), the parameters of θr and θs have collinear relationships, thus simultaneous inverse estimation of θr and θs is not possible. Moreover, the value of θr is relatively small with tiny variation range and can be either obtained experimentally (e.g., measuring the water content on very dry soil) or defined as the water content at a large negative value of the matric potential (e.g., the permanent wilting point (h = −15,000 cm)) [29]. Besides, θr can also be obtained from the pedotransfer functions by mechanical composition, bulk density, etc. [10]. Therefore, in the following inverse procedure, we set the value of θr as constant.
The soil water content (θ), cumulative infiltration (Q), infiltration rate (v), and matric potential (h) during the process of the infiltration can be used for the estimation of soil hydraulic parameters. However, measuring the h during infiltration is difficult, and thus, we calibrated the soil hydraulic parameters based on θ, Q, and v.
The parameters α, n, and Ks in the van Genuchten–Mualem model clearly have a complicated nonlinear relationship, and parameters α and Ks vary greatly, which makes them even more difficult to use in an inverse model. Table 1 was obtained from RETC software [34]. Figure 1 illustrates the relationship between α–Ks (1a) and α–n (1b). Notably, as α increases, the corresponding Ks sharply increase, and n increases linearly; the correlation of these parameters should be considered in future research. The ratio α/Ks was used in the development of the inverse model. In Table 1 and other references, the scope of soil hydraulic parameters (θr, θs, α, n, Ks) and α/Ks were determined in Table 2 (set l as 0.5), which covers the vast majority of soil conditions.

Table 1.
Soil hydraulic parameters of the van Genuchten–Mualem model for 12 soils.
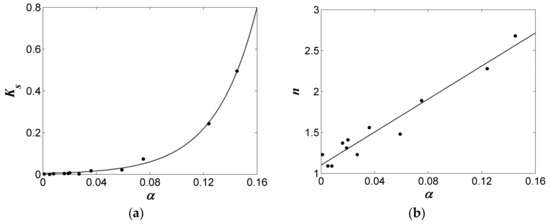
Figure 1.
Relationship between selected soil hydraulic parameters: (a) α–Ks; and (b) α–n.

Table 2.
Inverse scope of soil hydraulic parameters.
The objective function was defined as the root mean squared error (RMSE) divided by the standard deviation (σ) of the observed Q, v, or θ, as shown in Equation (9):
where Y* represents specific measurements, such as Q, v, and θ, at time ti; Y denotes the corresponding model prediction data under parameter vector β; β is the vector of optimized parameters (α, n, and Ks); and m represents the number of measurement sets (of Q, v, and θ).
The objective function ψ can be used to construct the response surface, by varying parameters α, n, θs, and Ks, which can be formulated with one of Q, v, or θ in VEGA, or a combination of them in PSO.
Most relevant studies have used various combinations of objective functions with Q, v, and θ to estimate soil hydraulic parameters; such combinations can convert multiple objective optimization problems into a single-objective optimization problem. However, determining the reasonable weight for the combination objective function is difficult; furthermore, it is likely to increase the complexity of the response surface, as well as the difficulty of searching for a global optimization solution. We adopted a hybrid VEGA and PSO method to solve these inverse problems.
3.2. The Hybrid Optimal Algorithm for Inverse Parameters
3.2.1. The Genetic Algorithm and Particle Swarm Optimization
Genetic Algorithm (GA) is a global stochastic search technique developed by Holland [35]. It begins with initializing a population of candidate solutions randomly sampled from a feasible solution space. Each individual is an entity with a characteristic chromosome, which is the main carrier of genetic material. The binary coding process, which is the process that is most commonly used in GAs, must be implemented from the start. It can realize chromosome mapping from phenotype to genotype. In each generation, individuals are sorted and selected according to values calculated by a fitness function. Then, the system executes combination crossover and variation on all members of the population, using the genetic operators of natural genetics. The best chromosome of the last population can be decoded and regarded as an approximate solution to a practical problem. This process causes the population to evolve in a manner similar to natural evolution, as the most recent generation is more adapted to the environment than the previous generation was. After initialization, the population evolves through the aforementioned steps and approximates the solution more closely with each iteration. This iterative evolution of the parameter solutions ends only when an optimal goal of model evaluations has been reached.
Particle Swarm Optimization (PSO) is an evolutionary optimization algorithm developed by Kennedy and Eberhart [31], which is derived from a study on bird foraging behavior. Initial particles are produced in the solution space. Each particle (Pi) in PSO has three characteristics: its position (Xi) represents a potentially optimal solution, its velocity (Vi) represents the direction and speed of the particle’s movement, and its fitness value (Fi) (calculated by the fitness function) represents the relative merit of the particle. The particle moves in the solution space and updates the its location by tracking the current optimal position (Pbest) and the current global optimal position (Gbest), that is the fitness of the position calculated by one individual and by all particles. In each iteration, each particle is updated; thus, the Pbest and Gbest collected from the particles in each generation are updated. Each particle’s speed can be adjusted dynamically according to its motion and the motions of the other particles, so that the best solution can be achieved in the optimal solution space.
In PSO, each particle (Pi) can be updated using the following equations:
where w < 1 is the inertial weight; c1 and c2 are learning factors; and r1 and r2 are random numbers uniformly distributed in (0,1).
The basic GA with a single population is powerful that its solutions are applicable in most situations. The multi-populations algorithm, in which the individuals can be exchanged through the various sub-groups, is closer to the nature of human evolution and often achieves a more desirable result. GAs have global search capabilities and robust performance, but their optimization searches may have limited efficiency. PSO searches run faster and more accurately than GA searches in local domains, but PSO is susceptible to unstable optimized solutions compared with GA.
3.2.2. Multiobjective Optimization Method Using Hybrid VEGA and PSO Algorithms
In general, inverse problems actually have multiple response variables, such as cumulative infiltration (Q), soil water content (θ), and infiltration rate (v). As these variables may conflict with each other, minimizing a single objective function often results in unacceptable outcomes for other objectives. One classical approach is to combine the individual objective functions into a single composite function. A weight can be assigned to each normalized objective function to solve the multiobjective optimization problem. Consider a decision maker who wishes to optimize multiple objectives, such that the objectives are incommensurable; the decision maker has no clear preference for one or the other. Therefore, in many practical problems, precisely and accurately selecting these weights can be difficult, even for someone familiar with the problem domain.
To solve the multiobjective problems, a VEGA [30] can provide a straightforward and efficient approach compared with the single-objective GA. In this algorithm, the whole population is divided into several subpopulations, which are evaluated with respect to the various objective functions. Normally when a VEGA operates, the whole population is randomly initialized and uniformly divided into K subpopulations of equal size. Each solution in a subpopulation is assigned one fitness value based on each objective function. Solutions are selected from these subpopulations using proportional selection. Crossover and mutation are performed on the new population in the same manner as for a single-objective GA. In addition, the lost individuals in the selection process are complemented by newly created random individuals and the elite population that remains from the previous generation.
Multiobjective functions can be allocated separately by VEGA; the optimization results always fall into the fittest Pareto sets but not the unique, precise solutions [36]. In fact, VEGA can manage the sufficiency and equilibrium of all objective functions, but the shortcoming of this algorithm is that the solution tends to converge to extremes for each objective. Because of this, PSO is introduced to modify the extreme population towards more suitable individuals, but it cannot ensure whether the best solution is the global minimum. Therefore, the algorithms of VEGA and PSO should be rapidly operated alternately to maintain the balance between global searching and the local accuracy of minima. The detailed steps of the hybrid VEGA–PSO algorithm in this inverse problem are as follows:
- Step 1.
- Generate the initial population. The initial population is generated using a binary coding system with total number of K × N; K is the number of subpopulations classified by VEGA, while N is the number of individuals in each subpopulation.
- Step 2.
- Divide the population and calculate fitness in VEGA. VEGA divides the population into K subpopulations and the individuals in each subgroup are evaluated by corresponding fitness functions.
- Step 3.
- Sort and select separately. All the individuals are sorted and selected to eliminate unfit individuals based on the fitness values calculated in Step 2, but different fitness functions operate independently in each subpopulation.
- Step 4.
- Cross and mutate together. The populations selected in Step 3 are mixed together to execute the processes of crossing and mutation, in order to ensure the sufficiency and equilibrium of all fitness functions that VEGA includes.
- Step 5.
- Consider termination of VEGA. If the VEGA iteration number (Steps 3 and 4) is less than the specified value m1, then return to Step 3; otherwise, go to Step 6 (the PSO process).
- Step 6.
- Calculate fitness in PSO. All the individuals are evaluated in PSO by a composite fitness function with several measurement indices, to find minima.
- Step 7.
- Perform PSO operations. Each individual updates its velocity and position according to equations 10 and 11.
- Step 8.
- Consider termination of PSO. If the PSO process iteration number (Steps 6 and 7) is less than the specified value m2, then return to Step 6; otherwise, return to Step 2 (VEGA process).
One cycle of this hybrid VEGA–PSO algorithm (Figure 2) finishes when the iteration numbers m1 in VEGA and m2 in PSO have been reached. If the process reaches the defined number m3 (Gen), the final termination condition is met and the final solution is output.
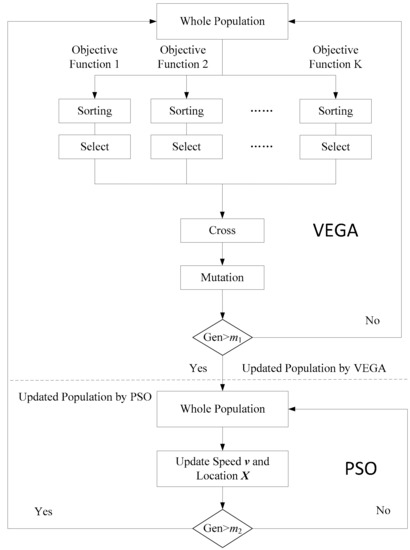
Figure 2.
Flowchart of an entire optimizing cycle of the hybrid VEGA–PSO algorithm.
3.3. Data Generation
This study conducted an inverse estimation of the soil hydraulic parameters for four soils (sand, loam, silt, and clay from Table 1) under three initial levels of water content, θinitial, (Se = 20%, 40% and 60%). The infiltration data used in this study were generated using SWMS-2D software [33]. Only the first three hours of the infiltration process were considered with the time-variable supply matric potential, h0, which are described in Equation (12). The initial hi were calculated by the corresponding parameters in Table 1. Figure 3 illustrates the results of Q under θinitial = 40% effective saturation degree.
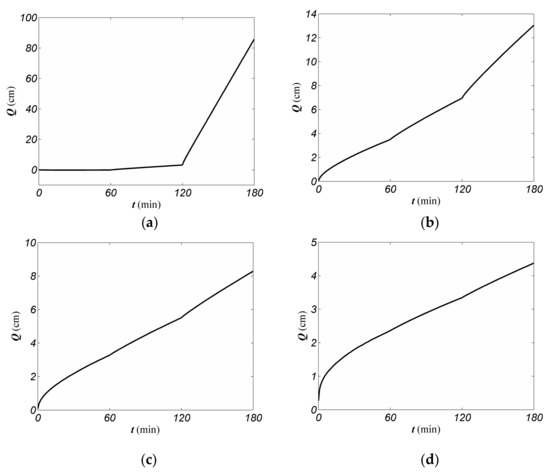
Figure 3.
Cumulative infiltration versus time for four types of soil with three consecutive supply matric potentials (h0 (t = 0) = −15 cm; h0 (t = 60) = −10 cm; and h0 (t = 120) = −3 cm): (a) Sand; (b) Loam; (c) Silt; and (d) Clay.
3.4. Similarity Evaluation Criteria between Estimated and True SWRC and SWCC
To evaluate the similarity of the estimated (by inverse solution) and true soil water retention curves (SWRCs) and soil water conductivity curves (SWCCs), a certain amount of points were selected on the estimated (by inverse solution) and the true curves, with the same suction under SWRC and the same conductivity under SWCC. Subsequently, the soil water content levels of various points were calculated. Therefore, the similarity between the estimated and true SWRCs and SWCC were quantified using the following statistical indices: the root mean square error (RMSE), percent bias (PBIAS), and Nash–Sutcliffe coefficient (NS) [37]. These indices are defined as follows:
where m is the number of selected points in each SWRC and SWCC, which was set as 50 in our study; θiest is the ith point of soil water content on the estimated SWRC and SWCC; and θitrue is the ith point of soil water content on the true SWRC and SWCC, with the same suction and conductivity.
4. Results and Discussion
4.1. Response Surface and Inverse Solutions
Based on the aforementioned analysis, we concentrated on the soil hydraulic parameters of θs, α, n, and Ks, with the θr set as constant. To more clearly analyze the mutual interactions in objective function ψ of the four parameters θs, α, n, and Ks, the response surfaces for various parameter planes (α–n, α–Ks, n–Ks, n–θs, α–θs, and Ks–θs) for four types of soil (sand, loam, silt, and clay) with three initial soil water content levels (Se = 20%, 40%, and 60%) were calculated. Each parameter domain was evenly divided into 50 discrete points, resulting in 2500 (50 × 50) grid points for each response surface. All operations were conducted using an Intel® XEON® CPU E5-2683 2.00 GHz processor and 32 GB of RAM in a Windows 7 Ultimate environment; a 28-core server was available for us to compute the algorithm.
4.1.1. Analysis of the Objective Function ψ(θfinal)
The objective function ψ(θfinal) was defined using the water content at the end of infiltration (θfinal). Figure 4 illustrates the response surfaces of parameter planes, including α–n (Figure 4a), α–Ks (Figure 4b), n–Ks (Figure 4c), n–θs (Figure 4d), α–θs (Figure 4e), and Ks–θs (Figure 4f), with the remaining two parameters set at the true values in the objective function of ψ(θfinal). For visualization, the logarithmic coordinates were selected for α and Ks. From observing the first three contours in Figure 4a–c, the three planes α–n, α–Ks, n–Ks and the minimum values of ψ(θfinal) all clearly fall in a significant narrow and long valley. This means that even if the other two parameters are determined, the stable optimal values of α, n, and Ks are still difficult to determine from ψ(θfinal). In Figure 4d–f, all three response surfaces, θs–n, θs–α, and θs–Ks, display smooth uniform rings and have obvious extreme points in each minimum circle. This feature suggests that it was possible to use the objective function, ψ(θfinal), to obtain the true value of θs.
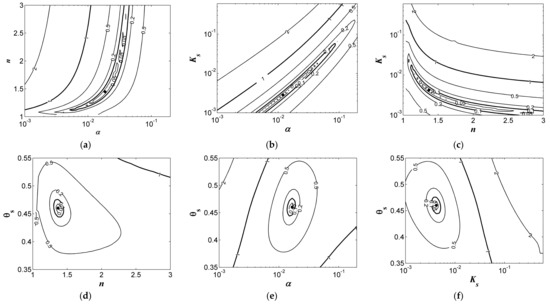
Figure 4.
Contours of objective function ψ(θfinal) of silt under θinitial equal to a 40% effective saturation degree. The hydraulic parameters of silt: θr = 0.034 cm3 cm−3; θs = 0.46 cm3 cm−3; α = 0.016 cm−1; n = 1.37; Ks = 0.0042 cm min−1. Results are plotted in the: (a) α–n; (b) α–Ks; (c) n–Ks; (d) n–θs; (e) α–θs; and (f) Ks–θs parameter planes. The solid circles are the true parameters.
4.1.2. Analysis of the Objective Functions ψ(v) and ψ(Q)
If the value of θs can be determined with objective function ψ(θfinal), similar to the abovementioned analysis, the mutual interactions of α–n, α–Ks, and n–Ks can be determined with objective functions ψ(v) and ψ(Q); the results of those calculations are illustrated in Figure 5 and Figure 6. In Figure 5a–c, α–n, α–Ks, and n–Ks are depicted; all response surfaces evidently have global optima; therefore, after the value of θs is determined, finding the true values of α, n, and Ks is possible using the optimization method under the objective function ψ(v). Furthermore, the response surface ψ(v), with the parameters α, n, and Ks, was re-estimated near its true value and the results are shown in Figure 5d–f. The response surfaces of α–n (Figure 5d) and n–Ks (Figure 5f) can be observed to have obvious global optimal solutions, whereas for α–Ks (Figure 5e), global optimal solutions exist in the response surfaces with numerous optimal bubbles in the valley. This creates difficulty in precisely searching for the true values of α, n, and Ks only using ψ(v).
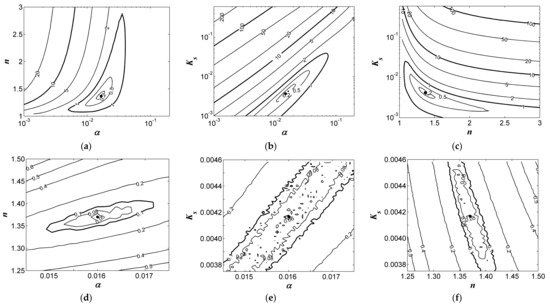
Figure 5.
Contours of objective function ψ(v) of silt under θinitial equal to a 40% effective saturation degree. The hydraulic parameters of silt: θr = 0.034 cm3 cm−3; θs = 0.46 cm3 cm−3; α = 0.016 cm−1; n = 1.37; Ks = 0.0042 cm min−1. Results are plotted in the: (a,d) α–n; (b, e) α–Ks; and (c,f) n–Ks parameter planes. (a–c) depict the global scale, while (d–f) depict the local scale near the minimum. The solid circles are the true parameters.
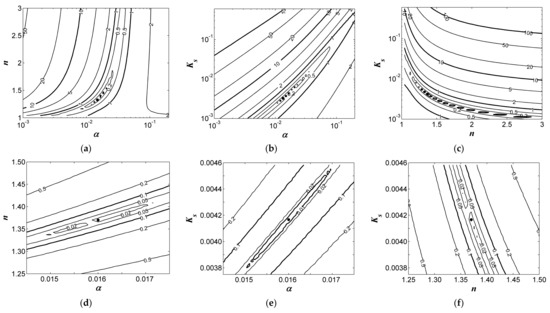
Figure 6.
Contours (in detail) of objective function ψ(Q) of silt under θinitial equal to a 40% effective saturation degree. The hydraulic parameters of silt: θr = 0.034 cm3 cm−3; θs = 0.46 cm3 cm−3; α = 0.016 cm−1; n = 1.37; Ks = 0.0042 cm min−1. Results are plotted in the: (a,d) α–n; (b,e) α–Ks; and (c,f) n–Ks parameter planes. (a–c) depict the global scale, while (d–f) depict the local scale near the minimum. The solid circles are the true parameters.
In Figure 6a–c, the response surfaces of α–n (Figure 6a), α–Ks (Figure 6b), and n–Ks (Figure 6c) clearly reveal that the minimum values of ψ(Q) were concentrated in a long narrow valley. Therefore, only using the objective function of ψ(Q) to search for the true values of α, n, and Ks directly is difficult, but it can compress α–n, α–Ks, and n–Ks in a narrow space. Furthermore, similar to the aforementioned analysis, the response surface of ψ(Q) under the parameters α, n, and Ks was recalculated to approximate its true value and the results are shown in Figure 6d–f. This further confirmed that the role of the objective function ψ(Q) is compressing α–n, α–Ks, and n–Ks in a narrow space in the search for α, n, and Ks. Specifically, the response surface of the plane of α–Ks (Figure 6e) indicated that the optimal value was decompressed in a distinct line-like interval, which was helpful for us in searching for the true values.
As a result, with synthetic analysis, the relationships between the parameter planes of α–n (Figure 5d) and n–Ks (Figure 5f) with the objective function ψ(v), as well as α–Ks (Figure 6e) with the objective function ψ(Q), determining the true values of α, n, and Ks based on the multiple applications of the objective functions ψ(v) and ψ(Q) was possible.
4.2. Inverse Solution and Analysis
4.2.1. The Procedure of Inverse Modeling
According to the aforementioned analysis, we first used the objective function of ψ(θfinal) to search for θs with the GA. The values of θfinal for the inverse modeling of typical soils with various θinitial values were simulated using SWMS-2D. The true parameters are shown in Table 1. For practical use, 24 grid points of θfinal located at radial distance = 0, 5, 10, and 15, and depth = 2, 5, 10, 15, 20, and 35 were used for inverse parameters. According to the scope and features of these parameters, θs and n were coded in arithmetic scaling and Ks was coded in logarithmic scaling, whereas α was represented by the ratio value of α/Ks, which was coded in arithmetic scaling. The population size (PopSize) of GA was 24 and the maximum number of iterations was 30.
Second, with the value of θs set as in the abovementioned inverse model, the hybrid VEGA–PSO algorithm was used with two objective functions, ψ(v) and ψ(Q), comprehensively. The values of Q and v were selected every three minutes, with 60 points in total. The PopSize of PSO was 24, and each subgroup had two objective functions, ψ(v) and ψ(Q). The two subgroups of GA for ψ(v) and ψ(Q) had the same PopSize of 12. The coding mode of θs, α, n, and Ks were the same as the aforementioned step. For each individual, we set the generation iterations m1 and m2 as 3 in both GA and PSO for one coupling cycle, and the total number of coupling cycles was set at 30. The selection probability Ps, the crossover probability Pc, and the mutation probability Pm were defined from GA optimization experience as the values 0.667, 0.80, and 0.20, respectively. In PSO, the inertial weight, w, and the learning factors, c1, and c2 (in Equation (10)), were defined as the default values, equal to 0.729, 2.0, and 2.0 respectively.
4.2.2. Inverse Solution
To further verify the feasibility of the parameter inverse estimation approach, we conducted 12 cases including four types of typical soil from RETC (sand, loam, silt, and clay) under three initial water content levels (20%, 40%, and 60% degrees of effective saturation). Table 3 summarizes the results of the 12 cases of parameter inversion. Although small differences existed between the estimated and true values of each parameter, the estimates were close to the true values.

Table 3.
Estimated parameters under three initial water content levels for four types of soil.
4.2.3. Analysis of the Inverse Solution
The true and the inversely estimated parameter values listed in Table 3 were used to draw the SWRC and SWCC, respectively, which are depicted in Figure 7. SWRCs are illustrated as a1, b1, c1, and d1; SWCC are illustrated as a2, b2, c2, and d2. Despite the small differences between the true and estimated values of α, n, and Ks (Table 3), the true and the estimated SWRCs and SWCCs are almost identical, which indicates that the proposed inverse method is effective and robust.
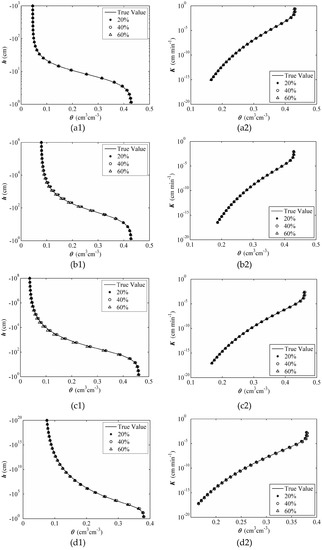
Figure 7.
Comparison of SWRCs (a1,b1,c1,d1) and conductivity curves (a2,b2,c2,d2) for various treatments (20% effective saturation degree for initial water content, circle; 40% effective saturation degree for initial water content, triangle; 60% effective saturation degree for initial water content, square; true value, line): (a) Sand; (b) Loam; (c) Silt; and (d) Clay.
To evaluate the precision and robustness of the proposed inverse method, several performance indicators (RMSE, PBIAS, and NS) were adopted to estimate the differences between the true and estimated curves. Fifty points were selected from suction curves, h(θ), and conductivity curves, K(θ). Subsequently, the corresponding 50 soil water content levels were calculated. Table 4 illustrates the results of the error evaluation indicators, which indicate that our procedure is suitable for inverse modeling of soil hydraulic properties; this is because of extremely small MAE, RMSE, and PBIAS values for SWRCs (0.00039–0.000076 cm3·cm−3, 0.00071–0.00097 cm3·cm−3, and 0.0147–0.1603%, respectively) and also for conductivity curves (0.000004–0.00014 cm3·cm−3, 0.00003–0.00059 cm3·cm−3, and 0.2725–1.2131%, respectively), as well as a large NS (nearly 1.0). Furthermore, the inverse method is indicated to be able to estimate the SWRC and SWCC with precision and robustness.

Table 4.
Soil water content errors from estimated SWRCs and SWCCs for the four types of soil.
4.3. Inverse Solutions with Measurement Errors
In real situations, some errors always exist, which are related to instrumentation, calibration, and other factors. Therefore, to assess the stability of the inverse solution, we considered a random error in cumulative infiltration and both the random error and system error for the initial and final water content levels, respectively. First, we set the random error as a 0.05 standard deviation (5.0%) and the two system errors as +0.02 and −0.02, respectively, for the θinitial and θfinal. Subsequently, the two random errors were set as 0.02 and 0.05 of standard deviation (2.0% and 5.0%), and superimposed them to the cumulative infiltration. Similar to the error-free inverse method, all of the inversion computations were run again based on the proposed algorithm for the four representative soils (sand, loam, silt, and clay) with the θinitial (40% degree of effective saturation).
4.3.1. Inverse Solution Analysis Based on Initial and Final Water Content
Table 5 shows the inverse parameter values (θs, α, n, Ks) of the four typical soils. The results suggested that superimposition of random and system errors on the error-free data result in only small deviations from the true parameters. Table 5 reveals that most values of the inverse parameters were even closer to their true values, which indicates that the proposed method was useful in practical application.

Table 5.
Estimated parameters considering random and system errors on initial and final water content levels for the four typical soils.
Again, to assess the effective measurement error of the estimated values, the SWRCs and SWCCs were plotted based on the estimated and true values of the four typical soils in three error source cases, as shown in Figure 8 (initial water content) and Figure 9 (final water content). Both curves suggested that, although slight differences existed between the random and system error curves and the true curves, the effective measurement error was still acceptable.
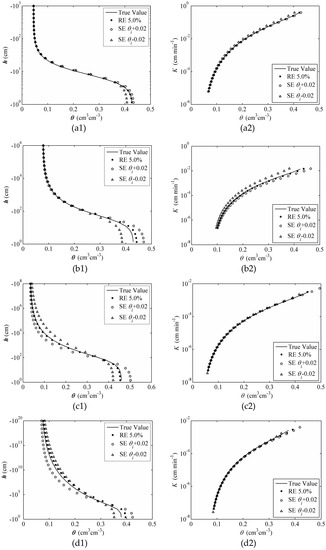
Figure 8.
Comparison of SWRCs (a1,b1,c1,d1) and conductivity curves (a2,b2,c2,d2) with random errors (RE) and system errors (SE) for various treatments with objective function ψ(θinitial): (a) Sand; (b) Loam; (c) Silt; and (d) Clay.
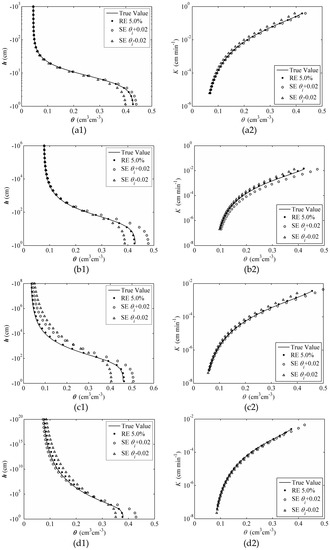
Figure 9.
Comparison of SWRCs (a1,b1,c1,d1) and conductivity curves (a2,b2,c2,d2) with random errors (RE) and system errors (SE) for various treatments with objective function ψ(θfinal): (a) Sand; (b) Loam; (c) Silt; and (d) Clay.
Table 6 illustrates several error evaluation indicators, including RMSE, PBIAS, and NS, to estimate the differences between inverse solutions with measurement errors and true values. Fifty points were averaged and selected from suction curves, h(θ), and conductivity curves, K(θ), and the corresponding 50 soil water content levels were calculated. Table 6 illustrates the results of error evaluation indicators, with extremely small RMSE (0.0018 to 0.03849 from h(θ), and 0.00039 to 0.02591 from K(θ)); small PBIAS (0.1401 to 14.1667 from h(θ), and 00847 to 10.0447 from K(θ)); and large NS (0.9308 to 0.9999 from h(θ), and 0.9319 to 1.0000 from K(θ)). The results indicated that the proposed inverse method is suitable for estimating soil hydraulic properties.

Table 6.
Soil water content errors from estimated SWRCs and SWRCs considering both random and system errors on initial and final water content levels for the four typical soils.
4.3.2. Inverse Solution Analysis Based on Cumulative Infiltration
In terms of cumulative infiltration, only random errors occurred; therefore, only two standard deviations of random errors, 0.02 and 0.05, were analyzed for the inverse solutions. Table 7 shows the results, which still suggest that small deviations existed between the estimated values with measurement errors and true values.

Table 7.
Estimated parameters considering random errors on cumulative infiltration for the four typical soils.
Figure 10 depicts the SWRCs and SWCCs based on the inverse solutions within two standard deviations of random error. Small differences exist between the estimated values with measurement errors and the true values from these curves; their existence indicates that the inverse method was reasonable and robust for the inversion of soil hydraulic parameters. Furthermore, Table 8 demonstrates the values of RMSE, PBIAS, and NS between the true values and the estimated values with measurement errors. The small RMSE and PBIAS and large NS indicate the effectiveness and robustness of the inverse modeling.
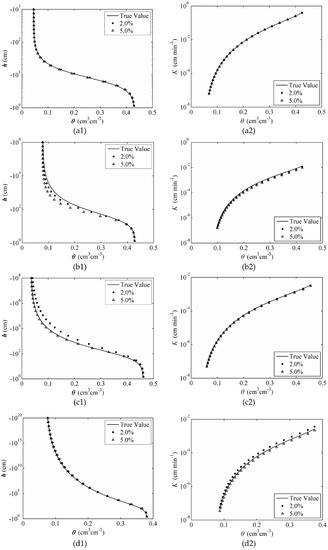
Figure 10.
Comparison of SWRCs (a1,b1,c1,d1) and conductivity curves (a2,b2,c2,d2) with random errors and system errors for various treatments with objective function ψ(Q) (random error (RE), 2.0%, circle; random error, 5.0%, triangle; true value, line): (a) Sand; (b) Loam; (c) Silt; and (d) Clay.

Table 8.
Soil water content errors from estimated SWRCs and SWCCs considering random errors on cumulative infiltration for the four typical soils.
5. Conclusions
In this study, we analyzed the inversion of soil hydraulic parameters for four typical soils (sand, loam, silt, and clay) under three initial water content levels (Se = 20%, 40%, and 60%). A new inverse method called the “two-step method” was proposed. According to the two-step method, the saturated water content, θs, was primarily searched through GA with θfinal. Subsequently, using the multiobjective optimization method based on the hybrid VEGA algorithm, the soil characteristic parameters α, n, and Ks could be accurately estimated by cumulative infiltration and infiltration rate obtained by the SWMS-2D software for simulating water flow in two-dimensional variably unsaturated porous media. The results indicated that the proposed method is highly effective. In particular, compared with the traditional multitarget weighted sum optimization method, the hybrid VEGA–PSO algorithm method can overcome the difficulties of weight determination and search for the global optimal values efficiently and robustly.
Using the proposed method, accurate estimation of the hydraulic parameters remained difficult because the objective function had multilocal minimum values near the tiny range of true values. However, by comparing the SWRCs and SWCCs from the estimated and true values, we discovered that the curves were nearly identical. The results indicated that the proposed method can accurately estimate the SWRC and SWCC, although drawing a unique solution with the algorithm was difficult. Furthermore, considering that measurement errors of the initial water content, final water content, and cumulative infiltration inevitably exist in practical applications, comparison of the estimated SWRCs and SWCCs under measurement errors with the true curves proved that little difference existed. The results were acceptably accurate, which proved the proposed method to be robust and practical in the field. However, the inhomogeneity of soil textures and soil water content distribution require further investigation.
Acknowledgments
This research was jointly supported by grants from the National Natural Science Foundation of China (No. 51279167 and No. 51579205), Special Fund for Agro-scientific Research in the Public Interest (No. 201503124), and Specialized Research Fund for the Doctoral Program of Higher Education of China (No. 20120204110023).
Author Contributions
Xiao-Yi Ma, Yi-Bo Li, and Wei-Bo Nie conceived and designed the model; Ye Liu, Yi-Bo Li, and Xiao-Yi Ma wrote the computing code of the model; Yi-Bo Li wrote the paper; and Xiao-Yi Ma and Wei-Bo Nie revised the paper.
Conflicts of Interest
The authors declare no conflict of interest.
References
- Bear, J. Dynamic of fluid in porous media. Soil Sci. 1972, 120, 174–175. [Google Scholar]
- Hillel, D. Fundamentals of Soil Physics; Elsevier Inc.: Amsterdam, The Netherlands, 2013; pp. 387–405. [Google Scholar]
- Durner, W.; Flühler, H. Soil Hydraulic Properties; John Wiley & Sons, Ltd.: New York, NY, USA, 2006; pp. 147–162. [Google Scholar]
- Russo, D. Determining soil hydraulic properties by parameter estimation: On the selection of a model for the hydraulic properties. Water Resour. Res. 1988, 24, 453–459. [Google Scholar] [CrossRef]
- Klute, A.; Dirksen, C. Hydraulic Conductivity and Diffusivity: Laboratory Methods, 2nd ed.; American Society of Agronomy-Soil Science Society of America: Madison, WI, USA, 1986; pp. 687–734. Available online: https://dl.sciencesocieties.org/publications/books/abstracts/sssabookseries/methodsofsoilan1/687/preview/pdf (accessed on 1 January 1986).
- Schindler, U.; Mueller, L.; Unold, G.V.; Durner, W.; Fank, J. Emerging Measurement Methods for Soil Hydrological Studies; Springer: Berlin, Germany, 2016; pp. 345–363. [Google Scholar]
- Libardi, P.L.; Reichardt, K.; Nielsen, D.R.; Biggar, J.W. Simple field methods for estimating soil hydraulic conductivity. Soil Sci. Soc. Am. J. 1980, 44, 3–7. [Google Scholar] [CrossRef]
- Ritter, A.; Hupet, F.; Muñoz-Carpena, R.; Lambot, S.; Vanclooster, M. Using inverse methods for estimating soil hydraulic properties from field data as an alternative to direct methods. Agric. Water Manag. 2003, 59, 77–96. [Google Scholar] [CrossRef]
- Grayson, R.; Bloschl, G. Spatial Patterns in Catchment Hydrology: Observations and Modeling; University Press: Cambridge, UK, 2001; p. 404. [Google Scholar]
- Wösten, J.H.M.; Pachepsky, Y.A.; Rawls, W.J. Pedotransfer functions: Bridging the gap between available basic soil data and missing soil hydraulic characteristics. J. Hydrol. 2001, 251, 123–150. [Google Scholar] [CrossRef]
- Zachmann, D.W.; Duchateau, P.C.; Klute, A. The Calibration of the Richards Flow Equation for a Draining Column by Parameter Identification1. Soil Sci. Soc. Am. J. 1981, 45, 1012–1015. [Google Scholar] [CrossRef]
- Zachmann, D.W.; Duchateau, P.C.; Klute, A. Simultaneous Approximation of Water Capacity and Soil Hydraulic Conductivity by Parameter Identification. Soil Sci. 1982, 134, 157–163. [Google Scholar] [CrossRef]
- Kool, J.B.; Parker, J.C. Analysis of the inverse problem for transient unsaturated flow. Water Resour. Res. 1988, 24, 817–830. [Google Scholar] [CrossRef]
- Toorman, A.F.; Wierenga, P.J.; Hills, R.G. Parameter estimation of hydraulic properties from one-step outflow data. Water Resour. Res. 1992, 28, 3021–3028. [Google Scholar] [CrossRef]
- Nor Suhada, A.R.; Askari, M.; Tanaka, T.; Simunek, J.; van Genuchten, M.T. Inverse estimation of soil hydraulic properties under oil palm trees. Geoderma 2015, 241–242, 306–312. [Google Scholar] [CrossRef]
- Šimůnek, J.; van Genuchten, M.T.; Wendroth, O. Parameter Estimation Analysis of the Evaporation Method for Determining Soil Hydraulic Properties. Soil Sci. Soc. Am. J. 1998, 62, 894–905. [Google Scholar] [CrossRef]
- Šimůnek, J.; Wendroth, O.; van Genuchten, M.T. Soil Hydraulic Properties from Laboratory Evaporation Experiments by Parameter Estimation. In Proceedings of the International Workshop, Characterization and Measurement of the Hydraulic Properties of Unsaturated Porous Media, Riverside, CA, USA, 22–24 October 1997; Van Genuchten, M.T., Leij, F.J., Wu, L., Eds.; University of California: Riverside, CA, USA, 1997. [Google Scholar]
- Schindler, U.; Müller, L. Simplifying the evaporation method for quantifying soil hydraulic properties. J. Plant Nutr. Soil Sc. 2010, 169, 623–629. [Google Scholar] [CrossRef]
- Šimůnek, J.; van Genuchten, M.T. Estimating Unsaturated Soil Hydraulic Properties from Tension Disc Infiltrometer Data by Numerical Inversion. Water Resour. Res. 1996, 32, 2683–2696. [Google Scholar] [CrossRef]
- Šimůnek, J.; van Genuchten, M.T. Estimating Unsaturated Soil Hydraulic Properties from Multiple Tension Disc Infiltrometer Data. Soil Sci. 1997, 162, 383–398. [Google Scholar] [CrossRef]
- Gribb, M.M. Parameter Estimation for Determining Hydraulic Properties of a Fine Sand from Transient Flow Measurements. Water Resour. Res. 1996, 32, 1965–1974. [Google Scholar] [CrossRef]
- Gribb, M.M.; Šimůnek, J.; Leonard, M.F. Development of Cone Penetrometer Method to Determine Soil Hydraulic Properties. J. Geotech. Geoenviron. Eng. 1998, 124, 820–829. [Google Scholar] [CrossRef]
- Inoue, M.; Šimunek, J.; Hopmans, J.W.; Clausnitzer, V. In situ estimation of soil hydraulic functions using a multistep soil-water extraction technique. Water Resour. Res. 1998, 34, 1035–1050. [Google Scholar] [CrossRef]
- Dam, J.C.V.; Stricker, J.N.M.; Droogers, P. Inverse Method for Determining Soil Hydraulic Functions from One-Step Outflow Experiments. Soil Sci. Soc. Am. J. 1992, 56, 1042–1050. [Google Scholar]
- Eching, S.O.; Hopmans, J.W. Optimization of Hydraulic Functions from Transient Outflow and Soil Water Pressure Data. Soil Sci. Soc. Am. J. 1993, 57, 1167–1175. [Google Scholar] [CrossRef]
- Eching, S.O.; Hopmans, J.W.; Wendroth, O. Unsaturated Hydraulic Conductivity from Transient Multistep Outflow and Soil Water Pressure Data. Soil Sci. Soc. Am. J. 1994, 58, 687–695. [Google Scholar] [CrossRef]
- Vereecken, H.; Kaiser, R.; Dust, M.; Pütz, T. Evaluation of the Multistep Outflow Method for the Determination of Unsaturated Hydraulic Properties of Soils. Soil Sci. 1997, 162, 618–631. [Google Scholar] [CrossRef]
- Vrugt, J.A.; Bouten, W.; Weerts, A.H. Information Content of Data for Identifying Soil Hydraulic Parameters from Outflow Experiments. Soil Sci. Soc. Am. J. 2001, 65, 19–27. [Google Scholar] [CrossRef]
- Van Genuchten, M.T. A closed-form equation for predicting the hydraulic conductivity of unsaturated soils. Soil Sci. Soc. Am. J. 1980, 44, 892–898. [Google Scholar] [CrossRef]
- Konak, A.; Coit, D.W.; Smith, A.E. Multi-objective optimization using genetic algorithms: A tutorial. Reliab. Eng. Syst. Saf. 2006, 91, 992–1007. [Google Scholar] [CrossRef]
- Eberhart, R.C.; Kennedy, J. A new optimizer using particle swarm theory. In Proceedings of the 6th International Symposium on Micro Machine and Human Science, Nagoya, Japan, 4–6 October 1995; pp. 39–43. [Google Scholar] [CrossRef]
- Richards, L.A. Capillary conduction of liquids through porous mediums. Physics 1931. 1, 318–333. [CrossRef]
- Šimůnek, J.; Vogel, T.; van Genuchten, M.T. The SWMS-2D for Simulating Water Flow and Solute Transport in Two-Dimensional Variably Saturated Media: Version 1.21; US Salinity Laboratory, US Department of Agriculture, Agricultural Research Service: Riverside, CA, USA, 1995.
- Van Genuchten, M.T.; Leij, F.J.; Yates, S.R. The RETC Code for Quantifying the Hydraulic Functions of Unsaturated Soils. Research Report No. EPA/600/2-91/065; US Salinity Laboratory, US Department of Agriculture, Agricultural Research Service: Riverside, CA, USA, 1991. Available online: http://www.pc-progress.com/documents/programs/retc.pdf (accessed on 1 December 1991).
- Holland, J.H. Adaptation in Natural Artificial Systems; The MIT Press: London, UK, 1975. [Google Scholar]
- Schaffer, J.D. Multiple Objective Optimization with Vector Evaluated Genetic Algorithms. In Proceedings of the 1st International Conference on Genetic Algorithms, Hillsdale, NJ, USA, 24–26 July 1985; Volume 2, pp. 93–100. [Google Scholar]
- Moriasi, D.N.; Arnold, J.G.; Van Liew, M.W.; Bingner, R.L.; Harmel, R.D.; Veith, T.L. Model Evaluation Guidelines for Systematic Quantification of Accuracy in Watershed Simulations. Trans. ASABE 2007, 50, 885–900. [Google Scholar] [CrossRef]
© 2018 by the authors. Licensee MDPI, Basel, Switzerland. This article is an open access article distributed under the terms and conditions of the Creative Commons Attribution (CC BY) license (http://creativecommons.org/licenses/by/4.0/).