2.1. Variation in sap flow
Following electronic problems with the probes some data were missing in the first poplar tree (P1) between mid-August and mid-September. However, results were comparable between the two poplar trees P1 and P2 over 84 days,
i.e., almost three months (
Figure 1). Measurements in P1 showed a steady decrease in the mean daily Qsi from the outer to inner depth;
i.e., from 24.9 dm
3 dm
–2 day
–1 at 0–2 cm to 13.5 dm
3 dm
–2 day
–1 at 6–8 cm (
Table 1). In P2, sap flows were more homogeneous and slightly lower, except in the inner 6–8 cm. From one day to another, very high daily variations in Qsi could be observed, with possible sharp drops or increases from one day to another. Maximum Qsi values were as high as 10 to 15 times the minimum. The mean values of the Qsi were 18.6 and 15.7 dm
3 dm
–2 day
–1 in P1 and P2, respectively.
Figure 1.
Daily variation of sap flux density (Qsi) in the two I214 poplars.
Figure 1.
Daily variation of sap flux density (Qsi) in the two I214 poplars.
Table 1.
Radial patterns of sap flow for the two I214 poplars (n = 84 days).
Table 1.
Radial patterns of sap flow for the two I214 poplars (n = 84 days).
| P1 | P2 |
| | 0-2cm | 2-4cm | 4-6cm | 6-8cm | 0-8cm | | 0-2cm | 2-4cm | 4-6cm | 6-8cm | 0-8cm |
| Qsi sap flux density (dm3 dm−2 day−1) | mean Qsi | Qsi sap flux density (dm3.dm−2.day−1) | mean Qsi |
| mean | 24.9 | 18.4 | 17.6 | 13.5 | 18.6 | mean | 19.1 | 12.2 | 16.2 | 15.2 | 15.7 |
| sd | 8.2 | 6.9 | 7.8 | 5.0 | 7.0 | sd | 7.54 | 5.14 | 8.43 | 7.68 | 7.2 |
| min | 6.3 | 4.3 | 3.7 | 3.4 | 4.4 | min | 3.31 | 2.54 | 2.32 | 2.19 | 2.6 |
| max | 45.4 | 32.7 | 33.5 | 25.3 | 34.2 | max | 33.1 | 21.9 | 32.8 | 29.0 | 29.2 |
| Qi sap flow (dm3.day−1) | total Q | Qi sap flow (dm3.day−1) | total Q |
| mean | 35.7 | 21.3 | 15.6 | 8.6 | 81.3 | mean | 30.3 | 16.1 | 17.3 | 12.4 | 75.9 |
| sd | 11.2 | 7.4 | 6.8 | 3.1 | 25.6 | sd | 11.8 | 6.8 | 9.0 | 6.3 | 33.2 |
| min | 12.5 | 7.1 | 3.3 | 3.1 | 28.6 | min | 5.2 | 3.4 | 2.5 | 1.8 | 16.6 |
| max | 64.5 | 37.0 | 29.5 | 15.9 | 135.5 | max | 52.0 | 28.9 | 35.0 | 23.7 | 137.9 |
| Pi, percentage of total sap flow Q (%) | Pi, percentage of total sap flow Q (%) |
| total | | total |
| mean | 44.6 | 26.2 | 18.6 | 10.7 | 100.0 | mean | 41.1 | 21.6 | 21.7 | 15.6 | 100.0 |
| sd | 6.1 | 3.6 | 4.7 | 2.3 | 0.0 | sd | 5.7 | 3.17 | 3.37 | 2.41 | 0.0 |
| min | 27.9 | 16.3 | 7.7 | 6.3 | 100.0 | min | 24.5 | 16.8 | 13.8 | 9.82 | 100.0 |
| max | 59.8 | 34.7 | 32.5 | 17.0 | 100.0 | max | 57.1 | 43.1 | 26.1 | 21.03 | 100.0 |
Once the sap flux densities Qsi are weighted at each depth by the annular areas of the corresponding sapwood using Equation 1 (
Section 3.2.), the resulting sap flow Qi provides the daily water uptake by the tree at each radial depth (
Table 1). In P1 sapwood areas at the four increasing depths were 1.38, 1.13, 0.88, 0.63 dm
2 respectively (total = 4.02 dm
2 over 0–8 cm). In P2, sapwood areas were 1.57, 1.32, 1.07 and 0.82 dm
2 with a total of 4.78 dm
2 over 0–8 cm.
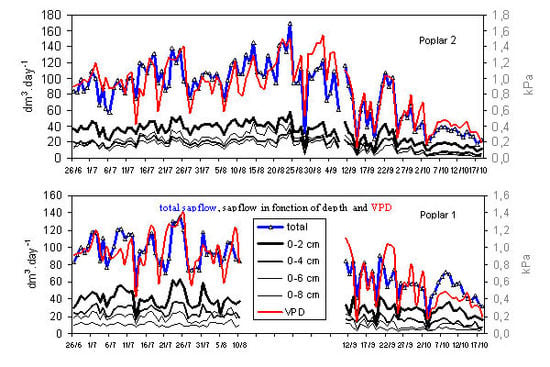
In P1, there was a steady decreasing trend in the mean Qi values from the outer to inner sapwood (
i.e., from 35.7 dm
3 day
–1 at 0–2 cm to 8.6 dm
3 day
–1 at 6–8 cm), with again sharply contrasts from one day to another (
Figure 2). In P2, sap flows were less contrasted (
i.e., from 30.0 dm
3 day
–1 at 0–2 cm to 12.4 dm
3 day
–1 at 6–8 cm).
Figure 2.
Daily variation of sap flow Qi at the four radial depths and at the tree level (Q) for the two I214 poplars with the corresponding daily vapor pressure deficits (VPD).
Figure 2.
Daily variation of sap flow Qi at the four radial depths and at the tree level (Q) for the two I214 poplars with the corresponding daily vapor pressure deficits (VPD).
2.2. Variation in water use
At the tree level, the daily whole tree water use Q were computed as the sum of the Qi over the four depths (
i.e. over 0–8 cm) using Equation 2 (
Section 3.2.). Thus, over a period of 84 days, the daily tree water use fluctuated in the range of 28.6 to 135 dm
3 day
–1 in P1 and 16.6 to137.9 dm
3 day
–1 in P2, with an overall mean daily total of 81.3 dm
3 day
–1 and 75.9 dm
3 day
–1, respectively. In both trees, 41 to 45% of the total sap was flowing in the outer 0–2 cm ring. In contrast, the contributions of the other three depths remained between 19 and 26% at 2–4 cm and 4–6 cm, and close to 10 to 15% at the inner depth of 6–8 cm. This decreasing contribution is due to both decreasing sap flux densities and decreasing areas of sapwood with increasing depths. Results also indicates that in P2, the internal sap flow (4–8 cm) was relatively higher than in P2 and represented about 37 % of the whole tree water use compared to 29 % in the P1 (
Table 1). Results also showed that despite the very high fluctuation of sap flow and whole tree water use from one day to another, contributions of each sapwood depth to the total water uptake did not fluctuate so much and remained rather stable, as indicated by relatively low standard deviations from 2.3 to 6.1 % (
Table 1). In other words, an increase (or decrease) in water uptake by a tree is done by a simultaneous and proportional increase (or decrease) in sap flow at all depth.
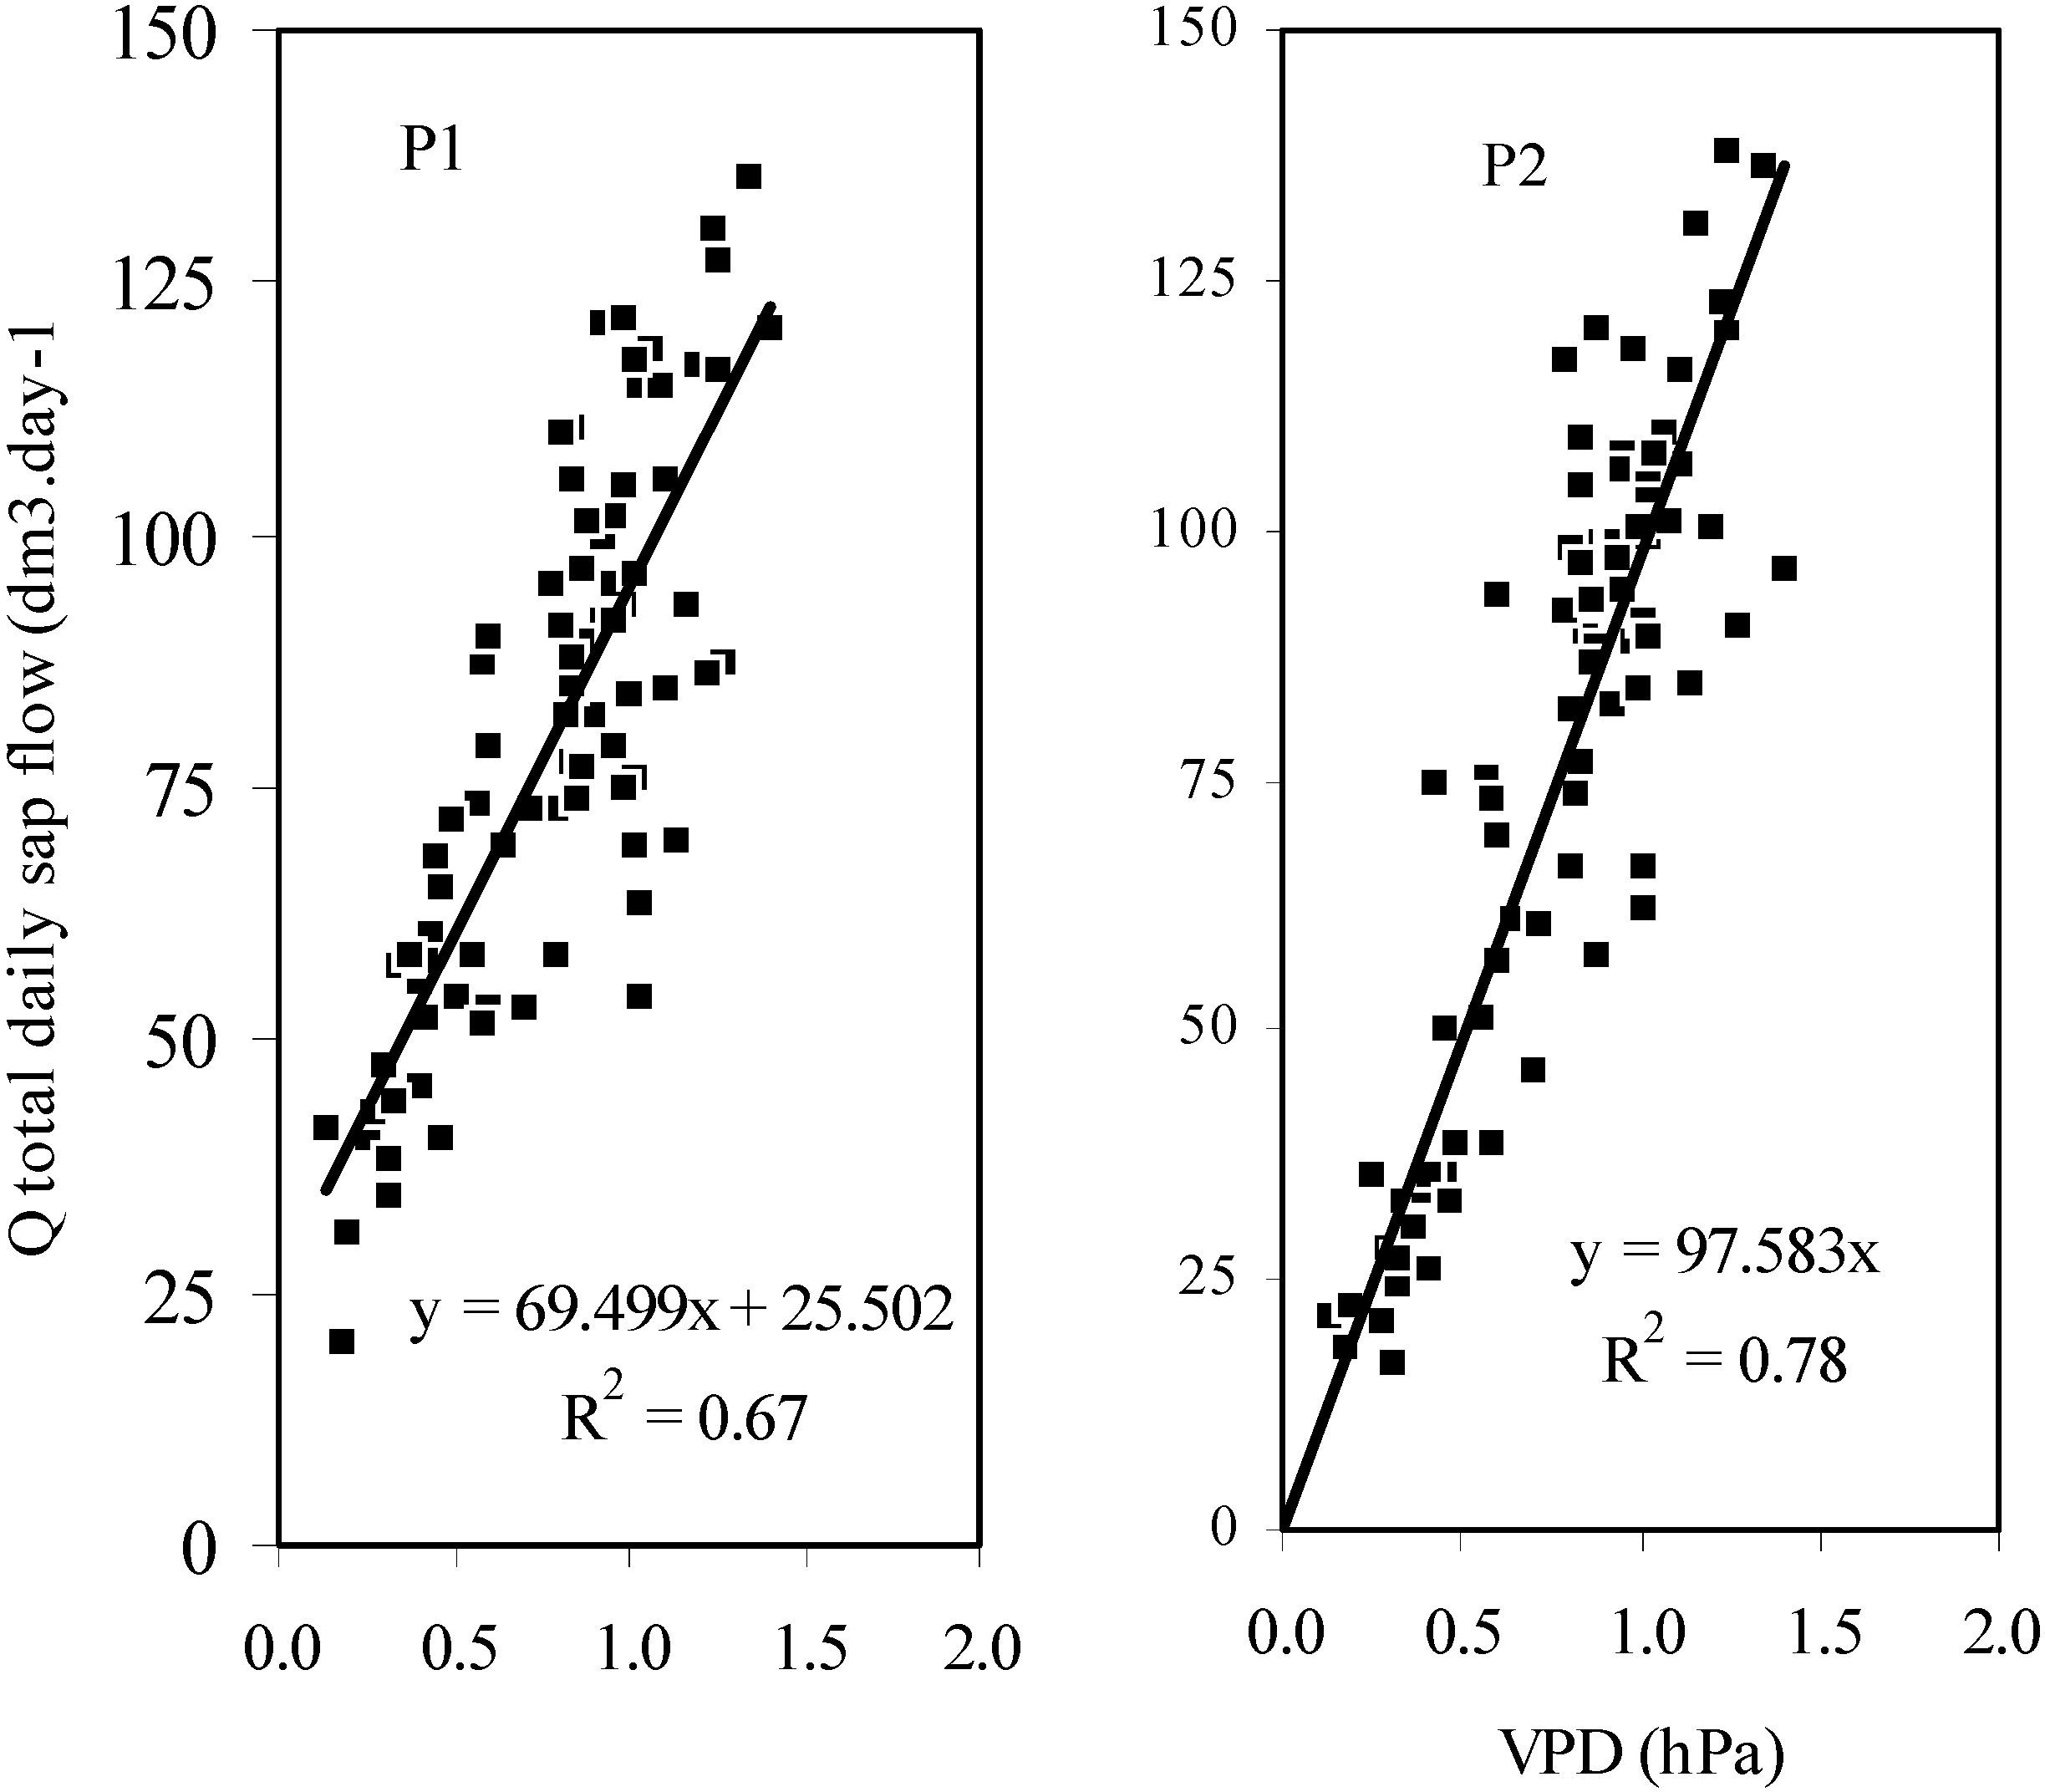
2.3. Estimating water use
As the contribution of each sapwood depth remained rather stable and in order to avoid excessive number of probes in measurement campaigns, it was interesting to verify how far sap flux densities Qsi measured by a single probe, inserted in the most external (and active) wood depth (0–2 cm), could be used as a good estimator of the whole tree water use Q. Linear models of regressions computed over 84 days of measurements were y = 3.17 x (R2 = 0.88) and y = 4.02 x (R2 = 0.96) in P1 and P2, respectively (
Figure 3). In P2, the linear regression could be computed over 111 days and provided almost the same model (y = 4.15 x, R
2=0.95) as over 84 days, indicating the strength of the model. When data are normalized according to a standard stem radius of 25 cm, corresponding slopes of regressions would be closer, with 3.30 and 3.70 for P1 and P2 respectively (n = 84 days). Another modeling issue was to see if environmental data could be considered as good regressors for estimating the whole tree water use. Unfortunately, data acquired in an official meteorological station located 5 km apart gave very poor modeling results with temperature, air humidity, corresponding vapor pressure deficit (VPD) and potential evapotranspiration data (PET). However, VPD computed from air temperature and humidity acquired in the plantation plot at the same rate than the sap flow data was a good regressor. Over 84 days, the linear regression model was y = 69.5 x + 25.5 (R2 = 0.67) with P1, and y = 97.6 x (R2 = 0.78) with P2 (
Figure 4). The model remained stable over 111 days with P2 (y = 95.8 x; R2 = 0.76). This indicates that in a floodplain forest the micro climate is different from the nearby agricultural lands on the fluvial terraces, and that transpiration of trees responds better to environmental variables which are collected
in situ.
The residual errors on water use were 9 dm3 day–1 and 6 dm3 day–1 for regression models based on sap flow measurements at 0–2 cm, and were 20 and 14 dm3 day–1 for models based on the VPD, in P1 and P2, respectively. The Durbin–Watson test was used to verify the independence of the errors (absence of correlation between the daily values throughout the season). The D-values obtained over 84 days ranged from 1.82 to 2.16 in P1 and from 1.47 to 2.04 in P2. Possible D-values may range between 0 (a highly negative correlation) and 4 (a highly positive correlation), while a D-value of 2 corresponds to a correlation of 0.
Figure 3.
Linear regressions of the whole tree water use (Q) on the sap flux density (Qsi) at the 0-2 cm depth (n=84 days).
Figure 3.
Linear regressions of the whole tree water use (Q) on the sap flux density (Qsi) at the 0-2 cm depth (n=84 days).
Qsi (dm3 dm–2 day–1)
Figure 4.
Linear regressions of the whole tree water use (Q) on the vapor pressure deficit (n=84 days).
Figure 4.
Linear regressions of the whole tree water use (Q) on the vapor pressure deficit (n=84 days).
2.4. Discussion
Poplars in this plot were planted at a regular interval of about 7 m and each could explore an area of about 50 m
2. Considering the mean water table depths as a limiting factor for the root development (-3.54 m below P1 and -1.45 m below P2), the soil volumes available for the root systems were 3.54 * 50 = 177.0 m
3 and 1.45 *50 = 72.5 m
3, respectively (
i.e., about 2.5 times more for P1 than for P2). During the first 7 years of growth, the P2 poplar grew slightly quicker than P1. P2 and the 8 surrounding trees had a mean trunk diameter of 27.1 cm, whereas the corresponding poplars with P1 had a mean diameter of 24.1 cm. The mean difference in diameter was 3 cm but was not significant. Water extraction from the soil by P1 necessitates a more developed root system, which is probably developed in the early years of the tree at the expense of a less developed aerial system. Water use by P1 seemed to be slightly higher than by P2, however the significance of this result cannot be stated as no replicates were done. Three years later, new measurements on the stem diameters revealed that P1 and the 8 neighbor trees were growing quicker (+28%) than around P2 (+23%), and the mean difference in diameter was reduced. These results were not really surprising as poplars are known to be able to better extract soil moisture from unsaturated zones than
Salix species, even when groundwater is available [
15]. Such ability was also confirmed by isotopic measurements made on the same trees of this study [
16].
This study also showed that a difference in water table level (all other factors being equal) could probably induce a modification in the radial sap flow profile of poplars and in the water use. When the water table was close to the surface, the radial sap flow profile in the stem seemed to be more stable and more homogeneous and the models stronger. When the water table was lower, the sap flow was more important in the outer tree rings and showed a higher radial variability. In very dry conditions the sapwood is less developed and tree rings are narrower as observed on native black poplars [
17].
At the whole tree level, water use was highly fluctuating from one day to the other (minimum 17 dm
3 day
–1; maximum 138 dm
3 day
–1) but could be rather well correlated to the local VPD, a result consistent with a study on the tremble aspen,
P. tremuloides Michx. [
18]. In P1, the quality of the regression model with the VPD was slightly lower than with P2 but in this case, a 3.5 m deep water table was apparently not a limiting factor for the uptake of water by the trees, as no thick gravel bar hindered water uptake in the soil profiles. It can be noted that by forcing the regression model to pass by the origin, rather than to try to obtain the best R
2 coefficient, the new model for P1 is actually very similar to P2 model, with y = 97.891 (R2 = 0.54). As a rule of thumb one may consider water use (in dm
3 day
–1) ~ 100 * VPD (in kPa). However, this should be confirmed by other measurements especially during stress or drought periods.
Despite very high daily fluctuations in sap flows, and regardless of how low the sap flow might be (e.g., presence of clouds or leaf fall at the end of the season), each xylem depth maintained a rather stable contribution to the whole tree water use Q (e.g., 40 to 45% in the outer two first centimeters of the stems). This indicates that once the sap flow radial pattern of a poplar tree is known, following an initial preliminary test over several weeks, it should be possible to restrict sap flow measurements to the outer 0–2 cm for long term measurements and to compute the total daily uptake using the regression models (e.g., in this study Q ~ 4.0 * Qsi with P2 and Q ~ 3.2 * Qsi with P1, or for a standard tree of 25 cm, DBH, Q ~ 3.5 * Qsi). However, it is of great importance to check in further studies whether sap flow radial patterns, as observed over one vegetative season, remain similar from one year to another and at different tree age, and if sap flow is still active beyond a depth of 8 cm (although existing probes are not yet manufactured to reach such depths). By ignoring the activity of more internal sapwood there is a risk of underestimating the actual water uptake. This error is limited because both sap flow and sapwood area decrease with depth in the stem. If one assumes that at 8–10 cm sap flow remained the same as at 6–8 cm, corrections of water use at the tree level would be, as a maximum, + 10 % with P1 and + 15 % with P2.


