1. Introduction
Qingdao is located in the southern part of the Shandong Peninsula. The eastern and southern edges of the peninsula are bordered by the Yellow Sea. In the past few decades, urbanization in Qingdao was incredibly rapid. According to data from the Qingdao Municipal Statistics Bureau and the National Bureau of Statistics of the People’s Republic of China, the built-up area of Qingdao has increased from 95 km2 in 1993 to 375 km2 in 2012. This rapid urbanization results in changes to the underlying surface, which have led to the urban heat island (UHI) phenomenon and other influences.
Qingdao is frequently affected by the sea-land breeze (SLB). The annual frequency of SLB in Qingdao is approximately 80 days per year [
1]. SLB is a local circulation that is generated by the thermal contrast between land and sea and has a significant impact on the transport and spread of pollutants in coastal cities [
2]. The marine air masses could be brought to the continent by the circulation and affect the boundary layer structure there [
3]. Besides, SLB also plays a role in the dispersion and transportation of pollutants. When a sea breeze occurs, the concentrations of PM
2.5 and PM
10 are lower than those in sea-land mixed breezes [
4]. On the one hand, the sea breeze accelerates the diffusion of pollutants through strength horizontal and vertical transportation, which could relieve local pollution. During a diurnal cycle, pollutants transported to coastal and sea-surface areas by land breeze sometimes will be re-transported into the inland urban area by sea breeze. This process will produce or aggravate pollution [
5].
Urbanization accompanies the underlying surface change. If urban surface replaces the natural surface, then it will have a significant effect on the surface energy balance and surface meteorological conditions [
6,
7,
8,
9]. In addition, the underlying changes lead to the UHI phenomenon, where an urban area will be warmer than its surrounding rural areas [
10,
11]. Peng et al. [
12] found that the urbanization process can lead to a remarkable increase in surface roughness, resulting in obvious decreases in average wind speeds in urban area. Through the WRF model simulation, Ma et al. [
7] determined that an UHI will strengthen sea breezes and increase the temperature difference between land and sea. Urbanization increased the temperatures in most areas by approximately 1–2 degrees. At the same time, the wind speed in the downwind area declined, which was caused by the increase in underlying surface roughness. To learn more about the effect of urbanization on the weather conditions near the surface, many researchers have implemented different methods, such as statistical methods and numerical simulation methods. However, those studies concentrated mainly on the Beijing-Tianjin-Hebei (BTH) region [
13,
14], the Yangtze River Delta region [
15,
16,
17] and the Pearl River Delta region [
18]. Studies for other developing regions have been much less frequent. In this study, the urbanization effect of Qingdao will be evaluated by the numerical model, which will help us learn more about the effect of urbanization on SLB processes in Qingdao.
Not only urban construction but also land reclamation and the construction of ports will affect topography and surface roughness. Due to the construction of breeding ponds, land reclamation, and port and dock construction, the artificial coastline at Dingzi Bay-Xuejia Island’s northern tip in Qingdao was expanded during past three decades [
19]. Xu and Gong [
20] also reported that shoreline over Jiaozhou Bay had a significant expansion. Such changes of shorelines also can be noted from the satellite images (e.g., Google Earth). The shape and location of coastline will influence SLB. Gilliam et al. [
21] suggested that the vertical movement and convergence caused by sea breeze were stronger in the cape area and weaker in the bay area. The shape of coastline can also affect the sea breeze. The bulged coastline affects the time and location of precipitation by influencing the early low-level convergence of the sea breeze.
Although there were some preliminary studies about SLB in Qingdao, no study about the formation and disappearance of SLB has been conducted by using a different year’s real land-use data. The actual influence of urbanization on SLB in Qingdao is currently not very clear. Most numerical experiments are idealized experiments, which have difficulty reflecting the real influence of urbanization on SLB, and pay little attention to the influence of the coastal change caused by human activities on local circulation. Two land-use datasets (1992 and 2012) will be used in this numerical simulation to take an across-the-board evaluation of the effect of human activities on SLB over the Qingdao region.
2. Data and Methods
2.1. Model and Simulation Setup
In this study, the selected case of SLB in Qingdao was simulated using the Weather Research and Forecasting model (WRF, version 3.7.1, released by the University Corporation for Atmospheric Research (UCAR; Boulder, Colorado, USA)), which was developed by the National Center for Atmospheric Research (NCAR), the National Oceanic and Atmospheric Administration, the Air Force Weather Agency (AFWA), the Naval Research Laboratory, the University of Oklahoma, and the Federal Aviation Administration (FAA) [
22]. A three-layer nested domain is adopted (
Table 1), and the innermost domain is a 1-km fine-resolution domain, including Jiaozhou Bay and the city of Qingdao (
Figure 1). The similar horizontal resolution (i.e., 1 km) was also widely used by previous numerical studies of urbanization and sea-breeze [
23,
24,
25]. The Ferrier scheme used for cloud physical process has been employed [
26,
27]. Considering that the topographic surface wind correction in Yonsei University (YSU) planetary boundary layer (PBL) can improve the model performance [
28], the YSU PBL scheme with topographic correction was selected. Cumulus parameterization based on the Kain-Fritsch scheme was used in the outermost domain [
29]. The Rapid Radiative Transfer Model for General circulation models (RRTMG) longwave scheme, Dudhia shortwave scheme, Noah land-surface scheme and single-layer urban canopy model (UCM) were also used in this simulation [
30]. The 72 h simulation began at 8:00 Beijing Time (BJT) on 21 August 2016, to investigate the SLB process on 23 August in Qingdao. The first 40 h is run as the spin-up.
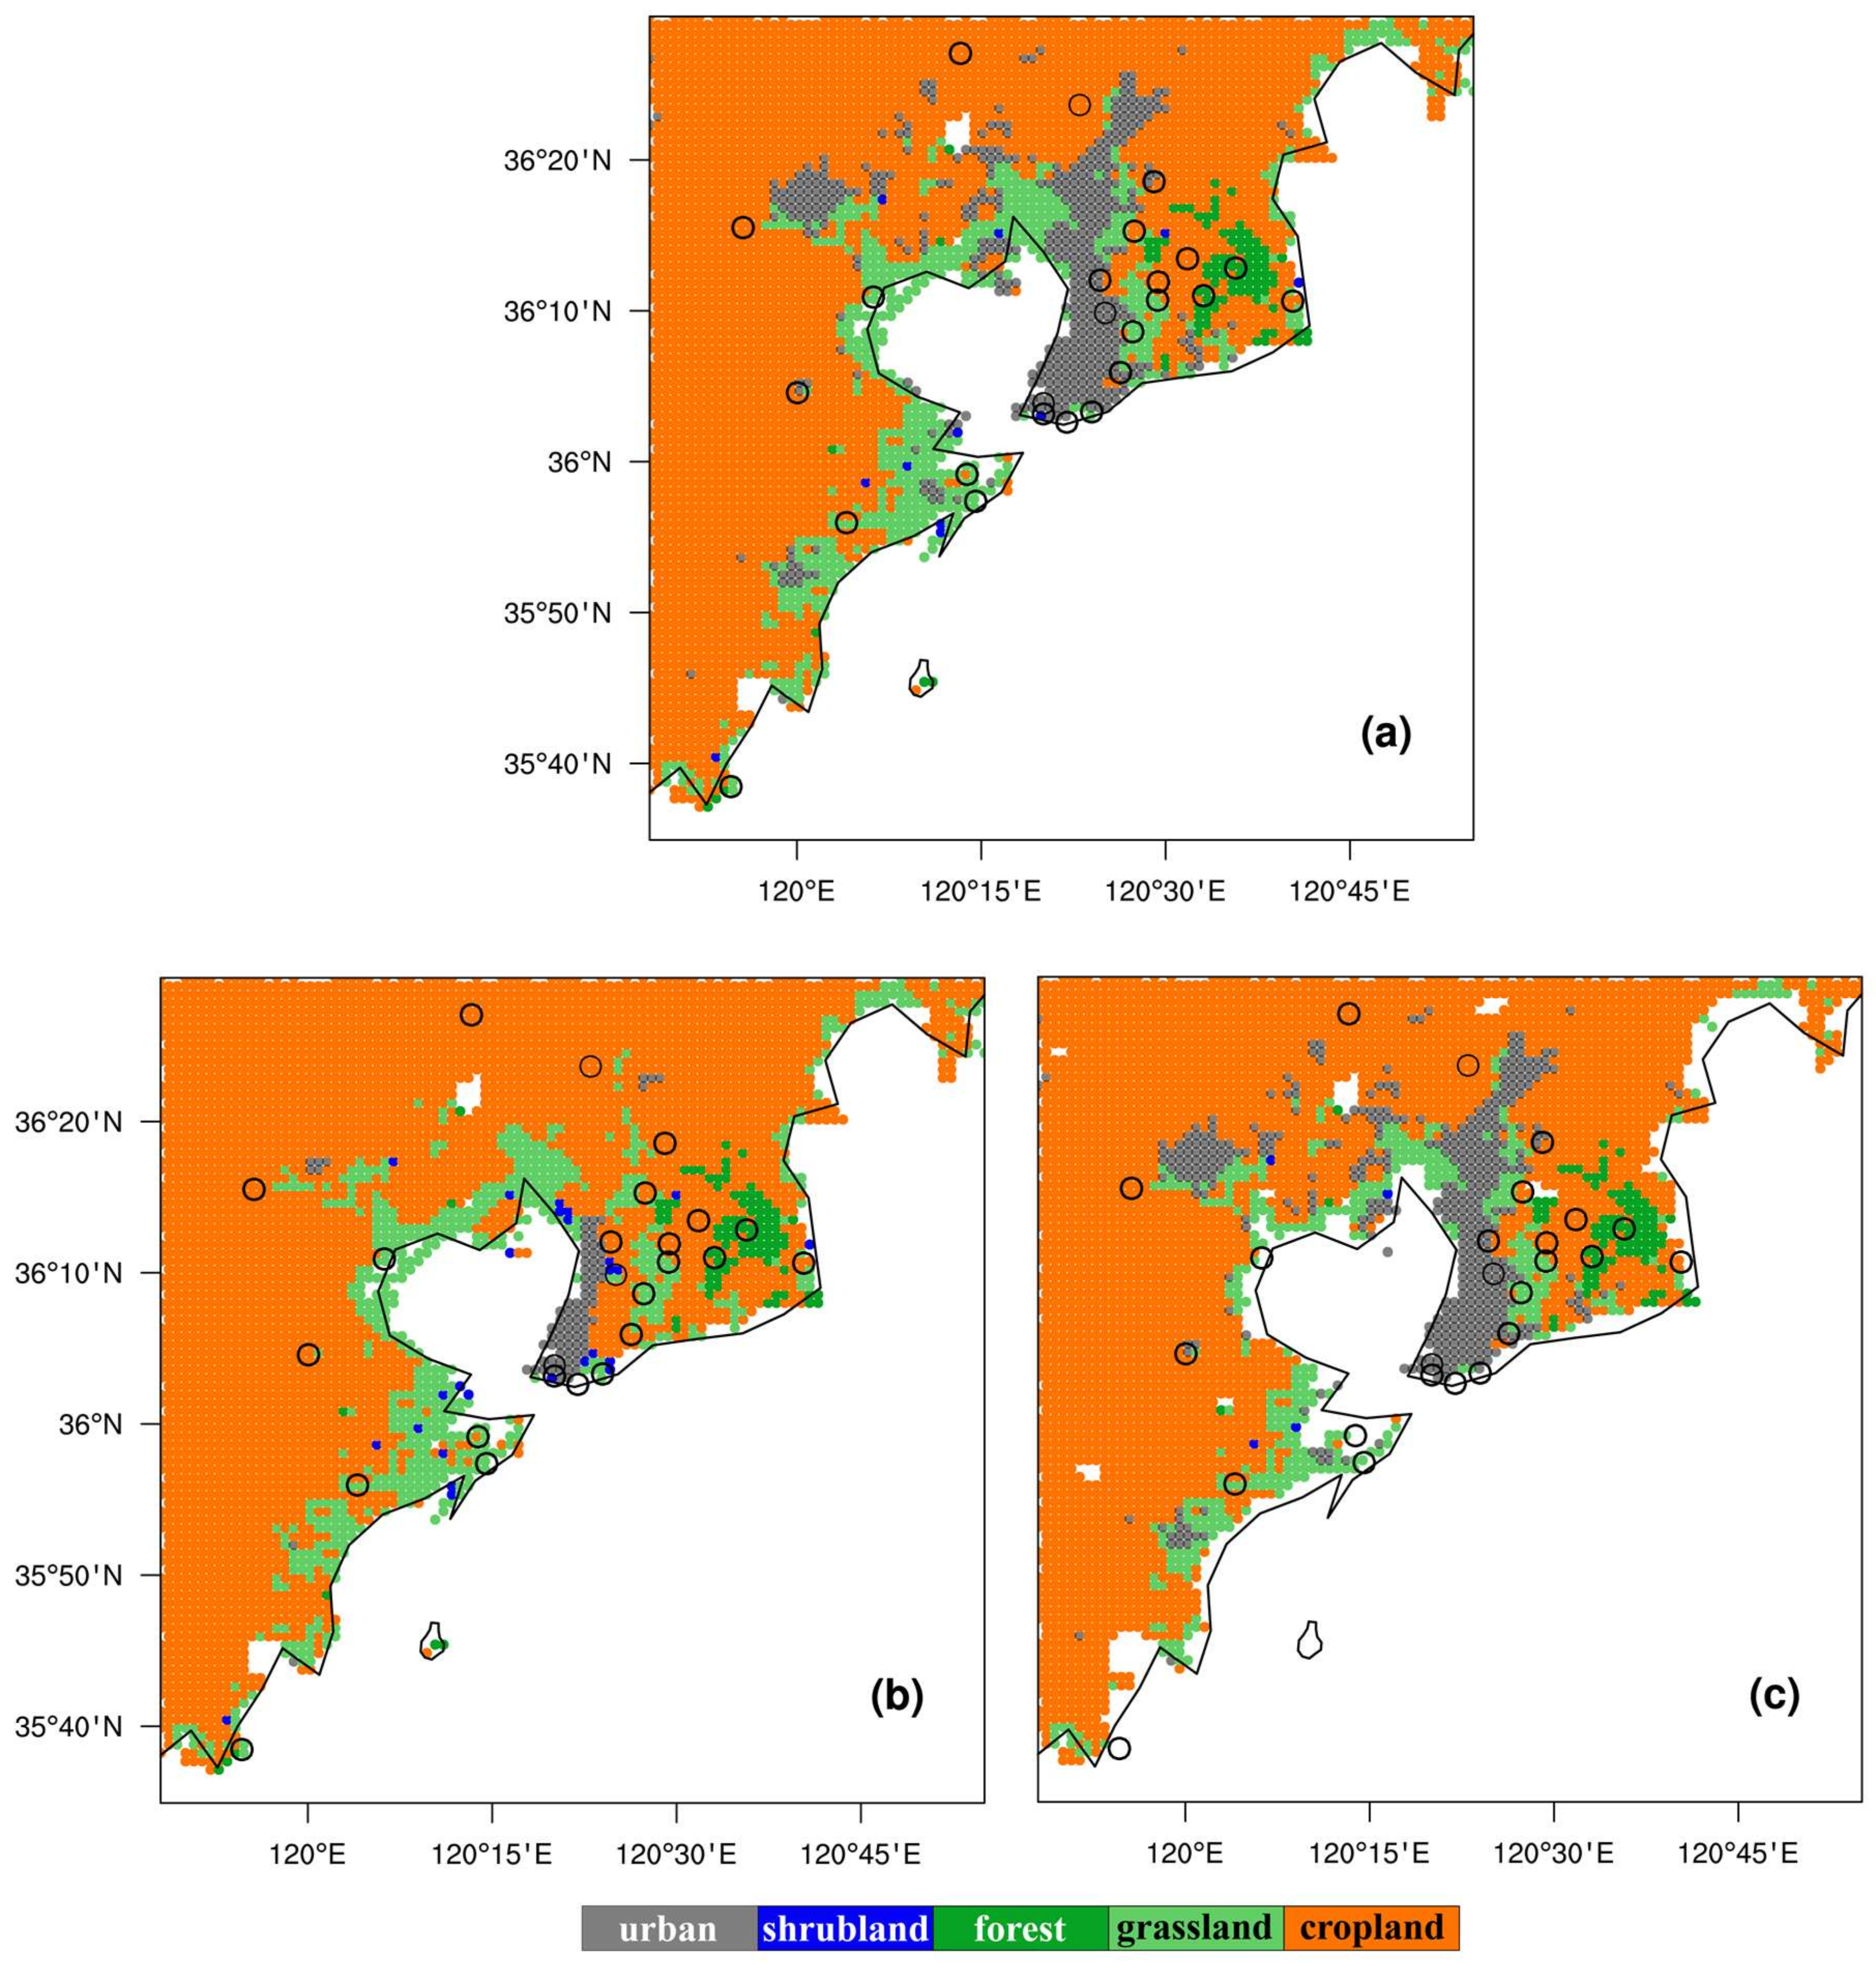
To investigate the effect of urbanization and coastal change, the numerical experiments were conducted with three types of land-use data. Due to the rapid increase in the built-up area in Qingdao from 1992 to 2012, the USGS (1992) and MODIS (2012) land-use data are used to reflect this change. USGS land-use data were mapped by remote sensing data of AVHRR from 1992 to 1993 and have 24 different land-use categories. The spatial resolution is 1 km. MODIS land-use data were released in 2012 by NCAR, and the spatial resolution is approximately 15 rads (approximately 1 km). The following experiments were conducted: (1) Control experiment (CTL) with MODIS land-use data; (2) Urban experiment (EXP_U), in which the grids of urban and rural area in the CTL experiment are replaced by USGS data and (3) Coastline experiment (EXP_C), in which the coastline of USGS data is used to replace the coastline data in the CTL experiment and by comparing the result of EXP_C with the CTL, the impact of coastal change on the SLB can be assessed. By comparing the results of EXP_U with the CTL, the impact of urbanization on the SLB can be assessed. The detailed information about how we grouped the USGS data into MODIS categories are shown in
Table 2.
Figure 2 shows the underlying surface types of the three experiments.
2.2. Data
Data including 2 m air temperature, 2 m relative humidity, 10 m wind direction and 10 m wind speed measured at 54 stations in Qingdao City from 8:00 BJT 21 August 2016 to 8:00 BJT 24 August 2016 were obtained from the China Meteorological Administration (CMA) and were used to evaluate WRF simulation results. The initial and boundary conditions were built with six-hour 1° × 1° National Centers for Environmental Prediction (NCEP) Final analysis (FNL) data [
31]. FNL data were used to analyze large scale synoptic background.
Land-use data from MODIS and USGS were used to reflect the progress of urbanization and coastal change. Comparing USGS (1992) with MODIS (2012), we found that the urban underlying surface in Qingdao was obviously enlarged, and the built-up area of Qingdao, Jimo and Jiaozhou expanded as well. The coastline of Aoshan Bay, the east side of Laoshan Mountain, Jiaozhou Bay and Xuejia Island, north tip to Guzhenkou Bay varied greatly, reaching 2–5 km to the ocean (
Figure 3).
2.3. Study Case
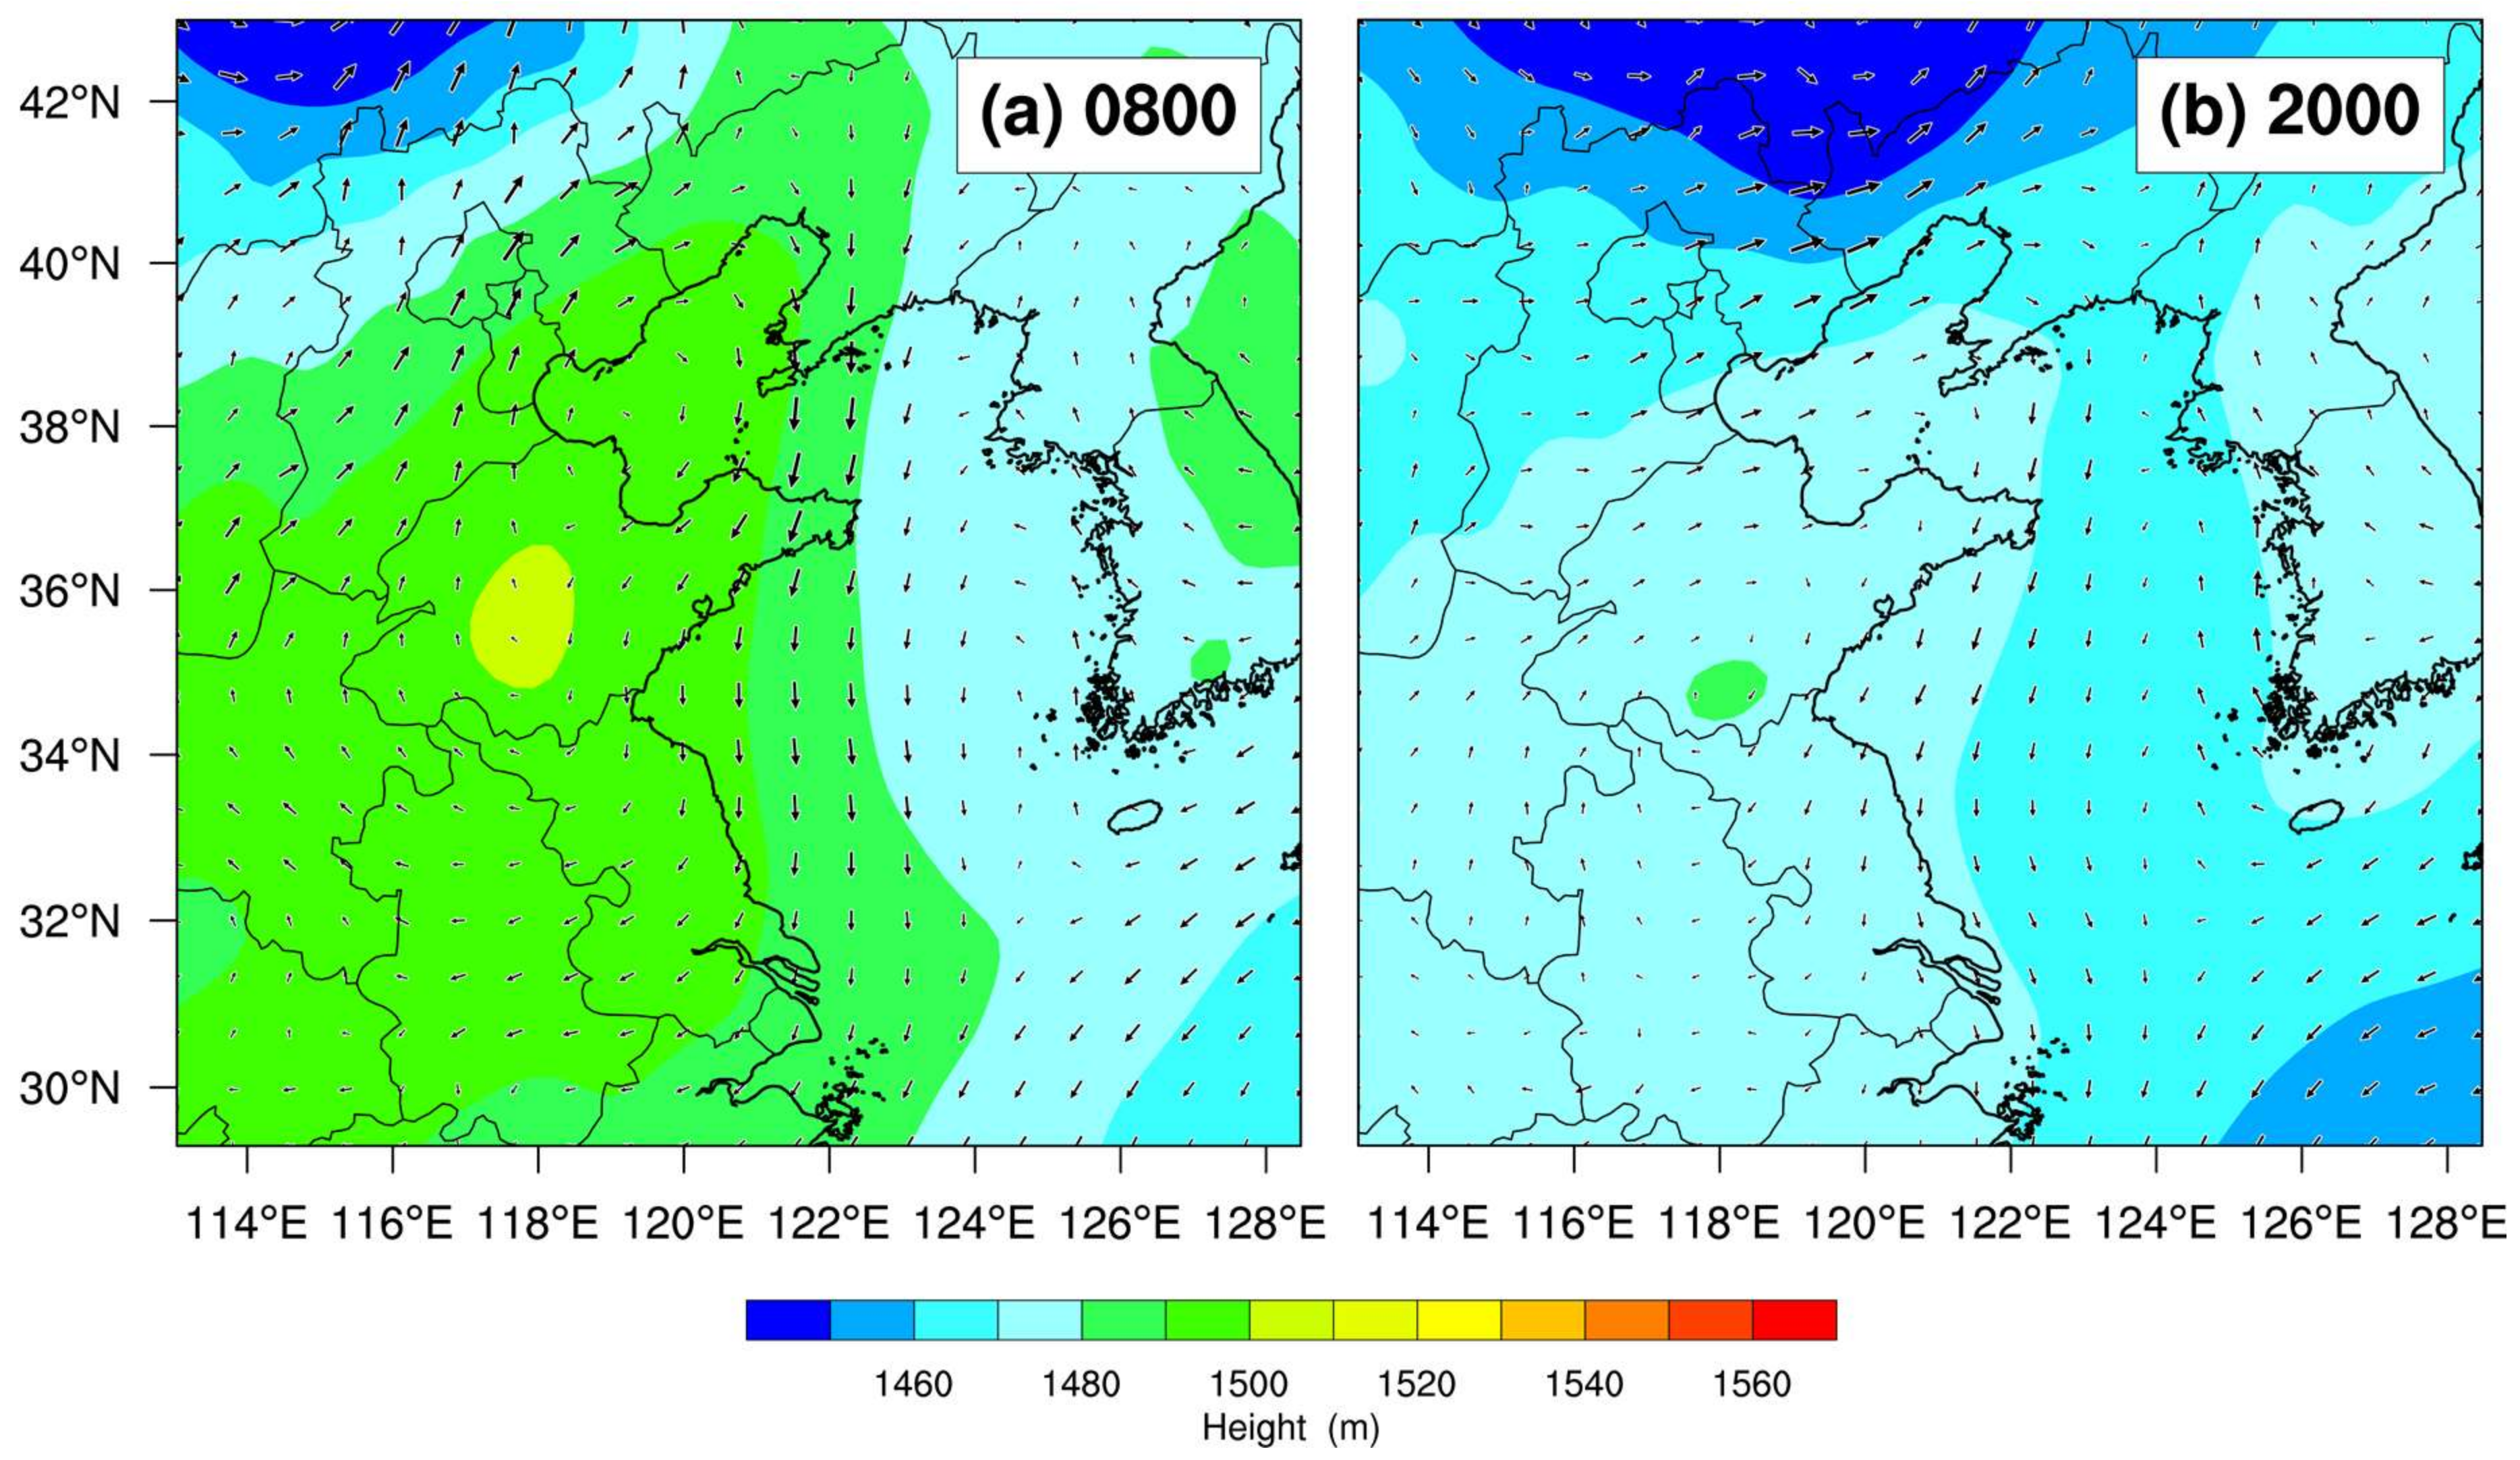
The SLB processes that occurred on 23 August 2016 in Qingdao were selected as the study case. On that day, Qingdao was controlled by a high pressure system located in the southern part of the Shandong province (
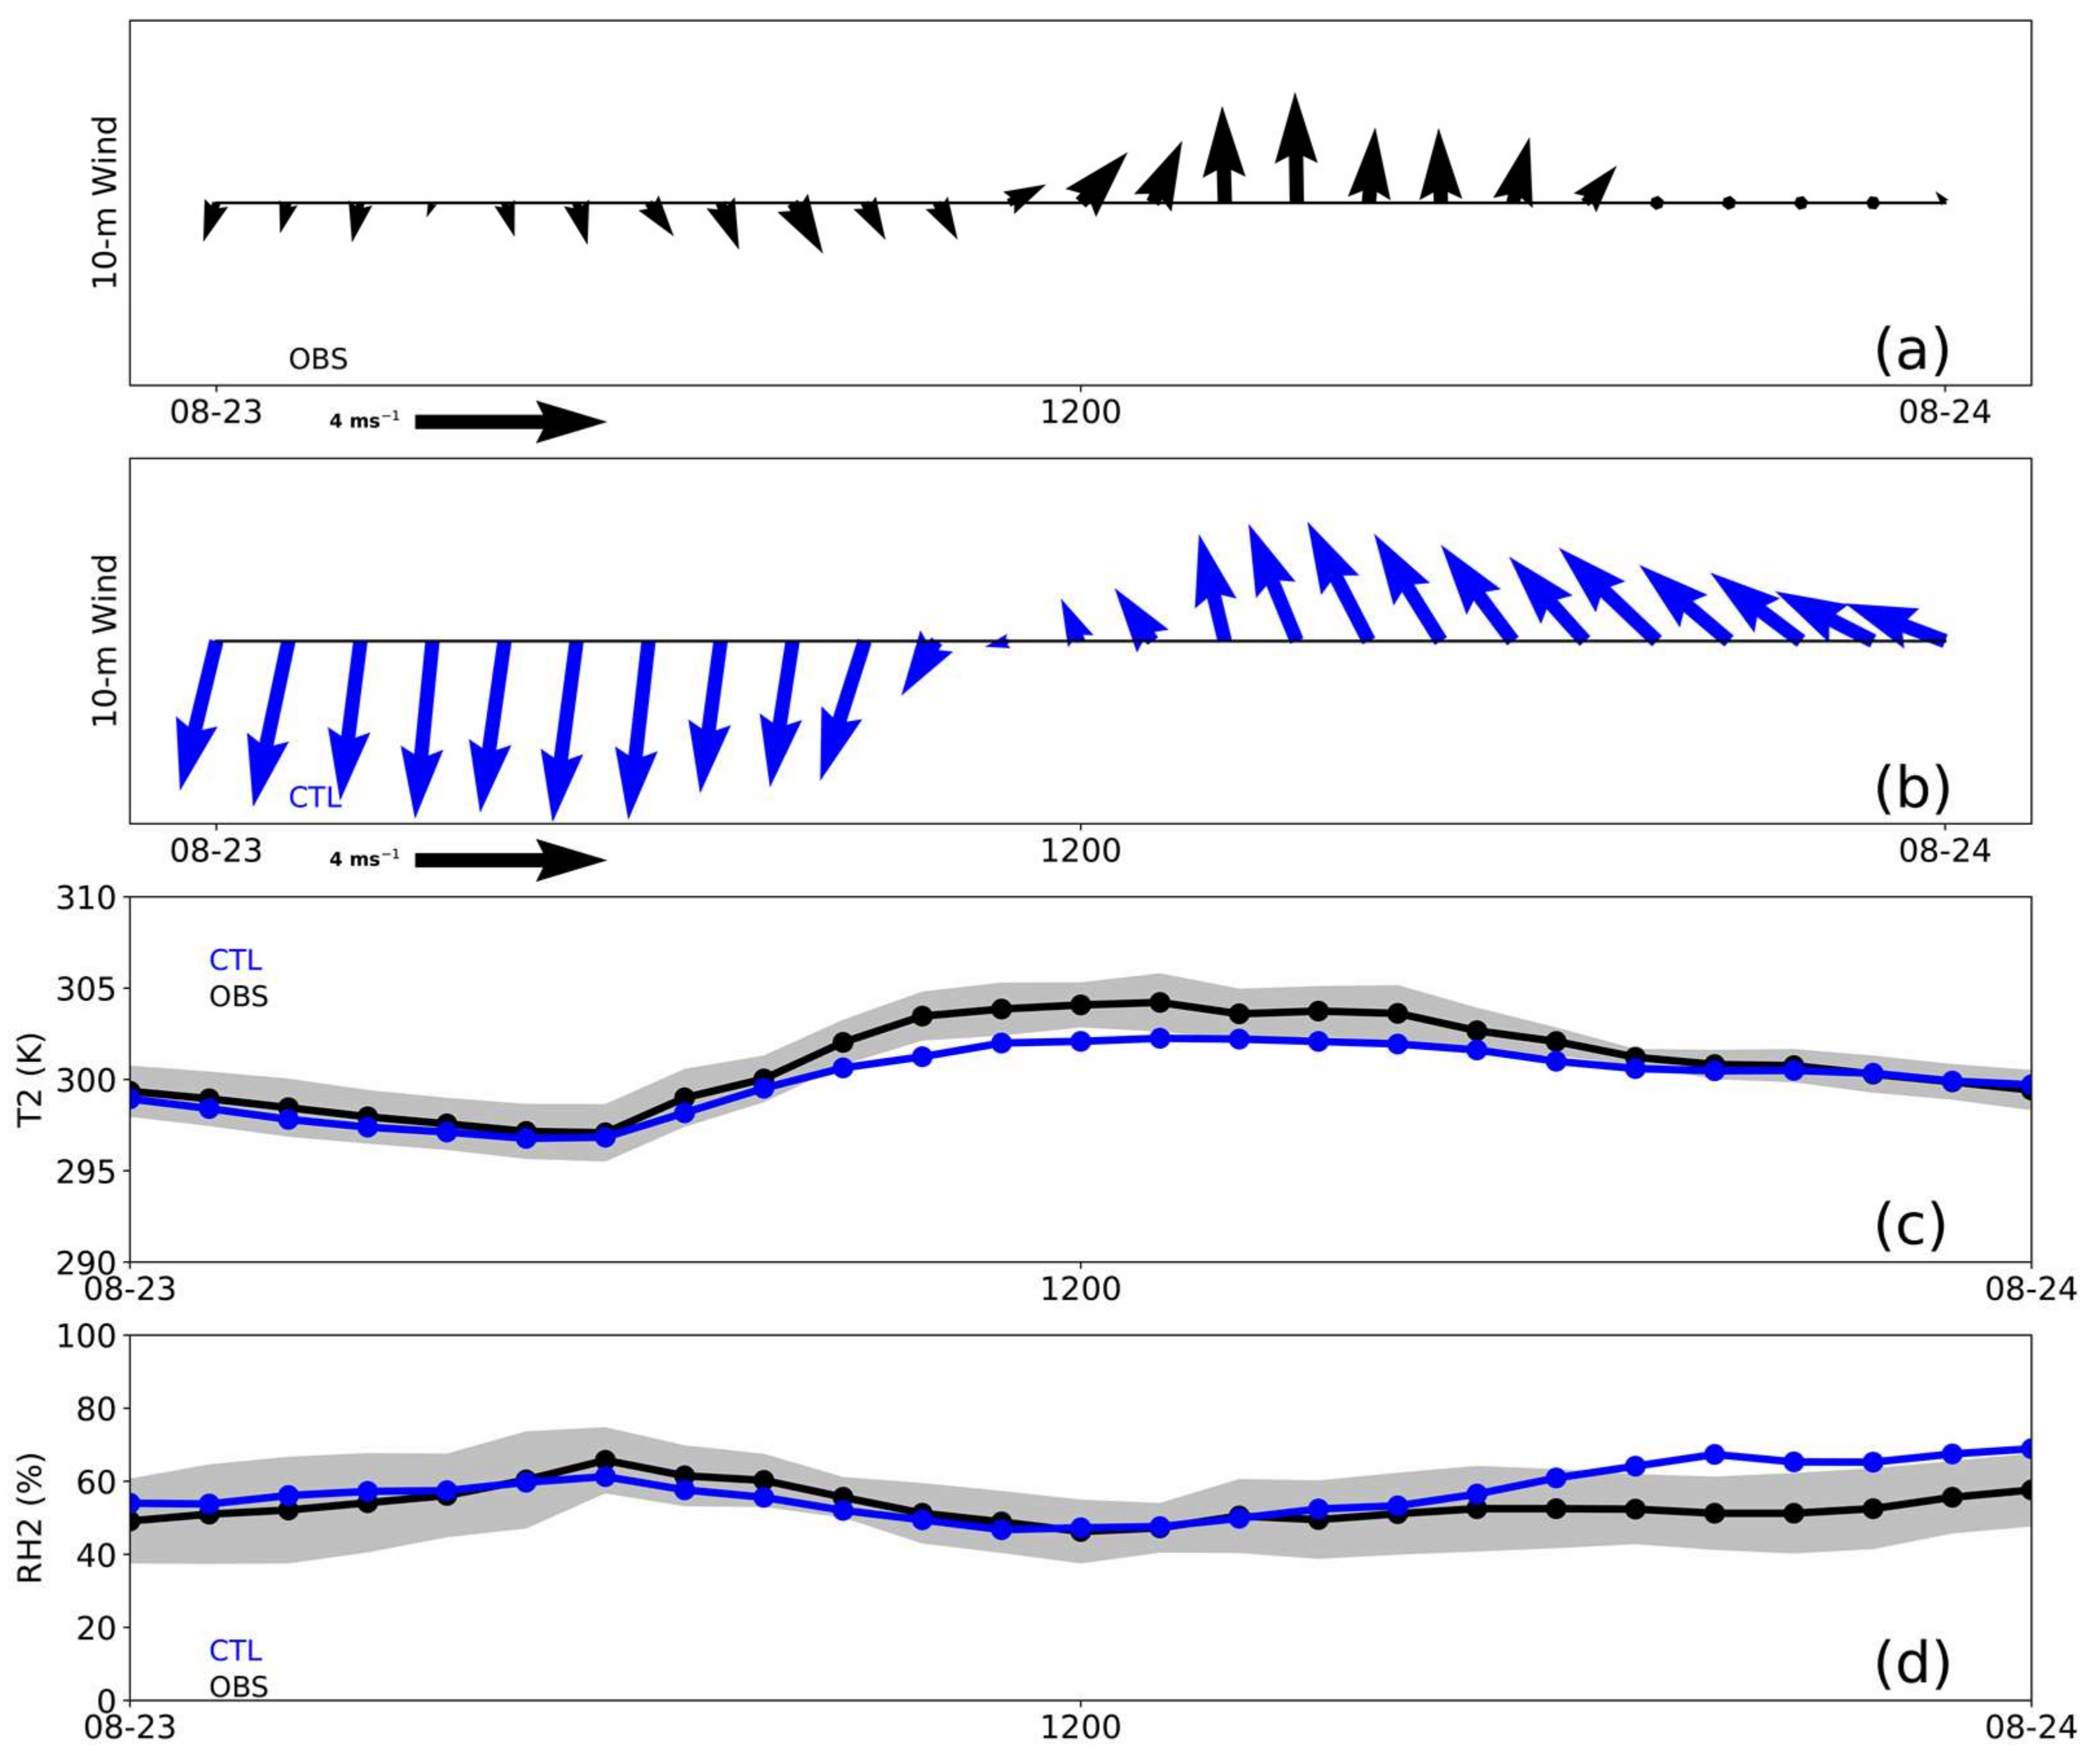
Figure 4) and the weather was sunny with little cloud cover. Surface wind direction showed obvious daily changes; it was northerly before 11:00 BJT, then southerly (
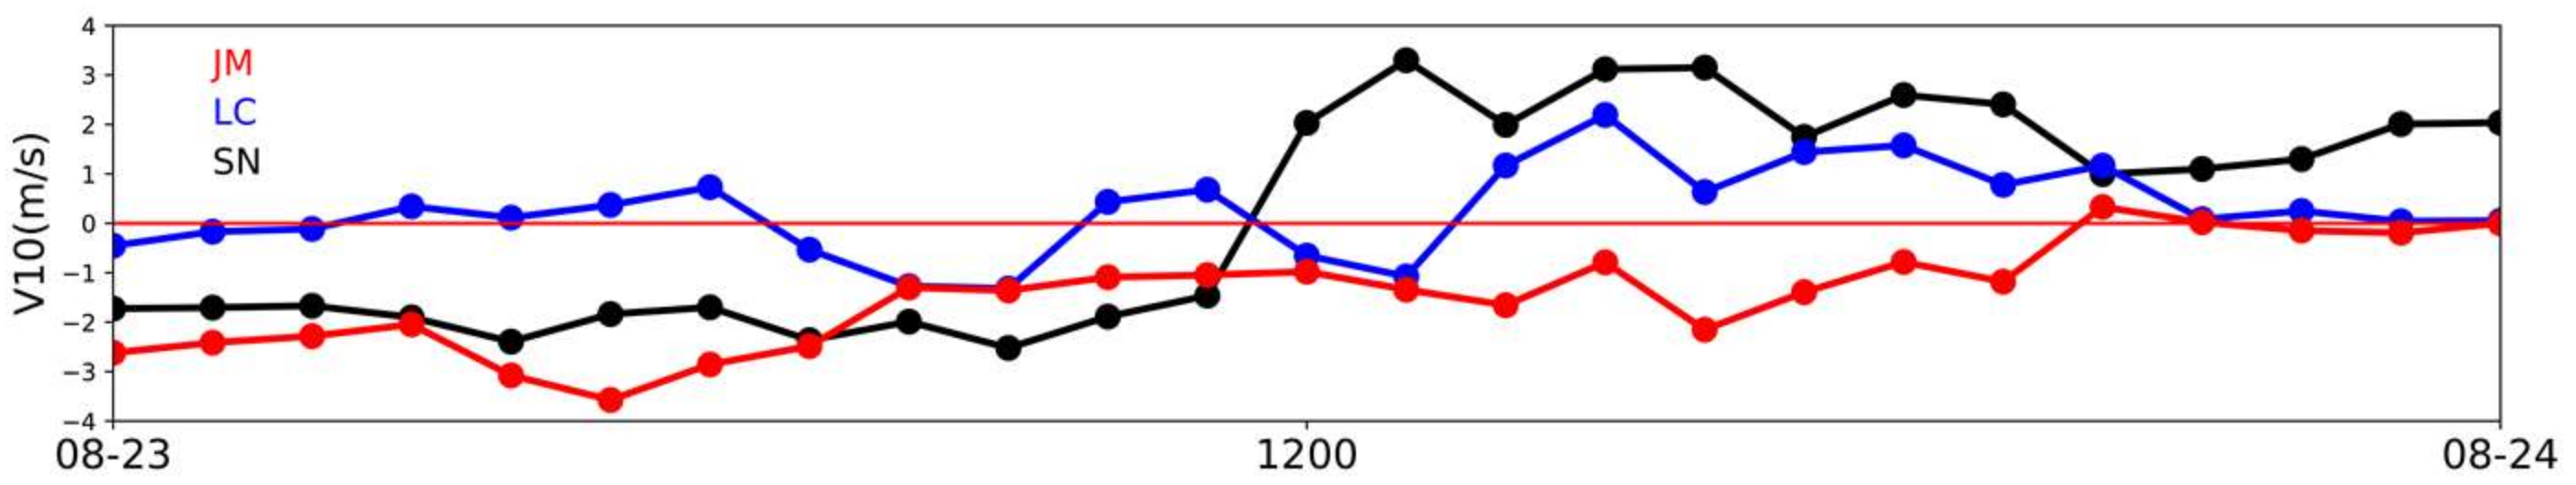
Figure 5a). Wind in the lower atmosphere was mainly northeast, which was conducive to the development of local thermal circulation. While the wind direction in Qingdao had obvious daily changes, the large scale background wind was stable. Therefore, the daily changes in the wind may be caused by the influence of the local SLB circulation. The time series of the 10 m V-component at the Shinan station, Licang station and Jimo station shows the sea breeze penetration; the wind direction conversion time at these three stations was 12:00, 14:00 and 20:00 BJT (
Figure 6).
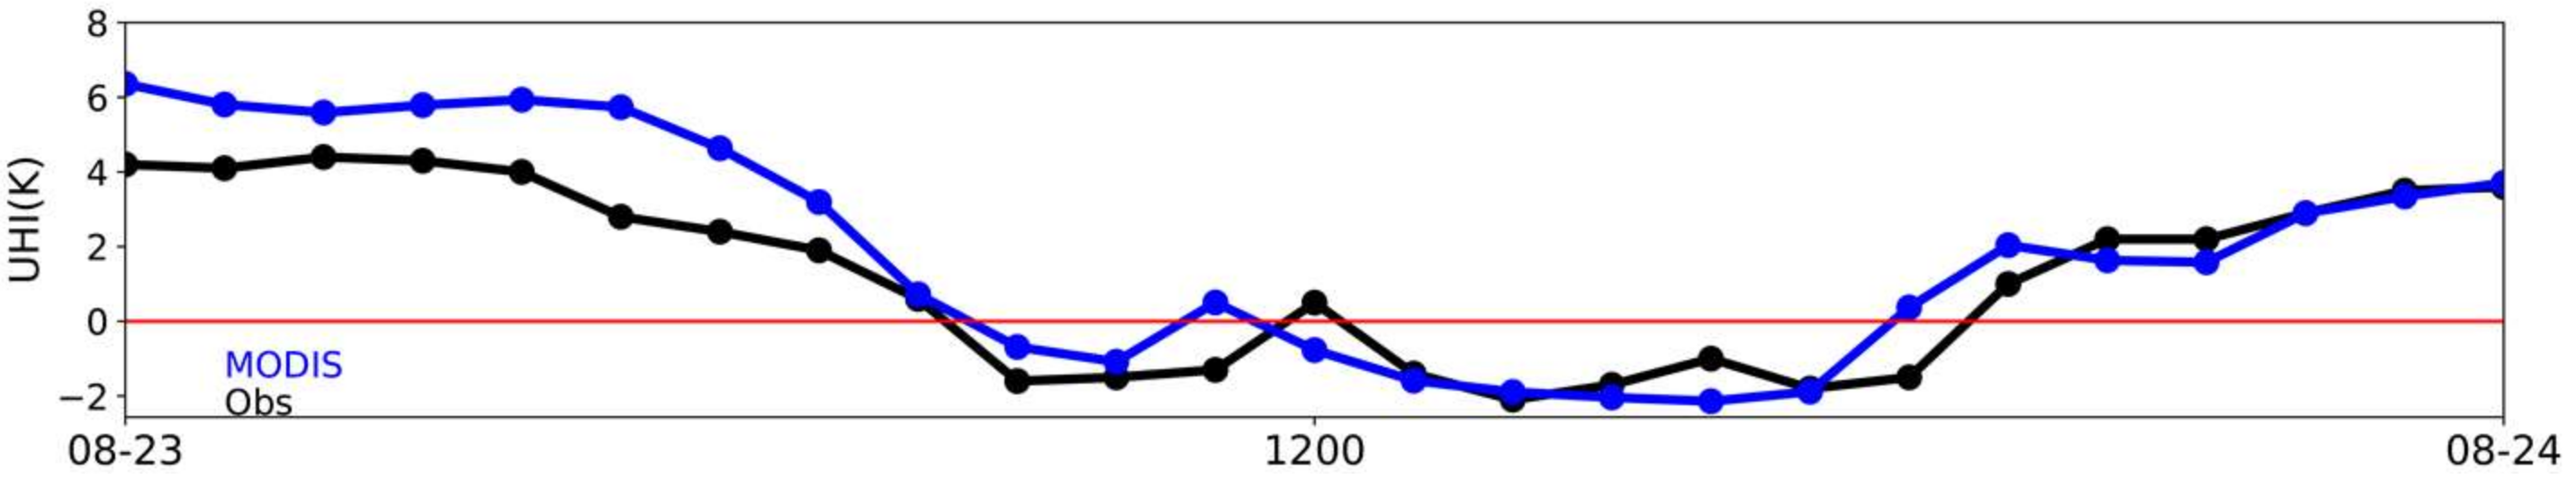
Qingdao was also influenced by the UHI effect on 23 August. UHI intensity was calculated by the temperature difference between the Shinan station and Jimo station. The UHI intensity became the strongest during the day from 0:00 to 4:00 BJT, which was highly maintained near 4 K. The UHI intensity became negative from 9:00 to 18:00 BJT, due to the cooling of the Shinan station by the sea breeze before the Jimo station. After 19:00 BJT, the SBF was close to the Jimo station, and the UHI intensity became positive (
Figure 7).
3. Results
The WRF model simulation (CTL experiment) was evaluated by observations from the stations. Then, based on the simulation of the CTL experiment, the penetration process of the sea breeze on 23 August 2016 was described and analyzed. Finally, the effect of urbanization and coastal change on the SLB in Qingdao was analyzed through the three numerical experiment results (CTL, EXP_U and EXP_C).
3.1. The Evaluation of WRF Simulation
The CTL experiment result was evaluated by comparing with the data (2 m air temperature, 2 m relative humidity, and 10 m wind) obtained at 54 stations in Qingdao (
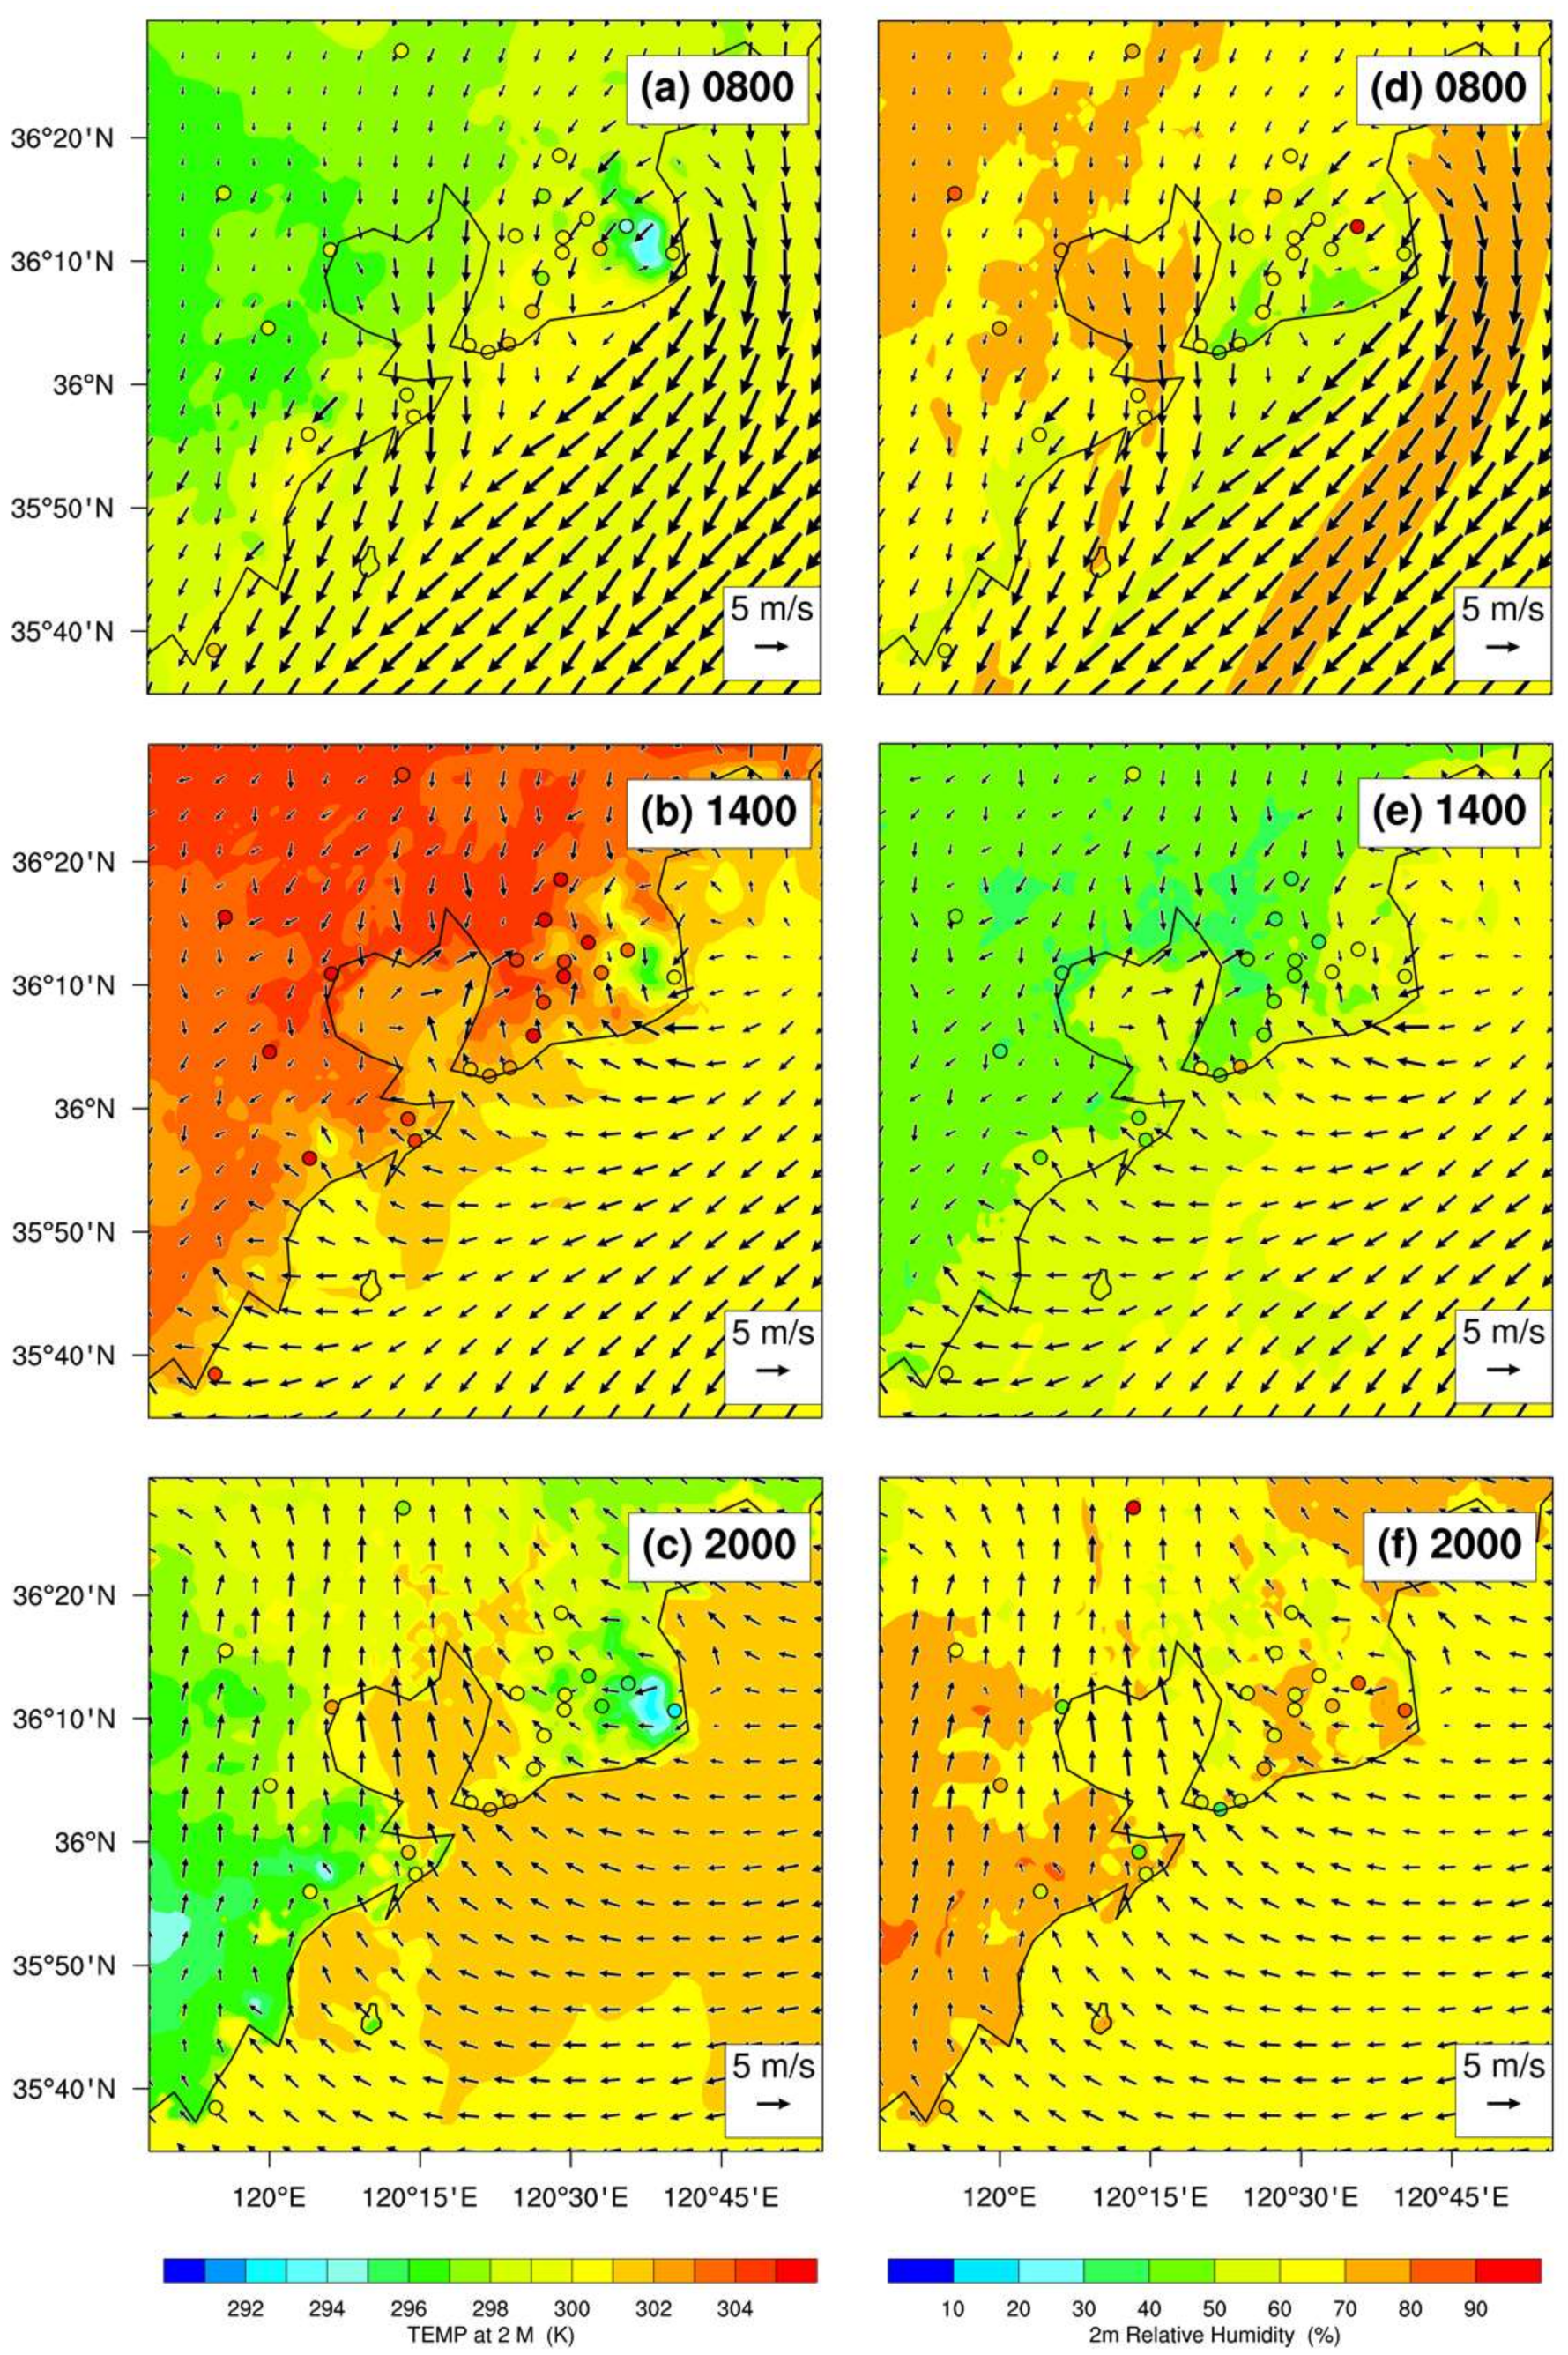
Figure 2). During the nighttime, 2 m air temperature and relative humidity were well simulated by the CTL experiment, and the bias was lower than one standard deviation. During the daytime, the simulated 2 m air temperature was approximately 1 K lower than the observed, and the 2 m relative humidity was slightly overestimated (
Figure 5c,d). However, the diurnal variations in the 2 m air temperature and 2 m relative humidity are well simulated.
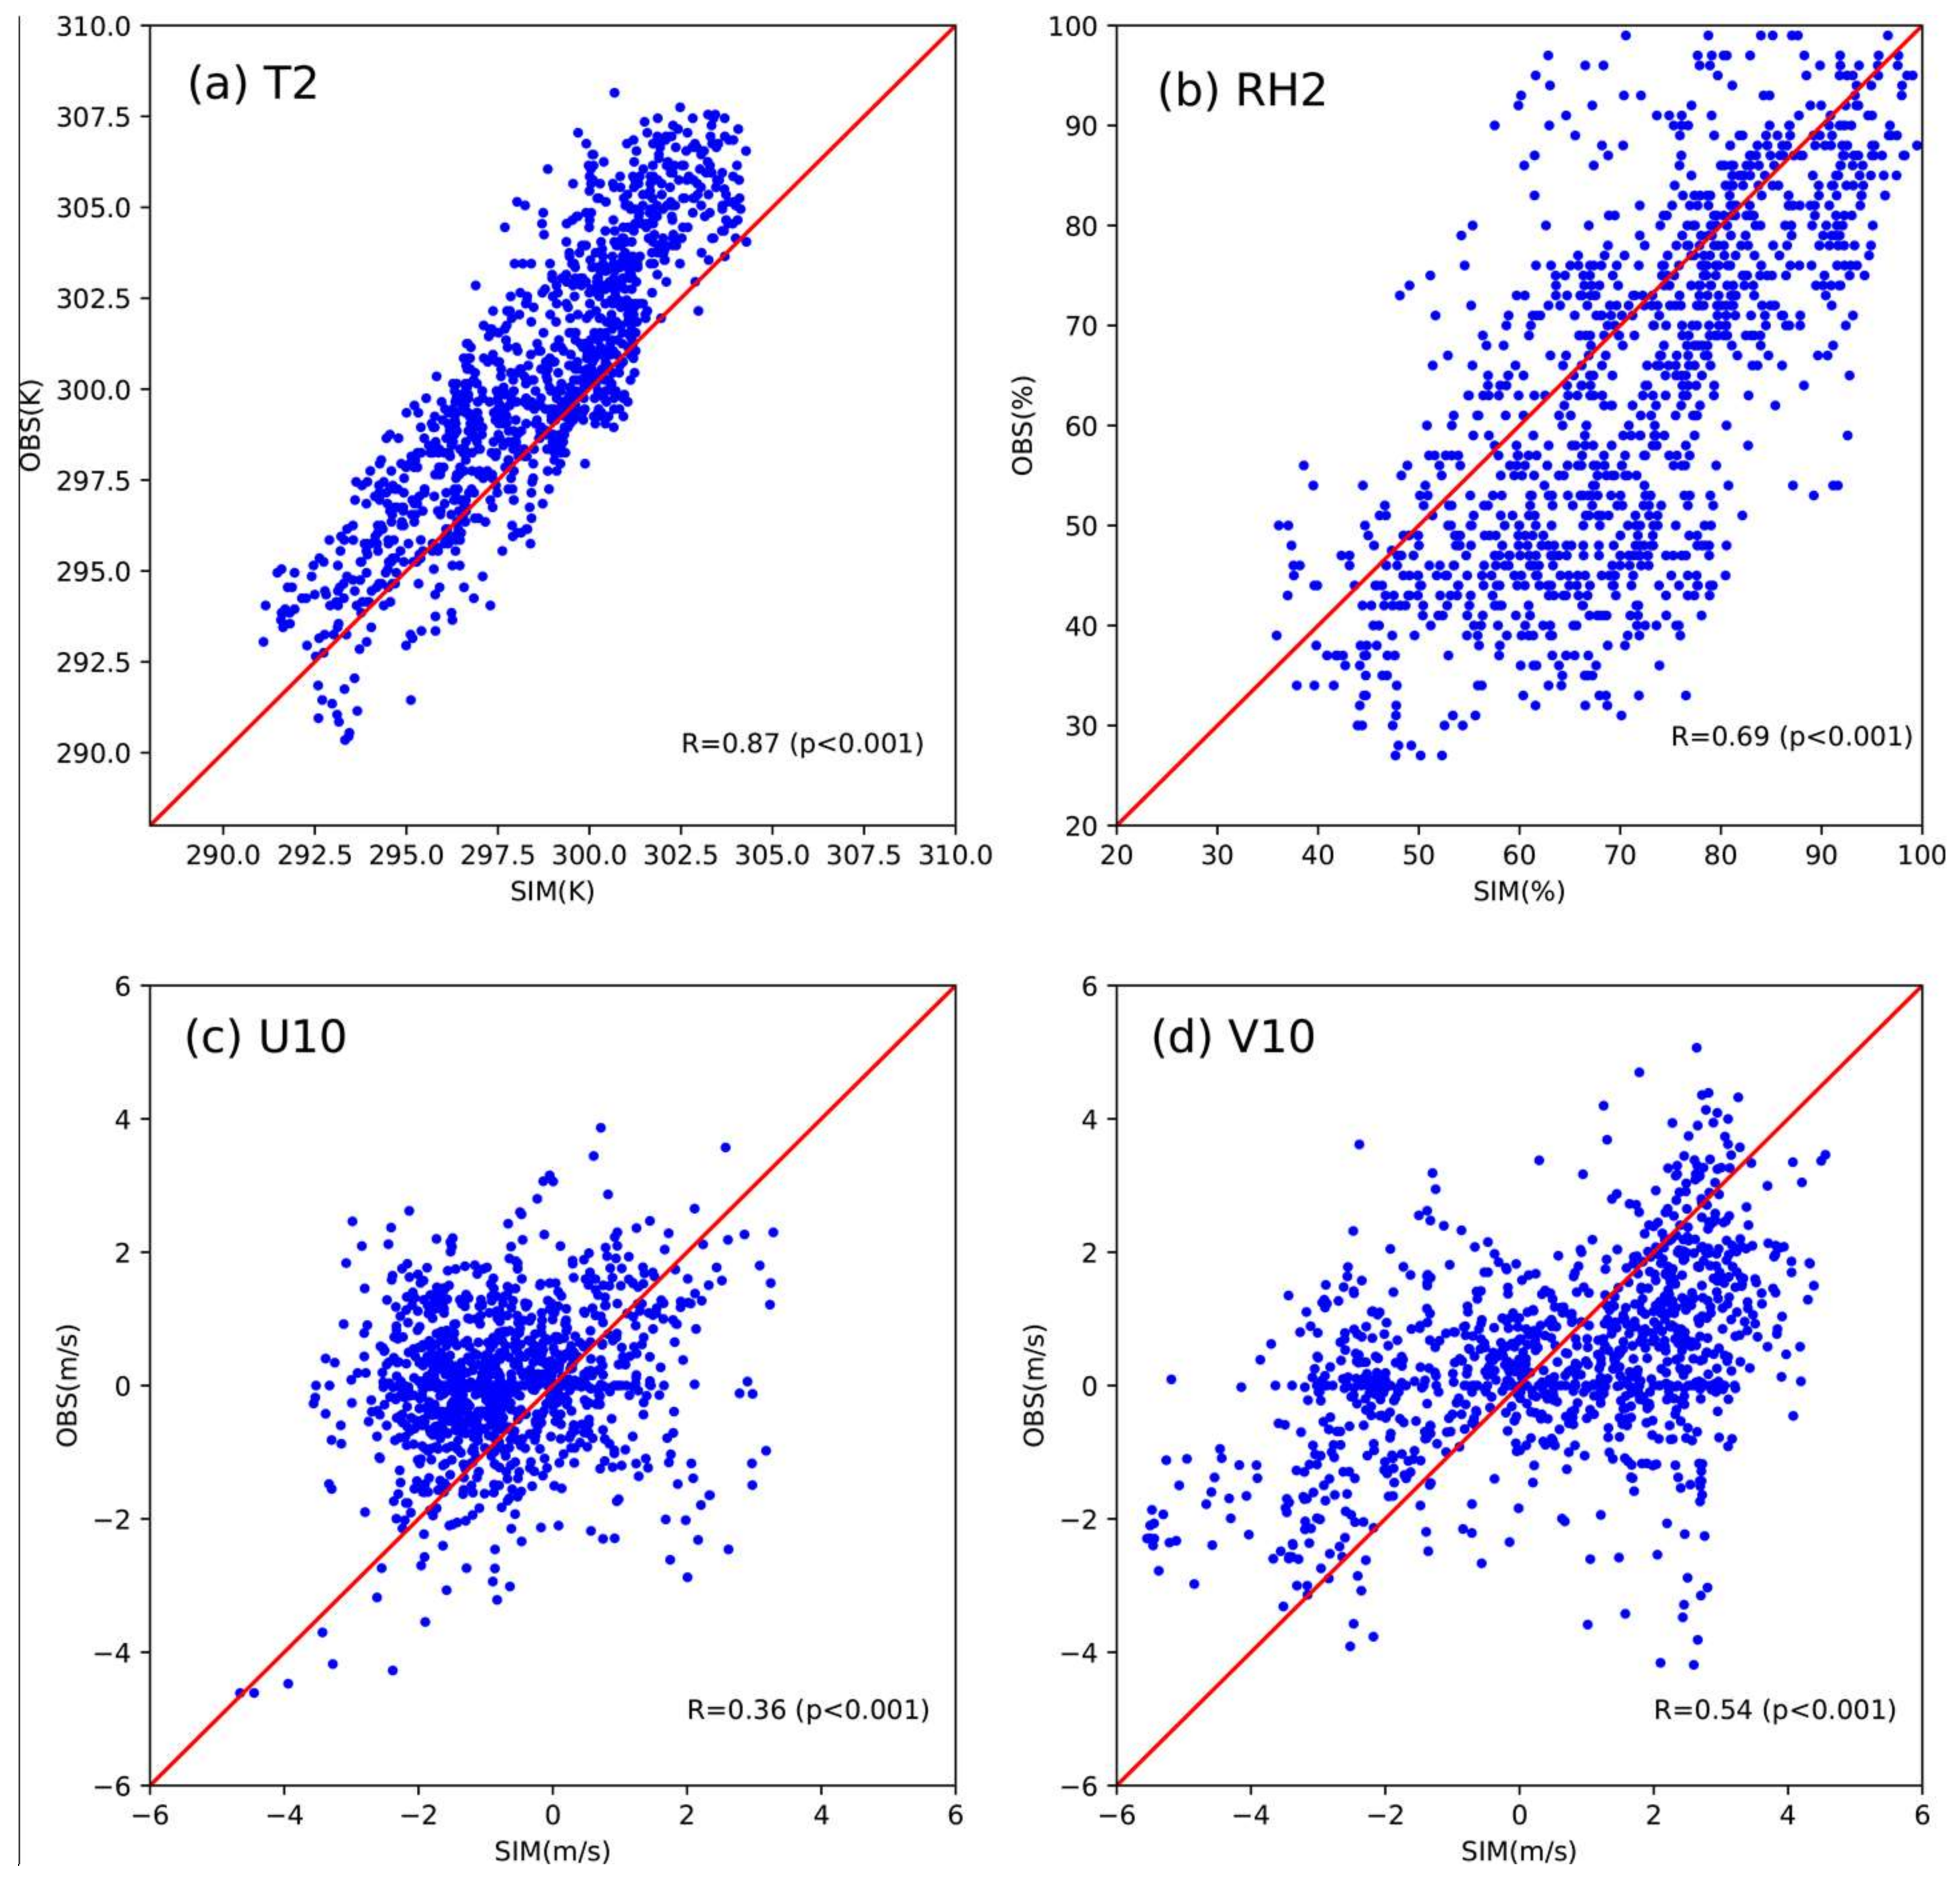
Figure 8a,b shows a scatter plot of the observed and CTL experiment simulated 2 m air temperature and 2 m relative humidity. The correlation coefficients between observed and simulated values are 0.87 for air temperature and 0.69 for relative humidity. Overall, the horizontal distribution of the 2 m air temperature and 2 m relative humidity can be simulated, although there are still slight differences (
Figure 9).
Compared with the observed data, the 10 m wind speed is overestimated, and the wind direction is slightly different as well. Despite this discrepancy in wind direction, most of the fluctuation characteristics and variation trends in wind direction can be reflected by the CTL experiment. The simulation in the daytime is better than the nighttime (
Figure 5a,b). The 10 m U-component and 10 m V-component were compared with the observations (
Figure 8c,d), and the correlation coefficients are 0.36 and 0.54, respectively. The conversion time is approximately half an hour later than the observation. Wind speed and the variation trend in wind direction were well simulated. The conversion time and wind speed of SLB are close to the simulation noted in Ma et al. [
7].
As we can see from the 10 m wind field, the CTL experiment can simulate the SLB process, and the conversion and wind characteristics of SLB due to underlying surface and topography are also reflected by the model (
Figure 9). At 8:00 BJT, Qingdao was controlled by land breeze, and the air temperature over land was lower than that over the sea surface. At 14:00 BJT, the SLB transitioned to the coastal area, and the air temperature over land was significantly higher than the sea surface. As the land became warmer, the sea breeze began its invasion. The simulated area was entirely controlled by the sea breeze by 20:00 BJT.
3.2. SLB Process Analysis
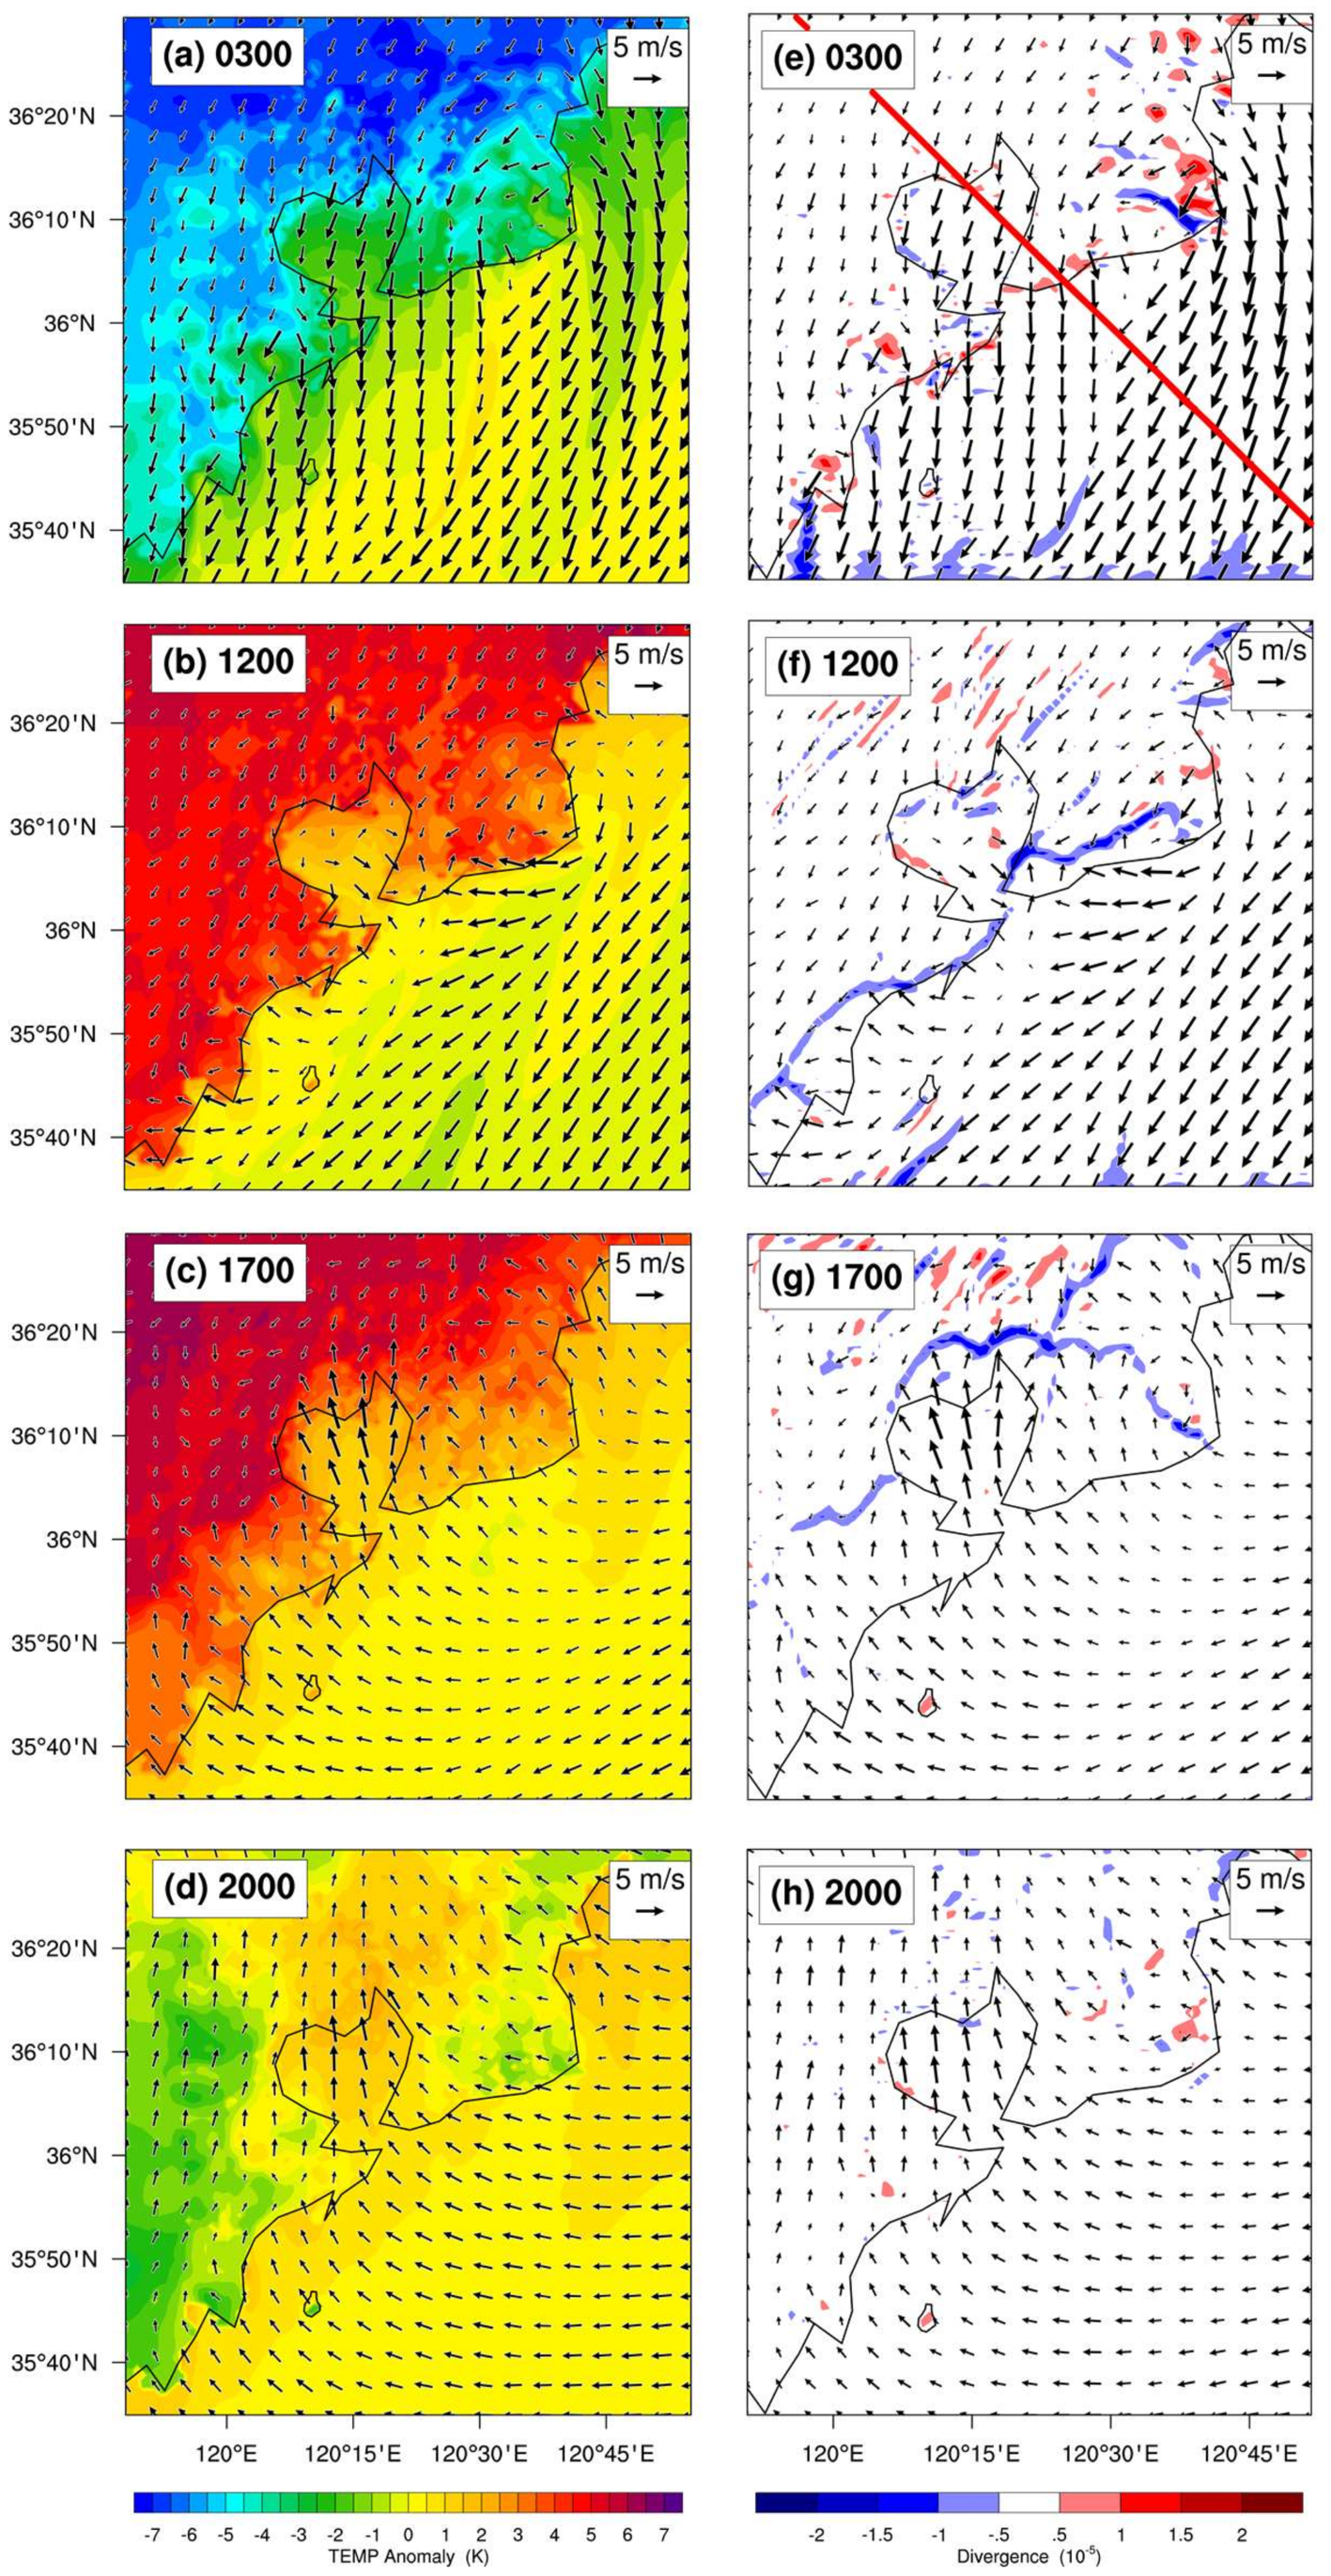
To understand the spatial-temporal structure of SLB, the perturbation of 2 m air temperature (i.e., hourly value subtracted from the daily mean), 10 m wind field and 200 m divergence field at different times are shown in
Figure 10. The location of air temperature, relative humidity and wind profile through 120.38 E, 36.1 N are also shown (
Figure 10e). If the SLB is only controlled by the land-sea thermal contrast, during a diurnal cycle the sea breeze is strongest in the afternoon. However, in the real situation, the development of sea-breeze and its inland penetration are co-influenced by lots of other factors/processes [
2,
25,
32,
33], such as the large-scale synoptic conditions, urban heat island effects and mountains.
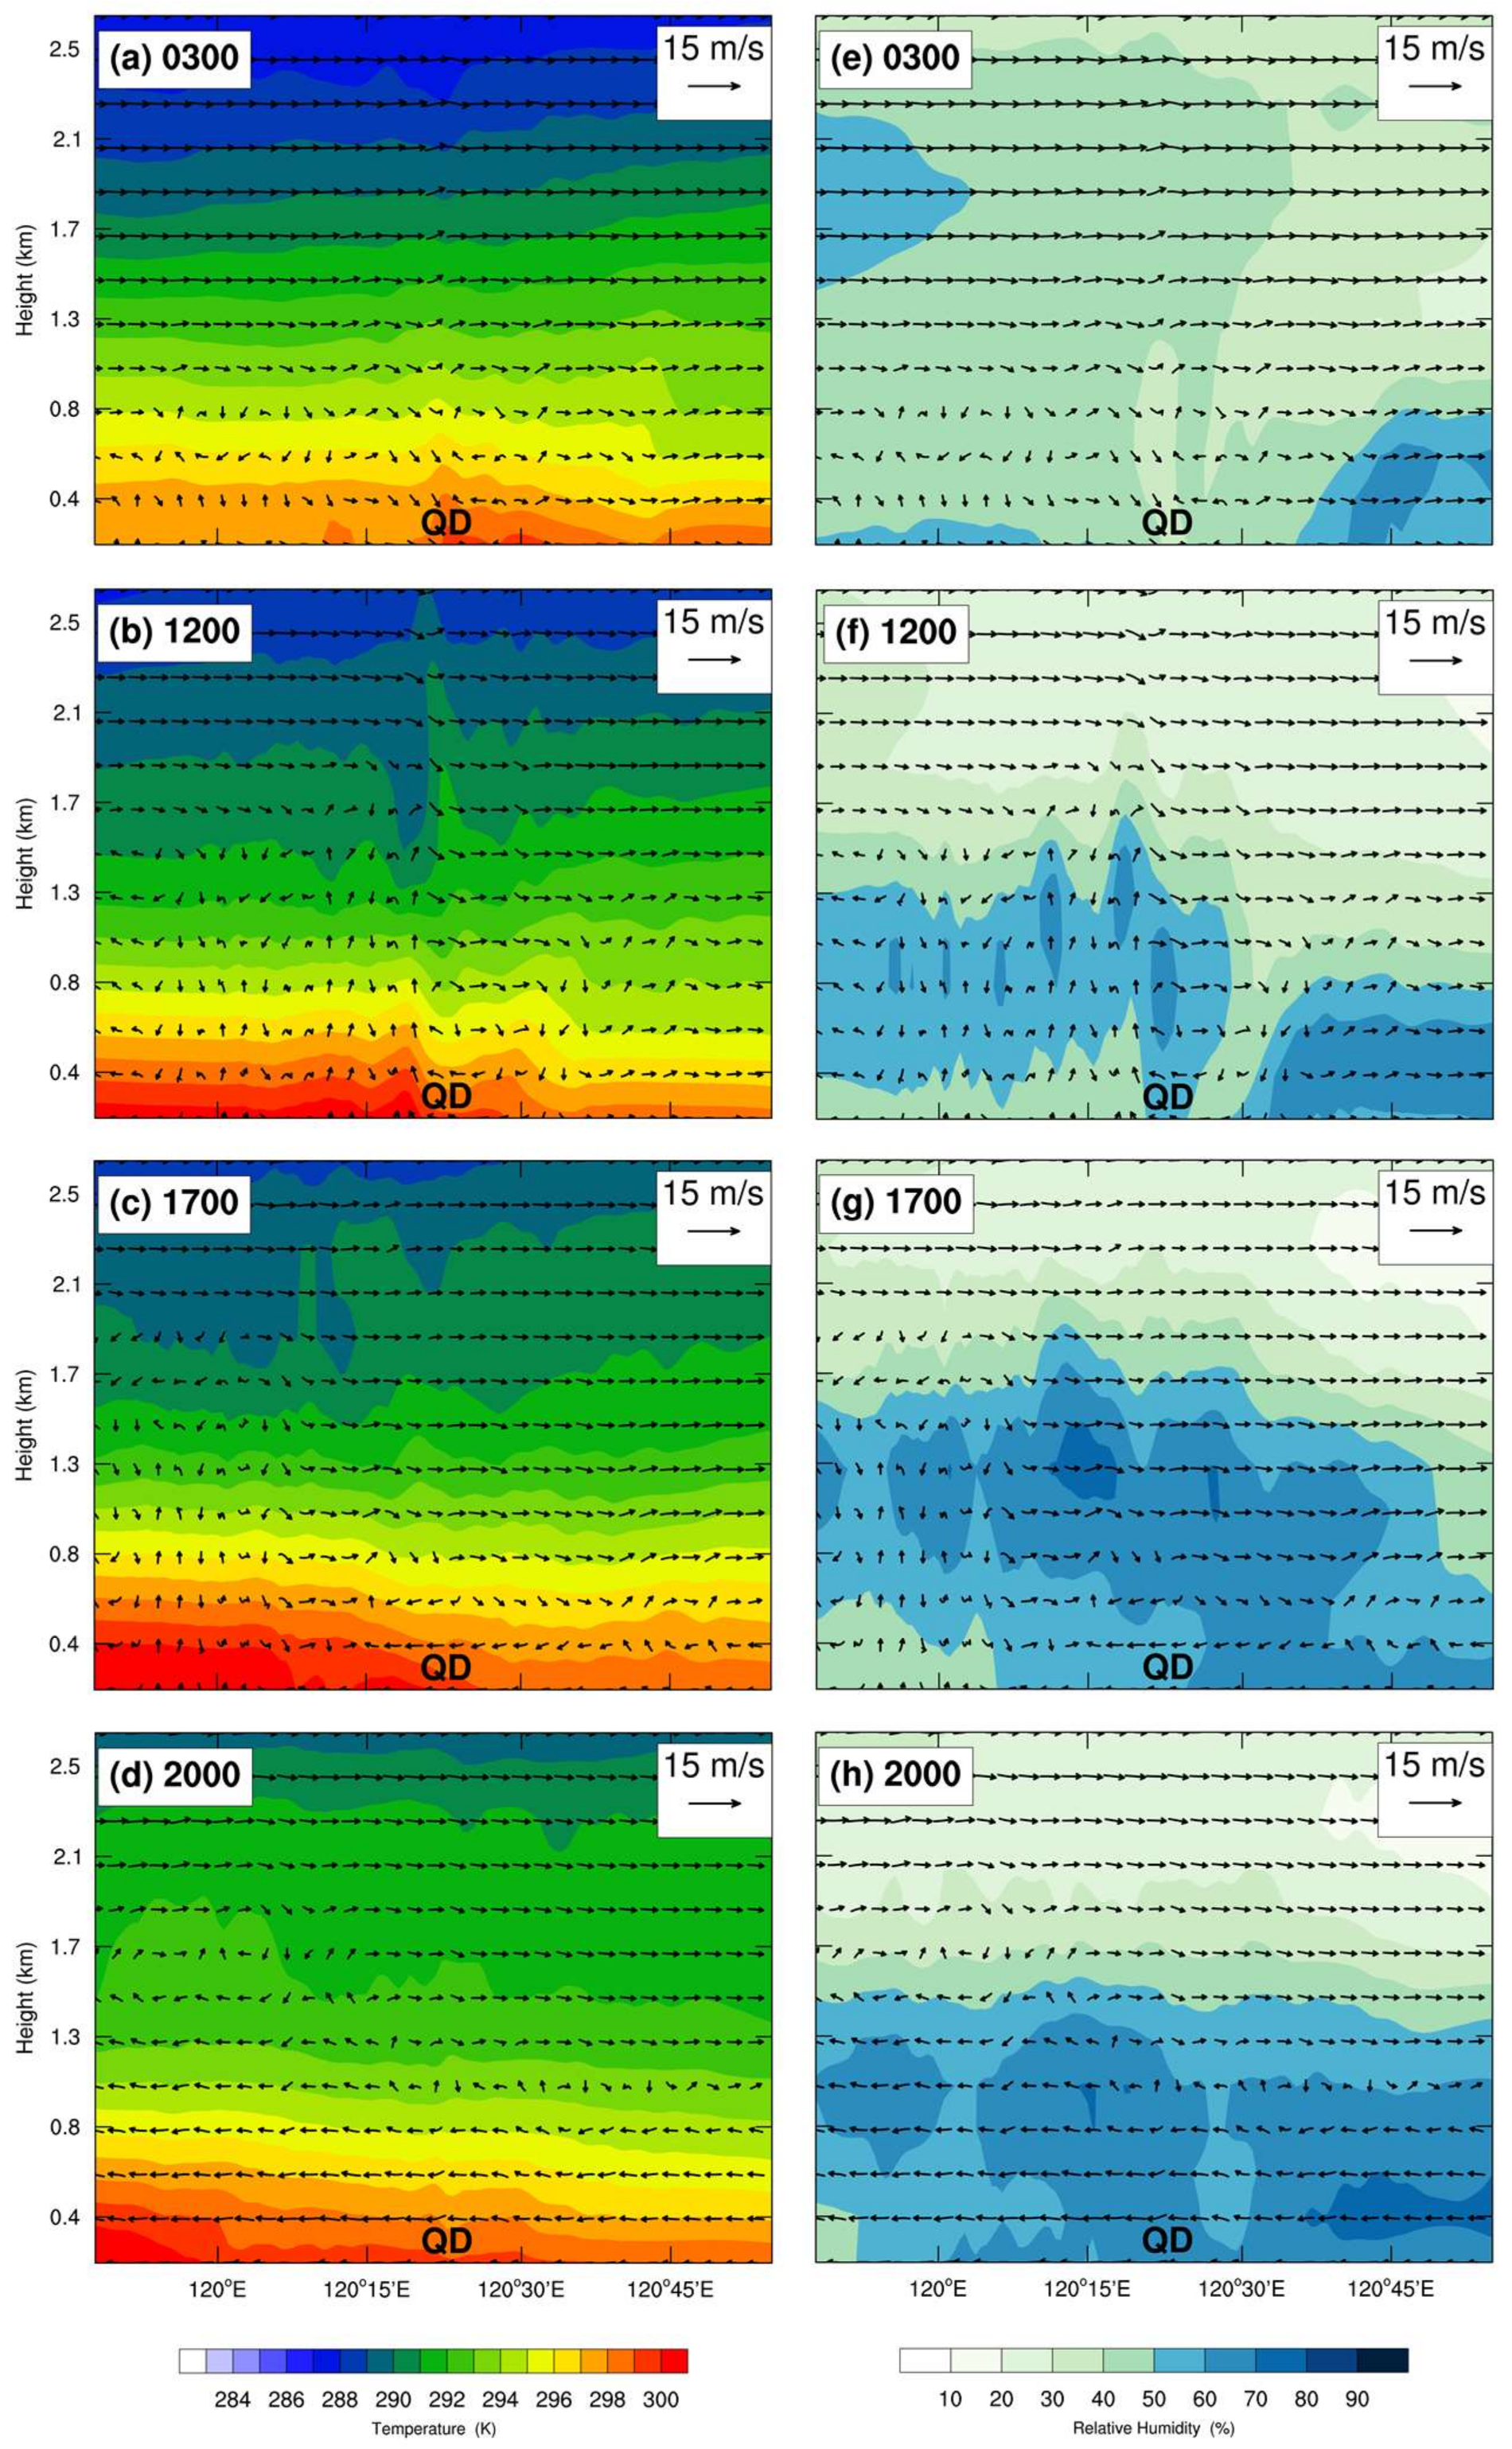
At 3:00 BJT, the 2 m air temperature anomalies are negative by approximately 5 K over most of the land area but positive over the sea. The cooling rate in the urban area is lower than the suburban areas (
Figure 10a), which makes the 2 m air temperature over the urban area approximately 2 K higher than the inland (
Figure 11a). The temperature differences between sea and land led to the development of land breeze (
Figure 10a). The entire land area was completely controlled by land breeze. Due to the topography, there was a convergence zone and flows near the Laoshan mountains (
Figure 10e).
At 12:00 BJT, there was an approximate 4–5 K 2 m air temperature positive anomaly over most of the land area, but a negative anomaly was over the sea area. Wind began to blow onshore, indicating the onset of the sea breeze. There are two strong convergence zones over the land, one is located in the east of the Laoshan mountains and another in the coastal zone. The convergence in the eastern Laoshan can be caused by the terrain, while the convergence in the coastal zone is mainly caused by the sea breeze front (SBF) (
Figure 10f). When the SBF reached Qingdao city, the air temperature dropped quickly. The air temperature over the urban area was approximately 1 K lower than the inland area (
Figure 11b), which caused the positive air temperature anomaly in the urban area to be lower than other areas (
Figure 10b). The updraft near SBF reached a height of 1.7 km (
Figure 11b). Wet air (RH > 50%) was transported to a height of 1.6 km by updraft flow near SBF. The southern part of Qingdao City may be affected by the descending air after the SBF, such that the relative humidity over this area was obviously lower than surrounding area (
Figure 11f). At this moment, the sea breeze only controlled the coastal area.
At 17:00 BJT, the 2 m air temperature anomalies reached 5 K over the sea-breeze controlled areas, the temperature difference between the sea and land continued to increase (
Figure 10c and
Figure 11c), and the sea breeze penetrated further inland. As the SBF penetrated into northern Jiaozhou Bay, an obvious convergence zone appeared in the front of SBF (
Figure 10g). The urban and Jiaozhou Bay areas were controlled by the sea breeze. The return flow of the sea breeze occurred at a height of approximately 800 m and the updraft flow near the SBF reached a height of 1.7 km (
Figure 11c), which resulted in high relative humidity (approximately 70%) at a height of 1.3 km (
Figure 11g). Due to the low roughness of the sea surface, the sea breeze in Jiaozhou Bay can reach 6 m/s, which is obviously higher than wind in the surrounding area. After the SBF passed through the bay, it penetrated inland rapidly as a sector-shape (
Figure 10g). Due to the sea breeze, there were significant cold wet effects, with 1 K cooling extent and a 50% increase in relative humidity (
Figure 11c,g).
At 20:00 BJT, the negative air temperature anomalies over the near-shore rural areas reached more than 2 K (
Figure 10d), while the difference between land and sea decreased (
Figure 11d,h). Compared with the sea breeze at previous times, the inland air temperature (17:00 BJT) decreased approximately 1 K, and the relative humidity increased to over 50%, due to the cooling and humidifying effect of sea breeze.
3.3. The Effect of Urbanization on the SLB
The built-up area of Qingdao increased from 95 km
2 in 1993 to 375 km
2 in 2012. To determine the effects of urbanization, the land-use grids of USGS data were used to replace the urban grids in the CTL experiment (
Figure 2b).
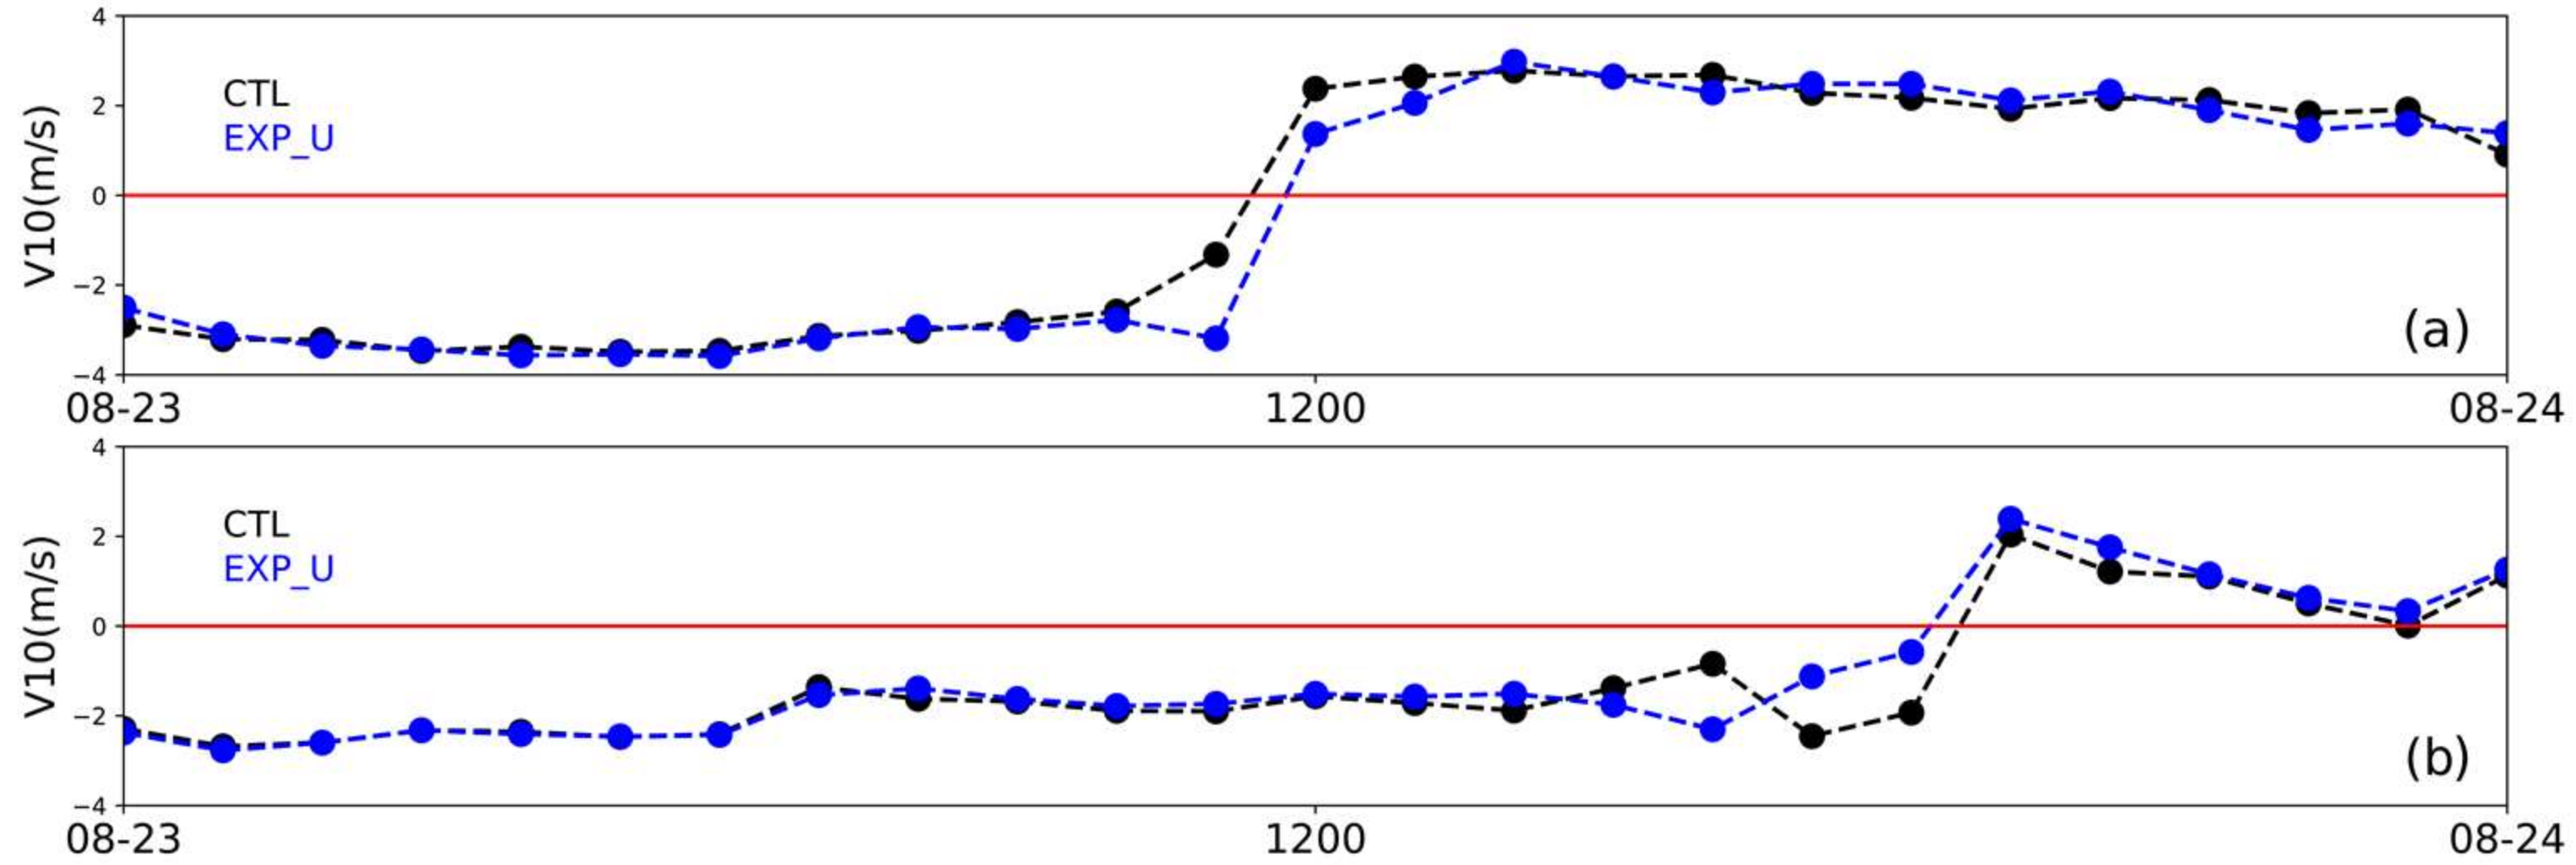
As shown in the 10 m V-component timing diagram, the SLB conversion times at all stations in the EXP_U experiment were the same as in the CTL experiment (
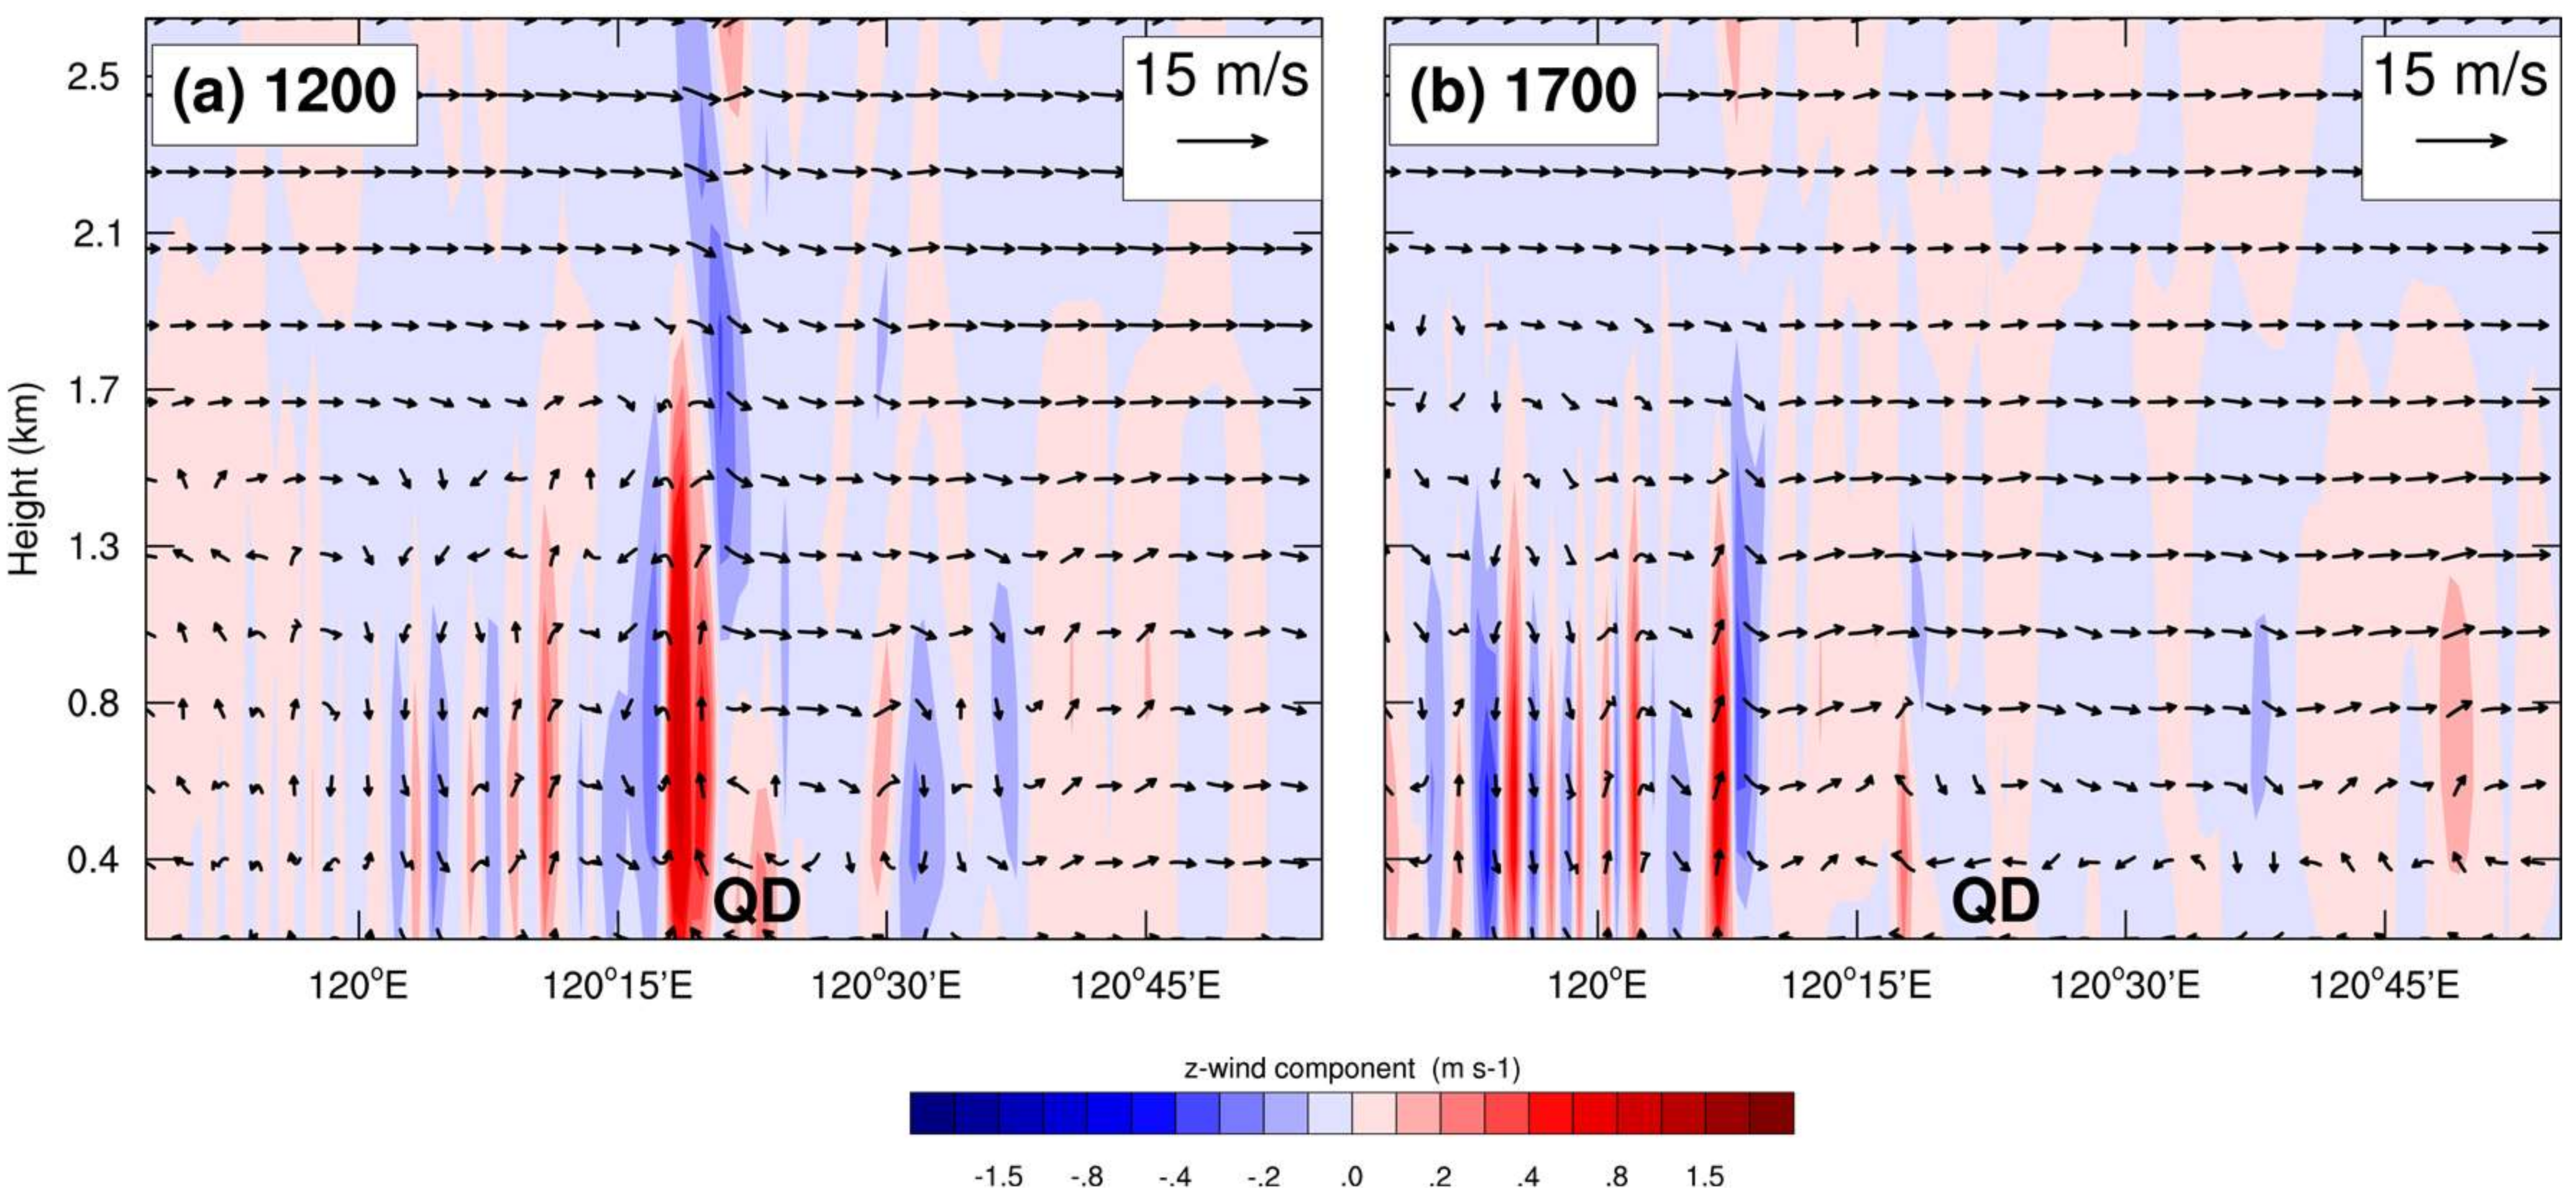
Figure 12). Before the sea breeze passed the urban area, the intensity of updraft in front of the SBF enhanced, due to urbanization and the increased UHI effect. At 17:00 BJT, the height of the updraft before the SBF was approximately 100 m higher than that in the CTL experiment (
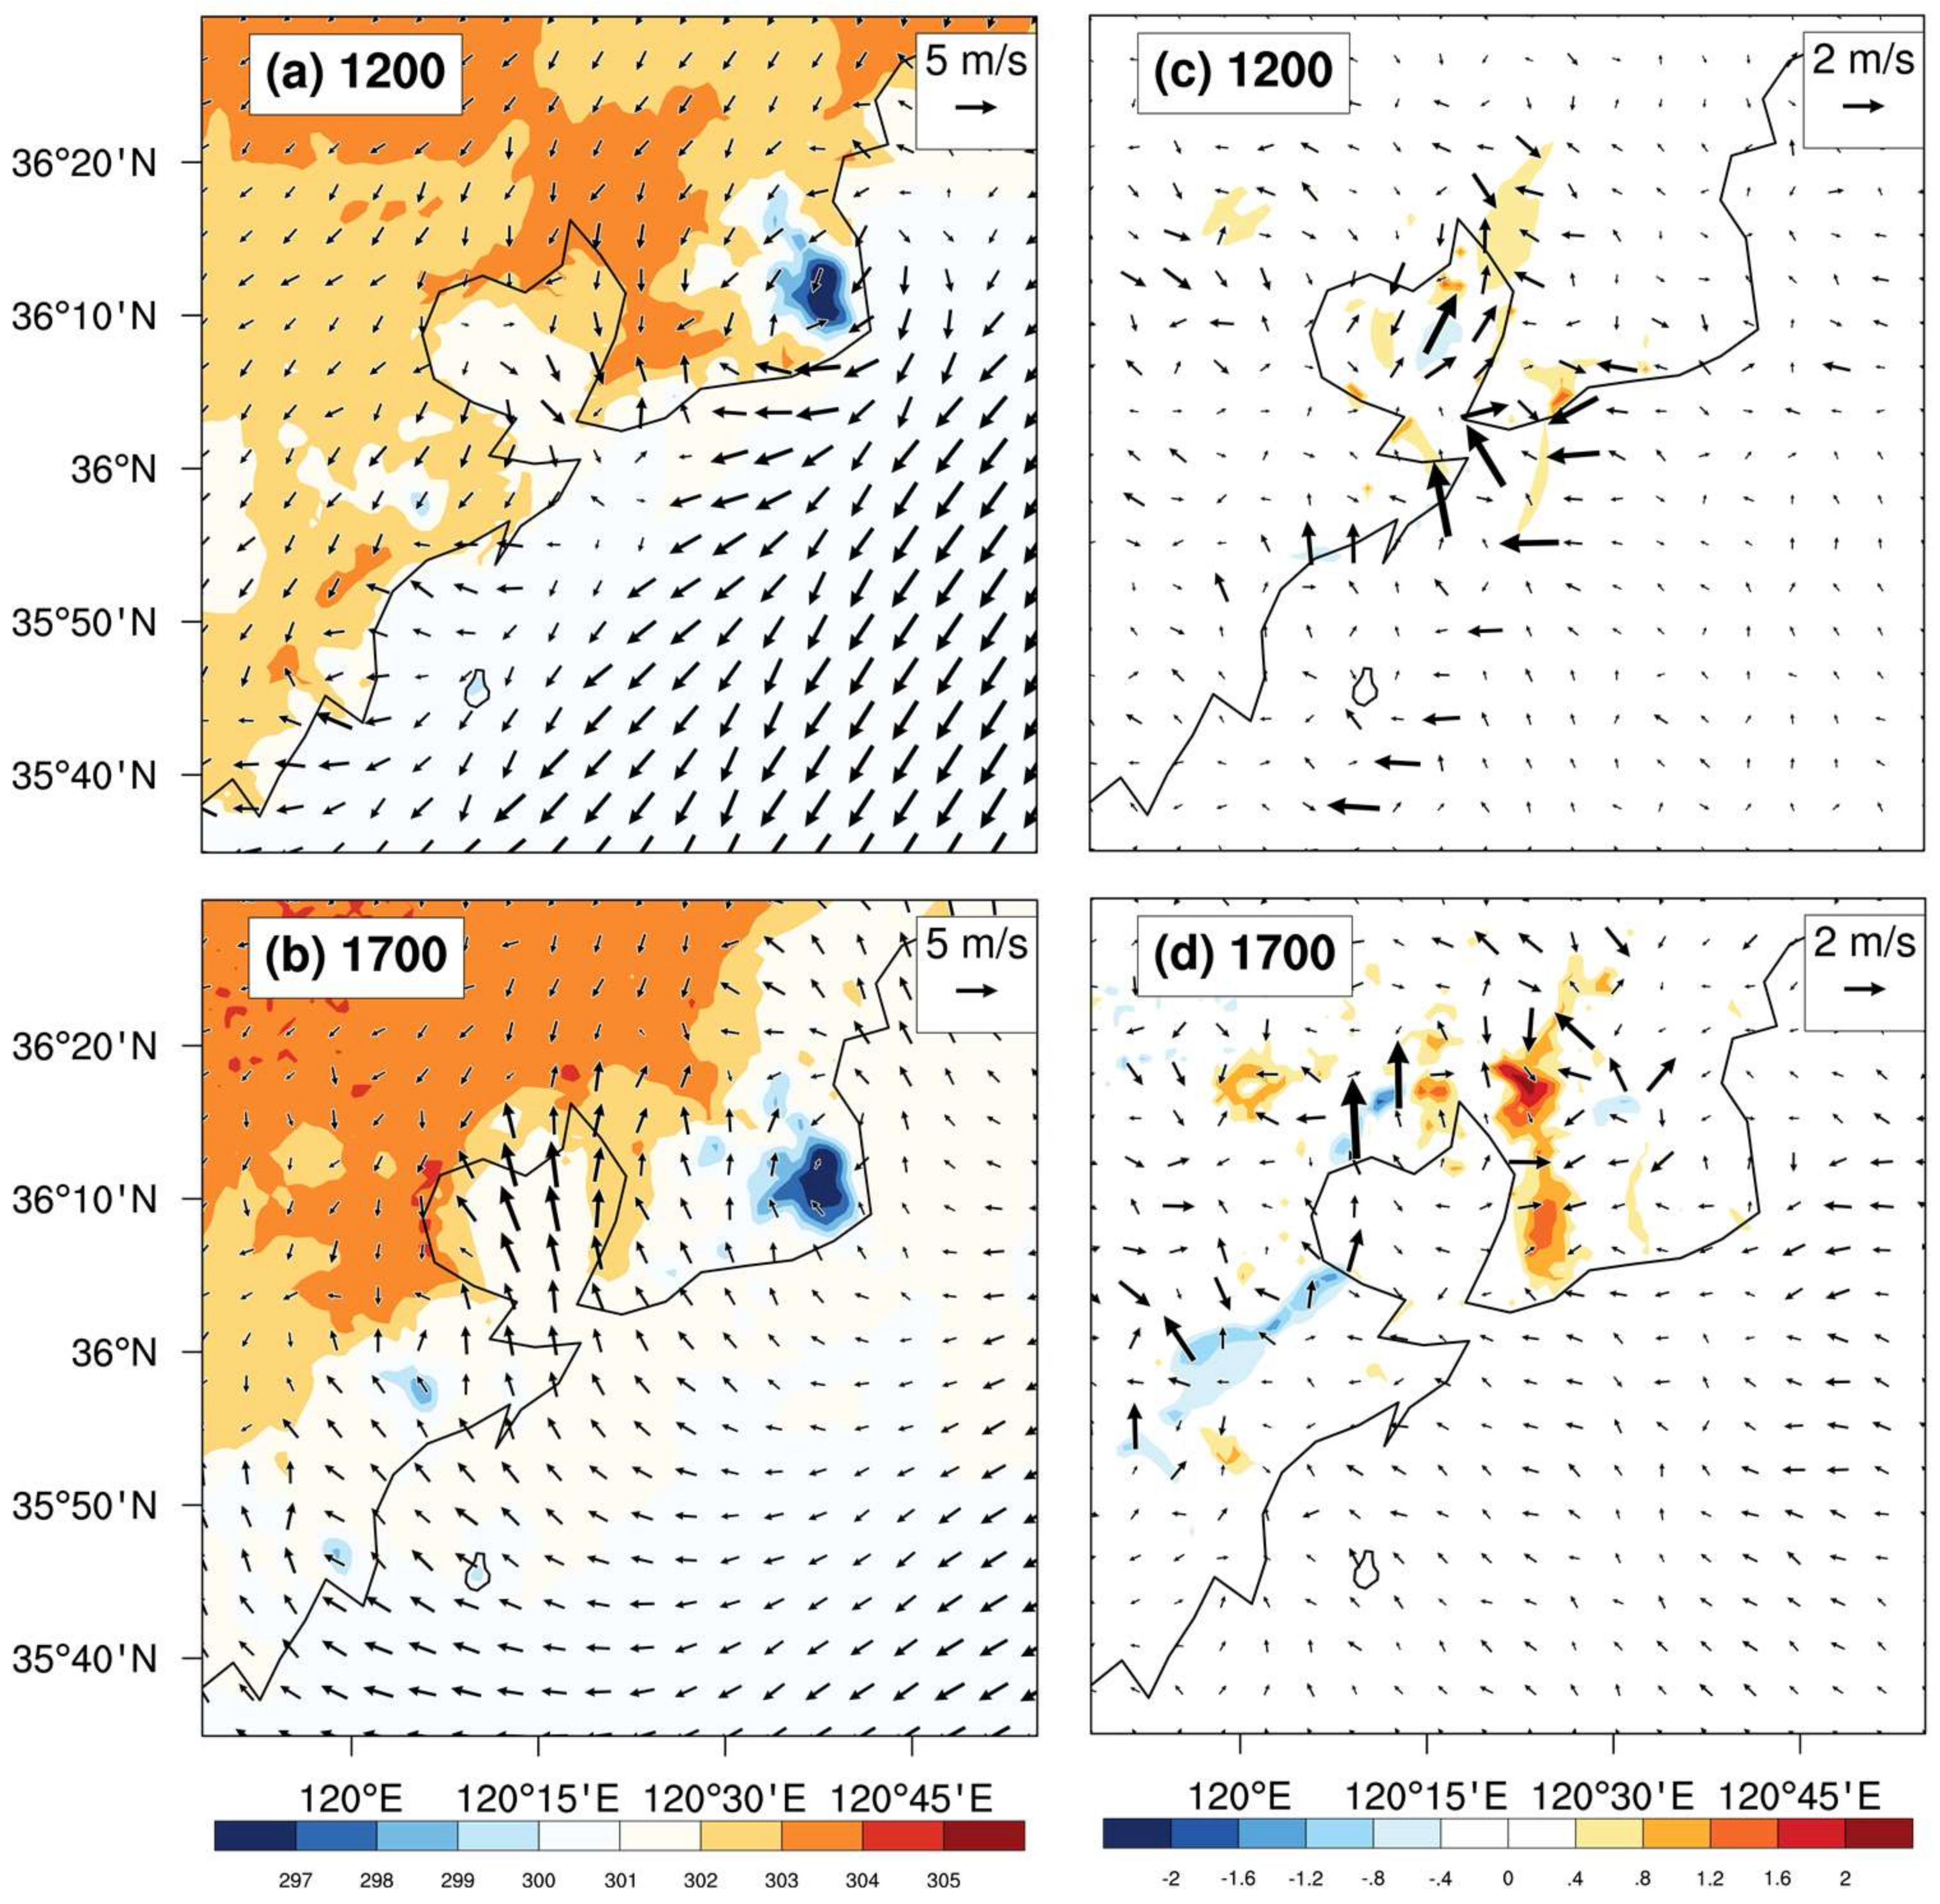
Figure 13). At the same time, the onshore wind was also stronger (
Figure 12a). After the SBF passed through the city, drag force on the near-surface layer was enhanced due to the increased roughness of the urban underlying surface. In addition, the wind speed in the urbanized area can be reduced by more than 2 m·s
−1 at most. The urban area expansion and the UHI effect inhibited the development of the sea breeze (
Figure 12b and
Figure 14b,d).
Because urban areas are covered with asphalt and concrete, they have a higher heat storage capacity than suburban areas; cities can convert more radiant energy to sensible heat than suburban areas and store them, making urban night temperatures higher than the temperature in the surrounding areas. Therefore, from 18:00 BJT on the 23rd to 06:00 BJT of the next day, the 2 m temperature of the urbanized area had a clear positive temperature deviation. At 19:00 BJT, there was an approximate 5 K maximum positive deviation, although the difference during the rest of the time was not obvious. The tendencies of the surface layer wind speed to decrease and the temperature to increase in this urban area were similar results to those in the study by Ma et al. [
7], but there are slight differences between the specific values and the starting time. The differences may be due to specific details of the different cases, areas and the numerical experiment sets.
In summary, before the sea breeze passes a city, the UHI may enhance the circulation of the SLB. After the sea breeze passes a city, enhancement of the UHI circulation and the underlying surface drag will slow down the penetration of the sea breeze moving inland. Urbanization will also reduce the wind speed near the ground and increase the temperature at night.
3.4. The Effect of Coastline Changes on the SLB
To determine the influence of coastal change on SLB, the MODIS (2012) coastline position was replaced by USGS (1992) data in EXP_C numerical experiment, while the underlying surface remained unchanged in other regions (
Figure 2c). Compared with the USGS (1992) land-use data, the coastline of Aoshan Bay, east Laoshan, Jiaozhou Bay and the Xuejia Island northern tip to Guzhenkou Bay in the MODIS (2012) land-use data changed greatly and pushed 2–5 km to the ocean.
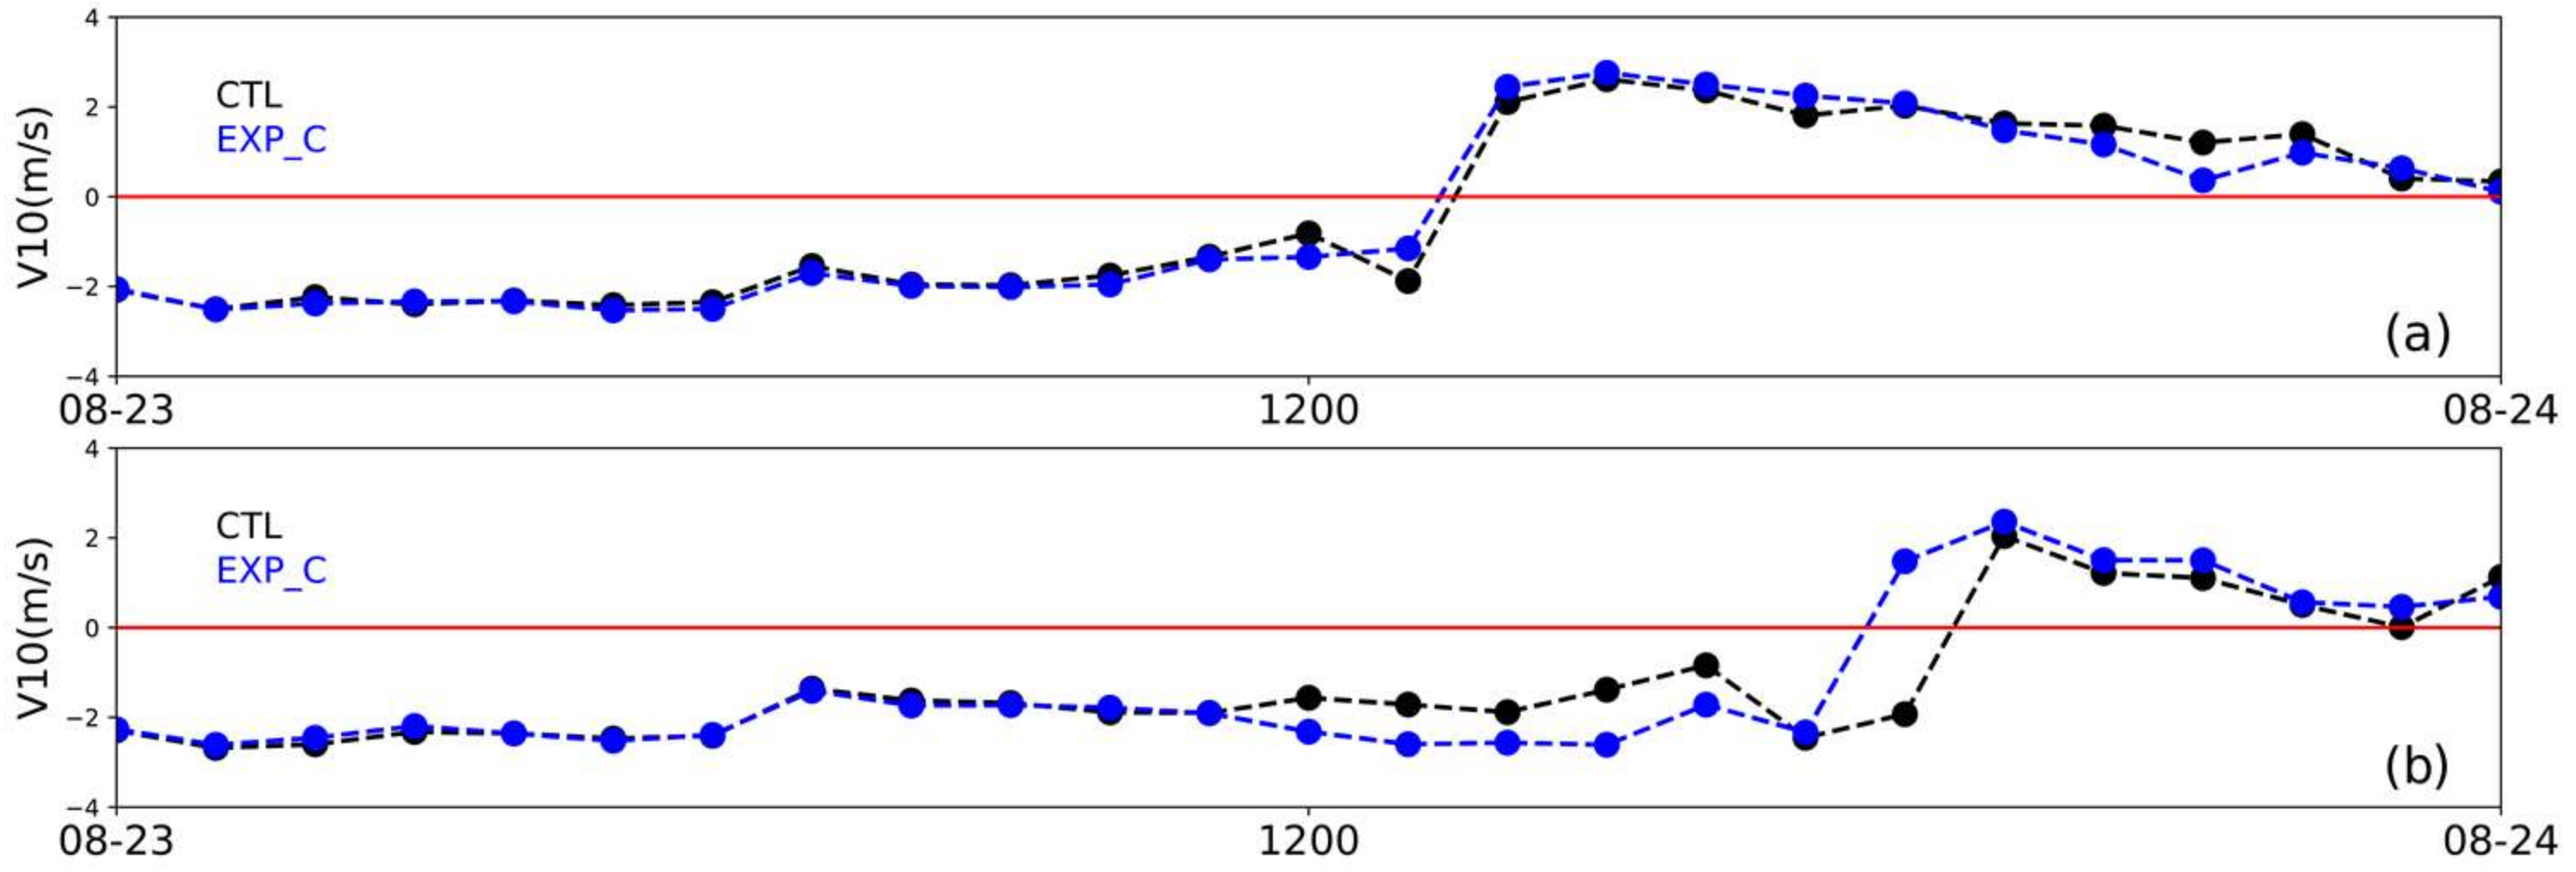
From the 10 m V-component timing diagram, the SLB conversion times of the EXP_C and the CTL were both at 14:00 BJT on the 23rd. In EXP_C experiment, land breeze conversion time at Jimo Station was 18:00 BJT, approximately an hour earlier than the CTL experiment result (
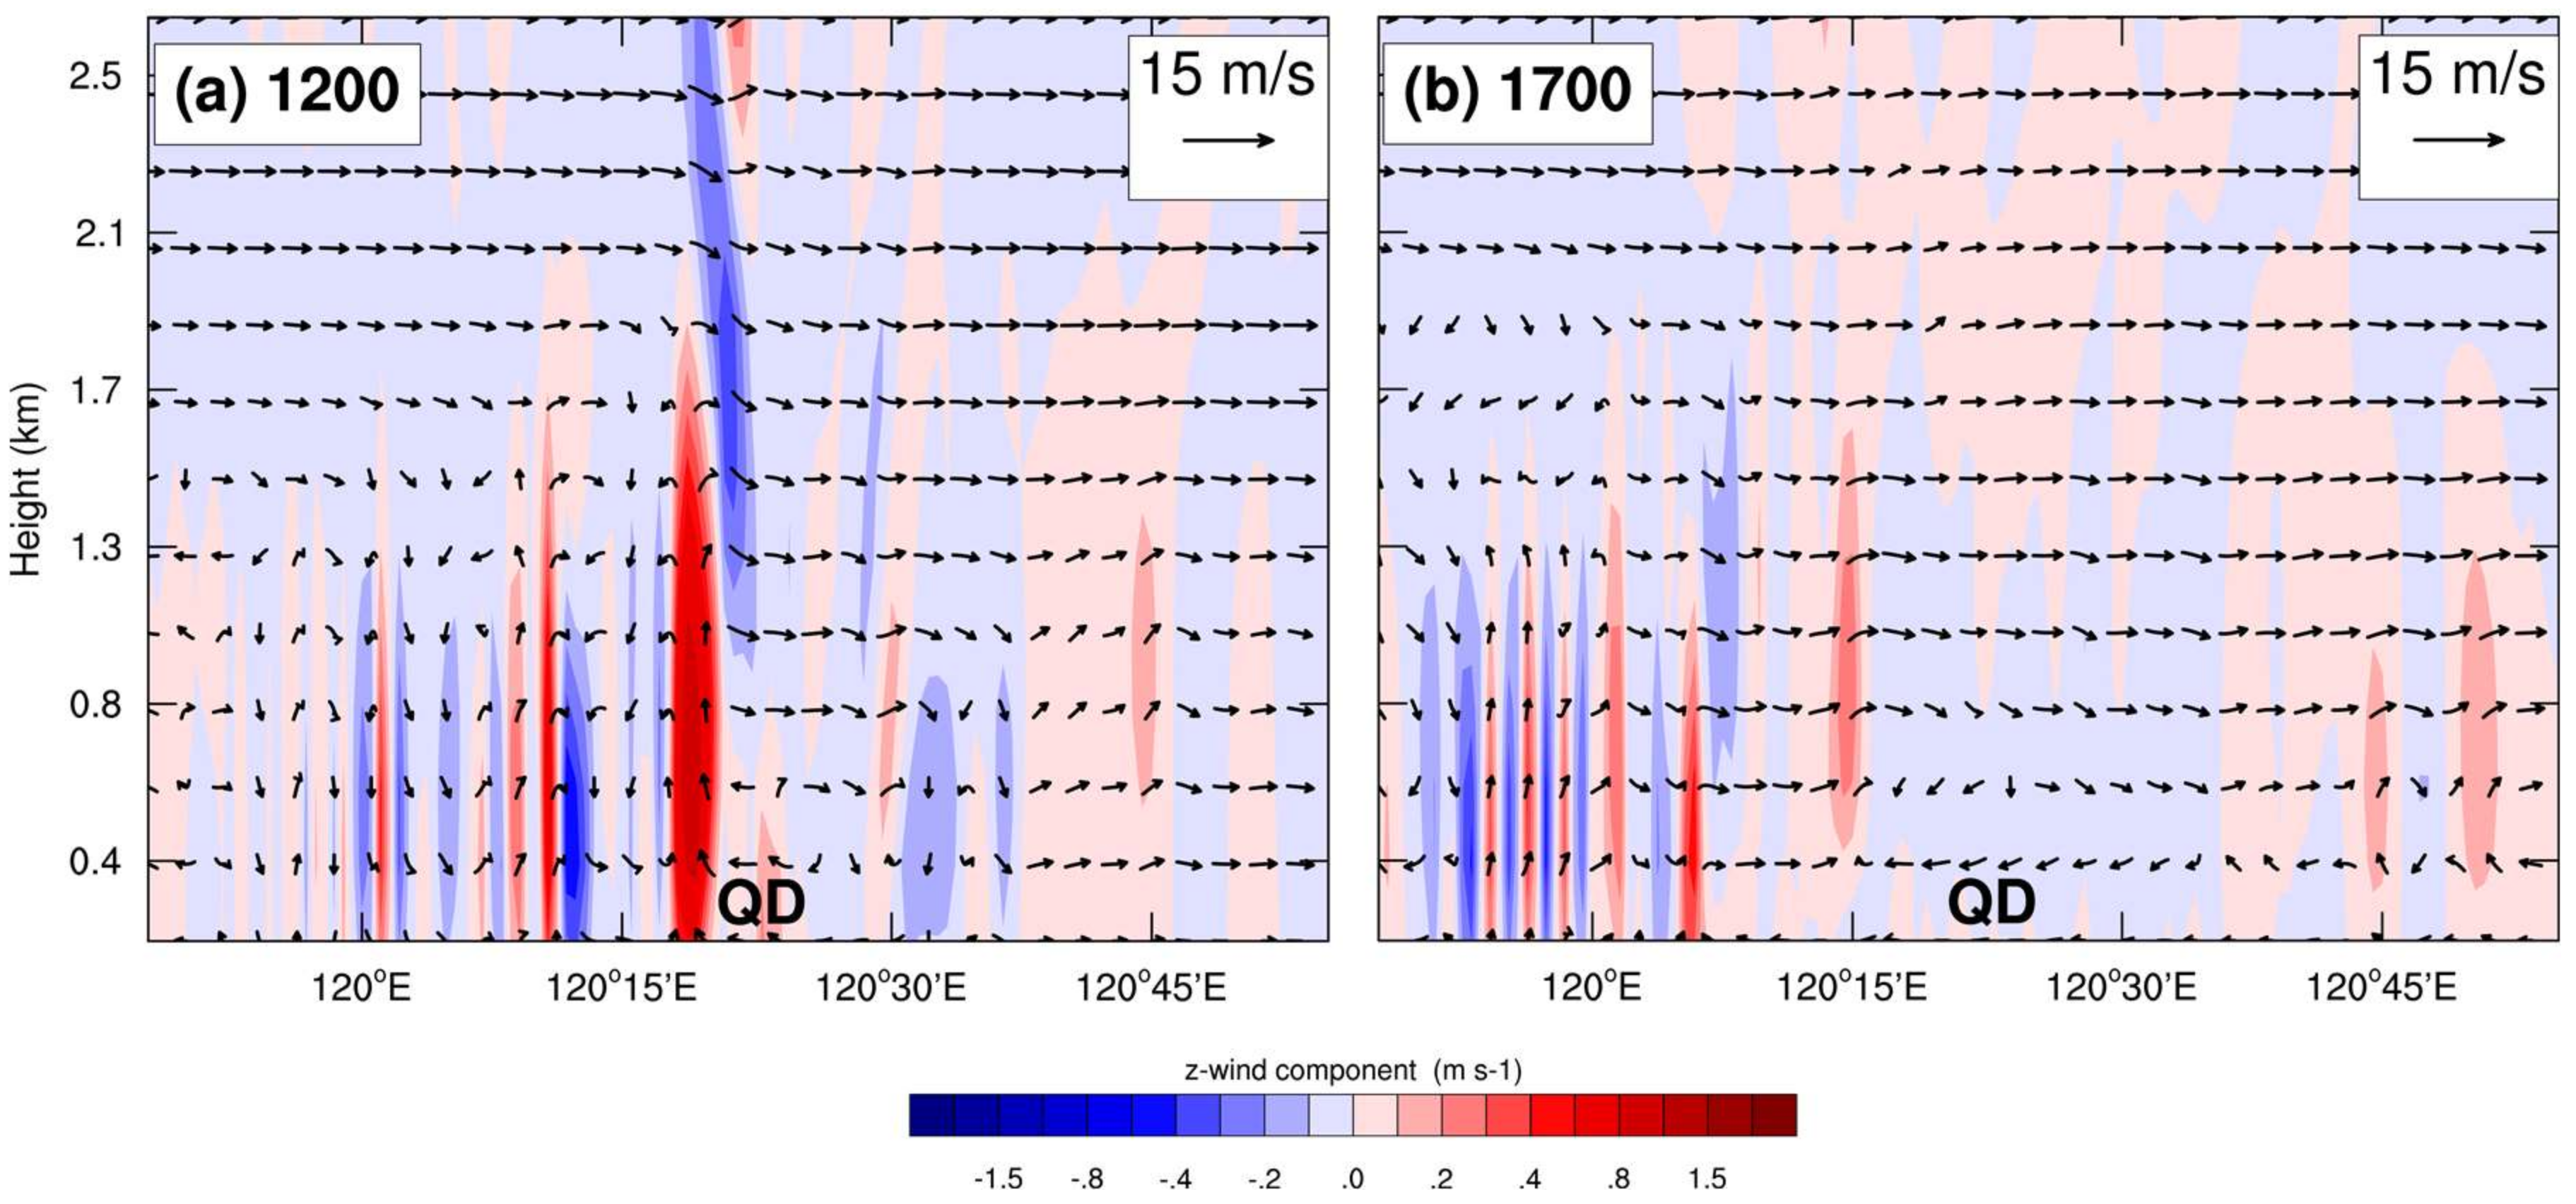
Figure 15). This result may be due to the increased distance between the Jimo station and the coastline and the increased roughness of the underlying surface after the coastline toward the sea. As it can be seen from the vertical section (
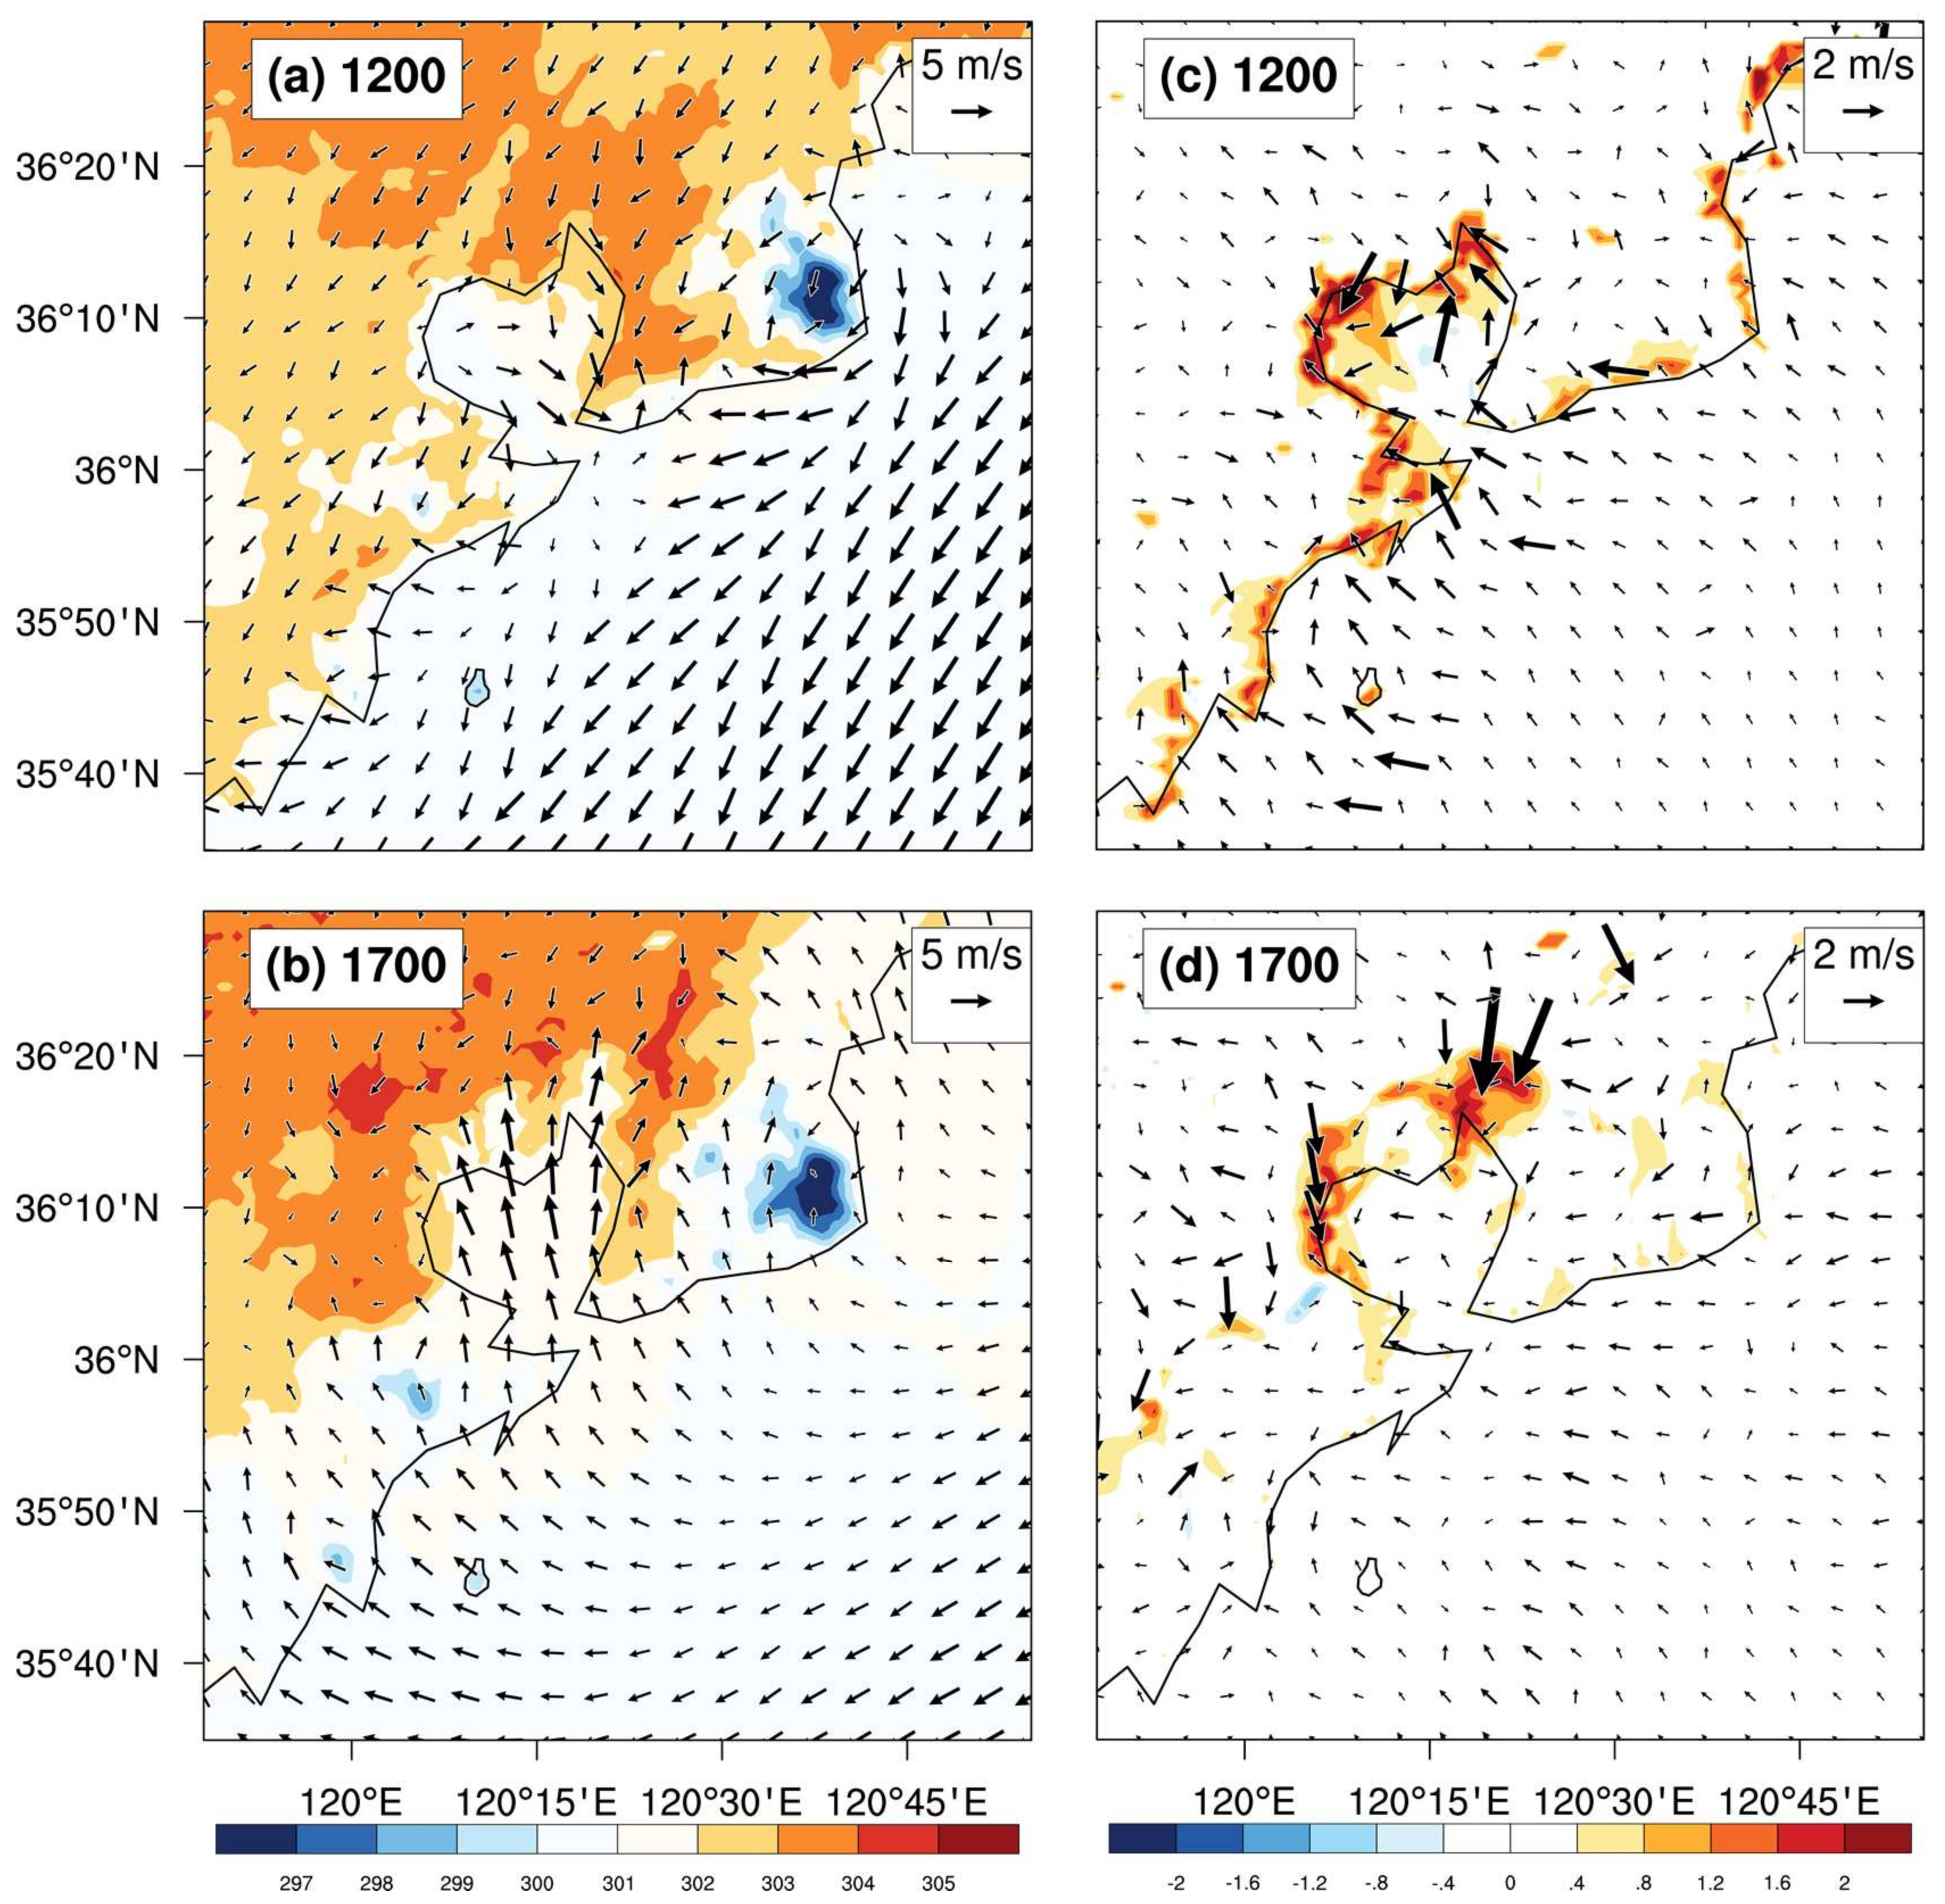
Figure 16), the updraft at 17:00 BJT reached a height of 1.9 km, which was approximately 200 m higher than that in the CTL experiment, which was not obvious at other times. From the 10 m wind field, the wind speed over the changed coastline area was slightly lower, which was caused by the roughness of the underlying surface, when the land was completely controlled by land breeze (3:00 BJT) or sea breeze (20:00 CST). In the stage of sea breeze penetration (at 12:00 and 17:00 BJT), the onshore wind near the changed coastline area was weakened, and the penetration speed of the SBF inland was weakened. This phenomenon was particularly noticeable at the northeast and northwest edges of Jiaozhou Bay (
Figure 17).
Due to the difference in heat capacity between the sea and land surfaces, land heating is faster than sea surface heating during daytime, resulting in the 2 m air temperature of the land surface being higher than the sea surface; at night, land cooling is faster relative to the sea surface, causing the 2 m air temperature of the land surface to lower than the sea surface. After the coastline moved into the ocean, the 2 m air temperature above the coastline was higher between 8:00 and 17:00 BJT, which was over 2 K, and low at other times (
Figure 17a,c). Due to the time and direction of the development of the sea breeze caused by the coastal change, the air temperature near the SBF was approximately 2 K higher when the SBF crossed (
Figure 17b,d).
In summary, due to the coastline pushing to the sea, the height of the sea breeze circulation was reduced, and the direction changed. When the sea breeze penetration path was located in the changed coastal area, the SLB conversion time in the inland area on the forward path was postponed, and the wind speed near the ground was reduced. During the day, the air temperature over the coastal change area increased, which was in contrast to the night. The air temperature near the SBF increased.
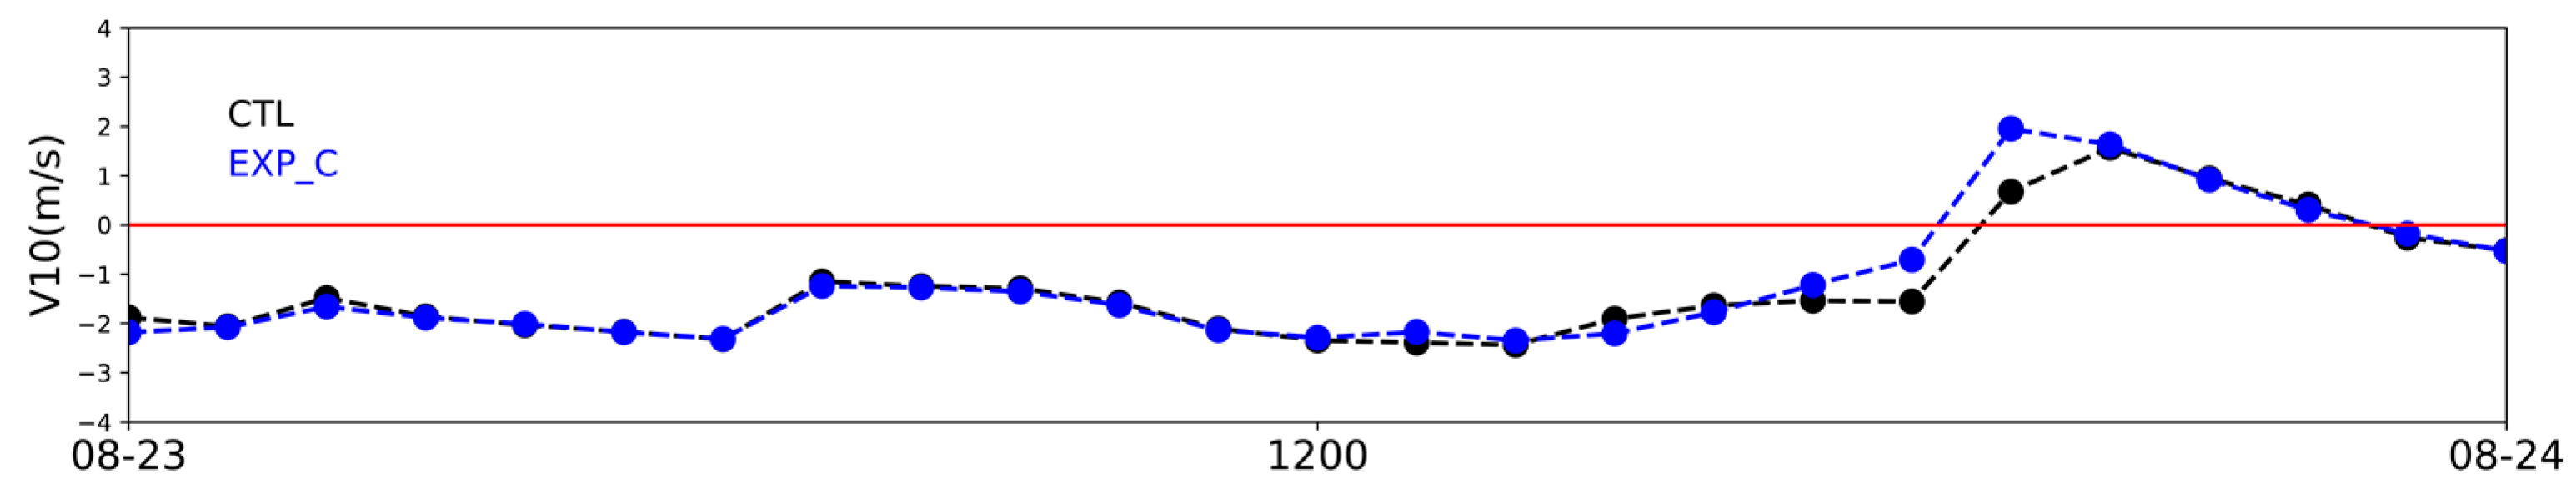
To verify this result, we simulated an SLB process that occurred on 23 August 2006 (
Figure 18). No changes were made to the numerical experiment settings, such as the domain and the physics options. In this case, the sea breeze penetration path also passed through the changed coastline area at the northeastern corner of Jiaozhou Bay. The 10 m V-component timing diagram at Jimo station showed the same tendency but with a smaller change rate.
4. Conclusions
In this study, the impact of urbanization and coastline changes on the SLB were investigated using the WRF model through an SLB process in Qingdao on 23 August 2016. The following conclusions were determined:
(1) During the development of the sea breeze, the inland movement of the SBF in the Jiaozhou Bay area is obviously faster than that of the land area, and the wind speed can reach 5 m/s. After the SBF passed the Jiaozhou Bay region, it rapidly moved toward northwest; the height of the sea breeze return flow changed with the development of the sea breeze, and it increased to a height of 600 m at 17:00 BJT. Compared to rural areas, in urban areas, the temperature drop is lower at night, and the cooling effect is also weaker after the pass of the sea breeze.
(2) UHI leads to a stronger wind component in cities. The updraft before SBF was enhanced before the sea breeze passed the city. After the SBF passed through the city, the development of the sea breeze was suppressed. Due to the increased roughness of the urban underlying surface, the drag force on the near-surface wind was enhanced, and the wind speed in the urban area was reduced. As the heat capacity of the urban underlying surface was larger than that of the rural area, and the nighttime air temperature in the urban area was significantly higher than that of the surrounding rural areas.
(3) As a result of artificial reclamation, the coastline has been pushed 2–5 km offshore. When the sea breeze penetration path was located on the coastal change area, the conversion time of SLB was delayed, and the 10 m wind speed was reduced, due to the increased roughness of the underlying surface. In addition, the land area on the path of sea breeze penetration increased. The intensity of the sea breeze decreased, and the maximum height of the updraft behind the SBF reduced by approximately 200 m. The air temperature over the changed coastline area increased during the day and decreased at night. The air temperature around the SBF was higher. The temperature in other areas changed slightly.
This study evaluates the effects of urbanization and coastal change in Qingdao and shows coastal change playing a more important role. Although urbanization effects on air temperature and relative humidity are mostly confined to the changed underlying surface area, because of the large number of people living in the city, people are relatively sensitive to such local changes. At the same time, the impact of coastal change on the intensity of SLB circulation and conversion time should not be neglected. Besides, this study is merely a case study to unravel the complicated interactions between urbanization and SLB in Qingdao, which warrants further observational and numerical studies. The environmental impact of the continuous reclamation of land in China in recent years should be given more attention.
Author Contributions
Data curation, S.H.; Formal analysis, S.H.; Funding acquisition, Y.M. and L.S.; Methodology, Y.M., L.W. and Q.C.; Project administration, L.S.; Software, L.W. and Q.C.; Supervision, L.S.; Visualization, S.H.; Writing—Original draft, S.H.; Writing—Review & editing, Y.M. and L.S.
Funding
This research was funded by National Natural Science Foundation of China: 41675146; National Natural Science Foundation of China: 41705002; National Natural Science Fund Youth Project of China: 41505083.
Acknowledgments
This work was supported by the National Natural Science Foundation of China under Grants 41675146, 41705002 and 41505083. The authors are thankful to China Meteorological Administration and NCEP for providing the observational data and reanalysis. We also appreciate the anonymous reviewers for their constructive comments that have helped improve this paper.
Conflicts of Interest
The authors declare no conflict of interest. The founding sponsors had no role in the design of the study; in the collection, analyses, or interpretation of data; in the writing of the manuscript; or in the decision to publish the results.
References
- Xue, D.; Zheng, Q.; Qian, X.; Meng, Z. Features of Sea-Land Breeze Circulation with its Influence over Shandong Peninsula. J. Nanjing Inst. Meteorol. 1995, 18, 293–299. [Google Scholar]
- Miller, S.T.K.; Keim, B.D.; Talbot, R.W.; Mao, H. Sea breeze: Structure, forecasting, and impacts. Rev. Geophys. 2003, 41, 1011. [Google Scholar] [CrossRef]
- Miao, Y.; Guo, J.; Liu, S.; Liu, H.; Li, Z.; Zhang, W.; Zhai, P. Classification of summertime synoptic patterns in Beijing and their associations with boundary layer structure affecting aerosol pollution. Atmos. Chem. Phys. 2017, 17, 3097–3110. [Google Scholar] [CrossRef]
- Wang, D.; Qu, W.; Zhang, X.; Sheng, L. Observation of atmospheric PM2.5 and PM10 at a coastal site, Qingdao, China. J. Xi′an Univ. Arch. Tech. 2010, 42, 87–92. [Google Scholar]
- Chen, X.; Feng, Y.; Li, J.; Lin, W.; Fan, S.; Wang, A.; Fong, S.; Lin, H. Numerical Simulations on the Effect of Sea-Land Breezes on Atmospheric Haze over the Pearl River Delta Region. Environ. Model. Assess. 2009, 14, 351–363. [Google Scholar]
- Zhang, X.Y.; Wang, Y.Q.; Niu, T.; Zhang, X.C.; Gong, S.L.; Zhang, Y.M.; Sun, J.Y. Atmospheric aerosol compositions in China: Spatial/temporal variability, chemical signature, regional haze distribution and comparisons with global aerosols. Atmos. Chem. Phys. 2012, 12, 779–799. [Google Scholar] [CrossRef]
- Ma, Y.; Gao, R.; Miao, S.; Huang, R. Impacts of urbanization on summer-time sea-land breeze circulation in Qingdao. Acta Sci. Circumstantiae 2013, 33, 1690–1696. [Google Scholar]
- Liu, R.; Han, Z.; Wu, J.; Hu, Y.; Li, J. The impacts of urban surface characteristics on radiation balance and meteorological variables in the boundary layer around Beijing in summertime. Atmos. Res. 2017, 197, 167–176. [Google Scholar] [CrossRef]
- Morini, E.; Touchaei, A.G.; Rossi, F.; Cotana, F.; Akbari, H. Evaluation of albedo enhancement to mitigate impacts of urban heat island in Rome (Italy) using WRF meteorological model. Urban Clim. 2018, 24, 551–566. [Google Scholar] [CrossRef]
- Solecki, W.D.; Rosenzweig, C.; Parshall, L.; Pope, G.; Clark, M.; Cox, J.; Wiencke, M. Mitigation of the heat island effect in urban New Jersey. Environ. Hazards 2005, 6, 39–49. [Google Scholar] [CrossRef]
- Kanda, M. Progress in Urban Meteorology: A Review. J. Meteorol. Soc. Jpn. 2007, 85, 363–383. [Google Scholar] [CrossRef]
- Peng, Z.; Hu, F. A study of the influence of urbanization of Beijing on the boundary wind structure. Chin. J. Geophys. 2006, 49, 1608–1615. [Google Scholar]
- Zhang, Y.; Miao, S.; Dai, Y.; Liu, Y. Numerical simulation of characteristics of summer clear day boundary layer in Beijing and the impact of urban underlying surface on sea breeze. Chin. J. Geophys. 2013, 56, 2558–2573. [Google Scholar]
- Miao, Y.; Liu, S.; Zheng, Y.; Wang, S.; Chen, B. Numerical Study of the Effects of Topography and Urbanization on the Local Atmospheric Circulations over the Beijing-Tianjin-Hebei, China. Adv. Meteorol. 2015, 2015, 1–16. [Google Scholar] [CrossRef]
- Du, Y.; Xie, Z.; Zeng, Y.; Shi, Y.; Wu, J. Impact of urban expansion on regional tempera-ture change in the Yangtze River Delta. J. Geogr. Sci. 2007, 17, 387–398. [Google Scholar] [CrossRef]
- Zhang, N.; Gao, Z.; Wang, X.; Chen, Y. Modeling the impact of urbanization on the local and regional climate in Yangtze River Delta, China. Theor. Appl. Climatol. 2010, 102, 331–342. [Google Scholar] [CrossRef]
- Miao, M.; Tang, Y. Interaction Between Sea and Land Breeze and Heat Island Circulation During The Summer Over the Delta Region of the Yangtze River and Urbanization Effect on Climate. Plateau Meteorol. 1998, 17, 280–289. [Google Scholar]
- Lo, J.C.F.; Lau, A.K.H.; Chen, F.; Fung, J.C.H.; Leung, K.K.M. Urban Modification in a Mesoscale Model and the Effects on the Local Circulation in the Pearl River Delta Region. J. Appl. Meteorol. Climatol. 2007, 46, 457–476. [Google Scholar] [CrossRef]
- Ding, X. Research On Environmental Changes in Shandong Peninsula Coastal Zone Based On RS. Master’s Thesis, Ocean University of China, Qingdao, China, May 2012. [Google Scholar]
- Xu, N.; Gong, P. Significant coastline changes in China during 1991–2015 tracked by Landsat data. Sci. Bull. 2018, 63, 883–886. [Google Scholar] [CrossRef]
- Gilliam, R.C.; Roman, S.; Niyogi, D.D.S. Observational and Numerical Study on the Influence of Large-Scale Flow Direction and Coastline Shape on Sea-Breeze Evolution. Boundary Layer Meteorol. 2004, 111, 275–300. [Google Scholar] [CrossRef]
- Skamarock, W.C.; Klemp, J.B.; Dudhia, J.; Gill, D.O.; Barker, D.M.; Duda, M.G.; Huang, X.Y.; Wang, W.; Power, J.G. A Description of the Advanced Research WRF Version 3. NCAR Tech. Note NCAR/TN-475+STR; National Center for Atmospheric Research: Boulder, CO, USA, 2008. [Google Scholar]
- Miao, Y.; Liu, S.; Chen, B.; Zhang, B.; Wang, S.; Li, S. Simulating urban flow and dispersion in Beijing by coupling a CFD model with the WRF model. Adv. Atmos. Sci. 2013, 30, 1663–1678. [Google Scholar] [CrossRef]
- Zheng, Y.; Miao, Y.; Liu, S.; Chen, B.; Zheng, H.; Wang, S. Simulating Flow and Dispersion by Using WRF-CFD Coupled Model in a Built-Up Area of Shenyang, China. Adv. Meteorol. 2015, 2015, 1–15. [Google Scholar] [CrossRef]
- Hu, X.; Xue, M. Influence of Synoptic Sea-Breeze Fronts on the Urban Heat Island Intensity in Dallas-Fort Worth, Texas. Mon. Weather Rev. 2016, 144, 1487–1507. [Google Scholar] [CrossRef]
- Noh, Y.; Cheon, W.G.; Hong, S.Y.; Raasch, S. Improvement of the K-profile model for the planetary boundary layer based on large eddy simulation data. Boundary Layer Meteorol. 2003, 107, 401–427. [Google Scholar] [CrossRef]
- Hong, S.Y.; Noh, Y.; Dudhia, J. A new vertical diffusion package with an explicit treatment of entrainment processes. Mon. Weather Rev. 2006, 134, 2318–2341. [Google Scholar] [CrossRef]
- Zheng, Y.; Liu, S.; Miao, Y.; Wang, S. Effects of different topographic correction methods on the simulation of surface wind speed and temperature in parameterization scheme of the YSU boundary layer. Chin. J. Geophys. 2016, 59, 803–815. [Google Scholar]
- Kain, J.S. The Kain-Fritsch convective parameterization: An update. J. Appl. Meteorol. 2004, 43, 170–181. [Google Scholar] [CrossRef]
- Chen, F.; Kusaka, H.; Bornstein, R.; Ching, J.; Grimmond, C.S.B.; Grossman-Clarke, S.; Loridan, T.; Manning, K.W.; Martilli, A.; Miao, S.; et al. The integrated WRF/urban modelling system: Development, evaluation, and applications to urban environmental problems. Int. J. Climatol. 2011, 31, 273–288. [Google Scholar] [CrossRef]
- National Centers for Environmental Prediction/National Weather Service/NOAA/U.S. Department of Commerce. 2000, Updated Daily. NCEP FNL Operational Model Global Tropospheric Analyses, Continuing from July 1999; Research Data Archive at the National Center for Atmospheric Research, Computational and Information Systems Laboratory. Available online: https://doi.org/10.5065/D6M043C6 (accessed on 14 July 2017).
- Miao, Y.; Hu, X.; Liu, S.; Qian, T.; Xue, M.; Zheng, S.; Wang, S. Seasonal variation of local atmospheric circulations and boundary layer structure in the Beijing-Tianjin-Hebei region and implications for air quality. J. Adv. Model. Earth Syst. 2015, 7, 1602–1626. [Google Scholar] [CrossRef]
- Miao, Y.; Guo, J.; Liu, S.; Liu, H.; Zhang, G.; Yan, Y.; He, J. Relay transport of aerosols to Beijing-Tianjin-Hebei region by multi-scale atmospheric circulations. Atmos. Environ. 2017, 165, 35–45. [Google Scholar] [CrossRef]
Figure 1.
(a) The simulation area and (b) the topography of the innermost domain.
Figure 1.
(a) The simulation area and (b) the topography of the innermost domain.
Figure 2.
Land-use category of the innermost domain for thee (a) Control experiment (CTL), (b) Urban experiment (EXP_U) and (c) Coastline experiment (EXP_C). The black circles represent station sites.
Figure 2.
Land-use category of the innermost domain for thee (a) Control experiment (CTL), (b) Urban experiment (EXP_U) and (c) Coastline experiment (EXP_C). The black circles represent station sites.
Figure 3.
The changes in the underlying surface in Qingdao. The gray area represents the urban underlying surface given by USGS data; the green area represents the urbanization area; and the brown area represents the coastal change. The numbers 1 to 6 indicate the position of Aoshan Bay, Laoshan, Nvgukou, Jiaozhou Bay, Xuejia Island and Guzhenkou Bay. The blue, red and yellow circles represent the position of Jimo station, Licang station and Shinan station, respectively.
Figure 4.
The 850-hPa geopotential height field (color graphic) and wind field (reanalysis data) at (a) 8:00 BJT and (b) 20:00 BJT on 23 August 2016.
Figure 4.
The 850-hPa geopotential height field (color graphic) and wind field (reanalysis data) at (a) 8:00 BJT and (b) 20:00 BJT on 23 August 2016.
Figure 5.
The time series of (a) observed 10 m wind vector, (b) simulated 10 m wind vector, (c) 2 m air temperature and (d) 2 m relative humidity. The black lines and blue arrows represent the measured values, and gray shadows represent the uncertainty range (mean ± 1 standard deviation). The blue lines and blue arrows represent simulation results of CTL run.
Figure 6.
Time series of 10 m V-component in Qingdao derived from CTL run. The red line represents the Jimo station (JM), the blue line represents the Licang station (LC), and the black line represents the Shinan station (SN).
Figure 6.
Time series of 10 m V-component in Qingdao derived from CTL run. The red line represents the Jimo station (JM), the blue line represents the Licang station (LC), and the black line represents the Shinan station (SN).
Figure 7.
Time series of urban heat island (UHI) intensity in Qingdao. The black line represents the observed value. The blue line represents the simulated value.
Figure 7.
Time series of urban heat island (UHI) intensity in Qingdao. The black line represents the observed value. The blue line represents the simulated value.
Figure 8.
The scatter plots of (a) 2 m air temperature, (b) 2 m relative humidity, (c) 10 m U-component and (d) 10 m V-component observed and CTL experiment values. The solid line in red is a 1:1 ratio line. The correlation coefficients (R) are shown in each panel.
Figure 8.
The scatter plots of (a) 2 m air temperature, (b) 2 m relative humidity, (c) 10 m U-component and (d) 10 m V-component observed and CTL experiment values. The solid line in red is a 1:1 ratio line. The correlation coefficients (R) are shown in each panel.
Figure 9.
Spatial distribution of 2 m air temperature (left panels) and 2 m relative humidity (right panels) at (a,d) 08:00 BJT, (b,e) 14:00 BJT and (c,f) 20:00 BJT on 23 August simulated by the CTL experiment. Observations from the weather station data are overlaid using colored circles.
Figure 9.
Spatial distribution of 2 m air temperature (left panels) and 2 m relative humidity (right panels) at (a,d) 08:00 BJT, (b,e) 14:00 BJT and (c,f) 20:00 BJT on 23 August simulated by the CTL experiment. Observations from the weather station data are overlaid using colored circles.
Figure 10.
Spatial distribution of 2 m perturbation temperature (left panels) and 200 m divergence (right panels) at (
a,e) 3:00 BJT, (
b,f) 12:00 BJT, (
c,g) 17:00 BJT and (
d,h) 20:00 BJT. The perturbation temperature is the value subtracted from the daily mean. The solid line in (
e) indicated the route of the vertical cross section in
Figure 11.
Figure 11.
Vertical sections of air temperature (left panels) and relative humidity (right panels) in the CTL experiment at (
a,e) 3:00 BJT, (
b,f) 12:00 BJT, (
c,g) 17:00 BJT and (
d,h) 20:00 BJT. The location of the cross section is marked in
Figure 10e.
Figure 11.
Vertical sections of air temperature (left panels) and relative humidity (right panels) in the CTL experiment at (
a,e) 3:00 BJT, (
b,f) 12:00 BJT, (
c,g) 17:00 BJT and (
d,h) 20:00 BJT. The location of the cross section is marked in
Figure 10e.
Figure 12.
Time series of 10 m V-component at (a) Shinan station (b) Jimo station. The black line denotes the values of CTL experiment, and the values of EXP_U experiment are in blue.
Figure 12.
Time series of 10 m V-component at (a) Shinan station (b) Jimo station. The black line denotes the values of CTL experiment, and the values of EXP_U experiment are in blue.
Figure 13.
Vertical sections of vertical velocity in the EXP_U experiment at (
a) 12:00 BJT and (
b) 17:00 BJT. The location of the cross section is marked in
Figure 10e.
Figure 13.
Vertical sections of vertical velocity in the EXP_U experiment at (
a) 12:00 BJT and (
b) 17:00 BJT. The location of the cross section is marked in
Figure 10e.
Figure 14.
Spatial distribution of 2 m air temperature and 10 m wind in (a) EXP_U, (c) CTL-EXP_U at 12:00 BJT, (b) EXP_U and (d) CTL-EXP_U at 17:00 BJT.
Figure 14.
Spatial distribution of 2 m air temperature and 10 m wind in (a) EXP_U, (c) CTL-EXP_U at 12:00 BJT, (b) EXP_U and (d) CTL-EXP_U at 17:00 BJT.
Figure 15.
Time series of 10 m V-component at (a) Licang station and (b) Jimo station. The black line represents the values of CTL experiment, and the values of EXP_C experiment are in blue.
Figure 15.
Time series of 10 m V-component at (a) Licang station and (b) Jimo station. The black line represents the values of CTL experiment, and the values of EXP_C experiment are in blue.
Figure 16.
Vertical section of vertical velocity in the EXP_C experiment at (
a) 12:00 BJT, (
b) 17:00 BJT. The location of the cross section is marked in
Figure 10e.
Figure 16.
Vertical section of vertical velocity in the EXP_C experiment at (
a) 12:00 BJT, (
b) 17:00 BJT. The location of the cross section is marked in
Figure 10e.
Figure 17.
Spatial distribution of 2 m air temperature and 10 m wind in (a) EXP_C, (c) CTL-EXP_C at 12:00 BJT, (b) EXP_C and (d) CTL-EXP_C at 17:00 BJT.
Figure 17.
Spatial distribution of 2 m air temperature and 10 m wind in (a) EXP_C, (c) CTL-EXP_C at 12:00 BJT, (b) EXP_C and (d) CTL-EXP_C at 17:00 BJT.
Figure 18.
Time series of 10 m V-component at Jimo station on 23 August 2006. The black line represents the values of CTL experiment, and the blue line denotes the values of EXP_C experiment.
Figure 18.
Time series of 10 m V-component at Jimo station on 23 August 2006. The black line represents the values of CTL experiment, and the blue line denotes the values of EXP_C experiment.
Table 1.
Domain configurations and physics parameterization schemes used in the Weather Research and Forecasting (WRF) model simulations.
Table 1.
Domain configurations and physics parameterization schemes used in the Weather Research and Forecasting (WRF) model simulations.
| Parameter | Configurations |
|---|
| Domain dimensions | 100 × 100, 101 × 101, 101 × 101 |
| Horizontal resolutions | 25 km, 5 km, 1 km |
| Vertical layers | 30 |
| Microphysics scheme | Ferrier new Eta scheme |
| Cumulus scheme | Kain-Fritsch scheme for the outermost domain |
| Planetary Boundary Layer (PBL) scheme | Yonsei University (YSU) scheme |
| Land surface scheme | Noah Land Surface Model (LSM) with Urban Canopy Model (UCM) |
Table 2.
Land Use Categories of MODIS and USGS data. The USGS categories are grouped into 20 types, according to the similar category of MODIS data.
Table 2.
Land Use Categories of MODIS and USGS data. The USGS categories are grouped into 20 types, according to the similar category of MODIS data.
| MODIS Category | Land Use Description | USGS Category | Land Use Description |
|---|
| 1 | Evergreen Needleleaf Forest | 14 | Evergreen Needleleaf |
| 2 | Evergreen Broadleaf Forest | 13 | Evergreen Broadleaf |
| 3 | Deciduous Needleleaf Forest | 12 | Deciduous Needleleaf Forest |
| 4 | Deciduous Broadleaf Forest | 11 | Deciduous Broadleaf Forest |
| 5 | Mixed Forests | 15 | Mixed Forest |
| 6 | Closed Shrublands | 9 | Mixed Shrubland/Grassland |
| 7 | Open Shrublands | 8 | Shrubland |
| 8 | Woody Savannas | | |
| 9 | Savannas | 10 | Savanna |
| 10 | Grasslands | 7 | Grassland |
| 11 | Permanent Wetlands | 17 | Herbaceous Wetland |
| 18 | Wooden Wetland |
| 12 | Croplands | 2 | Dryland Cropland and Pasture |
| 3 | Irrigated Cropland and Pasture |
| 4 | Mixed Dryland/Irrigated Cropland and Pasture |
| 13 | Urban and Built-Up | 1 | Urban and Built-up Land |
| 14 | Cropland/Natural Vegetation | 5 | Cropland/Grassland Mosaic |
| 6 | Cropland/Woodland Mosaic |
| 15 | Snow and Ice | 24 | Snow or Ice |
| 16 | Barren or Sparsely Vegetated | 19 | Barren or Sparsely Vegetated |
| 17 | Water | 16 | Water Bodies |
| 18 | Wooded Tundra | 21 | Wooded Tundra |
| 19 | Mixed Tundra | 22 | Mixed Tundra |
| 23 | Bare Ground Tundra |
| 20 | Barren Tundra | 20 | Herbaceous Tundra |
© 2018 by the authors. Licensee MDPI, Basel, Switzerland. This article is an open access article distributed under the terms and conditions of the Creative Commons Attribution (CC BY) license (http://creativecommons.org/licenses/by/4.0/).


