1. Introduction
Polarimetric radar (PR) can provide both backscatter and differential propagation phase information; therefore, this type of radar has significant advantages over single polarization radar. One of the advantages of PR is quantitative precipitation estimation (QPE) by using the PR variables. Previous studies have shown that polarimetric precipitation estimation (PPE) techniques are more robust with respect to drop size distribution (DSD) variations and the presence of hail than are the conventional
Z–R relationship (here,
R is the radar rainfall rate and
Z is the radar-reflectivity factor) [
1,
2,
3,
4,
5]. However, DSD variability and hail contamination can still introduce QPE errors when only a single polarimetric variable is used in the PPE [
6]. To avoid large observational errors in
ZDR and
KDP at lower signal-to-noise ratios (SNRs) and to reduce the impact of DSD variability on the precipitation estimation, multiple relationships between polarimetric variables and rainfall (e.g.,
R(
ZH),
R(
ZH,
ZDR), and
R(
KDP)) are often used depending on the type of radar echo. By combining the merits of these different relationships for various rain intensities, Ryzhkov et al. [
6] developed a “synthetic” algorithm that uses different combinations of radar variables depending on the rain rate estimates by using the conventional
Z–R relationship; their synthetic algorithm was evaluated during the 2002–2003 JPOLE experiment conducted in Oklahoma. Cifelli et al. [
7] developed a synthetic algorithm based on the thresholds of
ZH,
ZDR, and
KDP and this algorithm was tested on the Colorado State University (CSU)–CHILL radar.
Although relationships between
R and polarimetric variables are less prone to DSD variability, they must still be modified according to DSD data in different regions owing to cloud and precipitation microphysical processes that are regionally dependent [
6,
8,
9,
10]. Even in the same region, DSD can vary in terms of precipitation type (e.g., stratus clouds or convective clouds) and rainfall rate. Wu and Liu [
11] statistically analyzed the DSD
–R relationship in the Tibetan Plateau and in Southern China and found that DSD varies significantly with
R. Wu et al. [
12] and Zhang et al. [
13] suggest that
Z–R relationships derived from the DSD vary significantly with
R even for one rainfall event. Despite many attempts to change the
Z–R relationship in real time to improve QPE accuracy, the QPE performance remains unsatisfactory for heavy rain [
13,
14,
15].
QPE for heavy rainfall is a challenge we may meet. Another challenge is the estimation of rain mixed with hail. Conventional radar rainfall estimates that were obtained from
Z–R relationships deteriorate in the presence of mixed-phase and frozen hydrometeors. The
R(
ZH,
ZDR) relationship is less prone to DSD variability but is not immune to hail contamination. Rainfall algorithms based on
KDP are more robust in the presence of hail but are not optimal for light rain in the S-band [
16,
17]. Wang et al. [
18] attempted to use
HDR to determine a hail region and then estimate the liquid precipitation in the associated rain area. However, small mixtures of hail and rainfall are difficult to identify with radar reflectivity alone. Misidentification of rain and precipitation ice often leads to poorly estimated rainfall and has important implications for flood forecasting [
7]. The challenges of high-plain meteorological environments have led to the development of an algorithm guided by the precipitation ice fraction in the radar volume. Golestani et al. [
19] developed the CSU–ICE optimization algorithm in which
ZDR is used to calculate the ice-fraction index, but unfortunately it performs poorly for 38 dBZ <
ZH < 45 dBZ [
7]. Therefore, a new rainfall algorithm was developed using hydrometeor identification (HID) to guide the choice of a particular QPE algorithm [
7]. Precipitation is classified as rain, mixture, and ice. Drizzle, moderate rain, and heavy rain are included in the rain category; the mixture category includes wet snow and a rain–hail mixture; and the ice category includes dry snow, graupel, and hail. QPE is conducted in a rain and mixture area.
Despite all the progress in polarimetric rainfall measurements, an algorithm that can resolve all these issues for any scenario does not exist. A synthetic algorithm that uses
ZH,
ZDR, and
KDP can theoretically capture the full range of local DSD variability. However, when the DSD characteristics become significantly different from previous characteristics, the QPE performance will be unpredictable. As a possible radar variable for rainfall estimation, specific attenuation (for horizontal polarization)
AH is more directly related to rain rate and liquid water content compared with
ZH, and it is immune to radar miscalibration, partial beam blockage, and impacts of wet radomes. Compared with algorithms based on
ZH,
ZDR, and
KDP, rainfall estimations utilizing
AH are less sensitive to DSD variations [
20,
21]. The use of
R(
AH) was originally X-band and C-band motivated, but it has applied to the S-band as well, which was verified by Ryzhkov [
22].
R(
AH) was first used for X-band radars during the NASA Iowa Flood Studies field campaign, and was found to have excellent performance [
23]. A new estimator
R(
AH,
ZDR) was proposed by Keenan [
24] for C-band estimation and proposed by Thurai et al. [
25] for X-band estimation, respectively. This has also been extended to S-band by Thomposon et al. [
26]. Even though these estimators only offer significant skill at S-band for
R(
AH) or at X band for
R(
AH,
ZDR), Thomposon et al. [
26] states that the utility of
R(
AH) or
R(
AH,
ZDR) provide the possibility of solving the problems discussed above.
In 2016, the new-generation S-band weather radar in Guangdong Province in China was updated to PR. On 6 May 2017, an extremely heavy rainfall event (here after this rainfall event) was observed in the low-latitude summer. During this heavy rainfall event, rain-gauge observations broke the historical record for 3-h rainfall accumulation in Guangdong and the historical record for single-day rainfall accumulation in Guangzhou City, in Guangdong Province. According to PR observations, hail and graupel melted completely and became liquid water before reaching the ground, thereby altering the DSD structure. Therefore, the QPE algorithm for this rainfall event should differ significantly from those used for previous events. The PPE performance must be examined for this extremely heavy rainfall.
So far, eight S-band PRs have been built in Guangdong Province. By 2020, more than 100 S-band PRs will be built or upgraded in China. The evaluation of PR capability to estimate rain, especially heavy rain, is an important avenue for future research. In this study, an operational QPE algorithm based on a local DSD and mixed-phase precipitation identification is proposed and applied to some rainfall events. This algorithm performs well for most rainfall events investigated in this study. However, rainfall characteristics of this event are so different from the conventional rainfall events occurred in Guangdong, in which hourly rainfall accumulations are less than 50 mm. The main motivation for this study is to analyze the PR capability for estimating severe precipitation, such as this rainfall event and to study the main factors affecting QPE. The performance of PPE and the possible reasons for biases in precipitation estimation (i.e., DSD variations, precipitation phase, and other factors) are analyzed in detail. The method to improve QPE performance on the basis of the reasons for QPE errors is also discussed in this study.
In
Section 2, we introduce the measurement instruments and analysis of the rainfall event. In
Section 3, we introduce our PPE algorithm, evaluation method, and the rain microphysics retrieval algorithm. In
Section 4, we analyze the performance of nine rainfall events and the extremely heavy rainfall event introduced in this study, respectively. In
Section 5, we explore possible reasons for biases in the precipitation estimation for this heavy rainstorm. In
Section 6, we improve the algorithm and verify its effect. Finally, in
Section 7, we present our conclusions.
2. Measurement Instruments and Rainfall Event
A heavy rainfall event occurred throughout Guangdong Province on 6 May 2017, and severe rain occurred in Guangzhou City during 1900–2400 UTC. The rainfall observed at many automatic weather stations (AWSs) broke historical records and caused numerous flooding disasters.
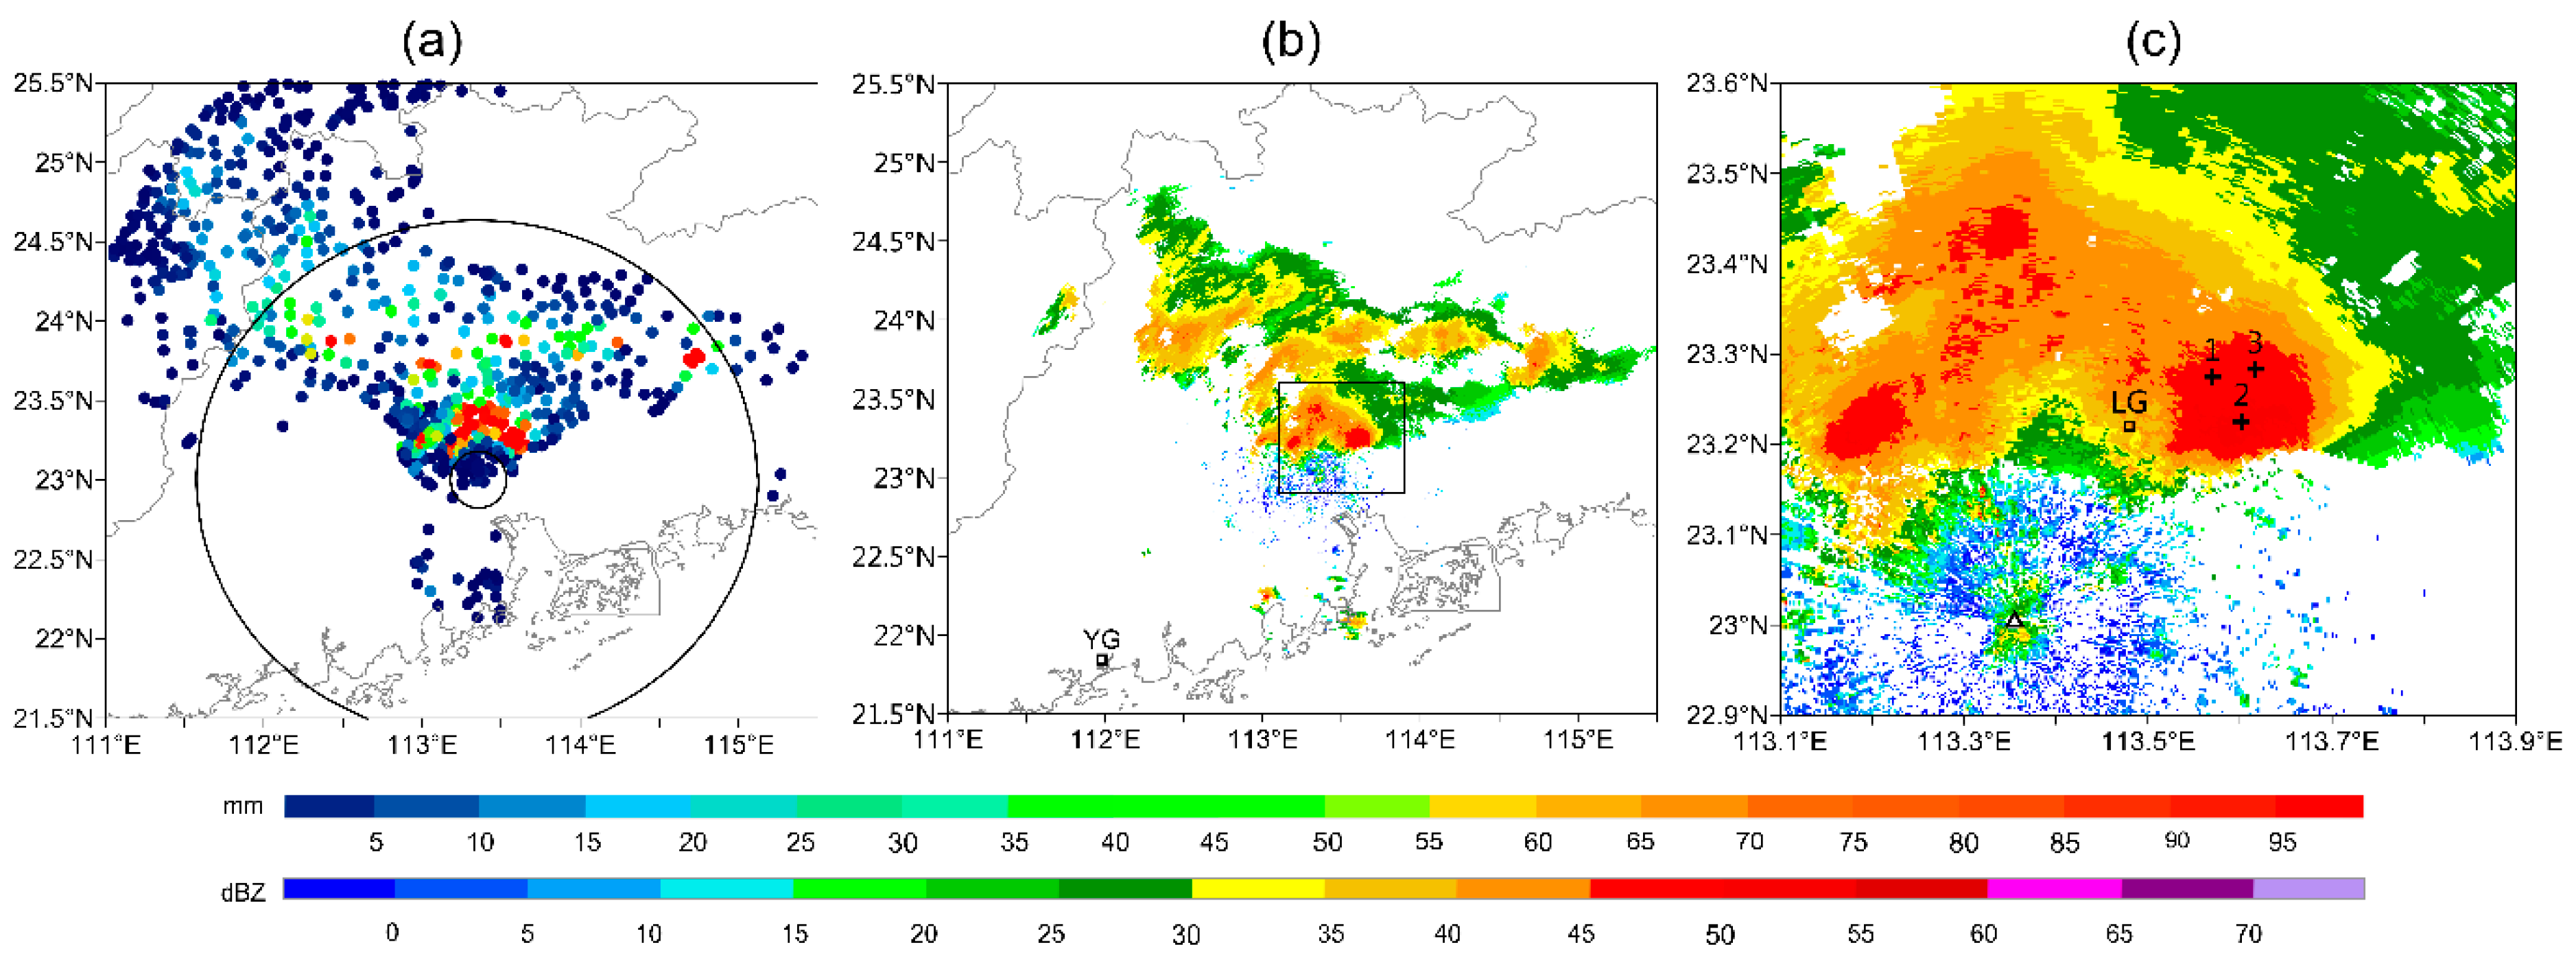
Figure 1a shows the distribution of total rainfall during 1900–2400 UTC based on AWS observations. During this period, 78, 38, and 3 AWSs observed rain accumulations in excess of 50, 100, and 300 mm, respectively. The maximum total rainfall was 401.6 mm (station 3 in
Figure 1c), whereas the maximum hourly rainfall accumulation was 184.4 mm (again station 3).
Figure 1b shows the average radar reflectivity for 1900–2400 UTC, and
Figure 1c shows the average reflectivity enlarged on a local scale. The average reflectivities exceeded 35 dBZ in many places, exceeding 45 dBZ in a narrow area near the radar station.
Figure 1a,b clearly show the relatively concentrated spatial and temporal distributions of heavy rain and strong echoes. The locations of those AWSs where the total rainfall exceeded 300 mm are marked with plus signs in
Figure 1c, along with the disdrometer (square) at Luogang and the S-band PR (triangle) at Guangzhou.
The laser disdrometer (produced by Beijing Metstar Radar Co., Ltd., Beijing, China) can measure the precipitation particle diameter and terminal fall velocity simultaneously. The particle diameter is divided into 64 classes ranging from 0.2 to 30 mm, and the velocity is divided into 32 classes ranging from 0.2 to 20 m/s. The temporal resolution is 1 min. Note that the disdrometer was not located in the area of heaviest precipitation.
Updated in 2016, the S-band PR deployed in Guangzhou can measure multiple polarimetric variables such as
ZH, ZDR, and Φ
DP (differential phase). The radar was calibrated in the factory according to the criterion proposed by China Meteorological Administration (CMA) [
27]. After radar construction, a series of tests, such as built-in testing, sun-calibration, and vertical pointed calibration were conducted by the Meteorological Observation Center of CMA. The results of the tests indicated that
ZH accuracy is better than 1 dB and
ZDR accuracy is better than 0.4 dB. The radar operates in the conventional VCP21 volume-scan mode and completes a volume scan using nine specific elevation angles (0.5°, 1.5°, 2.4°, 3.3°, 4.3°, 6.0°, 9.9°, 14.6°, and 19.5°) in 6 min, with a 0.95° beam width, a 0.25 km radial resolution and a 460 km maximum detection range.
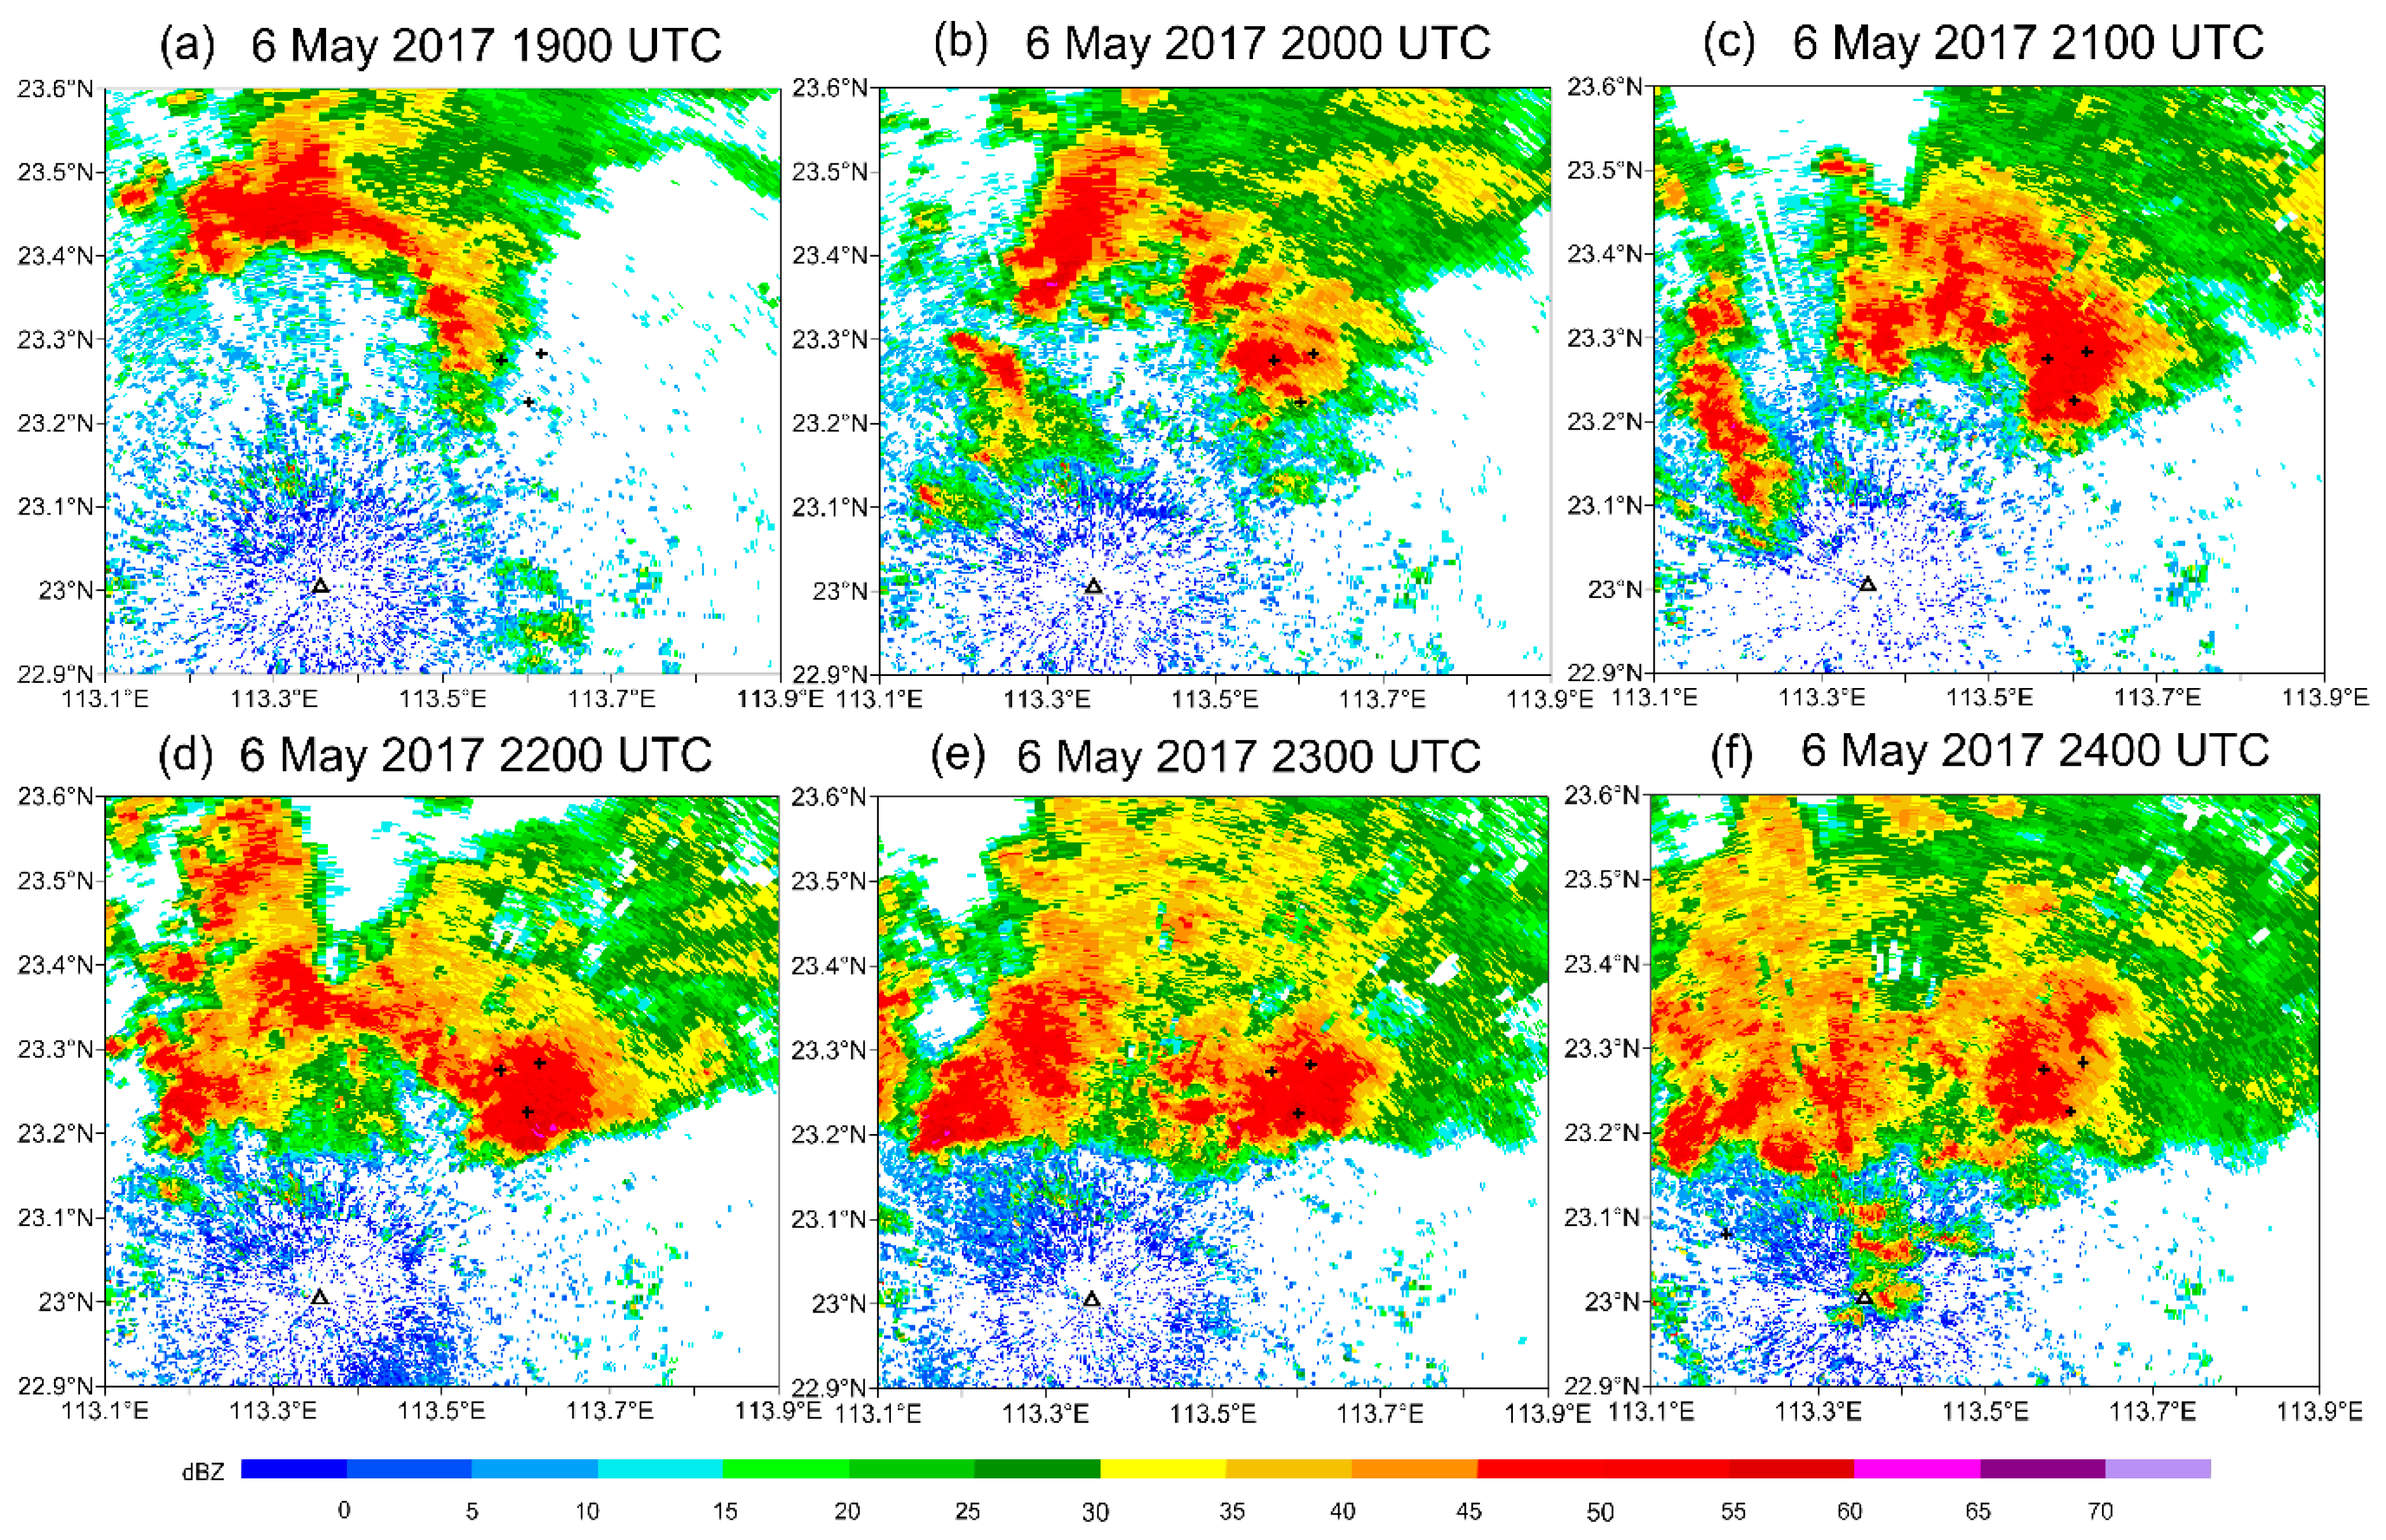
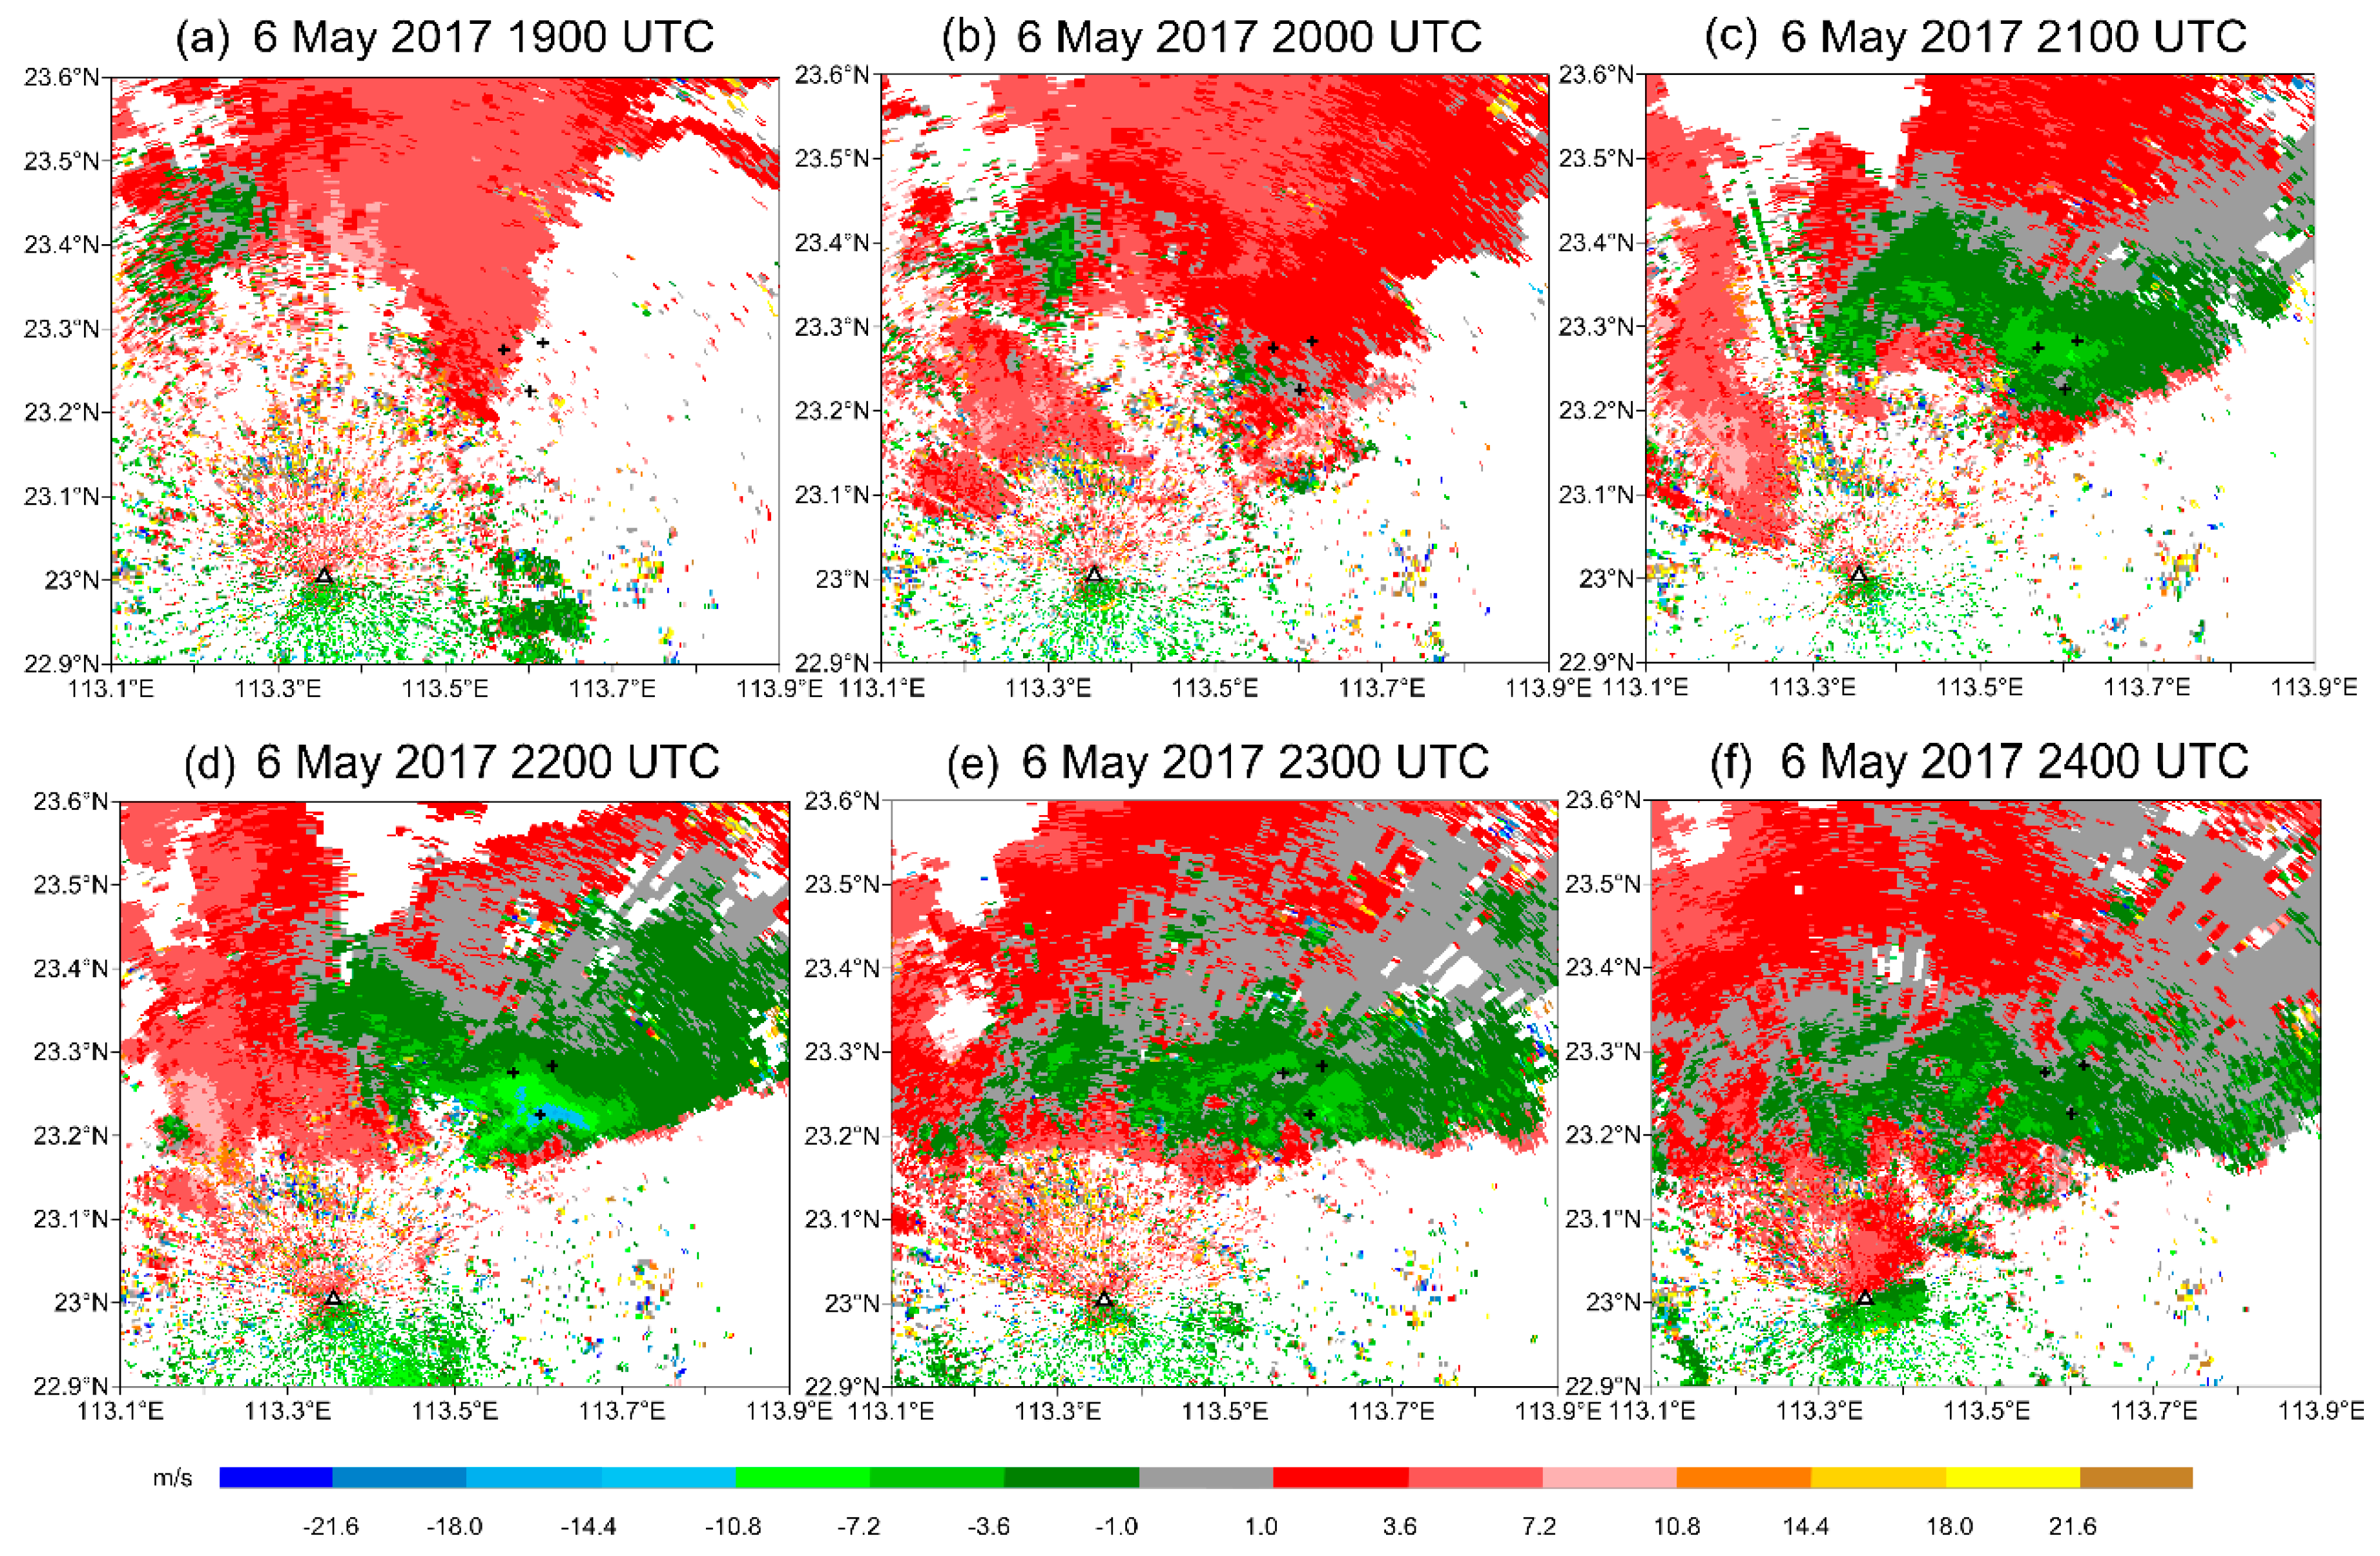
Figure 2 and
Figure 3 show the evolution of reflectivity and radial velocity at 0.5° elevation during 1900–2400 UTC. At 2000 UTC, strong echoes reached the three AWSs and developed rapidly. During 2000–2300 UTC, echoes larger than 50 dBZ remained there and changed little in reflectivity, location, and influence area. The radial velocities at 0.5° and 1.5° elevations (not shown) indicate that gradually intensifying northerly and southerly winds converged at around 560 m above the ground at 2000 UTC. The convergence area evolved gradually into a convergence belt and reached its maximum convergence at 2200 UTC, resulting in persistent ascending motion leading to persistent strong echoes and heavy rain.
6. The Improved Algorithm and Its Performance
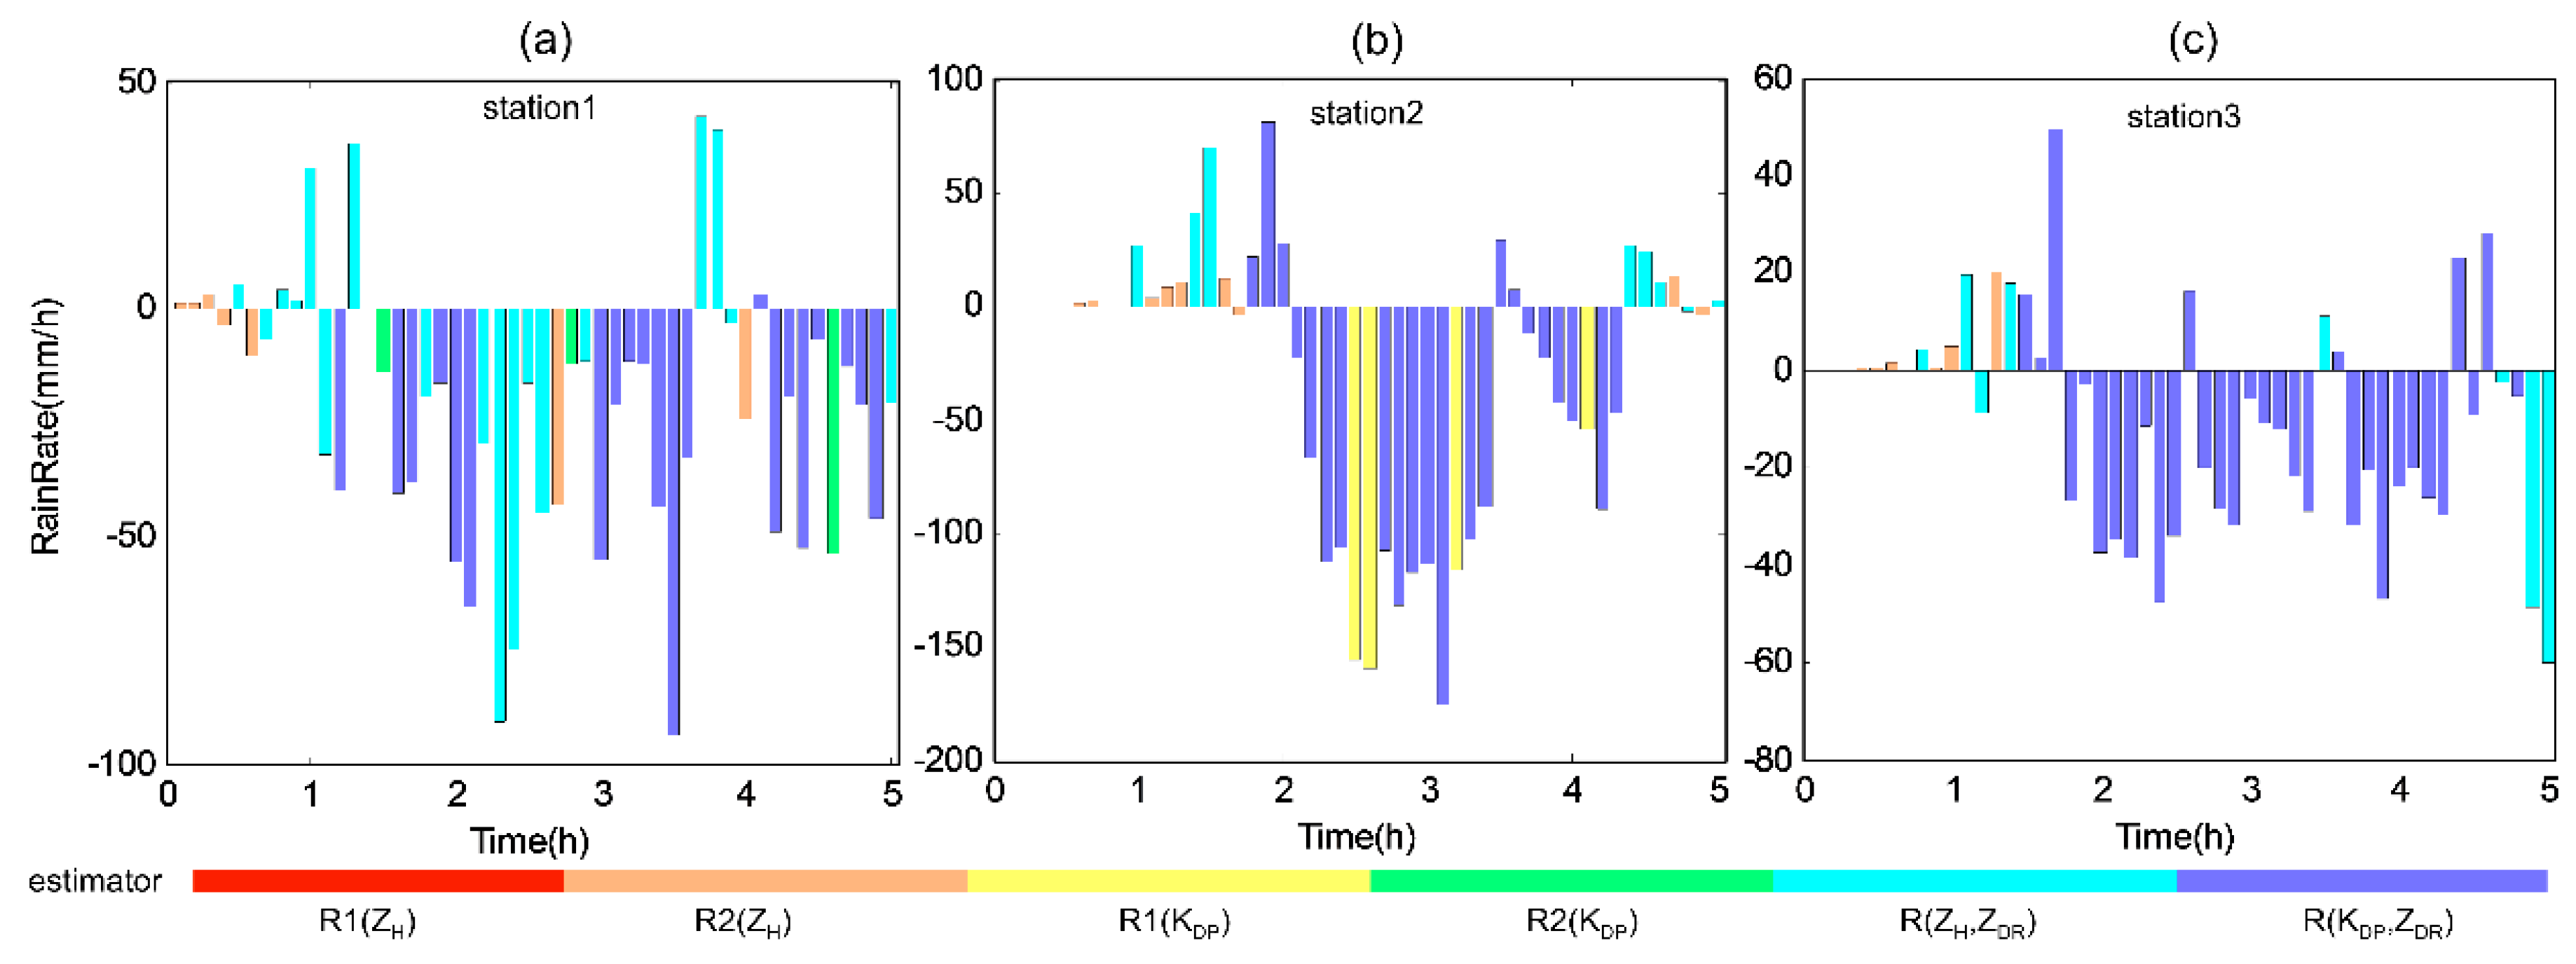
Analyses show that DSD characteristics in this rainfall event are significantly different from that of the average DSD in Yangjiang (estimators are derived from these DSD data), which is clearly evident at the three stations where the heaviest rainfall occurred.
R(
KDP,
ZDR) underestimates the rain rate most often at the three stations. It indicates
R(
KDP,
ZDR) is still sensitive to DSD variations when the extremely heavy rain occurs. In view of this problem, specific attenuation
AH is a good substitution variable for QPE. The low sensitivity of
R(
AH) relation to DSD variability is well known and pointed out by Atlas and Ulbrich [
20] and Matrosov [
21]. A method that using
Nw and
ZH to estimate
AH is used in this study [
22]. The relationship between x = log10(
ZH/
Nw) and
y = log10(
AH/
Nw) can be expressed as
where
at S-band and
t is temperature (°C). Equation (18) was obtained from long-term disdrometer data, as described by Ryzhkov [
22]. Ryzhkov [
22] considers
AH calculated from Equation (18) as the “true” value, and we use
ZH and
Nw derived from the radar data to calculate
AH according to Equation (18). First,
R-
AH relation is fitted by using R and
AH derived from Yangjiang DSD data with the least-squares method, which is expressed as
where
R is in mm/h and
AH is in dB km
–1. In the improved algorithm,
AH is derived from PR data and
R(
AH) replaces
R(
KDP,
ZDR) to estimate heavy rainfall.
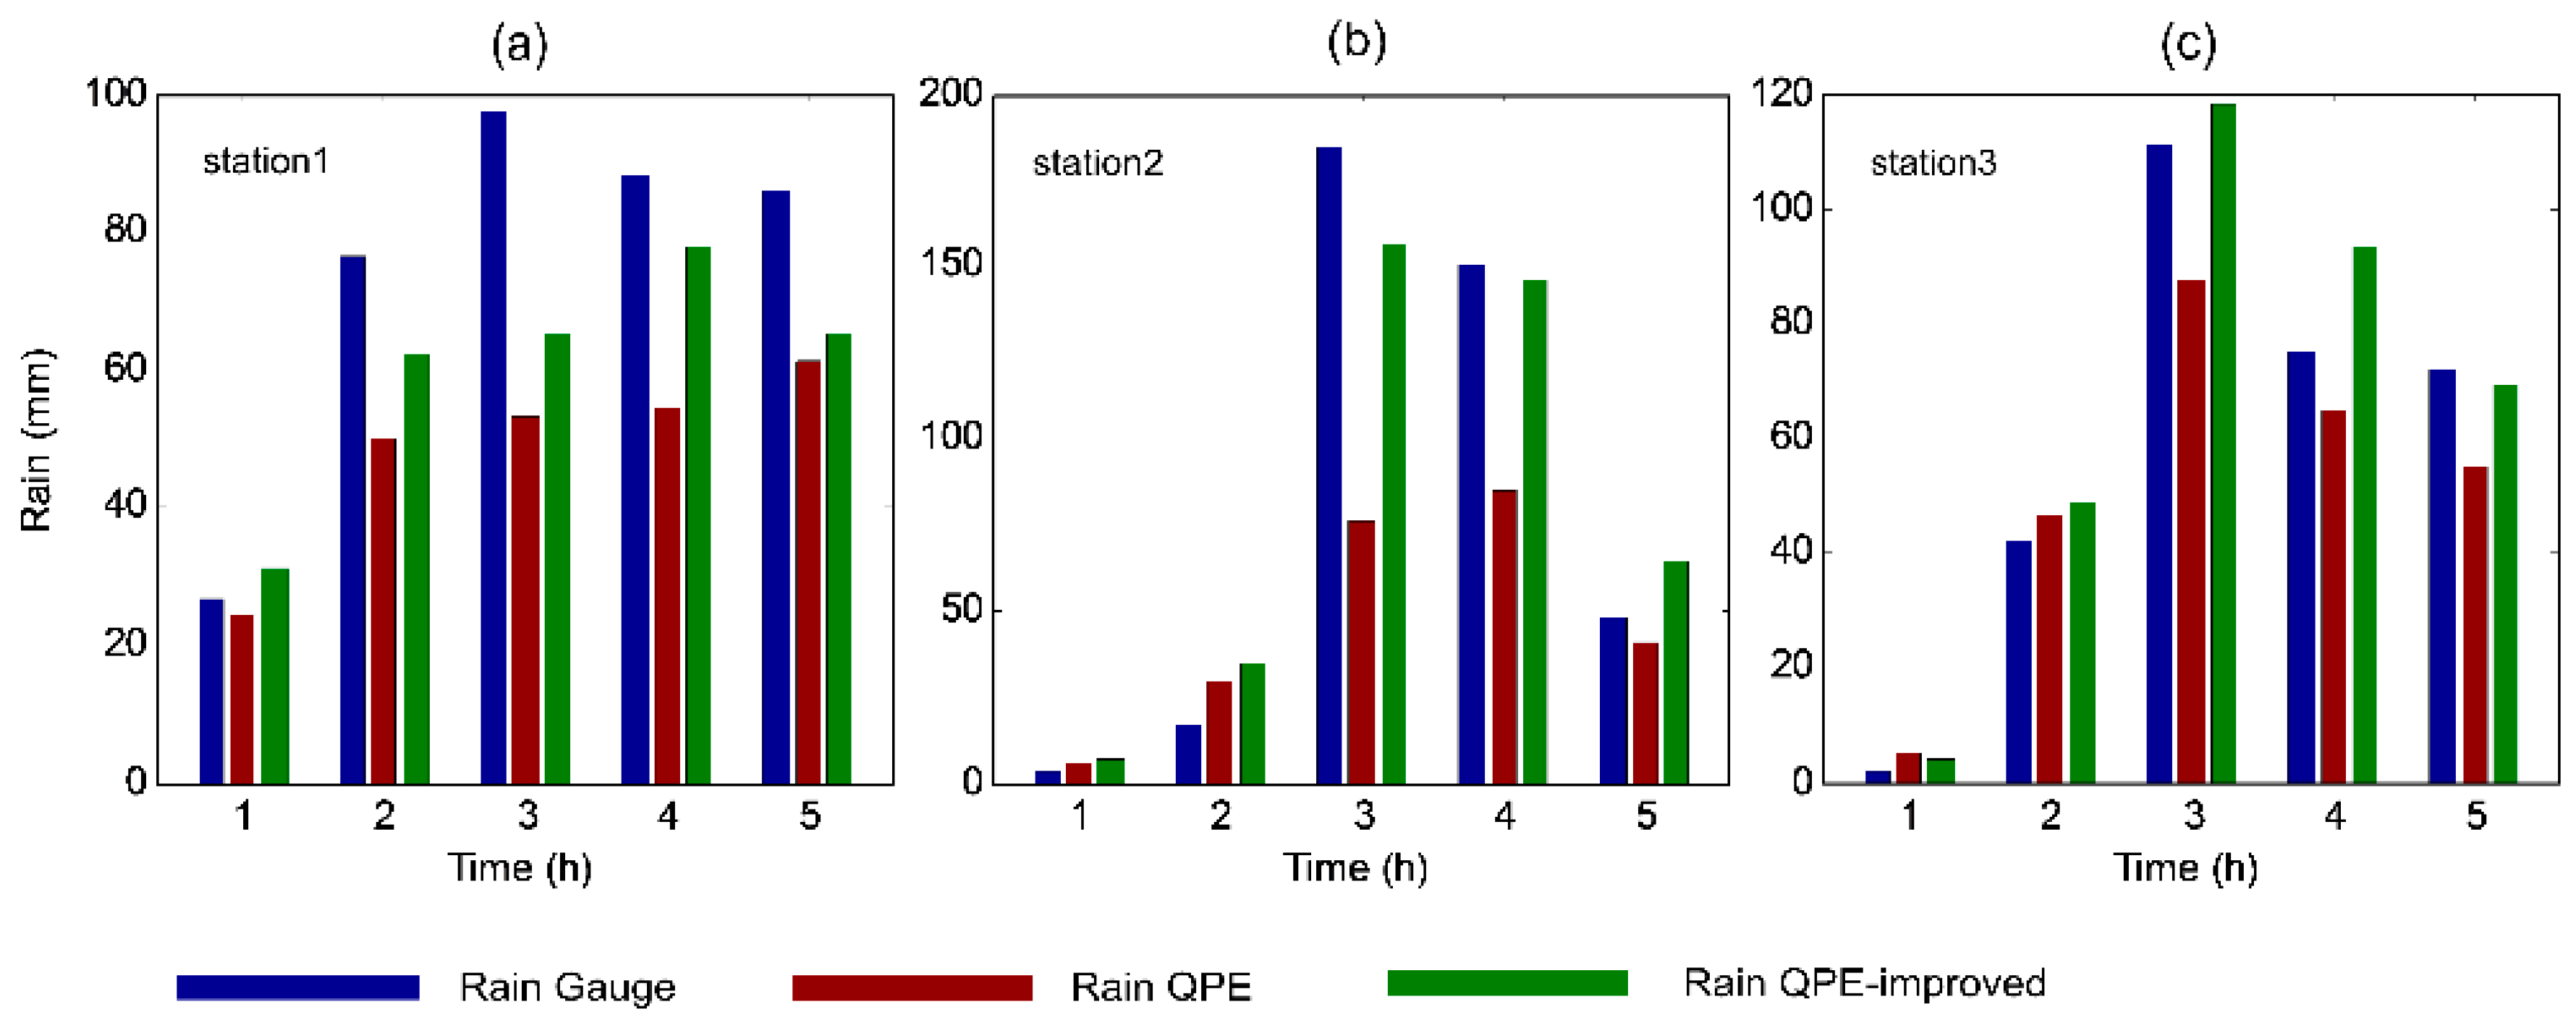
Table 6 lists the evaluated statistical scores for the QPE estimated by algorithm before and after improvement. The improved algorithm performs better for total rain in term of NB, which is close to 0. For heavy rain, the performance of the improved algorithm is much better than the previous algorithm in terms of all the statistical indicators. After the improvement, RMSE and NE decreased by 40.29% and 37.70%, respectively. In particular, Eff changes from −0.21 to 0.57, indicating that, the QPE is worse and significantly better than the mean value of rain observed before and after improvement, respectively.
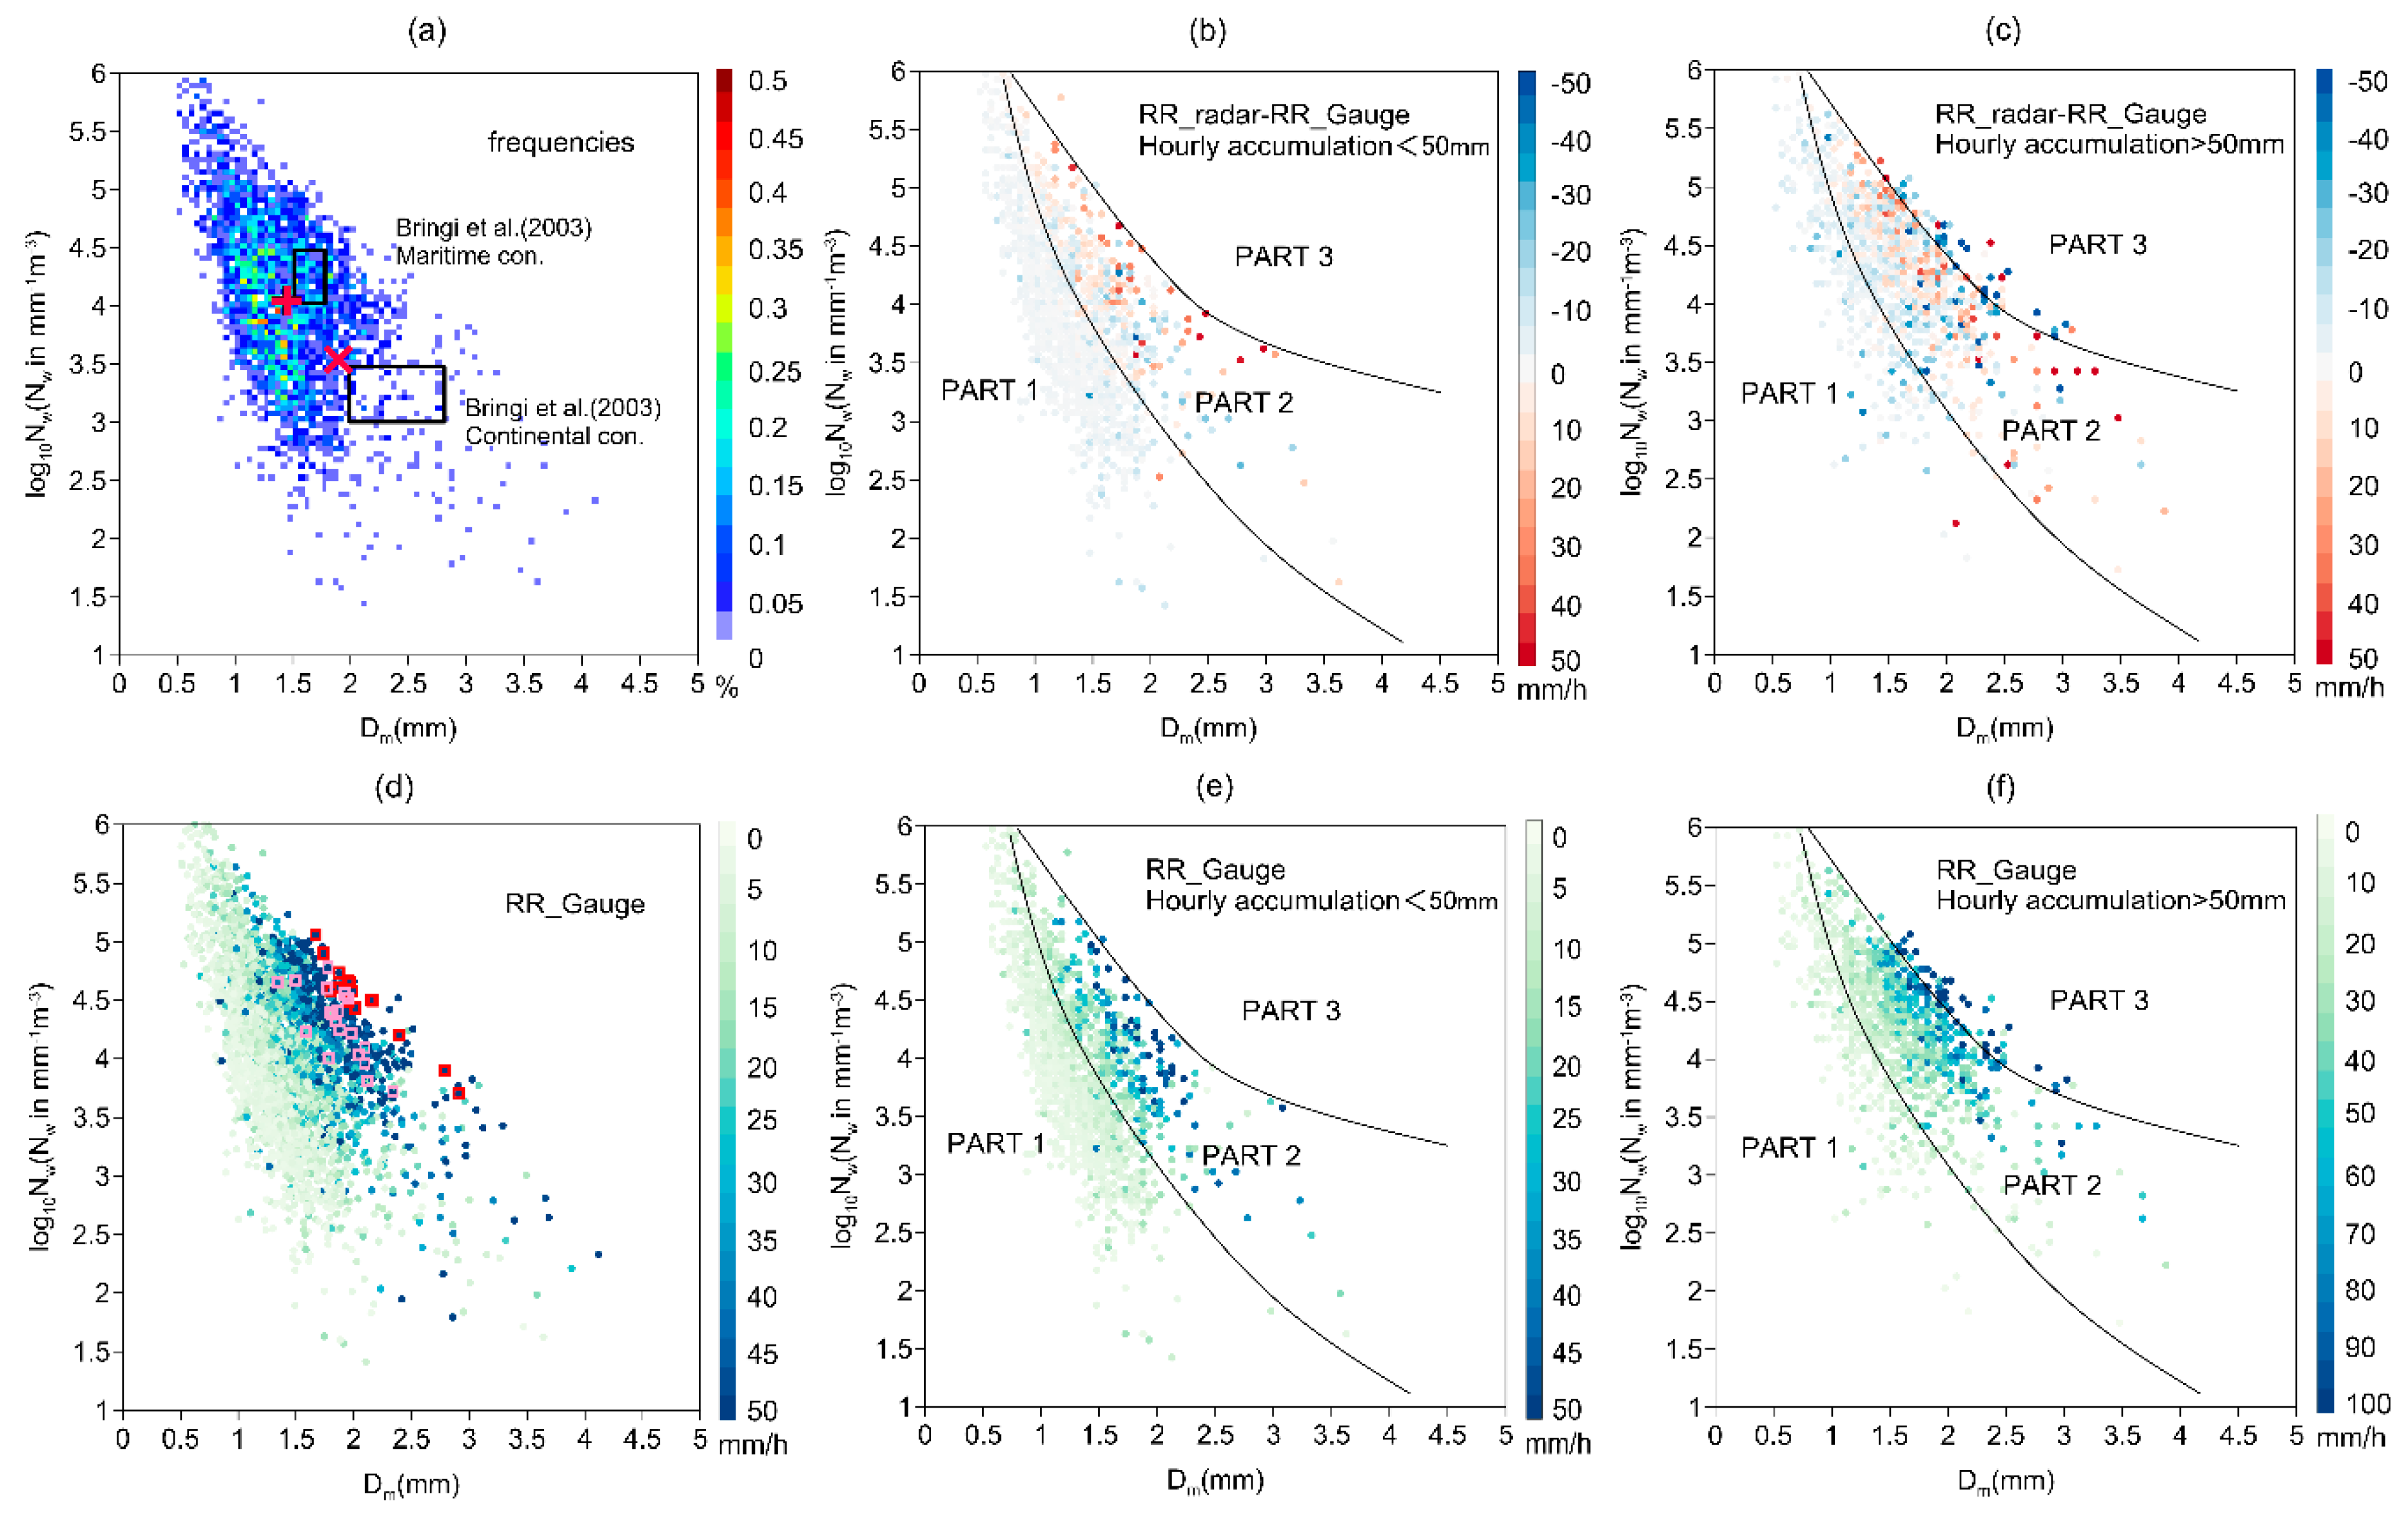
As shown in
Figure 12, most high rain rate data are distributed in the red circle. The extremely heavy rain data observed at the three stations and the data in part 3 (
Figure 9c) are also in the red circle. After algorithm improvement, NE corresponding to the heavy rain rate data decreased dramatically.
Figure 12b shows NE decreased percentage ((NE
before − NE
after)/NE
before × 100%) after algorithm improvement of log
10Nw versus
Dm. Most large value data are distributed in the red circle, which explains why NE decreased significantly when hourly accumulation was > 50 mm. The same situation occurred for RMSE (not shown).
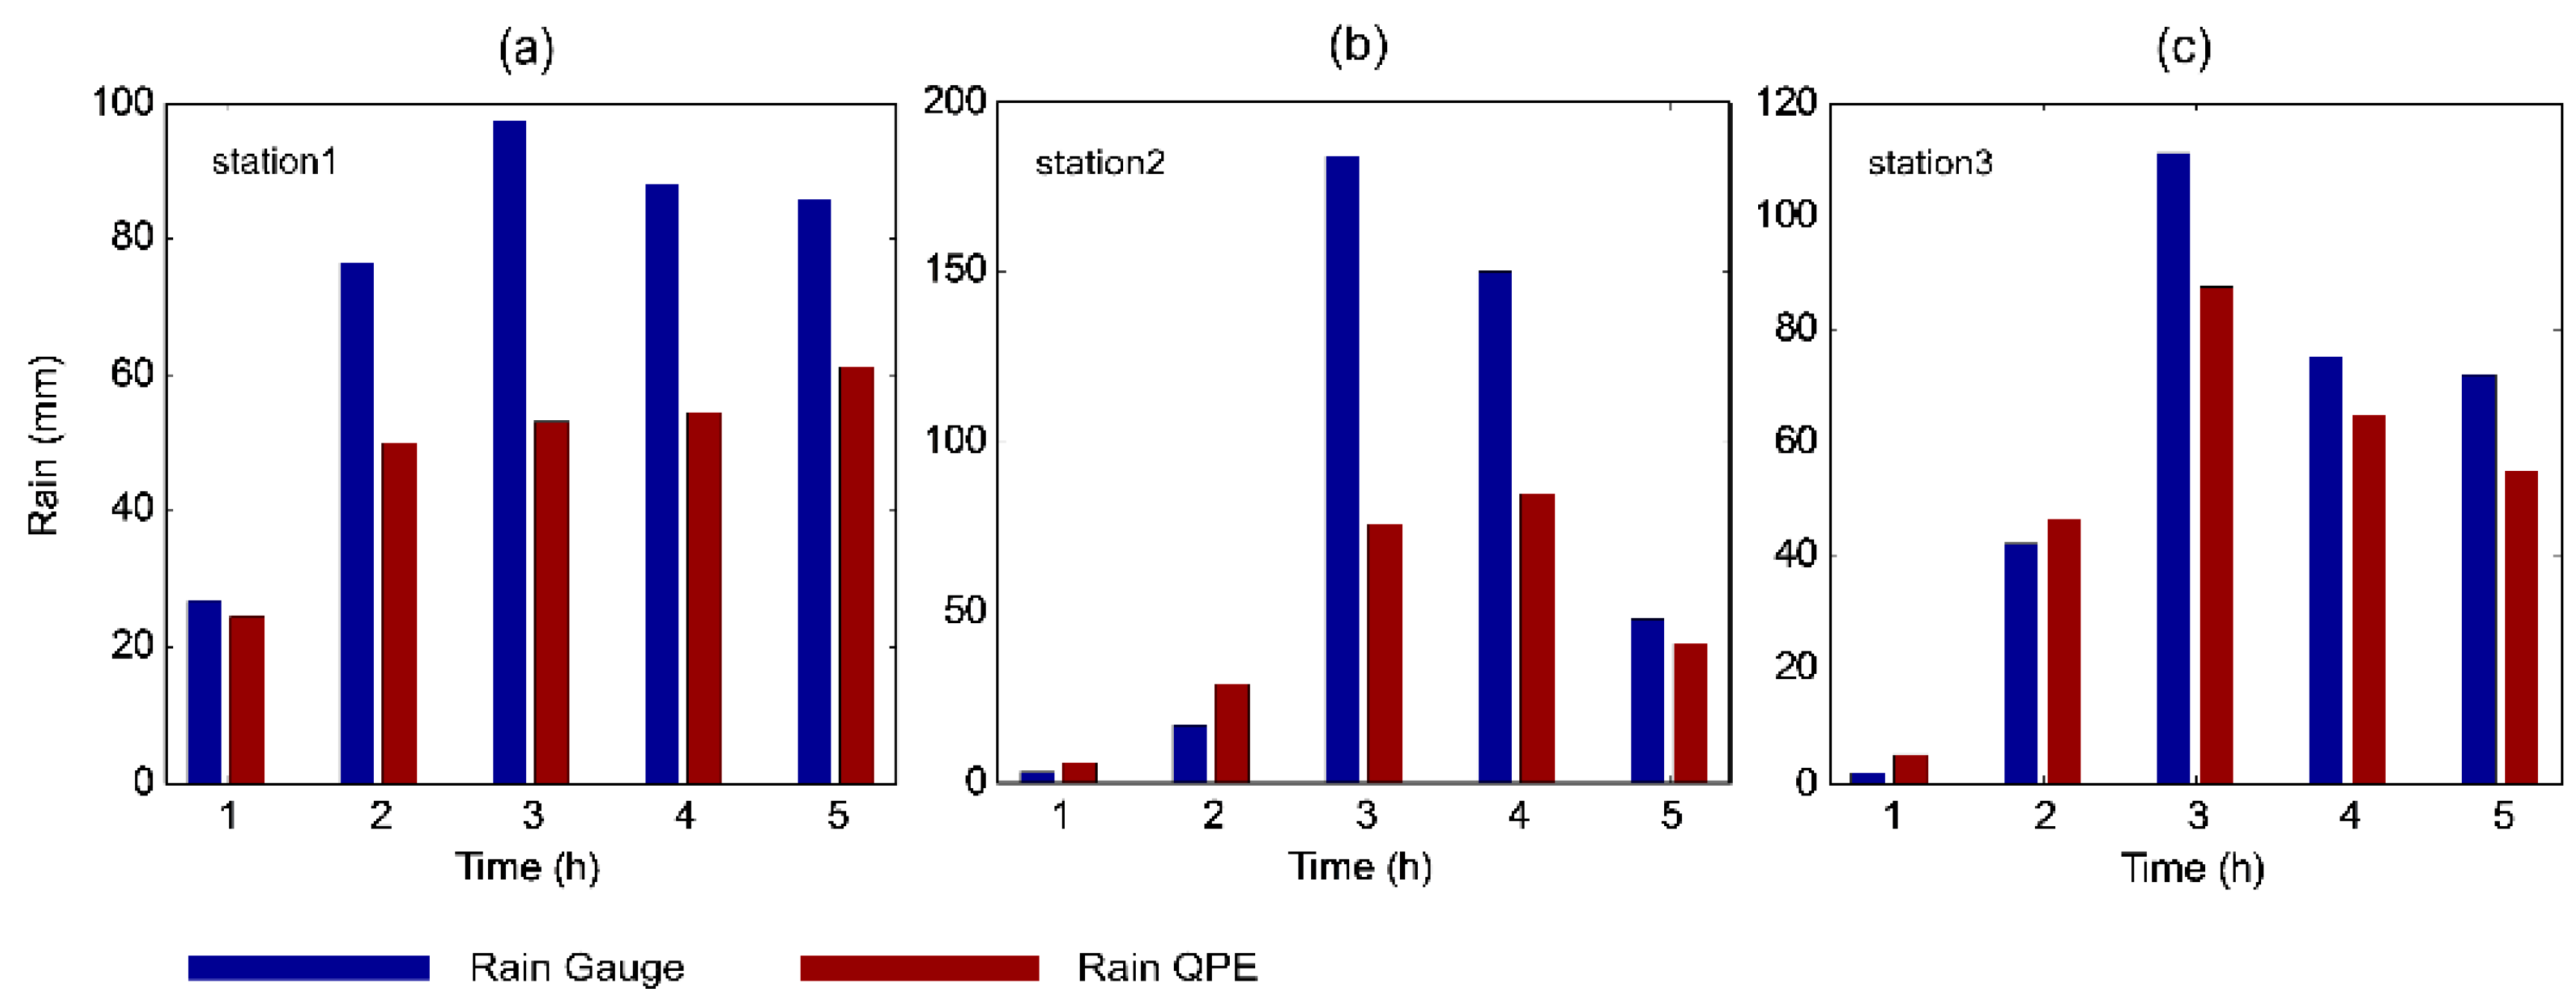
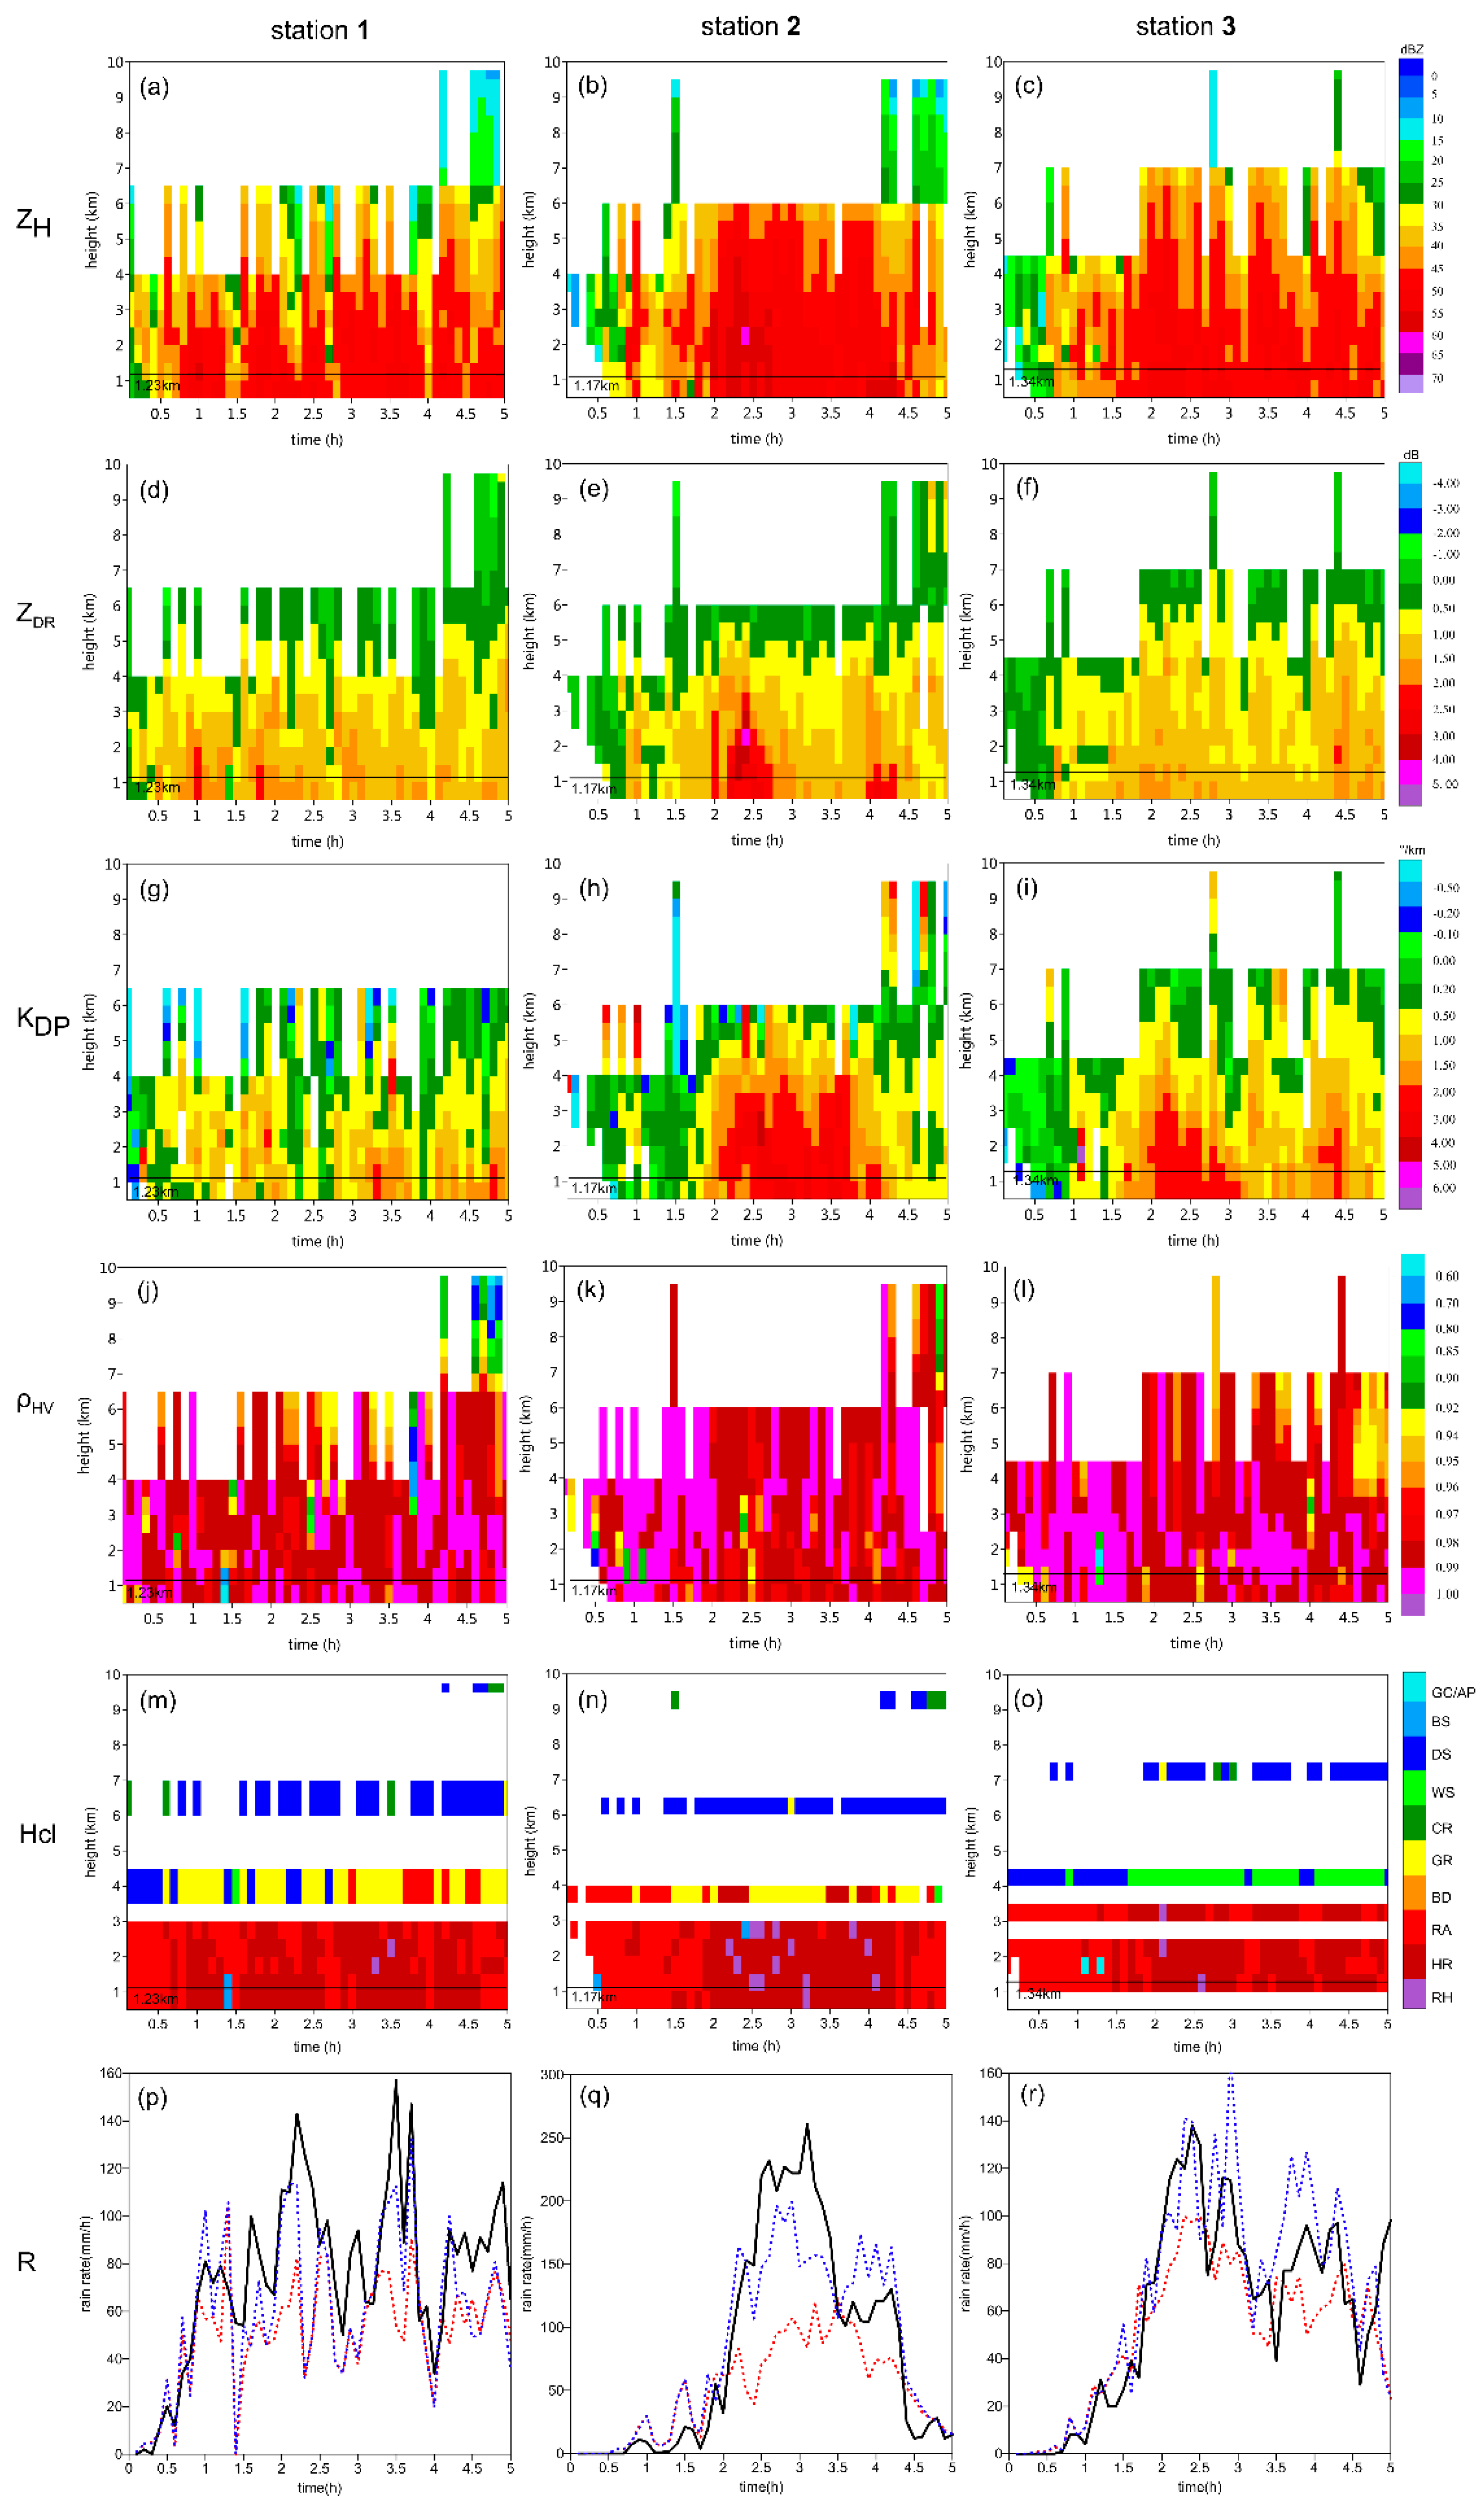
Figure 13 shows the hourly radar or gauge rainfall accumulations at the three stations with the heaviest rainfall. The corresponding rain rate, which was estimated using the improved algorithm, is also shown in
Figure 11p–r with blue dash lines. At the three stations, the performance of the improved algorithm also becomes better in terms of both rainfall accumulations and rain rate. Even though the improved algorithm overestimates rainfall during certain periods, most hourly rainfall accumulations are close to the AWS observations. At station 2, the new algorithm significantly improves compared with previous algorithm calculations during hours 3 and 4 when the DSD is affected by hail.
After improvement, the algorithm performs much better than before because of the help of
R(
AH). Rainfall estimation utilizing
AH has many advantages compared with algorithms based on
ZH,
ZDR, or
KDP. It is least sensitive to DSD variations and immune to radar miscalibration, partial beam blockage, and the impacts of wet radomes [
22]. Based on DSD-simulated data test, Thompson et al. [
26] concluded that the
R(
AH) estimator performed as well as the top-ranking
R(
KDP,
ZDR) estimator at S-band. However, despite recent attempts to improve Φ
DP processing, reliable and robust routines for
KDP estimations do not exist at the moment [
22]. The extremely heavy rain may make
KDP more unreliable than does moderate rain in this rainfall event; therefore,
R(
AH) could be better than
R(
KDP,
ZDR) when estimating the extremely heavy rain.
The improved algorithm performs well for heavy rain. How is the performance of this algorithm when it is used for light-to-moderate rainfall cases? The improved algorithm is used for the nine rainfall events listed in
Table 2 to test its performance for light-to-moderate rainfall cases, and the evaluated statistical scores for these nine rainfall events are shown in
Table 7.
For all nine rainfall events, NE ranges from 34.77% to 44.65%, NB ranges from –24.67% to 11.55%, and Eff ranges from 0.69 to 0.75. This improved algorithm presented for solving the heavy rain problem performed slightly worse than the original algorithm for the nine light-to-moderate rainfall cases. The performance for some rain cases becomes worse but for some becomes better. This is because the performance of R(AH) is unstable when estimating light-to-moderate rain. ZDR biases are larger for light rain than for heavy rain and the biases may propagate when AH is estimated by using Nw(ZH, ZDR) (Equations (17) and (18)). The value of AH at S-band is very small for light-to-moderate rain and the small bias of AH may bring a big bias of rain estimated by using R(AH). These make the performance of R(AH) unstable when estimating light-to-moderate rain. Considering that we have not yet figured out what kind of light-to-moderate rainfall is this new improved algorithm suitable for, this new algorithm is not suggested for light-moderate rain cases for now.
7. Conclusions and Discussion
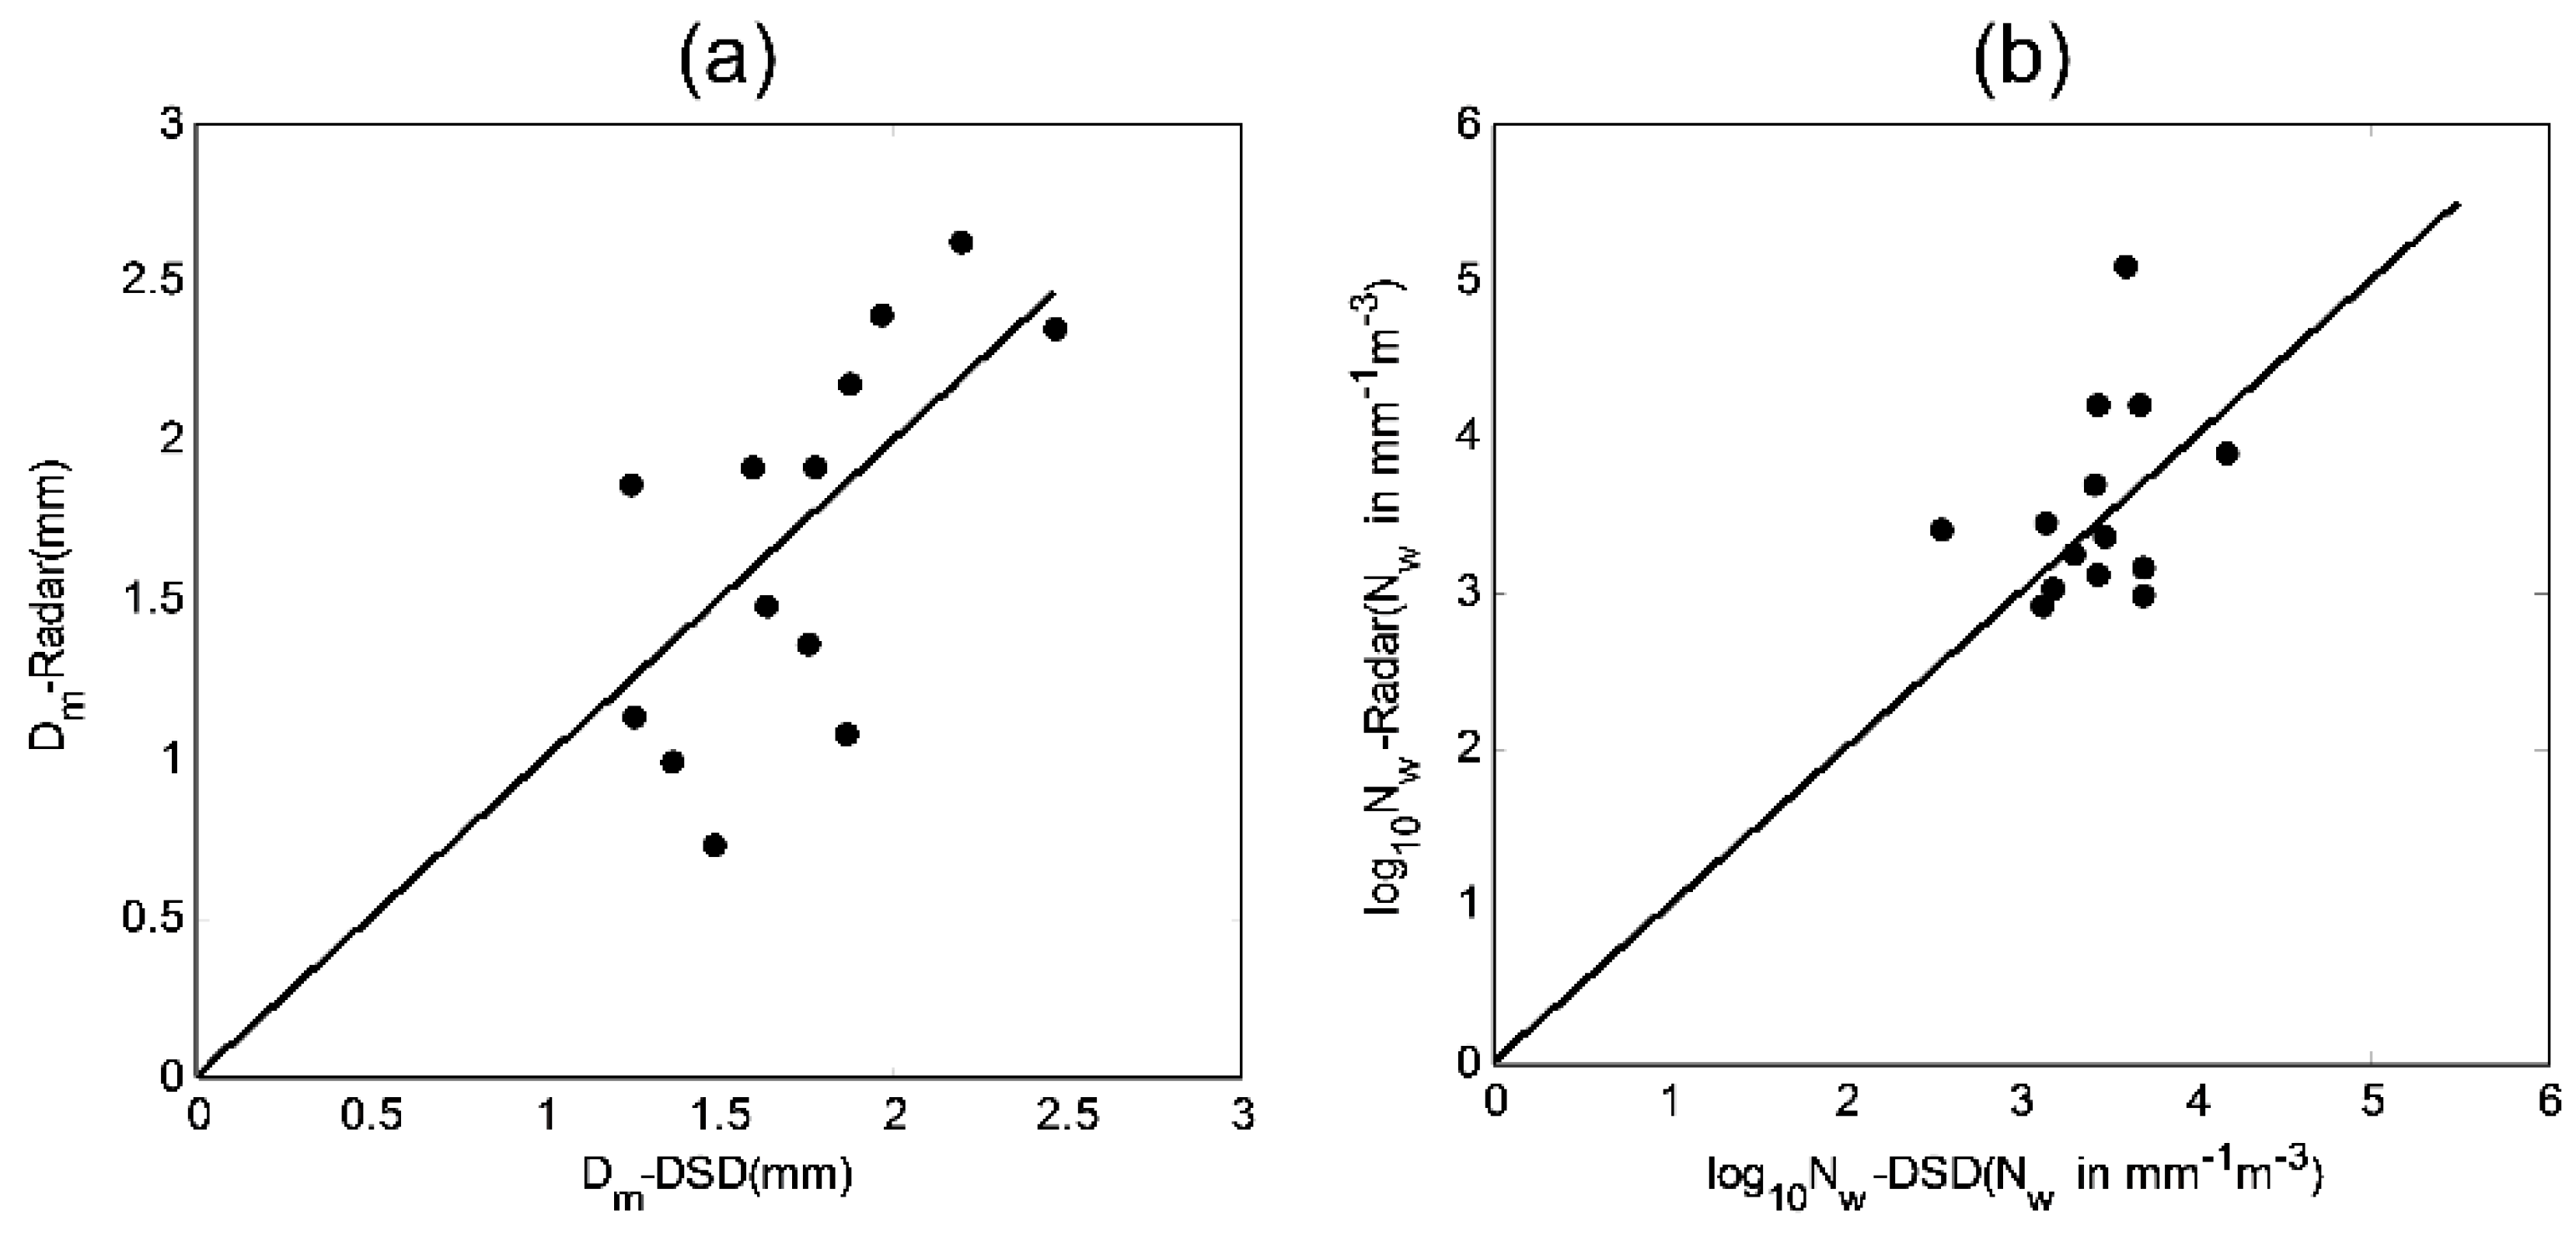
In this study, we proposed a localized PR QPE algorithm that accounts for hydrometeor phase classification. The algorithm is used for nine different types of rainfall events as well as an extremely heavy rainfall event occurred in Guangzhou, China, on 6 May 2017, which is significantly different from conventional rainfall events, in which hourly rainfall accumulations are less than 50 mm. Estimates were made for total rain, light-to-moderate rain (hourly accumulation <50 mm), and heavy rain (>50 mm). The estimates at three stations where total rainfall exceeded 300 mm were analyzed in particular during this rainfall event. To analyze the reasons for QPE error, a rain microphysics retrieval algorithm was presented to retrieve Dm and Nw from the PR measurements. The DSD characteristics of this extremely heavy rainfall event and the factors affecting QPE are analyzed based on Dm and Nw. To improve the operational algorithm, R(AH) replaces R(KDP, ZDR) in the original algorithm to estimate heavy precipitation. The improved algorithm is also evaluated. The main conclusions are presented as follows.
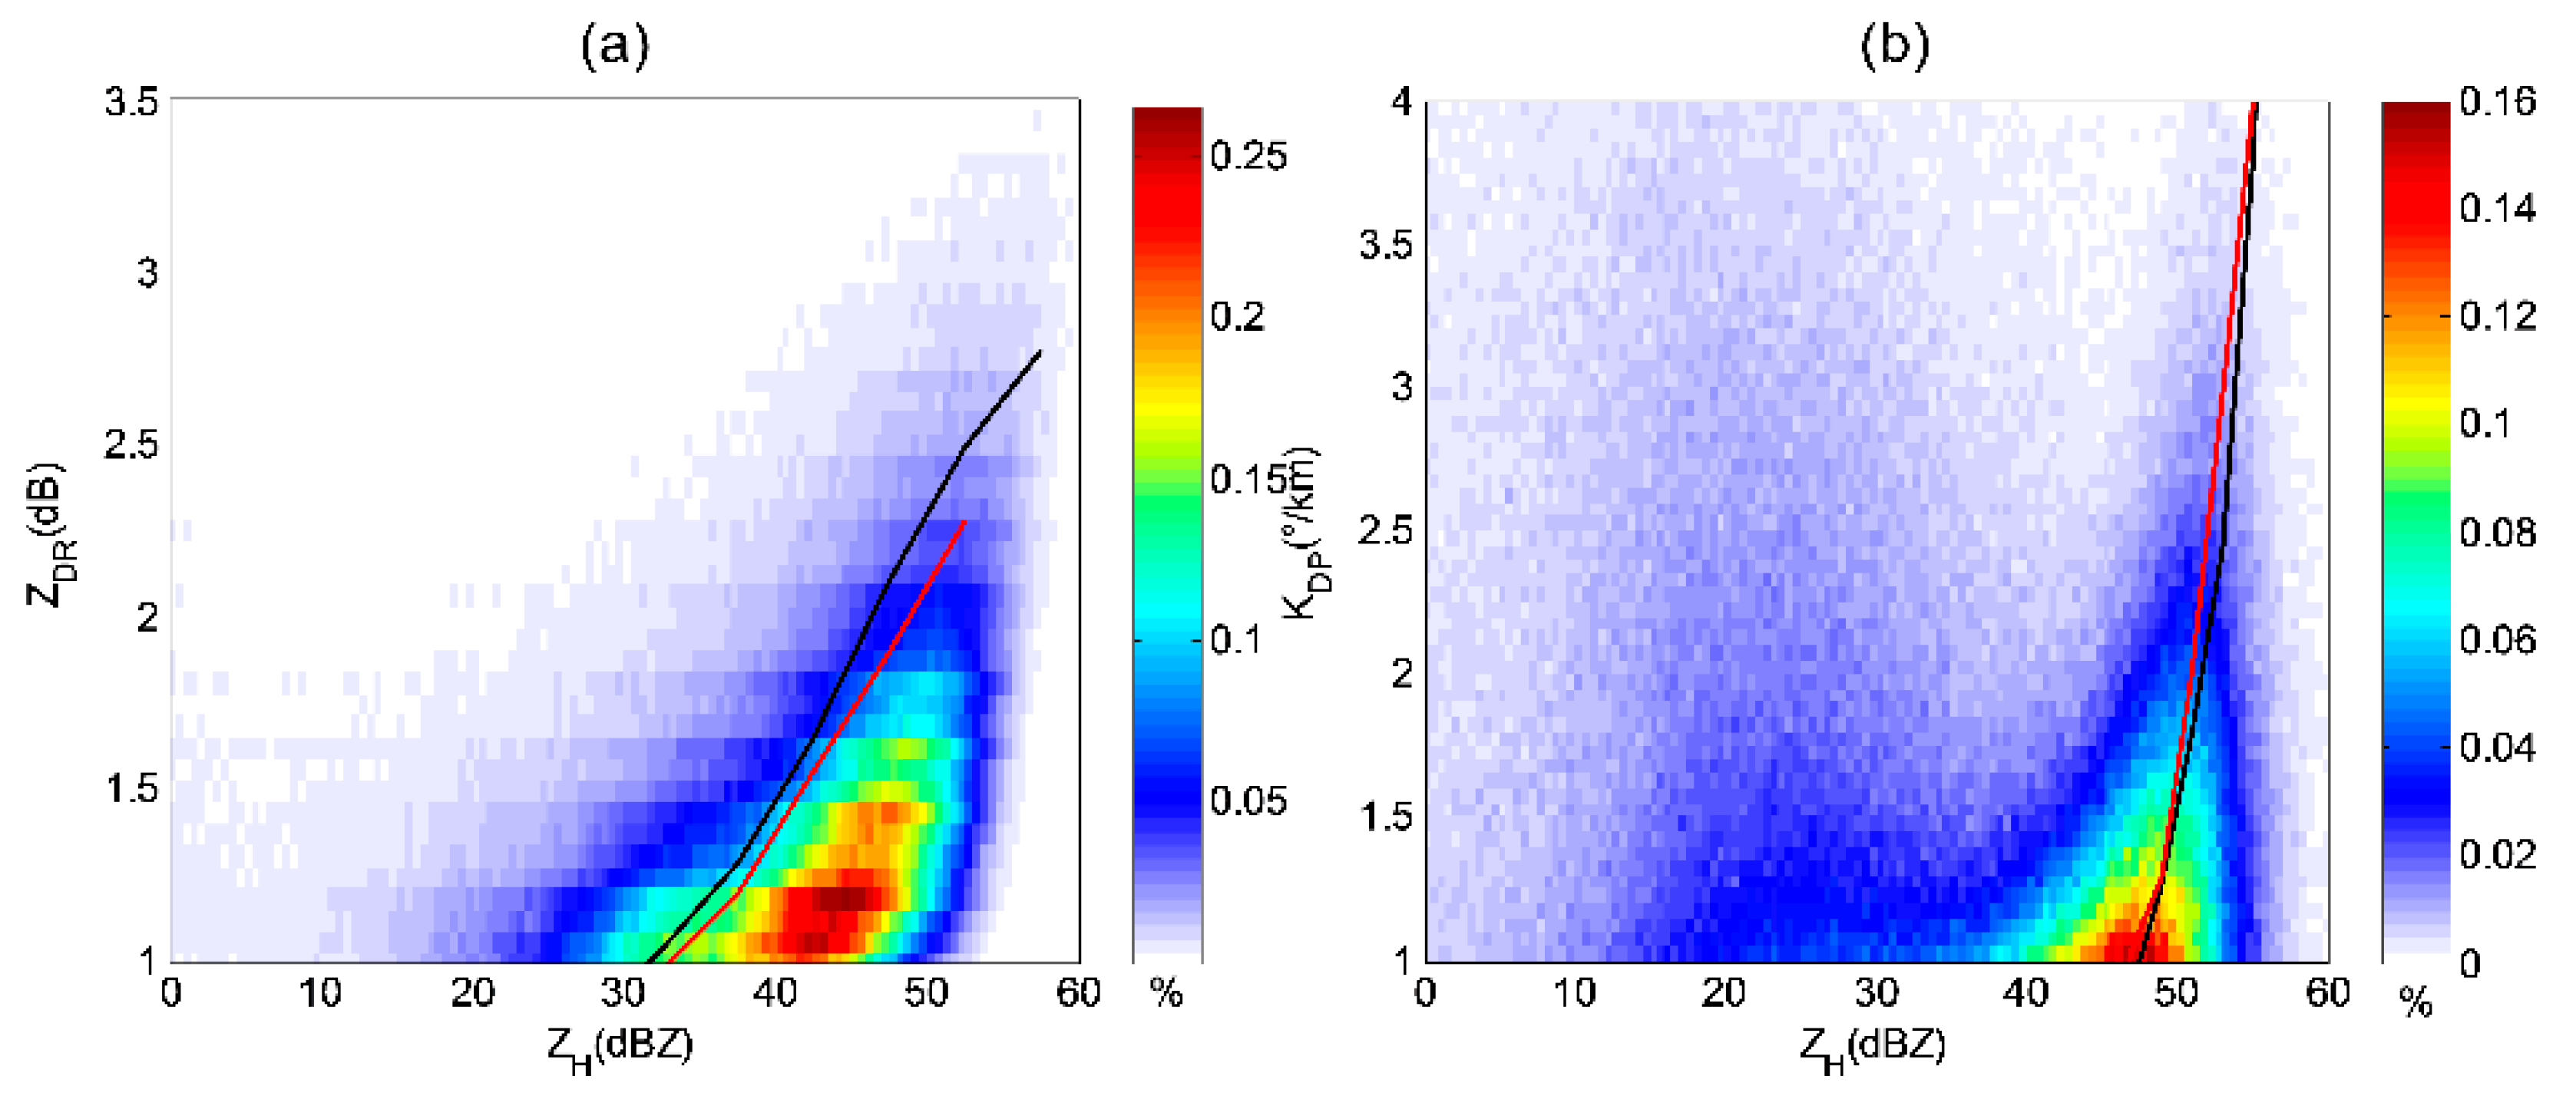
(1) Persistent convergence and ascending motions occurred during this rainfall event, resulting in strong echoes that persisted for a long time. Radar echoes larger than 45 dBZ lasted for a long time and moved slowly, leading to heavy rain over some areas of Guangdong. Compared with ZDR derived from Yangjiang DSD data, ZDR in this rainfall event are smaller for the same ZH, which is more obvious for the high occurrence frequencies data. The average values of Dm and log10Nw derived from the PR data in this rainfall event are 1.44 mm and 4.06, respectively. Compared with the values of data derived from the Yangjiang DSD data, the average value of Dm in this rainfall event decreased by 24.21% and the average value of log10Nw in this rainfall event increased by 14.69%. In short, compared with the statistical DSD data in Yangjiang (estimators are derived from these data), this rainfall event was characterized by smaller average raindrop diameters and higher number concentration. These characteristics are more obvious in the heavy rainfall area.
(2) The bias ratio of MRMS for precipitation during the 2014 warm season is 1.06, which is slightly larger than that (1.00) of the algorithm presented in this study. NB and RMSE of the France operational radar system for intense rain (hourly accumulations >5 mm) in two rainfall events observed in 2010 are −9% and 8.46 mm, respectively. Compared with it, the algorithm presented in this study is slightly better in terms of similar NB (−9%) and lower RMSE (6.55 mm) for the intense rain. The performance of the operational PR QPE algorithm presented in this study is satisfied when it estimates precipitation of all nine rainfall events. Even though precipitation estimates for light-to-moderate rain performed well, this algorithm severely underestimated heavy rain.
(3) The algorithm underestimated the precipitation with small and midsize particles but overestimated the precipitation with midsize and large particles. When Dm and Nw are both very large, underestimations occurred, and severe underestimations of heavy rain are mainly due to these particles. It is verified that some of these particles are associated with the melting hail. Even though most mixed precipitation was detected by the operational algorithm presented in this study, R1(KDP) underestimated mixed precipitation because it is not capable of adapting to large DSD variations for extremely heavy rain. R(KDP, ZDR) underestimates most heavy rain at the three stations because of the same reason.
(4) Even though
R(
KDP,
ZDR) is less susceptible to DSD variations than
R(
ZH) [
6], it still performs poorly for the extremely heavy rain in this rainfall event. In the improved algorithm,
R(
AH) replaces
R(
KDP,
ZDR). After improvement, RMSE and NE decreased by 40.29% and 37.70%, respectively, for the heavy rain in which hourly rainfall accumulations are more than 50 mm. At station 2, the improved algorithm performed much better than the previous algorithm during hours 3 and 4 when DSD is affected by hail. These indicate that
R(
AH) performs well for the extremely heavy rain.
There are still scarce PR observations of such extremely heavy rain events, and further studies of similar extremely heavy rain are necessary to verify the improved algorithm.


