1. Introduction
Lightning is the product of the development of a convective weather system to a certain magnitude, with close ties to the development of both the dynamic and microphysical processes within the system. Lightning can also be used to indicate the occurrence and evolution of severe convection. Under the action of thermal, dynamic or topographic conditions, an air mass can be uplifted in an unstable convective condition, developing into cumulonimbus (thunderstorm) clouds accompanied by updrafts and downdrafts. The various phase states of hydrometeors move at different speeds in a thunderstorm, constantly emerging, coalescing and separating. These changes are accompanied by electron transfers, which leads to various phase states of hydrometeors with different electric charges separating into different charge regions and producing lightning.
With the development of high-speed large capacity data acquisition techniques and high precision GPS timing electronic techniques, as well as improved lightning electromagnetic field detection and channel current and channel optical evolution measurements, the measurement of lightning discharges has enjoyed great progress over the past decade. Meanwhile, new 3D locating technology for lightning VHF radiation sources has boosted research in lightning development to the microsecond time scale, and provided researchers with more efficient means to study thunderstorm charge structures and charging mechanisms.
As early as the end of the last century, scholars had developed a VHF lightning radiation source location system (known as a lightning mapping array, LMA) that used time-delay data from the GPS system to meticulously study the 3D development of lightning and the charge structure of thunderstorms [
1,
2,
3,
4]. Not long after this development, a 3D lightning radiation source location system (LLR) similar to the LMA was developed by our research team to study lightning flashes and thunderstorm charge structure in China [
5,
6,
7,
8,
9]. With this system, many meaningful results have been obtained for lightning observed on the eastern Qinghai–Tibetan Plateau. The long-term Composite Observing Experiment for Lightning, conducted on the Qinghai–Tibetan Plateau, has further advanced our understanding of the Plateau’s thunderstorm events, microphysical processes and the characteristic parameters of lightning; in addition, it has revealed the characteristic mechanisms of lightning activity on the Plateau.
Another important aspect is hail, which is commonly associated with severe thunderstorm events and, alongside heavy rainfall, can be disastrous for industrial and agricultural production. With the development of modern technology and the increasing diversity in research tools, increasing attention is being paid to severe thunderstorm events accompanied by hail, and the relationship between lightning and hail in a severe thunderstorm event has long been a hot topic of research. Ordinarily, the negative ground flash rate is greater than the positive ground flash rate for a given thunderstorm. However, statistical analysis of hail events has shown that the proportion of positive ground flashes is higher in hail clouds [
10,
11], and that the hail stage corresponds to the beginning of the stage where the positive ground flash rate increases. Thus, this change in positive ground flash rate could be used, to a certain extent, as an early warning of hail fall at the ground. However, research conducted by Soula et al. [
12] on hail storms in the south of France illustrated that the ground flash rate of a hail cloud in that region was far less than the rate found in storms without hail, and that the ground flash rate of the hail cloud was generally no more than 2 min
−1, while the ground flash rate of rainstorms can be as many as 12 min
−1. Therefore, the positive ground flash rate may not be a reliable early warning of hail. In fact, since severe weather events are always accompanied by frequent lightning, it is more reliable to determine the evolution of the severe weather using the sharp increase in total flash rate (consisting of intra-cloud flashes and ground flashes). Schultz et al. [
13] analyzed 711 thunderstorms that occurred in four different regions of the U.S. to ensure a representative mix of severe thunderstorms (i.e., those accompanied by tornados, hail with diameter ≥1.9 cm or a wind velocity ≥26 m/s) and general ones. They examined the capability of the total flash rate and significant increase in ground flash rate to predict severe weather events, and found that the total flash rate was more effective. Yao et al. [
14] used a similar method when researching thunderstorms in the Beijing region of China. Emersic et al. [
15] used an LMA system integrated with a phased-array radar for observation and research of a severe thunderstorm, and analyzed the charge structure and lightning rate of the storm. Comparatively speaking, little progress has been made in the research of severe thunderstorm events accompanied by hail on the eastern Qinghai–Tibetan Plateau in China, since it is difficult to obtain such observational data in this region. This is the impetus for exploring this topic in the present paper.
2. Instrumentation and Data Analysis
2.1. Instrumentation
In this study, the experimental data were obtained from the Composite Observing Experiment for Lightning in Datong area of Qinghai Province, China, in 2012.
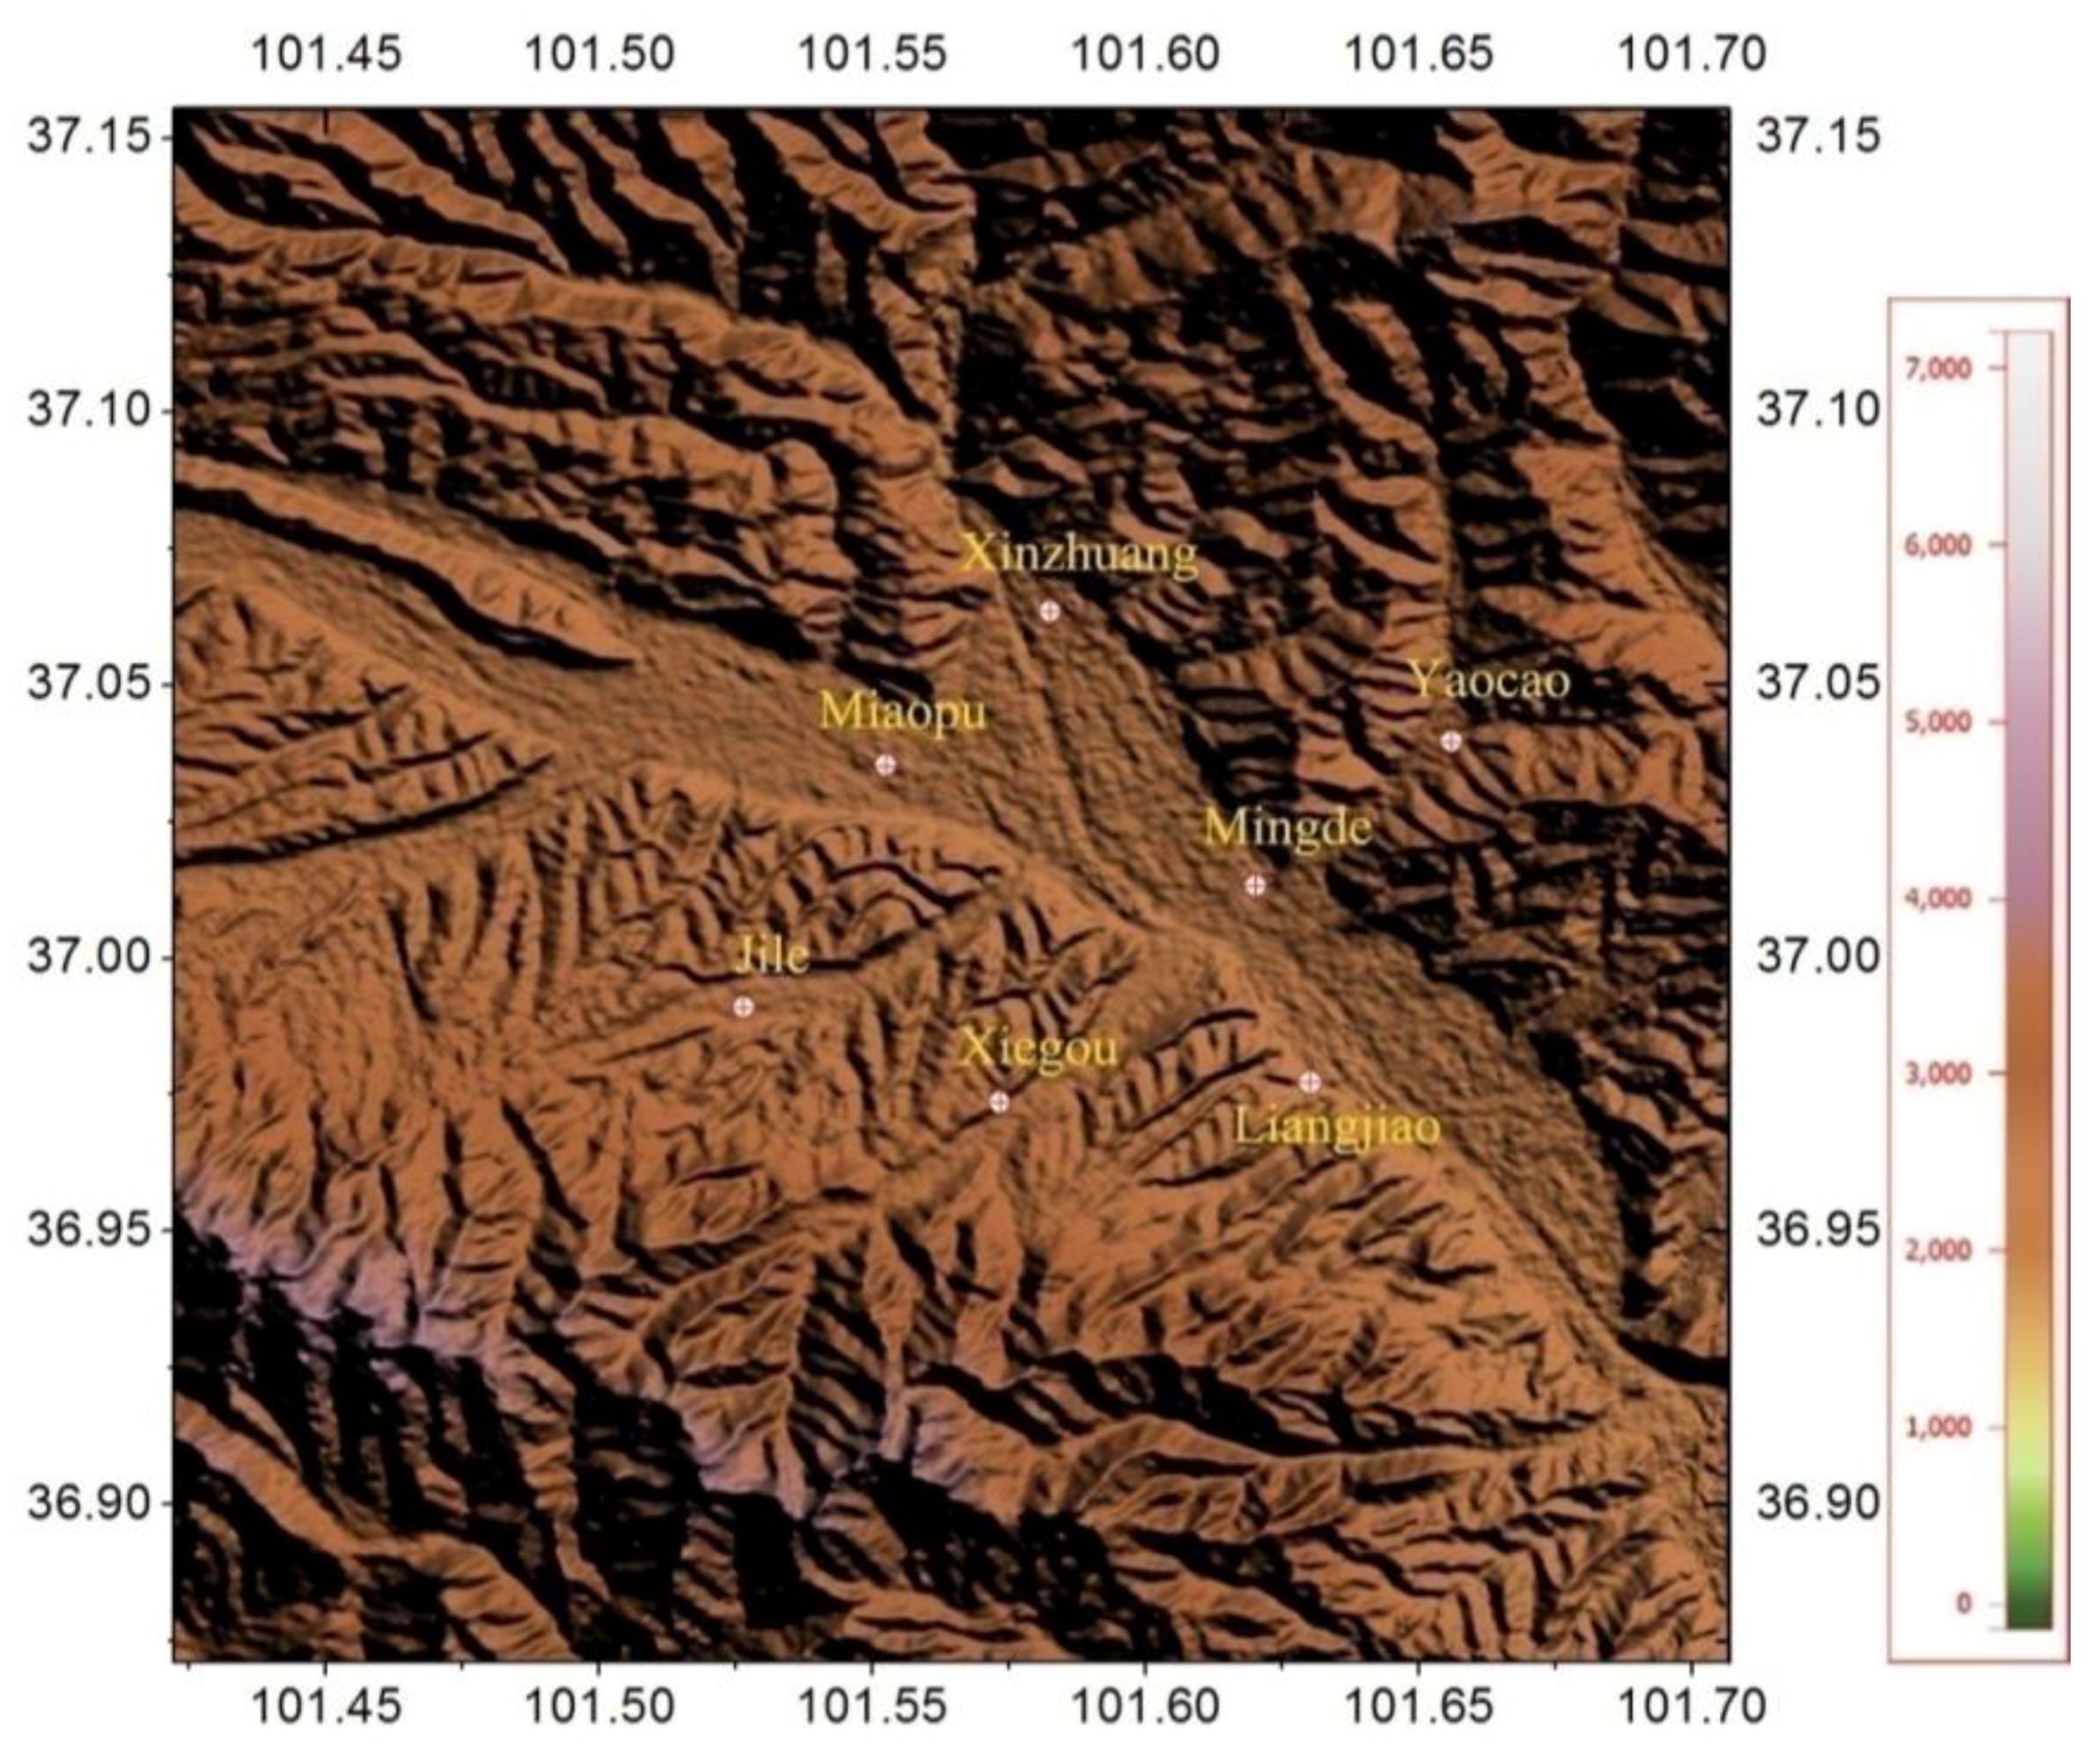
Figure 1 shows the map of the measurement network. Seven stations cover a circular area of 8 km, centered on the Mingde station (altitude: 2496.24 m. In this paper, the height of thunderstorm cloud and lightning is expressed as the relative height based on this height). This area is located in the hinterland of China’s inland plateau and is a region with high altitude, river valley topography and complex underlying surface features. The plateau and westerly system control the weather in this area. Frequent interactions lead to short time heavy rainfall events and severe convective weather such as thunderstorms and hail. Our research team has been working in this area for 10 years and has achieved some research achievements [
5,
6,
7,
8,
9,
16,
17,
18,
19,
20,
21] using this network.
Each observation station is equipped with a slow antenna (bandwidth 0.03 Hz–3 MHz, time constant 6 s), a fast antenna (bandwidth 160 Hz–5 MHz, time constant 1 ms), and a field mill (measurement range 50 kV/m), the A/D card with a sampling rate of 5 MHz and 12 bit accuracy is used to record the above electric field information. Each station is also equipped with a broadband electric field change analyzer (bandwidth 1.5 kHz to 10 MHz, time constant 100 µs) and a VHF radiation detection antenna, a 14 bit A/D card is used, and the sampling rate is 20 MHz. All seven observation stations were connected through a wireless data website, with data acquisition controlled by the primary observation station.
The 3D lightning VHF radiation source locating system, similar to the LMA [
1,
2,
3,
4], was operated at its center frequency of 270 MHz, with a 3 dB bandwidth of 6 MHz [
5,
6,
7]. The systems received the radiation pulse signals produced by the lightning discharges synchronously, and then measured the arrival times of the impulsive radiation events of the lightning at each remote location by using the GPS technology. The arrival times were determined using a 20 MHz digitizer accurately synchronized by the 1 PPS (pulse per second) output of a GPS receiver (Motorola M12T) at each station. The systems could deal with one peak value event in successive 50 μs time windows with the maximum number of identified independent pulses from each station. The location error for the system was estimated by Zhang et al. [
6]. Within an observation range of 100 km, the typical horizontal error is about 100 m over the network plane, and the altitude error is less than 300 m, both increasing with observation range. The 3D locator system has been used in many studies in China to examine the 3D and temporal structure of lightning during a storm’s lifetime [
5,
7,
8,
9].
In addition, the radar echo information from a C-band (5 cm) Doppler weather radar (CINRAD/CC) 48 km away from the central station was available for the present study. During the whole observation period, the radar collected conventional volume scans every 5–6 min. To facilitate analysis, the reflectivity of the original polar scanning data is converted into Cartesian coordinates of 21 layers in the vertical direction through bilinear interpolation, of which 11 layers are divided into 0.5 km at intervals of 0.5–5.5 km. It is divided into five layers within 6–10 km, with an interval of 1 km. It is divided into five layers within 11–20 km, with an interval of 2 km. The horizontal resolution is 0.01° × 0.01° [
14,
22].
2.2. Methods
The polarity and extension of charge sources stimulated in lightning flashes can be deduced using the distribution sequence of the radiation sources detected by the radiation source locating system [
23,
24,
25]. The intensity of the signal radiated by the negative leader head (propagating in the positive charge region of the thundercloud) is stronger than the positive leader head (propagating in the negative charge region of the thundercloud). Since there are more signals radiated by the negative leader to be detected by the radiation locating system, the distribution sequence of the radiation sources can be used to deduce the charge structure of the thunderstorm [
1,
23,
25,
26,
27,
28].
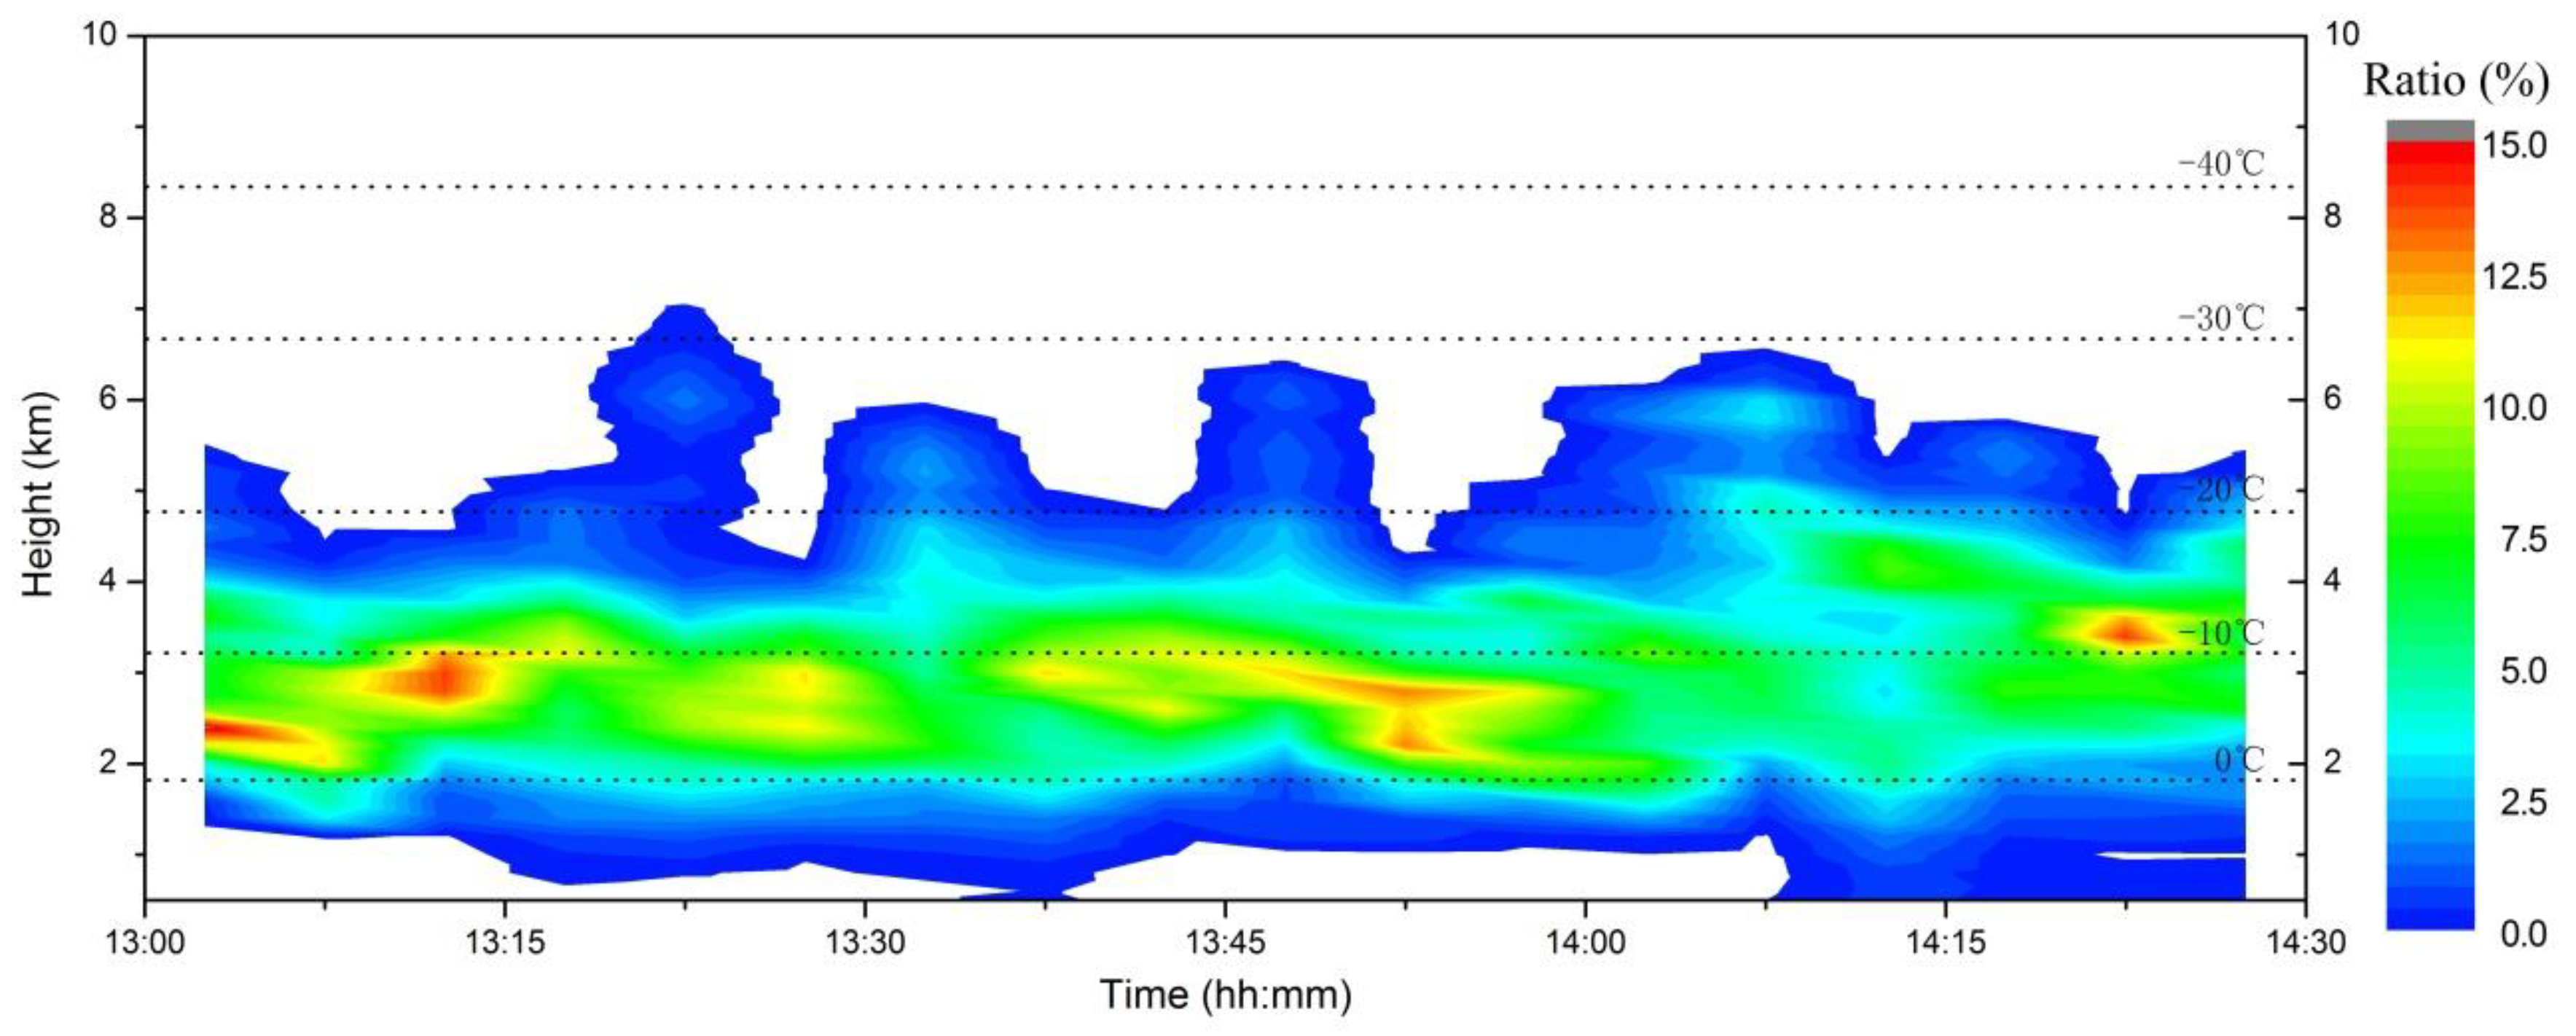
Based on the above assumptions, we produced height distribution statistics of all the VHF radiation positioning results obtained in the whole thunderstorm process (94,797 radiation source positioning results were obtained in the whole thunderstorm process)—that is, the proportion of the number of radiation sources per 200 m height to the total number of radiation sources in the five minutes—and then drew a VHF radiation source height–density distribution contour map for the whole thunderstorm process. This allowed us to clearly see the density of radiation sources in each height layer—that is, the height of the positive and negative charge areas that may have existed, combined with lightning location analysis of a few flashes, could provide us with a picture of the evolution process of the thunderstorm cloud charge structure.
3. Introduction to the Thunderstorm Process
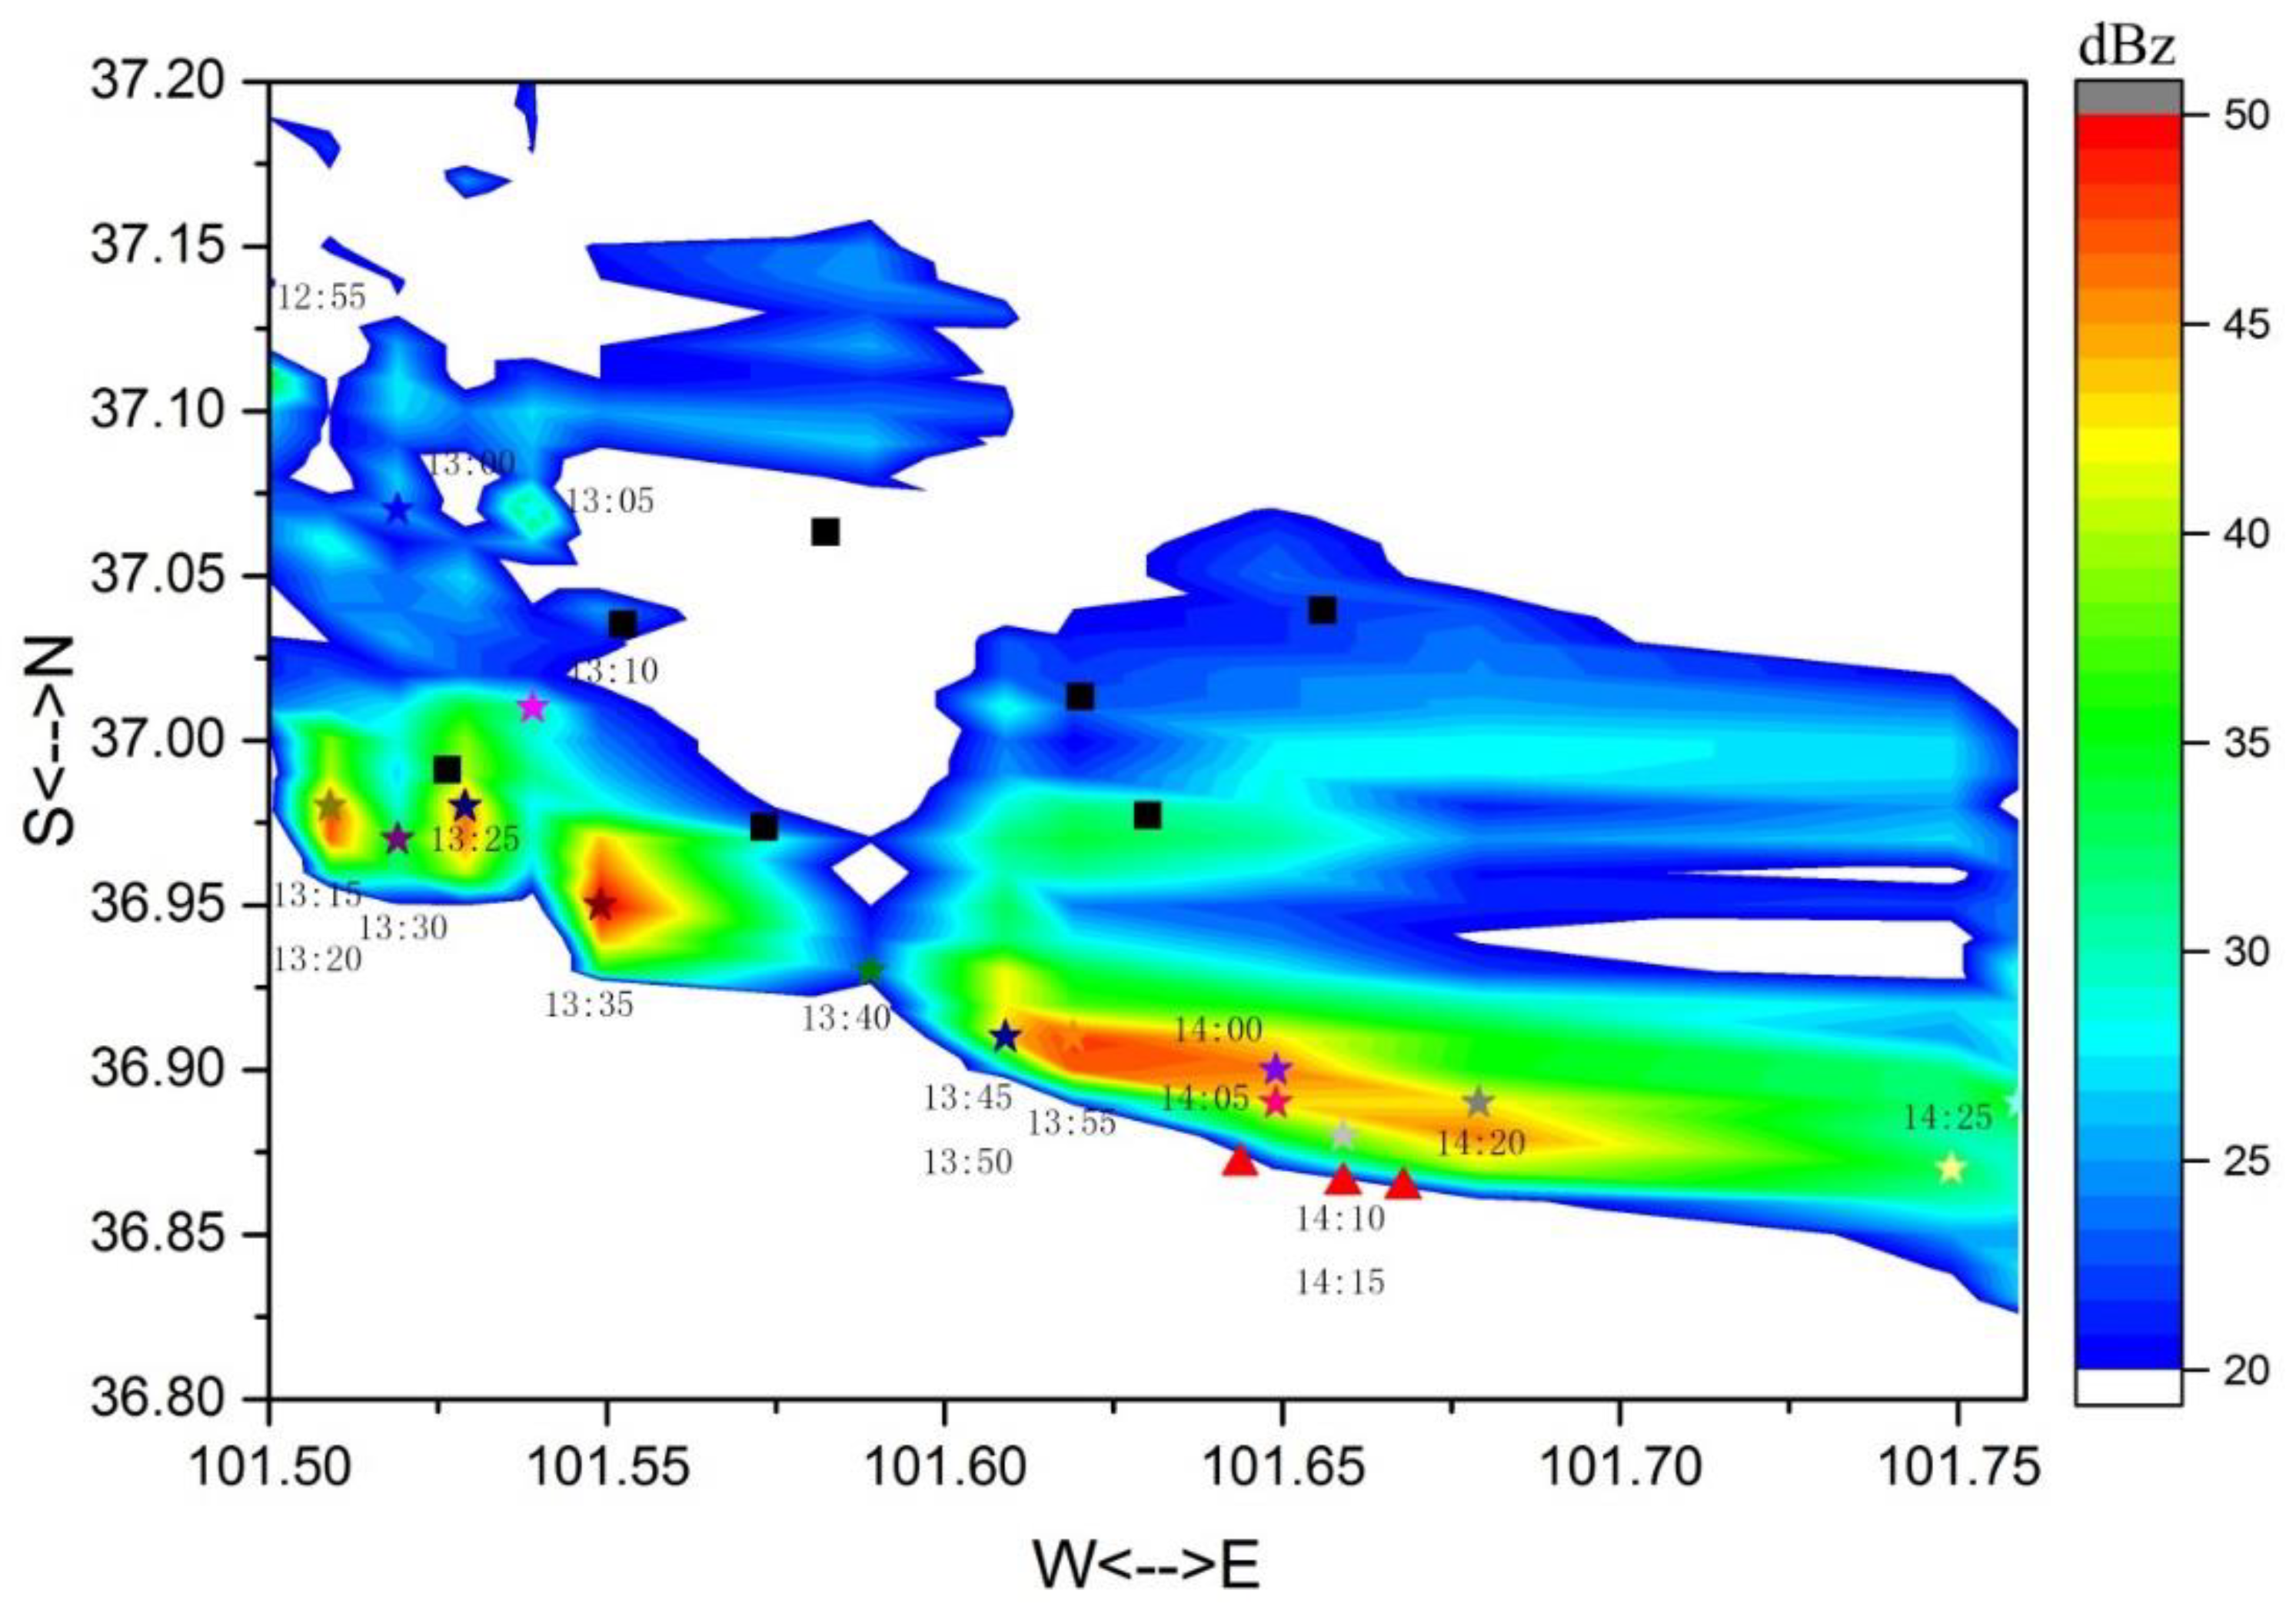
The thunderstorm process analyzed in this paper occurred on 20 August 2012 and lasted about 2 h. During the process, the thunderstorm cloud developed from northwest to southeast along the valley area. In the middle and late stage of the thunderstorm process, the storm cloud was rapidly enhanced due to the forced lifting by the southern mountains of the observation station network, and a severe hail process lasting about 5 min occurred at around 14:10 p.m. (the time stated in this article is local time), causing 1.6 km
2 of crops in three villages at the foot of the eastern mountain range to suffer hail disaster (represented by ▲ in
Figure 2 and
Figure 3).
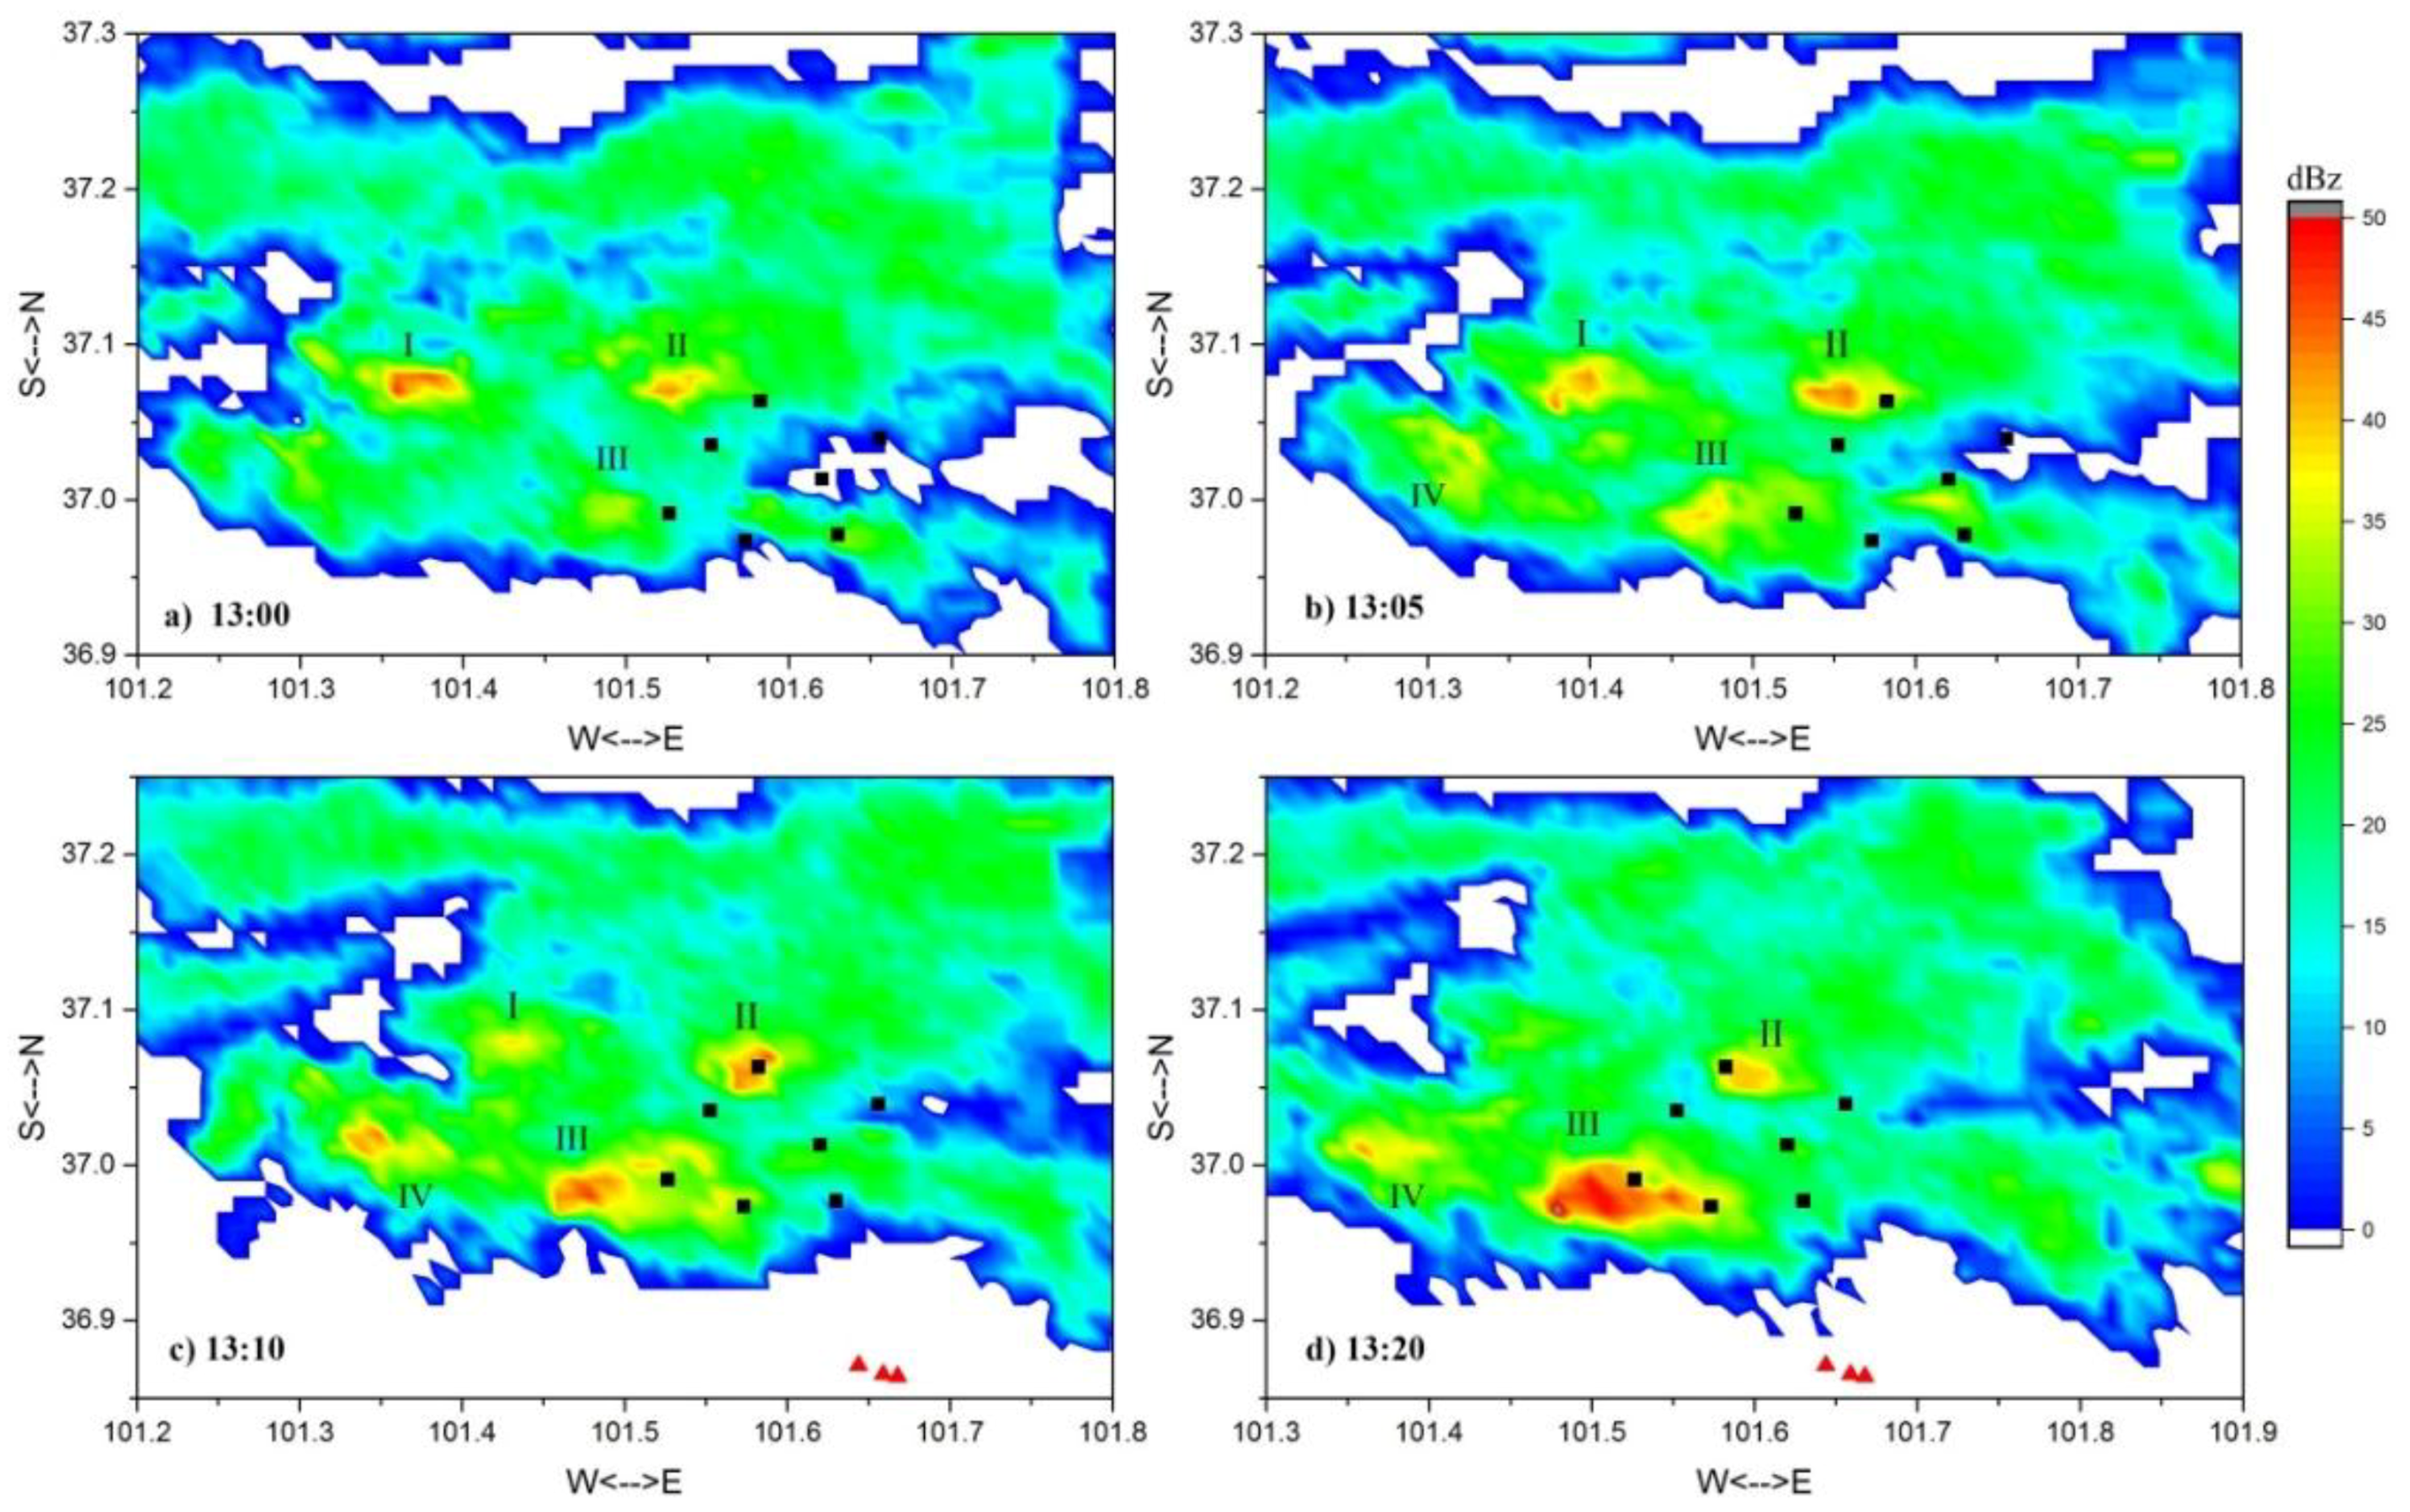
Four storm cells developed during the whole thunderstorm process (
Figure 2, marked, respectively, as I, II, III and IV). The durations of Cells I and II were short (from the first lightning detected, until these storm cells dissipated, it took about 10 min); Cell IV fused with Cell III shortly after 13:20; but Cell III, which formed later, continued to develop and eventually produced hail. As shown in
Figure 3, the path swept by the maximum echo region at a relative height of 2500 m throughout the thunderstorm lifecycle of Cells III and IV. From 13:10 onwards, the radar echo intensity of Cell III surpassed that of the other three cells and increased rapidly, with lightning activity increasing accordingly. It can be seen that the main body of the cell swept over the south side of the station network during the whole thunderstorm process. A total of 202 lightning flashes were detected simultaneously by fast and slow antennas during the thunderstorm process, lasting nearly 2 h. In this paper, we analyze the characteristics of the lightning flashes in the thunderstorm process.
From the path of movement of the cloud bottom of Cell III (shown in
Figure 3), and compared to the topography in
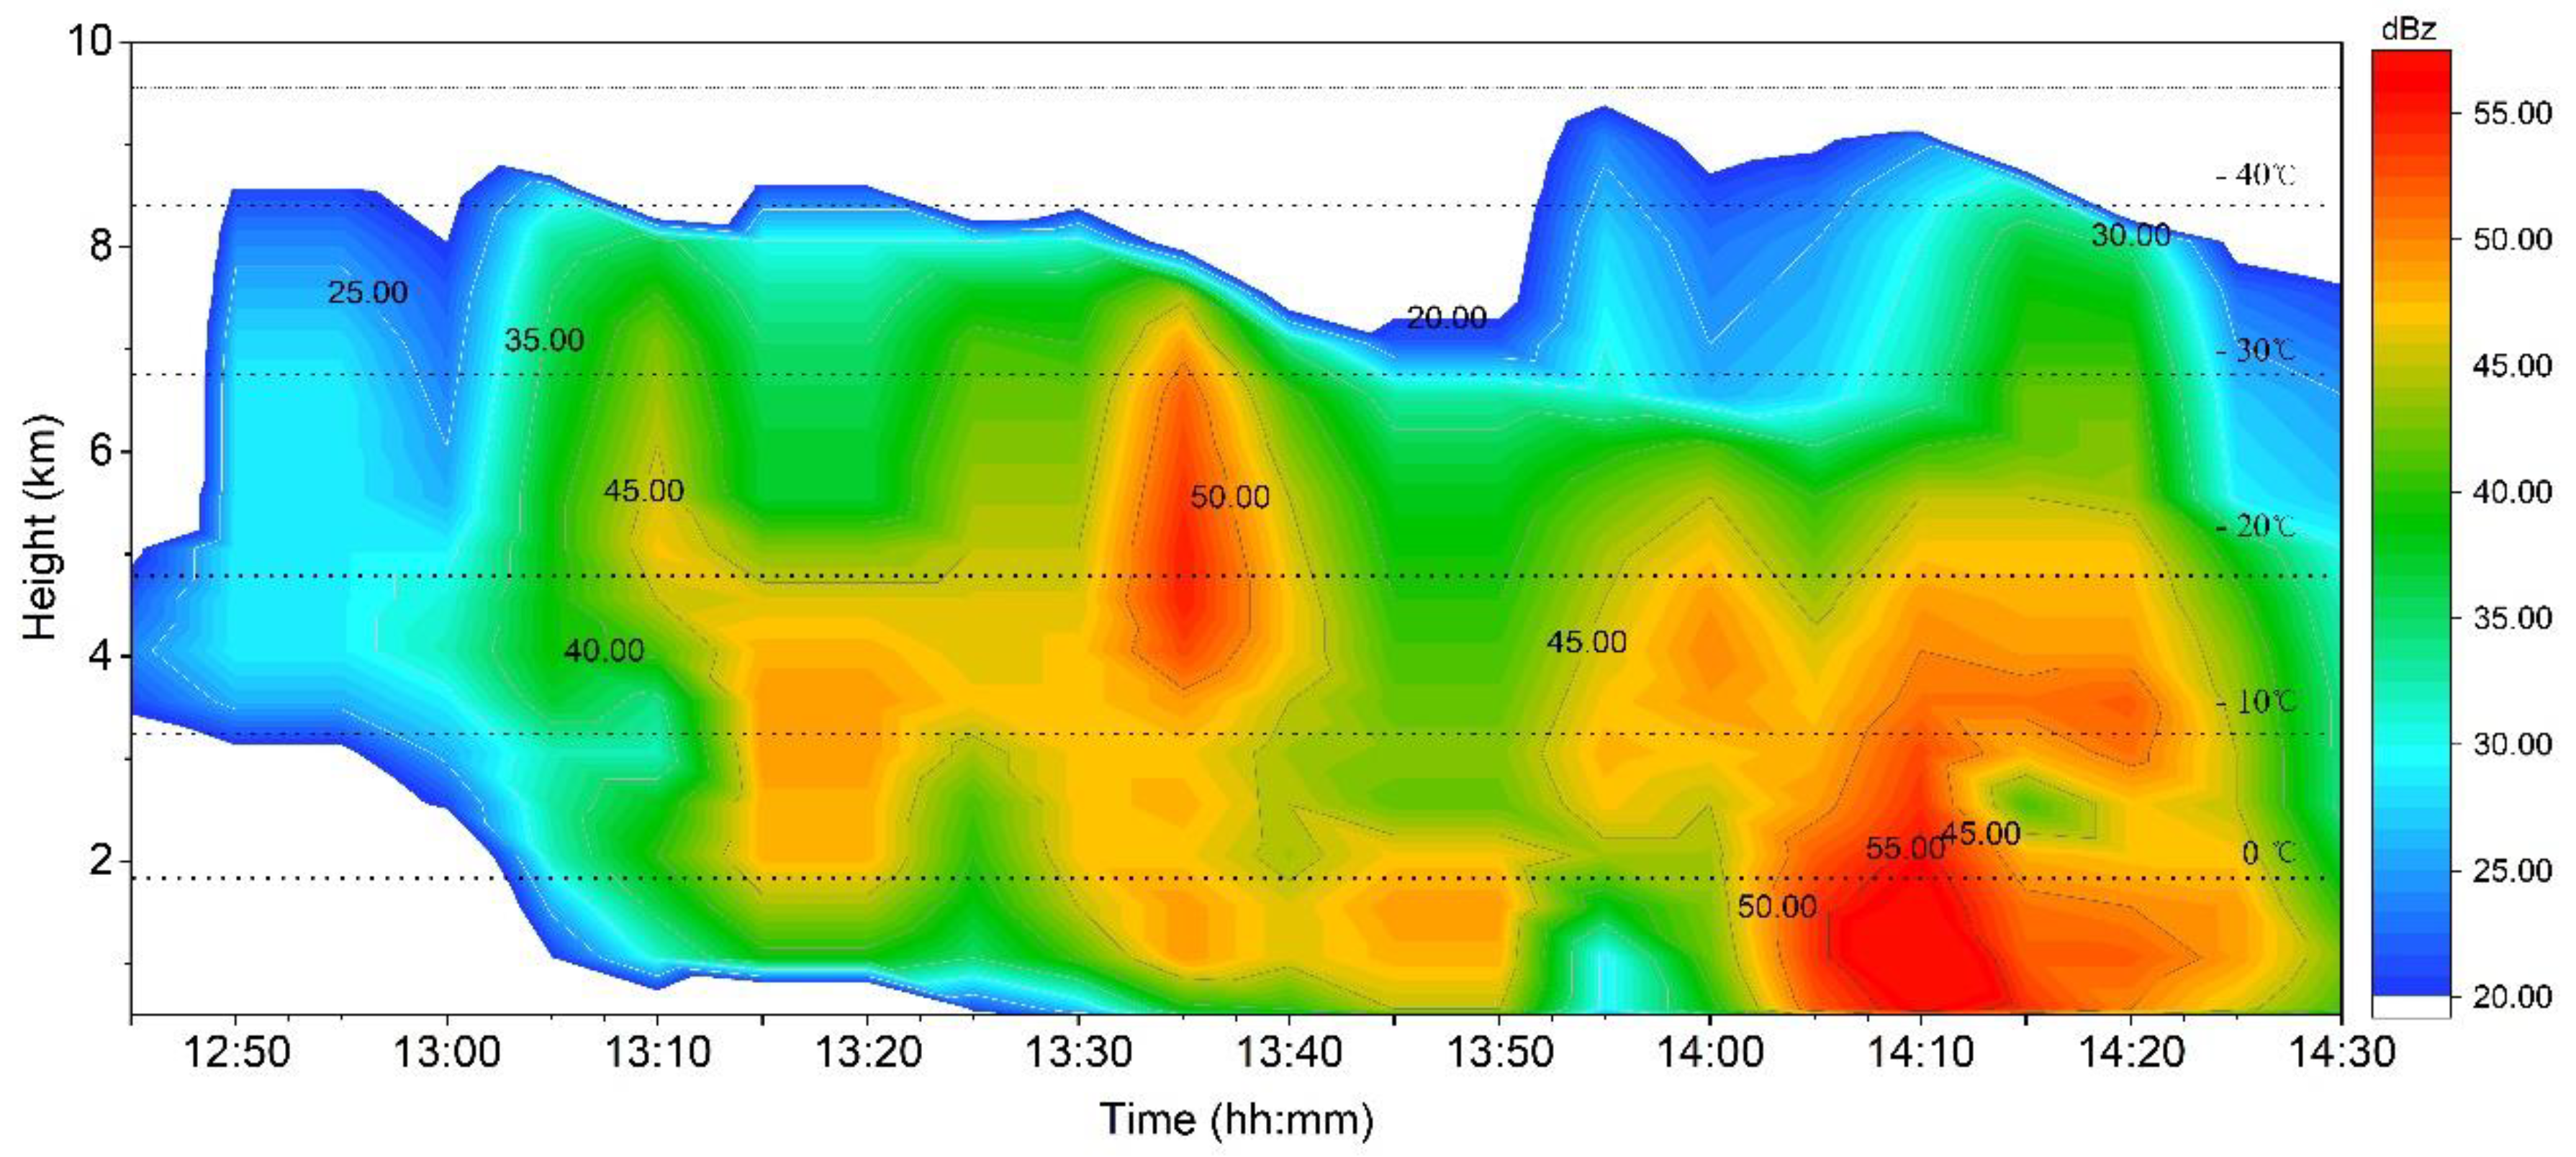
Figure 1, Cell III moved southeast along the mountain south of the network of stations throughout the process. At about 13:40, Cell III had a short period of weakening; the 40 dBz echo peak height reduced significantly (as shown in
Figure 4), with the cloud moving eastward faster than before. Then, however, over the southern slopes of the terrain, the cell was forced to rise, and thus began to develop again; the 40 dBz echo peak height raised significantly—even more than the previous height—between 14:00 and 14:15. The cloud persisted locally and, blocked by the mountain, quickly lifted. Hail occurred between 14:10 and 14:15, lasting about 5 min, according to reports from the local meteorological department. At about 14:20, the bottom of the cloud climbed over the eastern slope of the southern mountain and quickly moved eastward to dissipate.
The thunderstorm process was characterized by a rapid disappearance of the storm cell in the early stage of the process and topographic uplift affecting the development of the thunderstorm, hail growth and fall. Therefore, the discussion in this paper focuses on the characteristics of lightning, the cell charge structure of the thunderstorm, and the influence of hail growth and fall on the charge structure of the thunderstorm cloud throughout the whole thunderstorm process.
4. Lightning Characteristics
4.1. Lightning Flash Rate
As mentioned earlier, 202 lightning flashes were detected simultaneously by fast and slow antennas during the thunderstorm. A lightning flash rate of this magnitude during a thunderstorm is typical over the Qinghai–Tibetan Plateau [
18,
20,
29]; however, such a number of lightning flashes during a single thunderstorm is relatively small compared to disastrous weather processes studied by scientists in other regions [
10,
13,
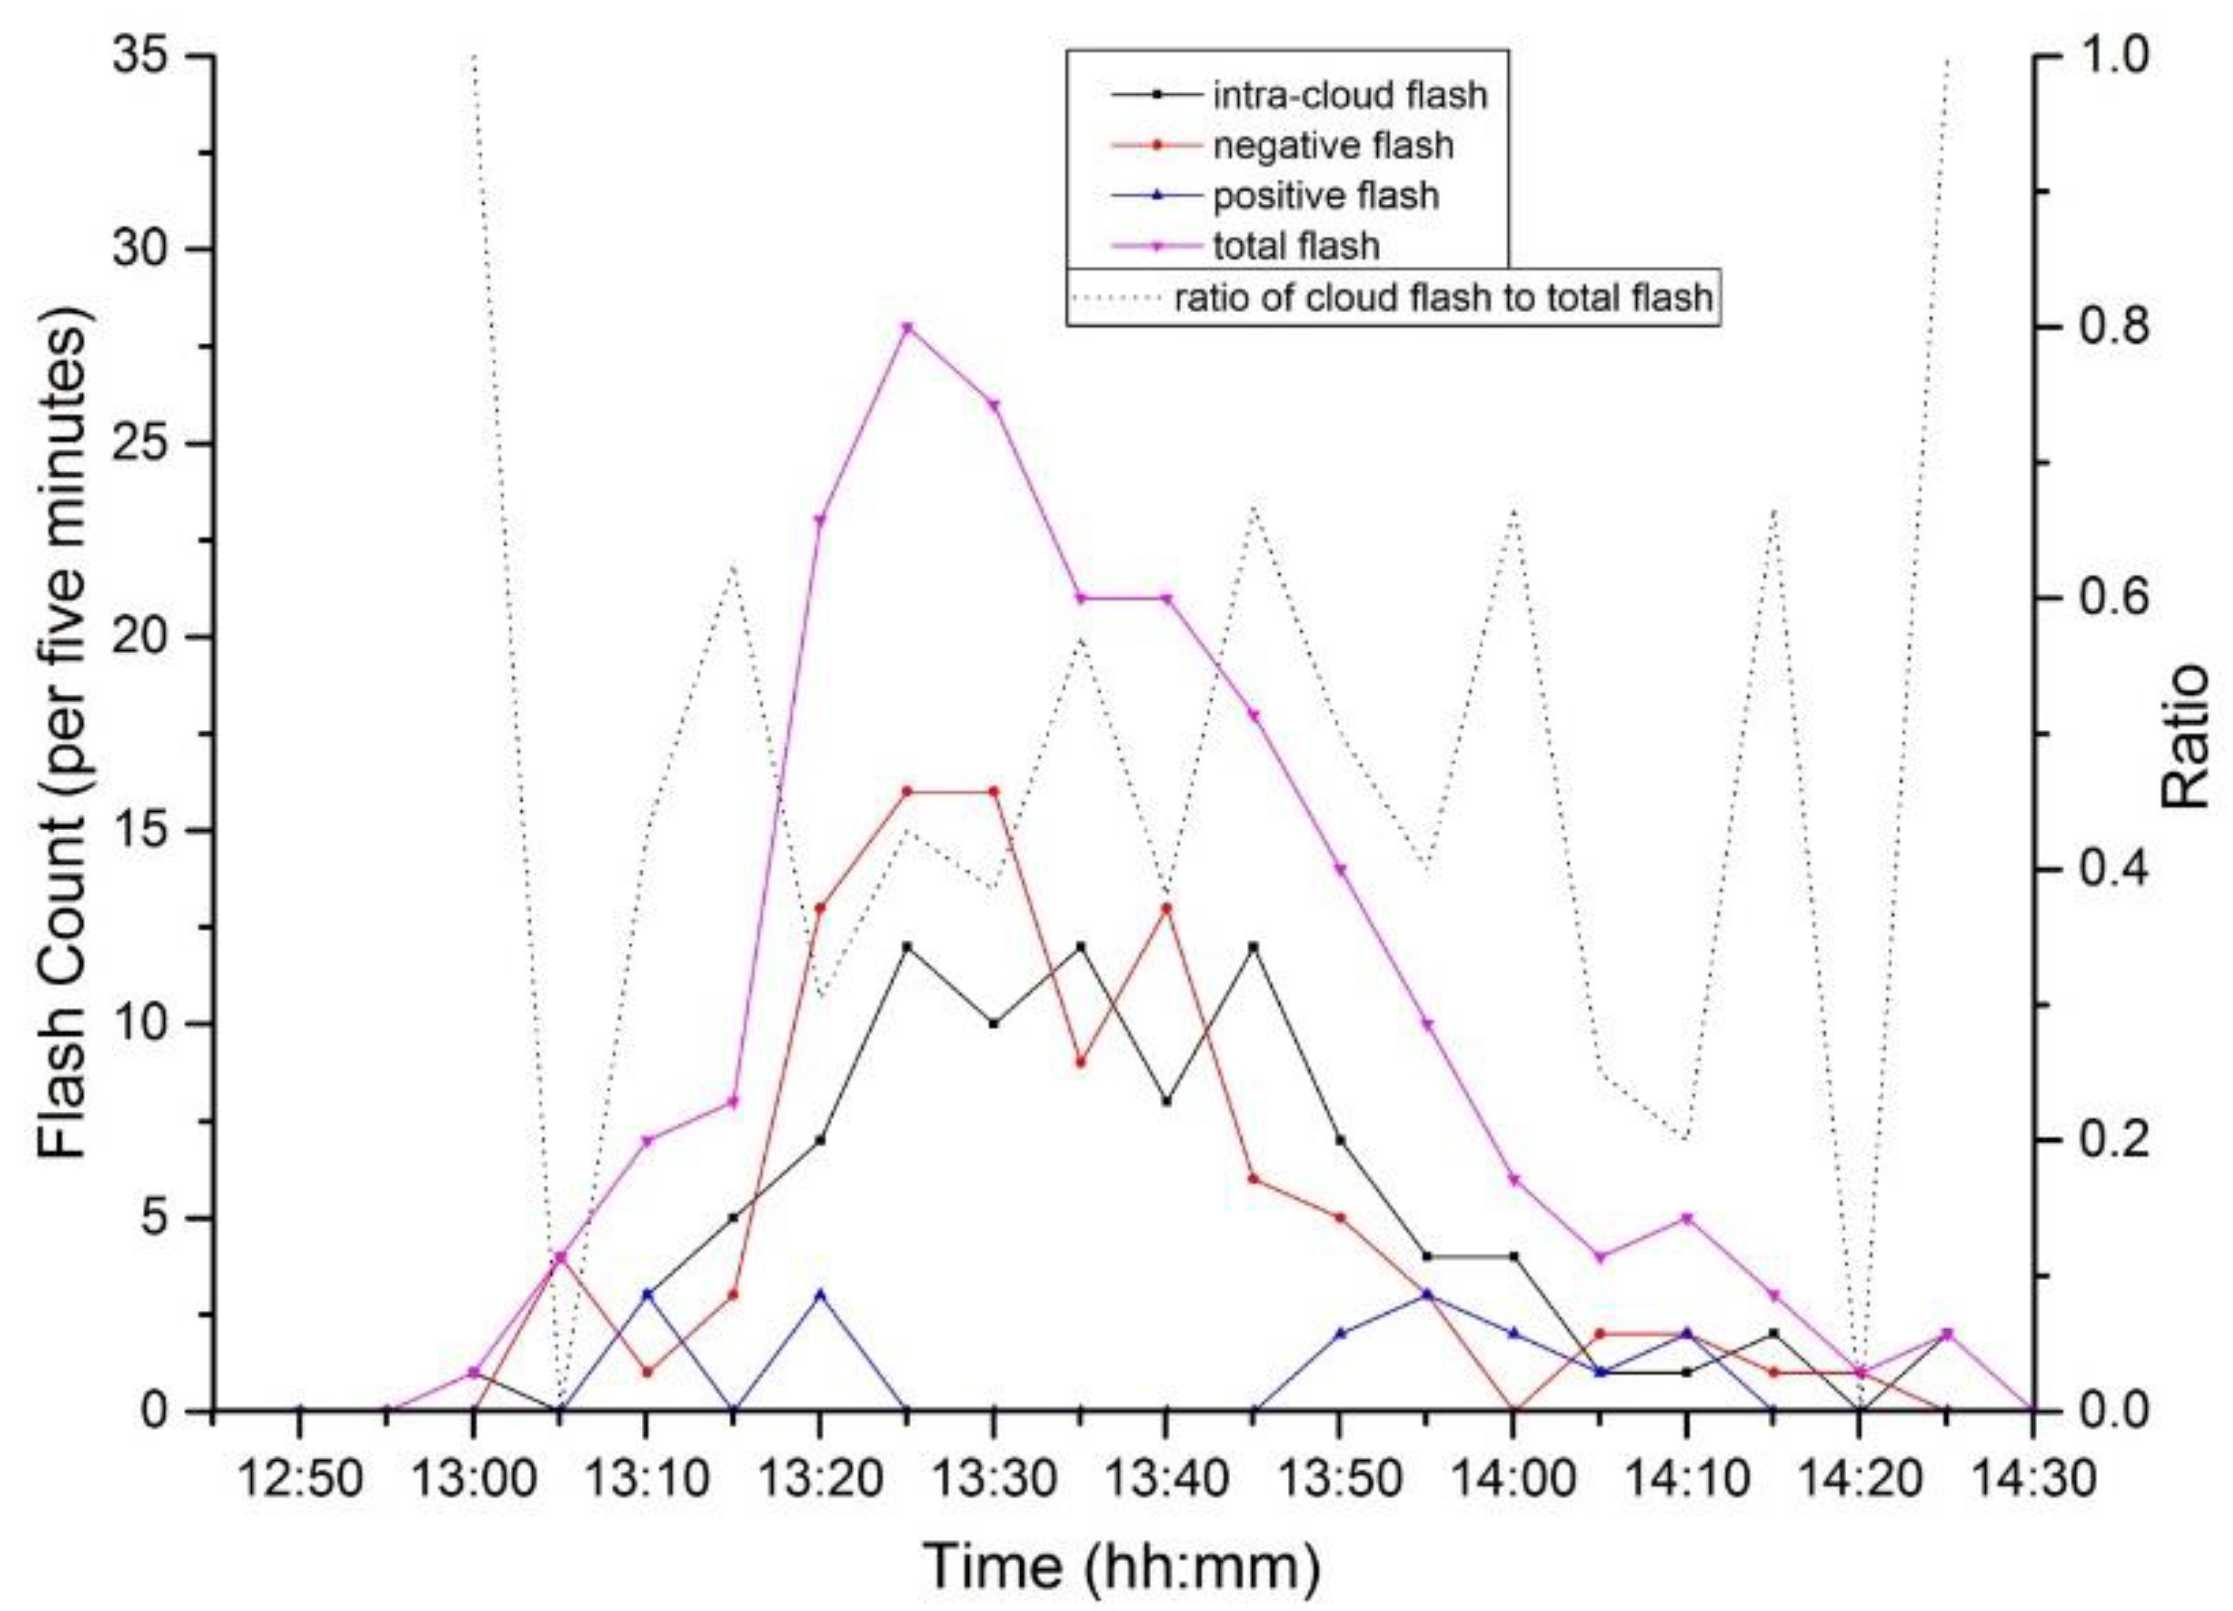
30]. This characteristic is usually determined by the weather and climate of the country concerned and, for the thunderstorm process studied in this paper, the terrain played a crucial role. To clearly see the lightning flash rate trend and thunderstorm process, and for convenience of comparison with the radar data, lightning flash rate was computed at 5 min intervals, as shown in
Figure 5.
In the initial stage of the thunderstorm process, the lightning flash rate increased rapidly with the growth of thunderstorm cloud; and with the development of Cell III, the lightning flash rate jumped sharply, from 7 times per 5 min at 13:10 to 23 times per 5 min at 13:20. The total flash frequency reached its peak value of 28 times per 5 min at around 13:25 and maintained a more frequent state of 21 times per 5 min or more in the following period from 13:25 to 13:40. About half of the lightning flashes occurred between 13:20 and 13:40, averaging 24 times per 5 min. After 13:40, the 40 dBz echo peak height of Cell III decreased rapidly (as shown in
Figure 4), with the cell structure loosening gradually and the cloud anvil area diffusing rapidly outward. The total flash frequency quickly reduced from the steady state of 21 times per 5 min in the peak stage, decreasing linearly in the following 25 min. It decreased to four times per 5 min at 14:05, after which the lightning discharge event occurred sporadically and disappeared gradually.
During the whole thunderstorm process, 92 cases of cloud flash events were detected, and the proportion of ground flash discharge events to total flashes reached 54.5%. That is, the ratio of cloud to ground flashes was close to 1:1, especially between 13:10 and 14:00, and the proportion of cloud flashes basically hovered around 50%. As shown in
Figure 5, another feature of the lightning flash rate statistics was that the positive lightning concentrated in two stages: between 13:00 and 13:20 in the early stage of thunderstorm cloud development, a total of six cases of positive lightning were detected; and during 13:40 to 14:10 in the later stage of thunderstorm cloud development, nine cases of positive ground flashes were detected. This latter stage also happened to be the stage of forced uplift and reinforcement of Cell III after its brief weakening. Accordingly, between 13:20 and 13:40, no positive ground flashes were detected in the stronger phase of Cell III’s development.
The total flash frequency kept a steady downward trend during the forced uplift of Cell III by the southern mountains, and no more lightning discharge events occurred due to the re-enhancement of thunderstorm clouds.
4.2. Physical Characteristics of Lightning
For the 202 lightning flashes detected during the whole process, the duration of the intracloud discharge process before the first return stroke of the ground flash and the frequency of the return stroke of the ground flash were statistically analyzed (
Table 1). The results show that the duration of negative ground flashes was generally longer than that of cloud flashes and positive ground flashes. For 92 cases of cloud flashes, the shortest duration was 31 ms and the longest was 640 ms. Meanwhile, the longest duration of negative ground flashes was 905 ms and the shortest was 48 ms, with an average of 432.1 ms, which was nearly 100 ms longer than the average for positive ground flashes. By way of comparison, the duration of lightning over the northeastern Qinghai–Tibetan Plateau is generally shorter than that found for the lightning flashes in the present study, with an average of less than 0.5 s. This may be associated with the higher altitude, smaller scale of the charge layer, lower tropopause relative to the ground, and lower convective instability energy, the combined effects of which lead to weaker thunderstorms in this region [
18,
31].
The intracloud discharge process before the first return stroke of a ground flash is mainly composed of the initial breakdown, the step leader, and the in-cloud development process. The statistical results of 87 negative ground flashes and 15 positive ground flashes showed that the positive ground flashes needed a longer “preparation time” than their negative counterparts to trigger the return stroke. To some extent, this may explain why the energy released by the return stroke of a positive ground flash is larger than that of a negative one. Zhang et al. [
5] studied the characteristics of the three-dimensional development and evolution process of lightning in this area by using LLR system. They believed that the intra-cloud discharge process is an important condition for generating positive lightning, providing energy for lightning initiation, and thus generating positive ground flash. The duration of the positive ground flash intra-cloud discharge process counted in this paper is slightly longer than that of the negative ground flash, while the energy released by the first return stroke of the positive ground flash is larger than that of the negative flash, which indirectly proves the point of view of Zhang et al. [
5].
According to the statistics on the number of return strokes, there was only one return stroke for 41 negative flashes during the thunderstorm. The average number of return strokes for all negative flashes was 2.41, and there was only one return stroke for all positive flashes.
The results reported in this section are in good agreement with previous statistical data on lightning characteristics in nearby areas [
31,
32,
33]. It is generally accepted that thunderstorm processes in plateau areas are mostly weak, meaning the accumulated charge is released after one or two return strokes and it takes a relatively long time for sufficient energy to be accumulated for another discharge, manifesting as a lower lightning flash rate.
5. Charge Structure of the Thunderstorm Cell
As mention above, the charge structure of a thunderstorm cloud can be inferred from the location of the lightning discharge radiation source, since the radiation signal excited by the negative leader of lightning is generally stronger than the signal excited by the positive leader. Therefore, the radiation source excited by the negative leader is denser from the result of the radiation location, and the distribution sequence of the radiation source can be used to infer the charge structure of the thunderstorm cloud [
1,
23,
25,
26,
27,
28]. Based on this idea, we identified all the VHF radiation location points during the whole thunderstorm process, at 5 min intervals, to produce height spectrum distribution statistics (the whole process of positioning a total of 94,797 radiation sources)—more specifically, the number of radiation sources per 200 m accounting for the proportion of all radiation sources in each 5 min interval—and then drew a VHF radiation source height–density distribution contour map for the whole thunderstorm process. In this paper, we analyze the charge structure and evolution process of Cell III, which lasted about 2 h from generation to extinction. The hail process generated by the cell, and most lightning discharge events occurred between the charge layers of this cell during the whole storm process.
5.1. Overall Charge Structure
As shown in
Figure 6, the radiation source was mainly concentrated in the height layer of 2–4 km during the whole thunderstorm process. According to the relationship between the radiation source and the charge structure, it can be considered that there was a relatively stable positive charge region in this height layer during the whole thunderstorm process. Based on the sounding data of Xining Meteorological Bureau, 60 km from the station network, at 12:00, the height of the main temperature layer in thunderstorm cloud was estimated, revealing the main radiation source to be concentrated between 0 °C and −15 °C at 2–4 km. It can also be clearly seen from the figure that some radiation sources were occasionally concentrated in the height layer of about 6 km, close to the temperature layer where −26.5 °C was located, and the proportion of radiation sources in this layer was not as dense as the positive charge area in the lower part. However, the concentration center of radiation sources in the height layer of 6 km could also be clearly seen from a comparison between the upper layer and the lower layer, and thus it can be speculated that there was a positive charge concentration area in this height layer. The proportion of radiation sources was small in the range between the upper positive charge region and the lower main positive charge region, and negative charges accumulated in this high layer. The height of the negative charge layer is centered on the height level corresponding to −20 °C, showing different degrees of tilt distribution at different stages of thunderstorm. During the whole process, Cell III maintained the middle negative charge region, and there was a positive charge region in the upper and lower part of the tri-polar charge structure, with the main discharge event occurring between the middle negative charge region and the lower positive charge region.
As can be seen in
Figure 6, the upper radiation source concentration area was much smaller than the lower 2–4 km concentration area. This was because, in Cell III, the number of lightning flashes that occurred between the upper positive charge region and the middle negative charge region was small. Therefore, in a given 5 min period, from the radiation source height distribution statistics, the proportion of radiation sources in this area was relatively small. In other words, this method can to some extent intuitively show the density of the radiation source in different height layers, and is effective for characterizing the charge layer mainly involved in the discharge of the thunderstorm cell. However, the disadvantage is that, when a certain charge layer rarely participates in the discharge, the radiation source of this height layer will be masked by the radiation source of the main discharge charge layer within a given 5 min interval, which is not conducive to analyzing the polarity of the charge layer at this height. In addition, when the charge layer itself tilts, there will be a large error in the analysis of the charge structure when using this method. Therefore, to obtain a more detailed thunderstorm cell charge structure and evolution characteristics, we further analyze the charge structure characterized by lightning flashes.
5.2. Charge Structure Evolution
Here, we choose three typical stages of the development of Cell III to study its charge structure and evolution: the lightning flash rate in the peak period of 13:20–13:25, representing the mature stage of the storm cell; when the cell was forced to rise again by the mountain between 13:45 and 13:50, representing the stage when hail began to grow; and between 14:15 and 14:20, when the cell crashed quickly after the hail had fallen.
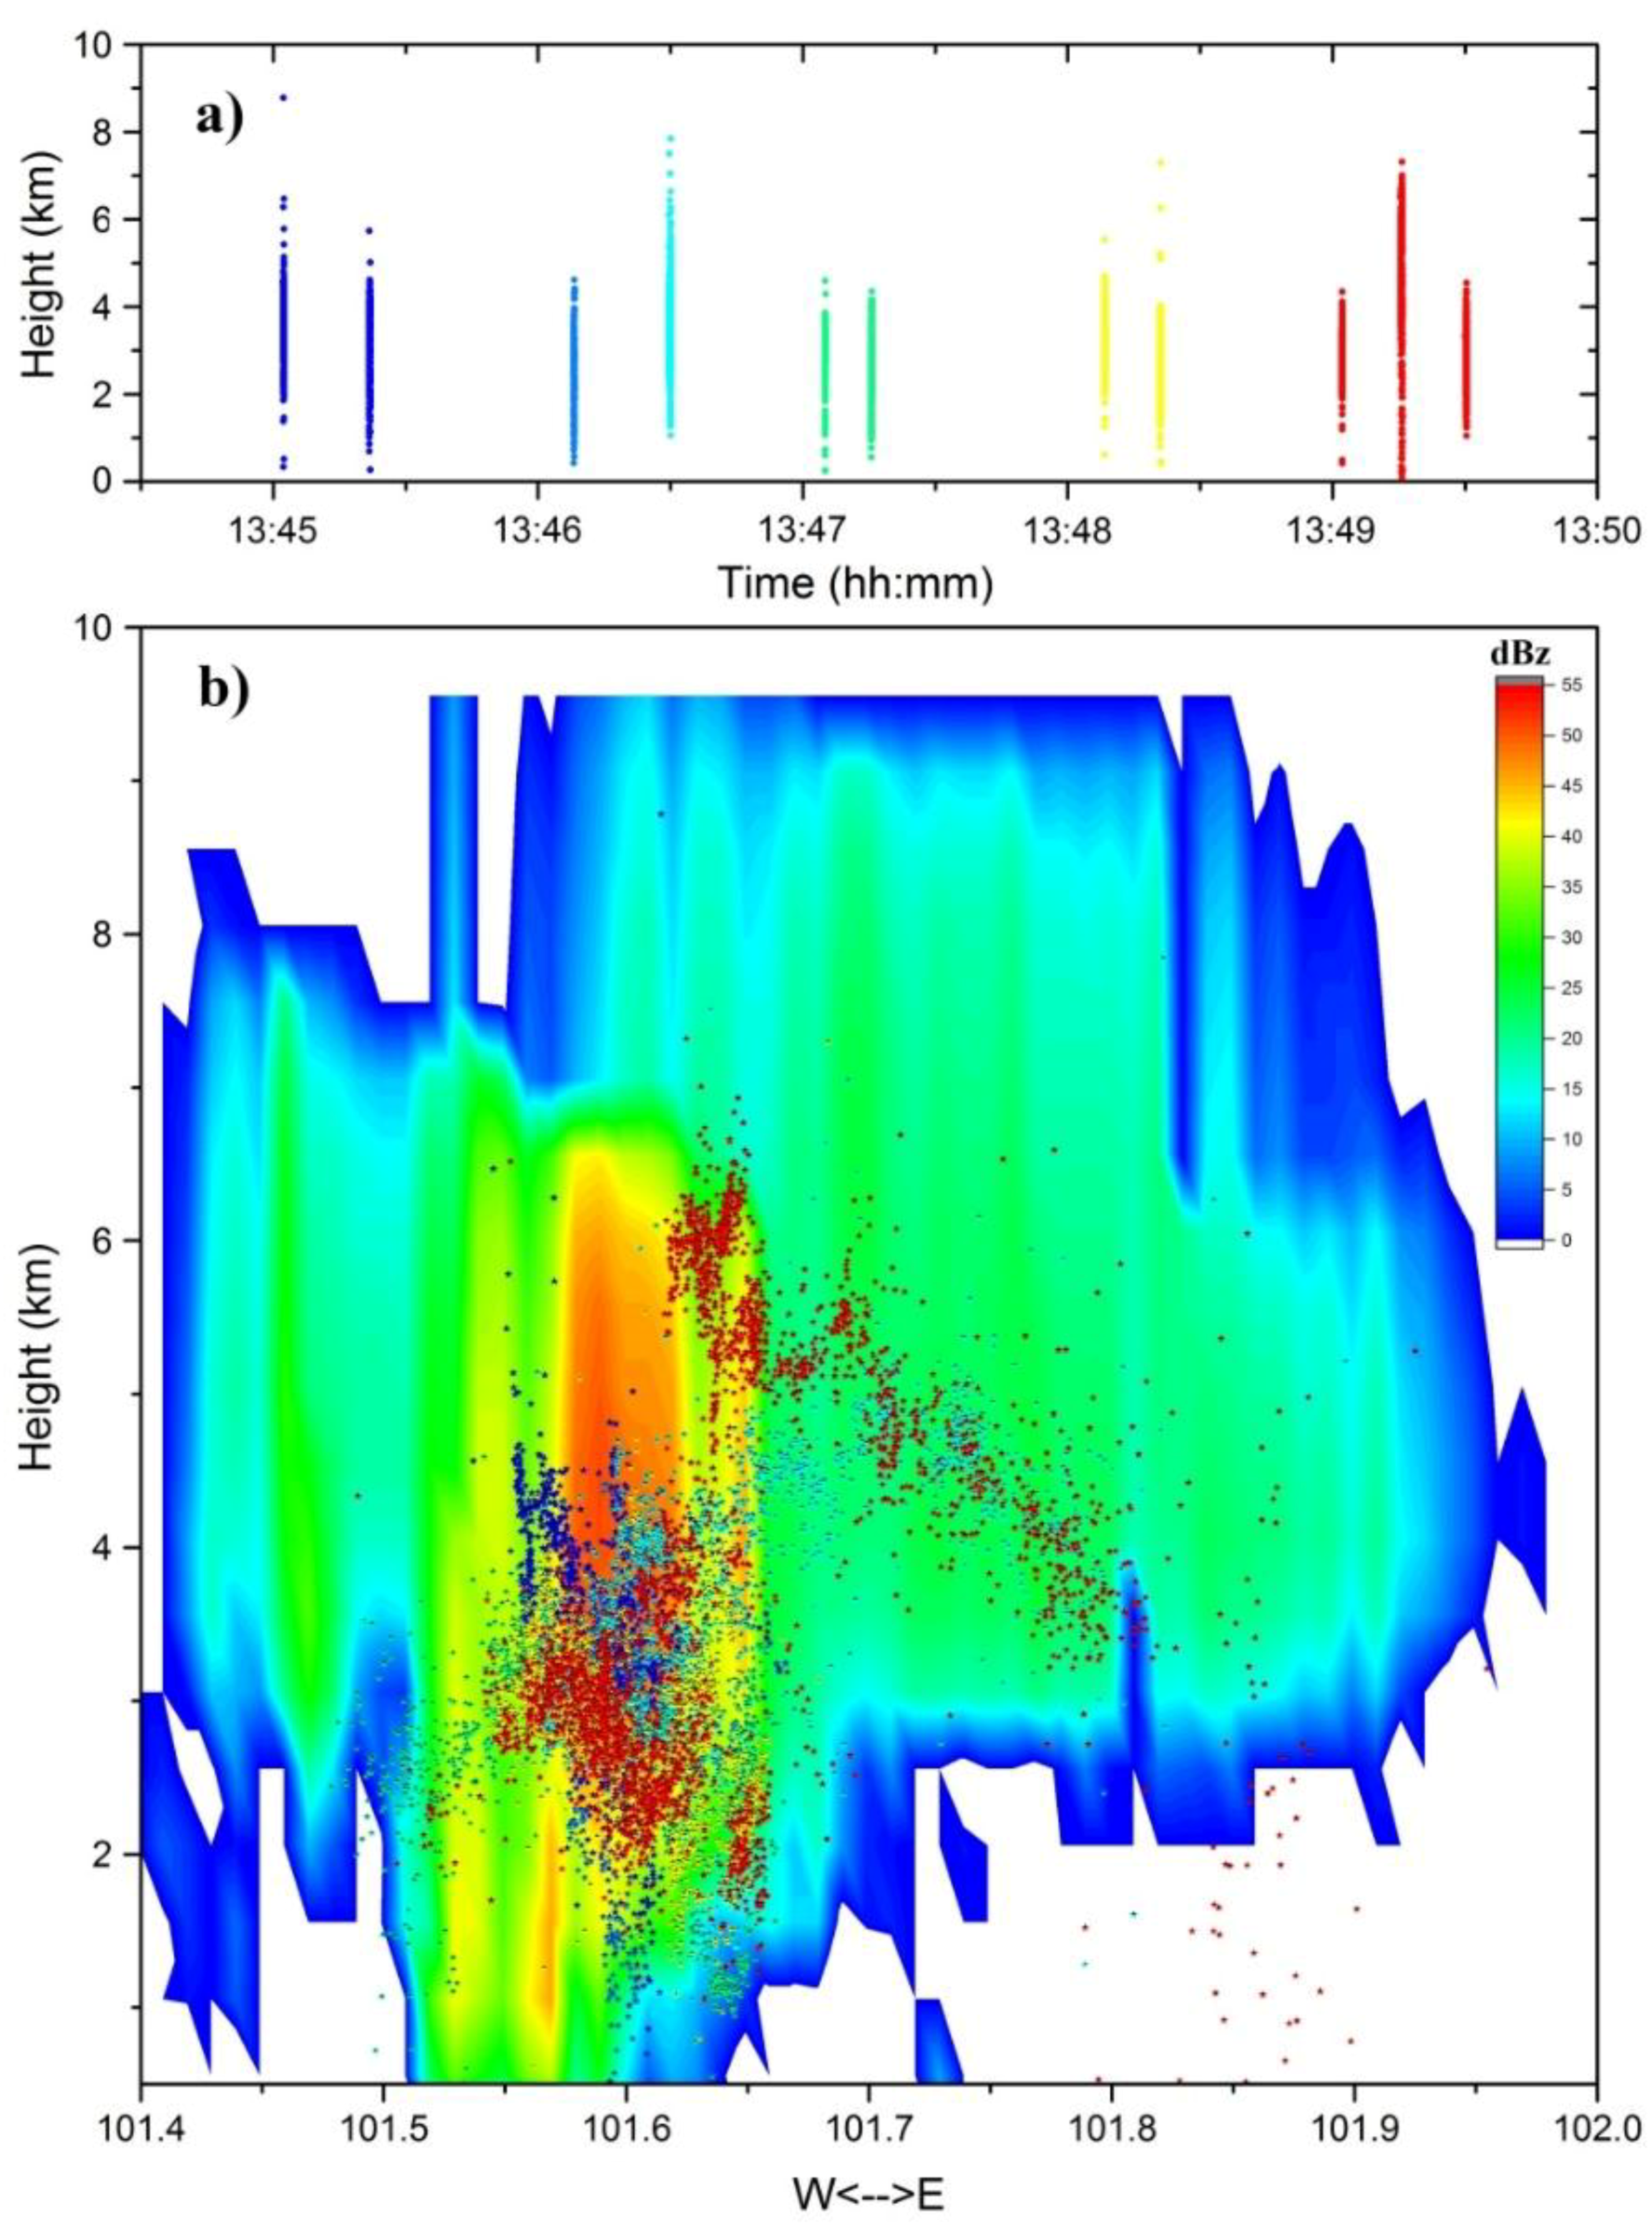
5.2.1. From 13:20 to 13:25
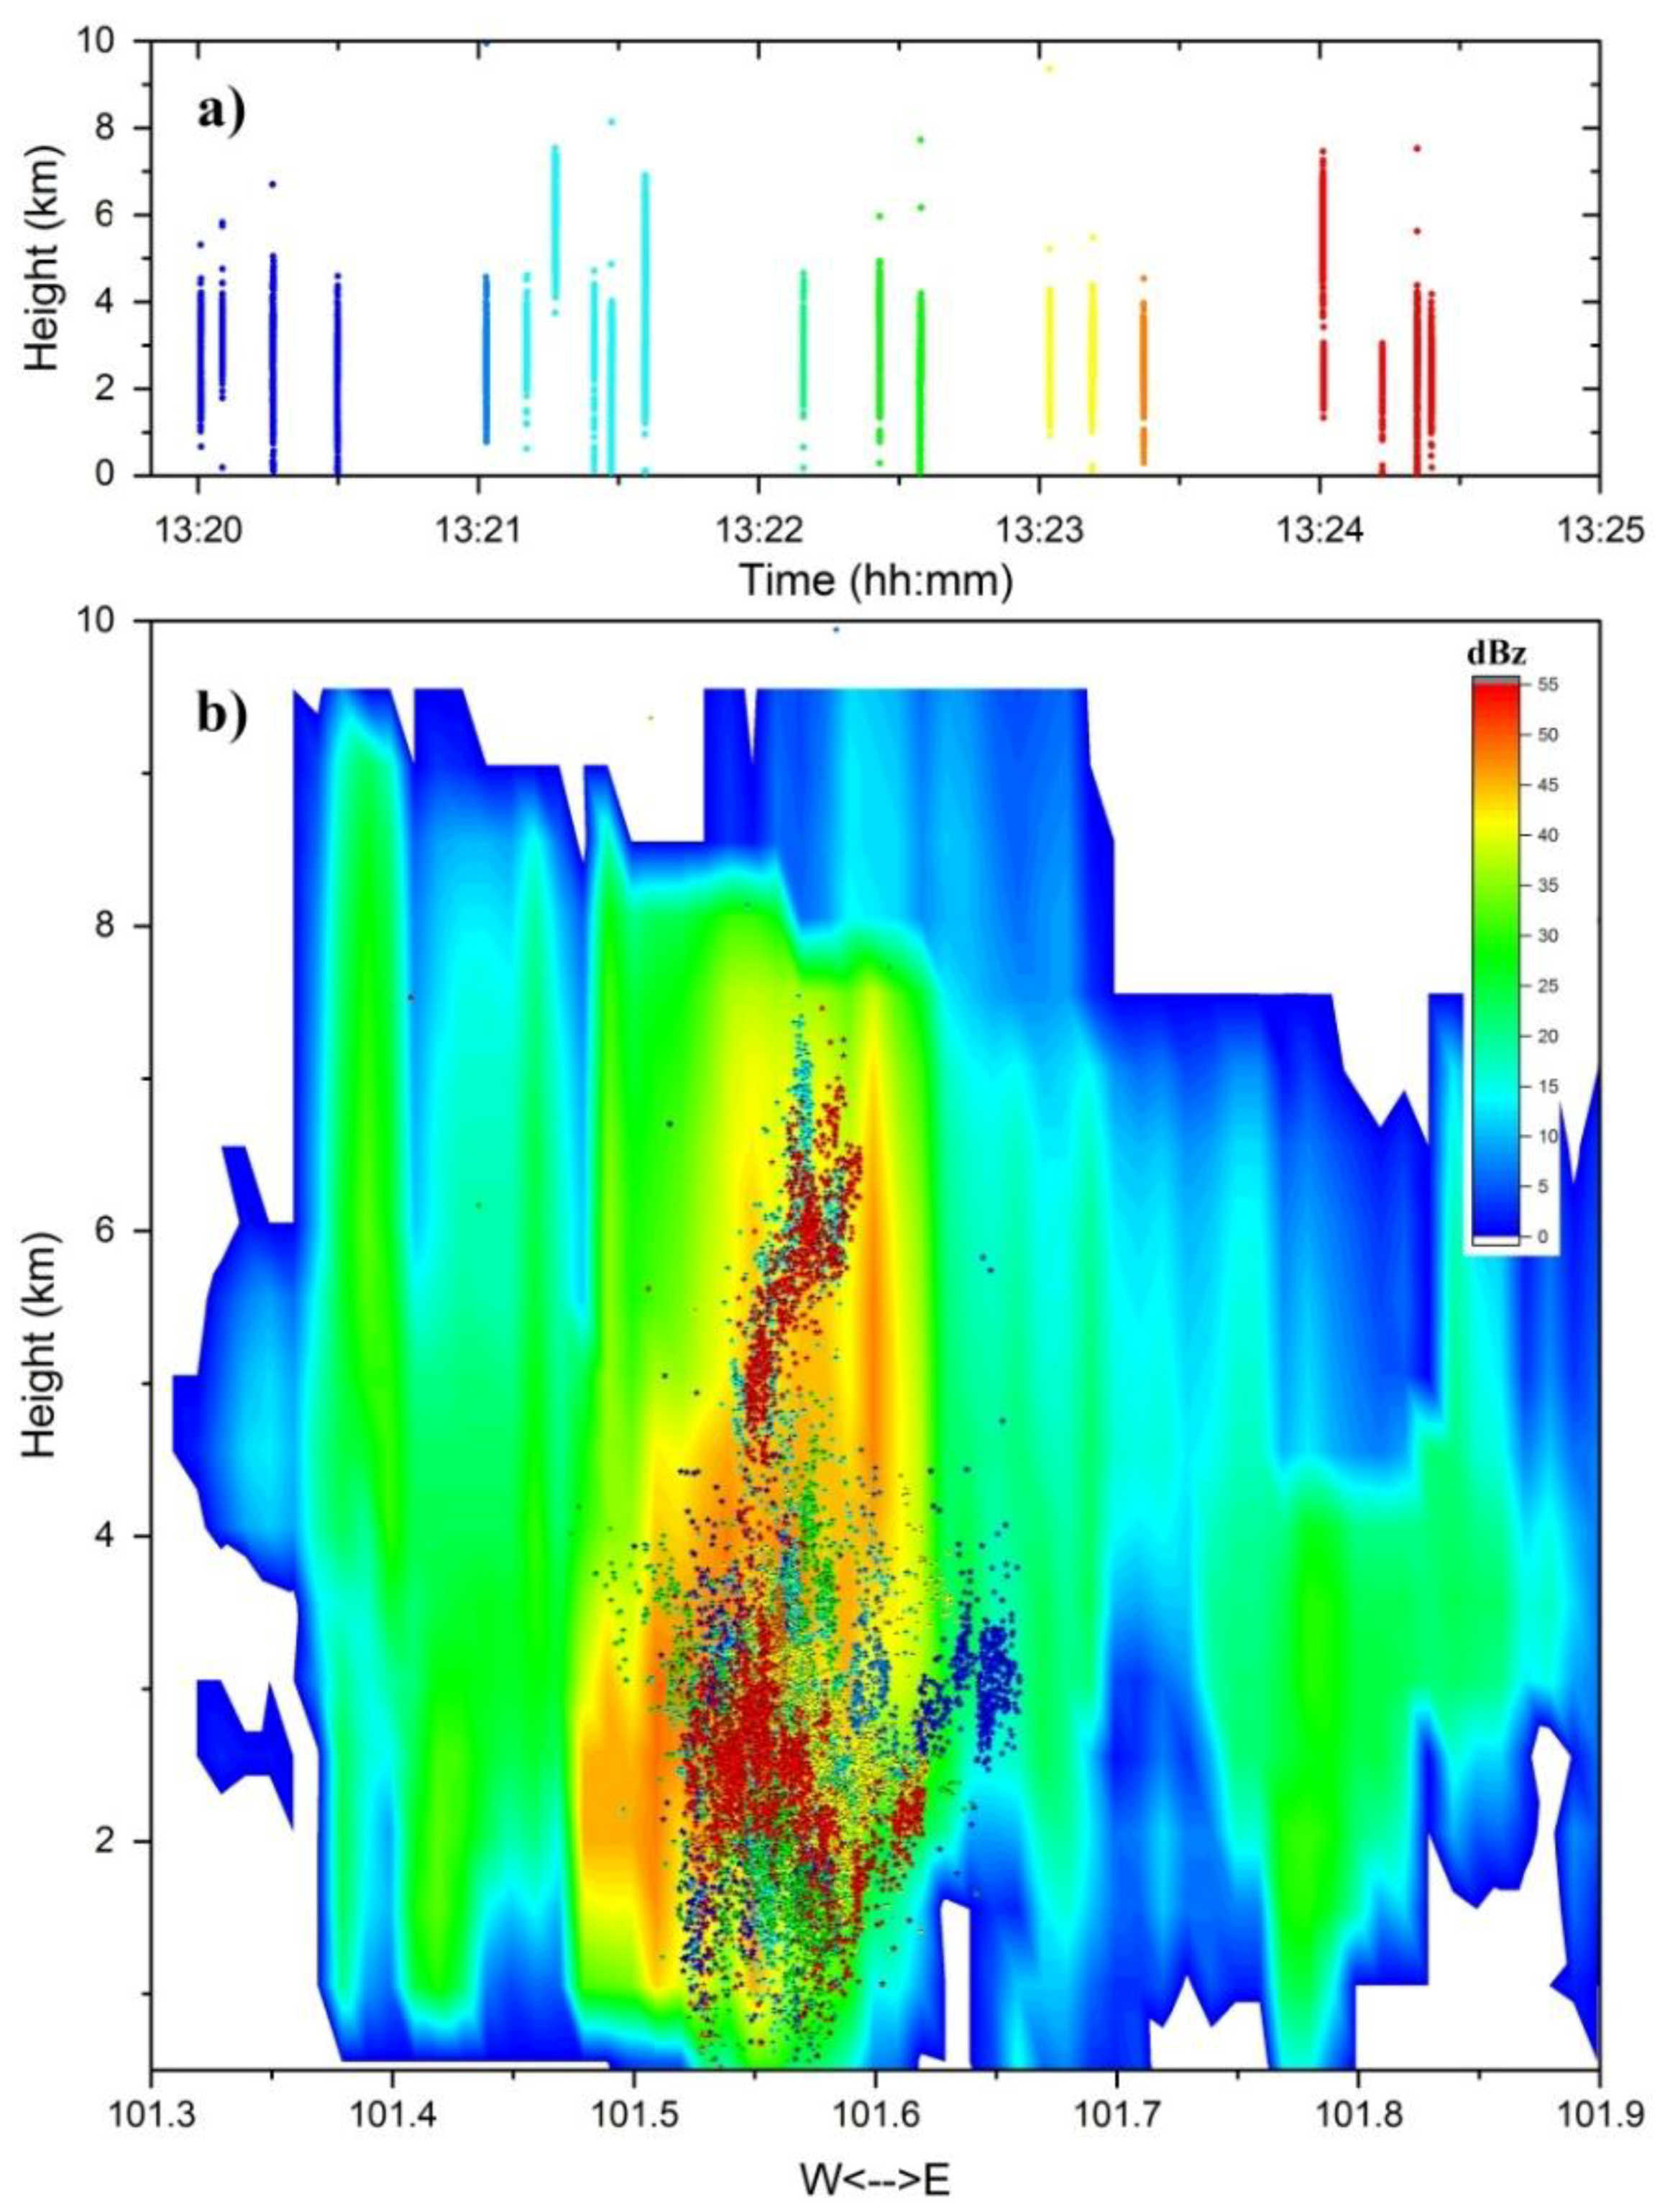
As can be seen from the positioning results of the radiation sources in
Figure 7, most of the lightning events occurred between the middle negative charge region and the lower positive charge region in this stage, and the storm cell in this stage had a very clear vertical structure. The radiation source was very dense and had a large range below 4 km in the lower part of the cell. The radiation source in the upper positive charge region of the cell had clear linear distribution characteristics vertically. The suggestion, therefore, is that the stronger updraft in this stage made the positive charge in the upper region dense along the airflow direction, allowing it to extend upwards to around the echo peak height of 40 dBz.
For this phase, we depict the main structure of the radar echo reflectivity of the cell greater than 20 dBz and describe the charge region stratification of the cell according to the distribution characteristics of the radiation sources in
Figure 7. There was a clear vertical stratification of the charge structure in this stage, and the boundary of the charge layer was also distinct. Generally speaking, a thunderstorm cell has a tripolar charge structure, in which the upper and lower regions are positive charge regions and the middle region is negative. Here, according to the distribution of the radiation source, the lower positive charge area of the cell in this stage covered most of the range below 4 km, and the radiation source distribution was relatively concentrated, indicating that the lower positive charge region was not only large in range but also highly concentrated in positive charge. On the left-hand side of the lower positive charge region in
Figure 8a, we have also drawn a small negative charge region, which in
Figure 7 is not shown by the radiation source. In addition, in the corresponding region is a blank region that is largely free of radiation source, in which we consider there to be a small area of negative charge when later discussing the lightning examples. We do not discuss this aspect until then.
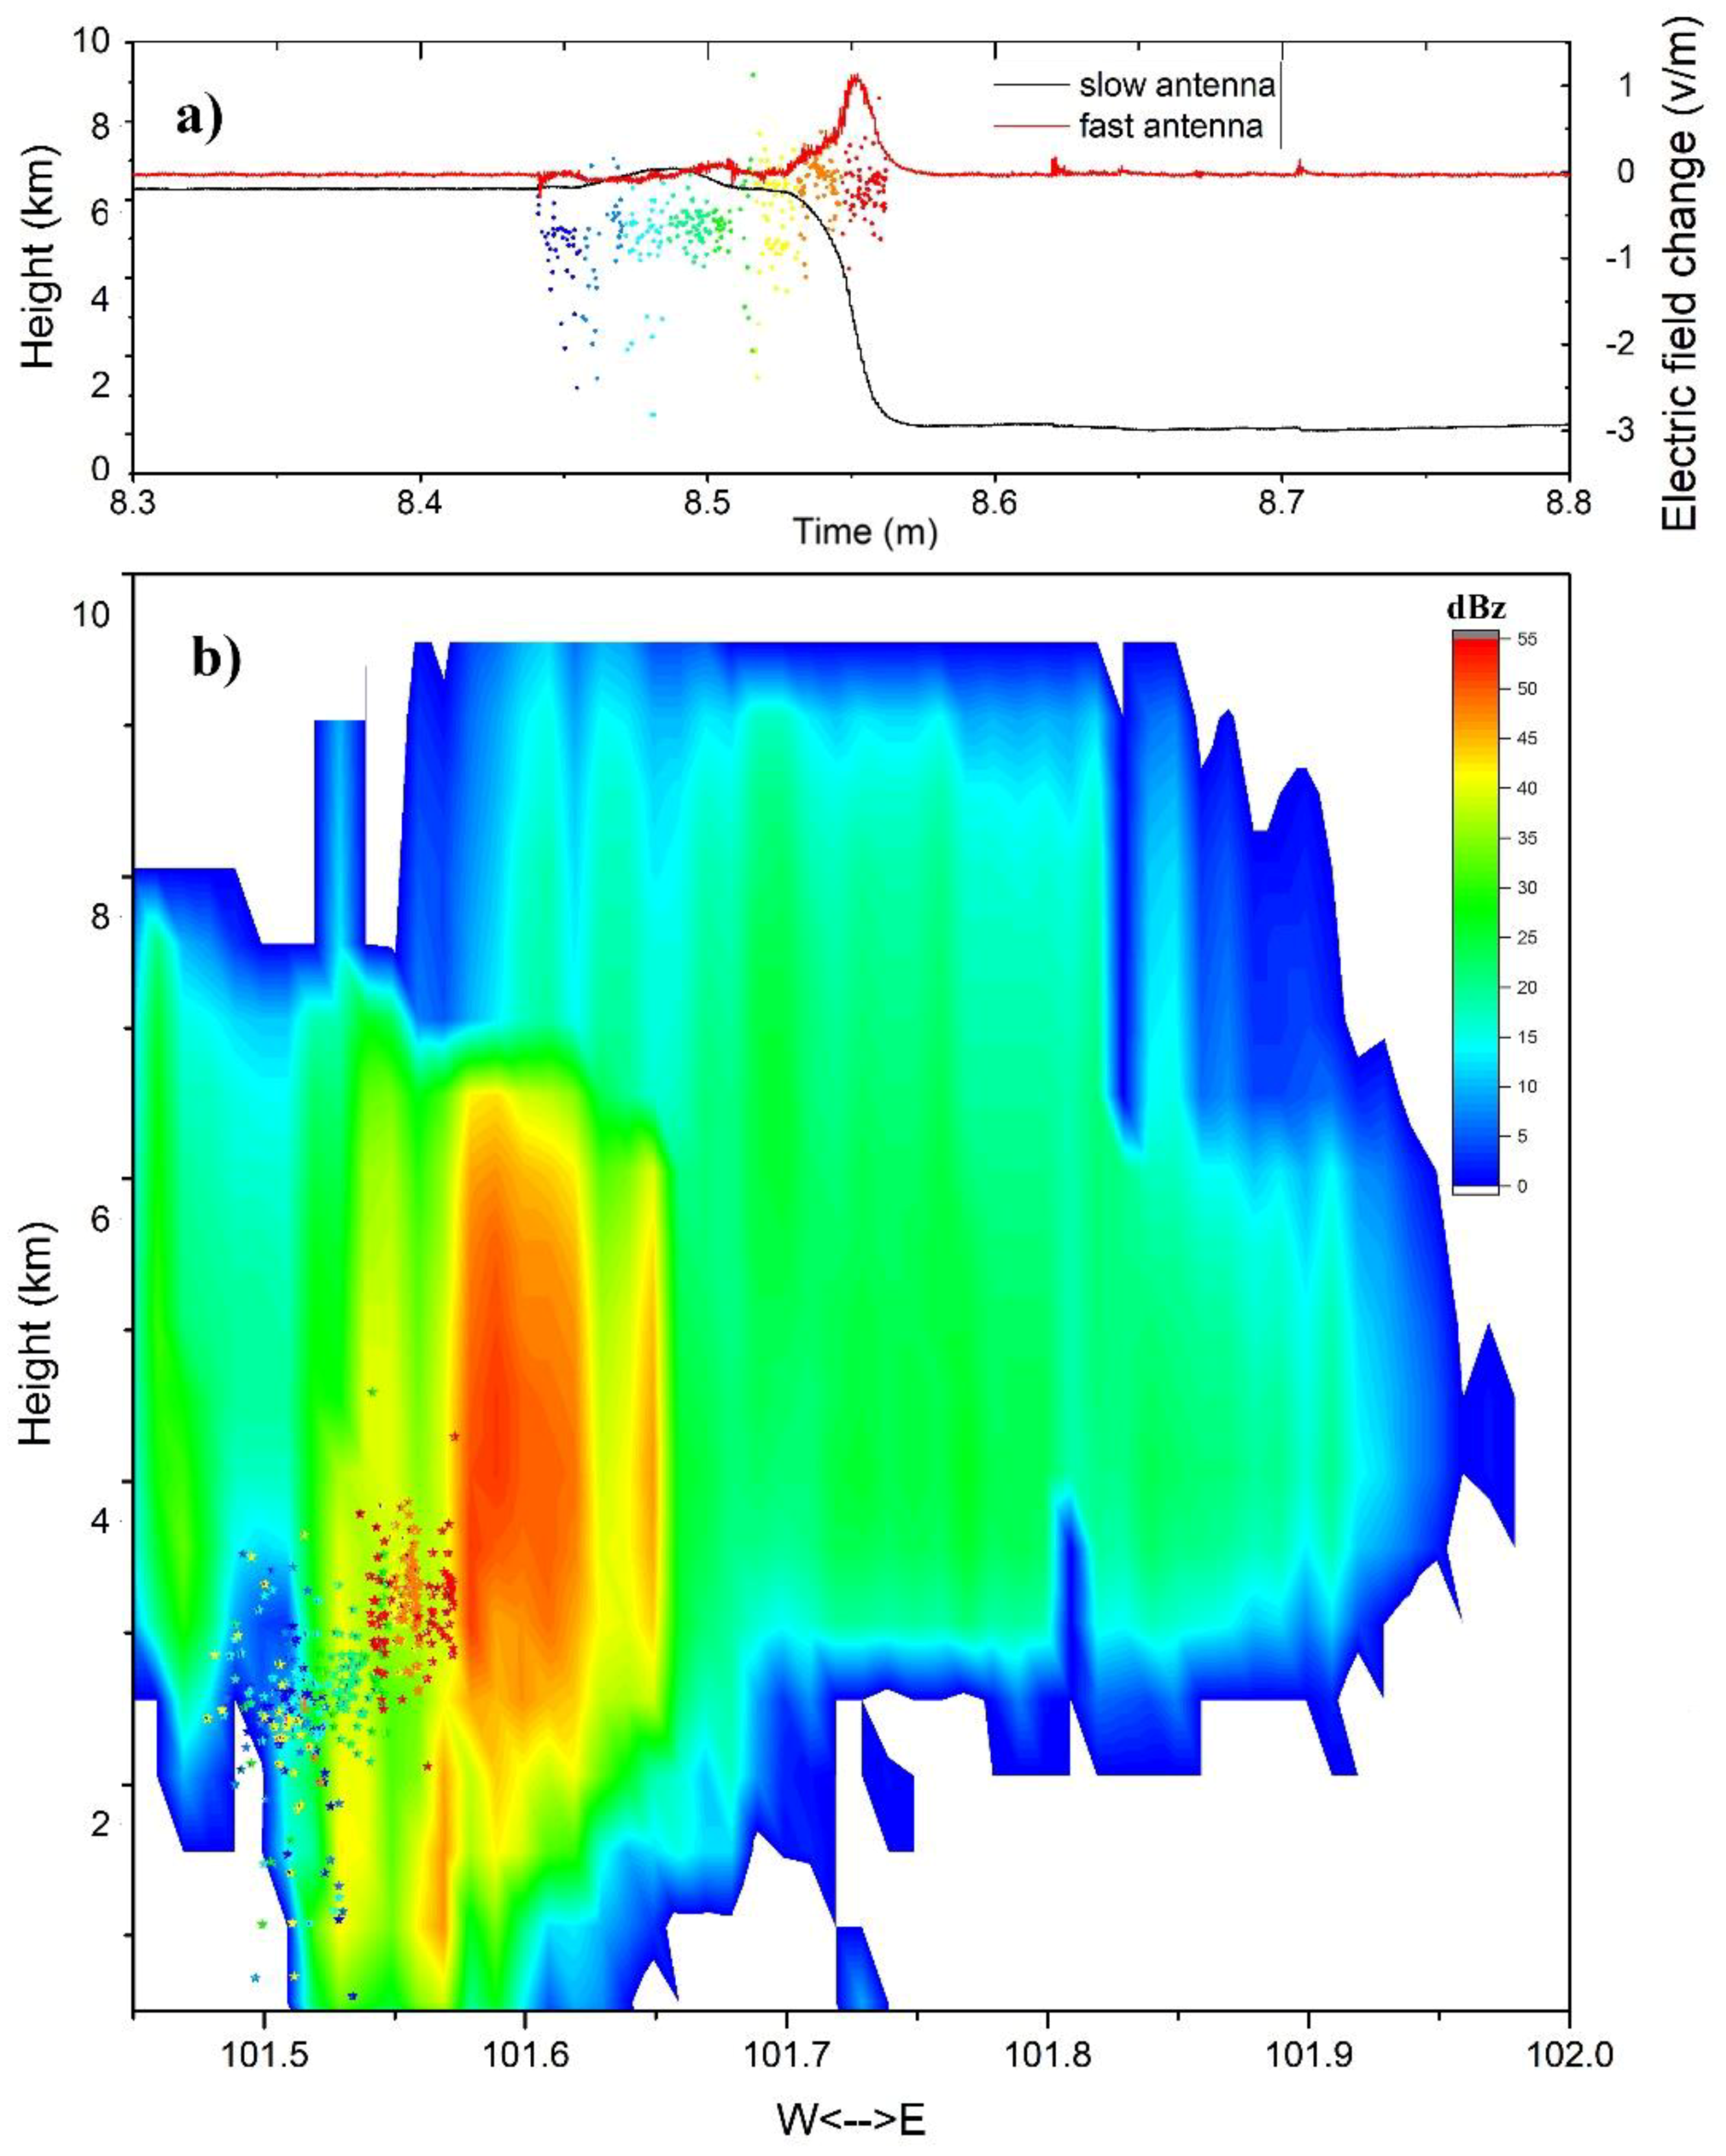
5.2.2. From 13:45 to 13:50
As mentioned earlier, after a short period of weakening from around 13:45, due to the forced uplift of the southern mountain, Cell III began to strengthen again. However, the lightning flash rate trend, which had been decreasing rapidly (lightning flash rate of less than 15 times per 5 min), did not change. In this stage, the cell’s anvil structure was very obvious; however, owing to the effect of mountain uplift, the 40 dBz echo top rose rapidly (
Figure 9)—to even higher than in the stage shown in
Figure 7—but the vertical development of the cell did not lead to an increase in lightning flash rate: the period from 13:20 to 13:25 was the peak phase of lightning flash rate during the whole process.
Although the number of lightning flashes in this stage reduced, the characteristics of Cell III were very clear. Due to the development of the cloud anvil, the charge structure of the cell had a significant tilt, with the upper positive charge region along the cloud anvil tilt direction extending to a wider range. At the same time, several radiation sources occurred in the blank area to the left of the lower positive charge region of the cell in
Figure 7, all from the positive ground flash numbered 134708 (as shown in
Figure 10).
The positive ground flash No. 134708 originated at a height of about 3 km and experienced a cloud development process of about 100 ms. Many negative breakdown radiation sources spread to the lower positive charge region. Only a few radiation points propagated into downwards, and the radiation location results did not show the return stroke channel. This is because the LLR used in this study works in the VHF band with a system center frequency of 270 MHz, and the detection ability for positive lightning breakdown is weak [
6]. Fortunately, we can infer the existence of this small negative charge region in the lower part of the positive charge region by using the fast and slow electric field change data combined with the bidirectional leader model of lightning development.
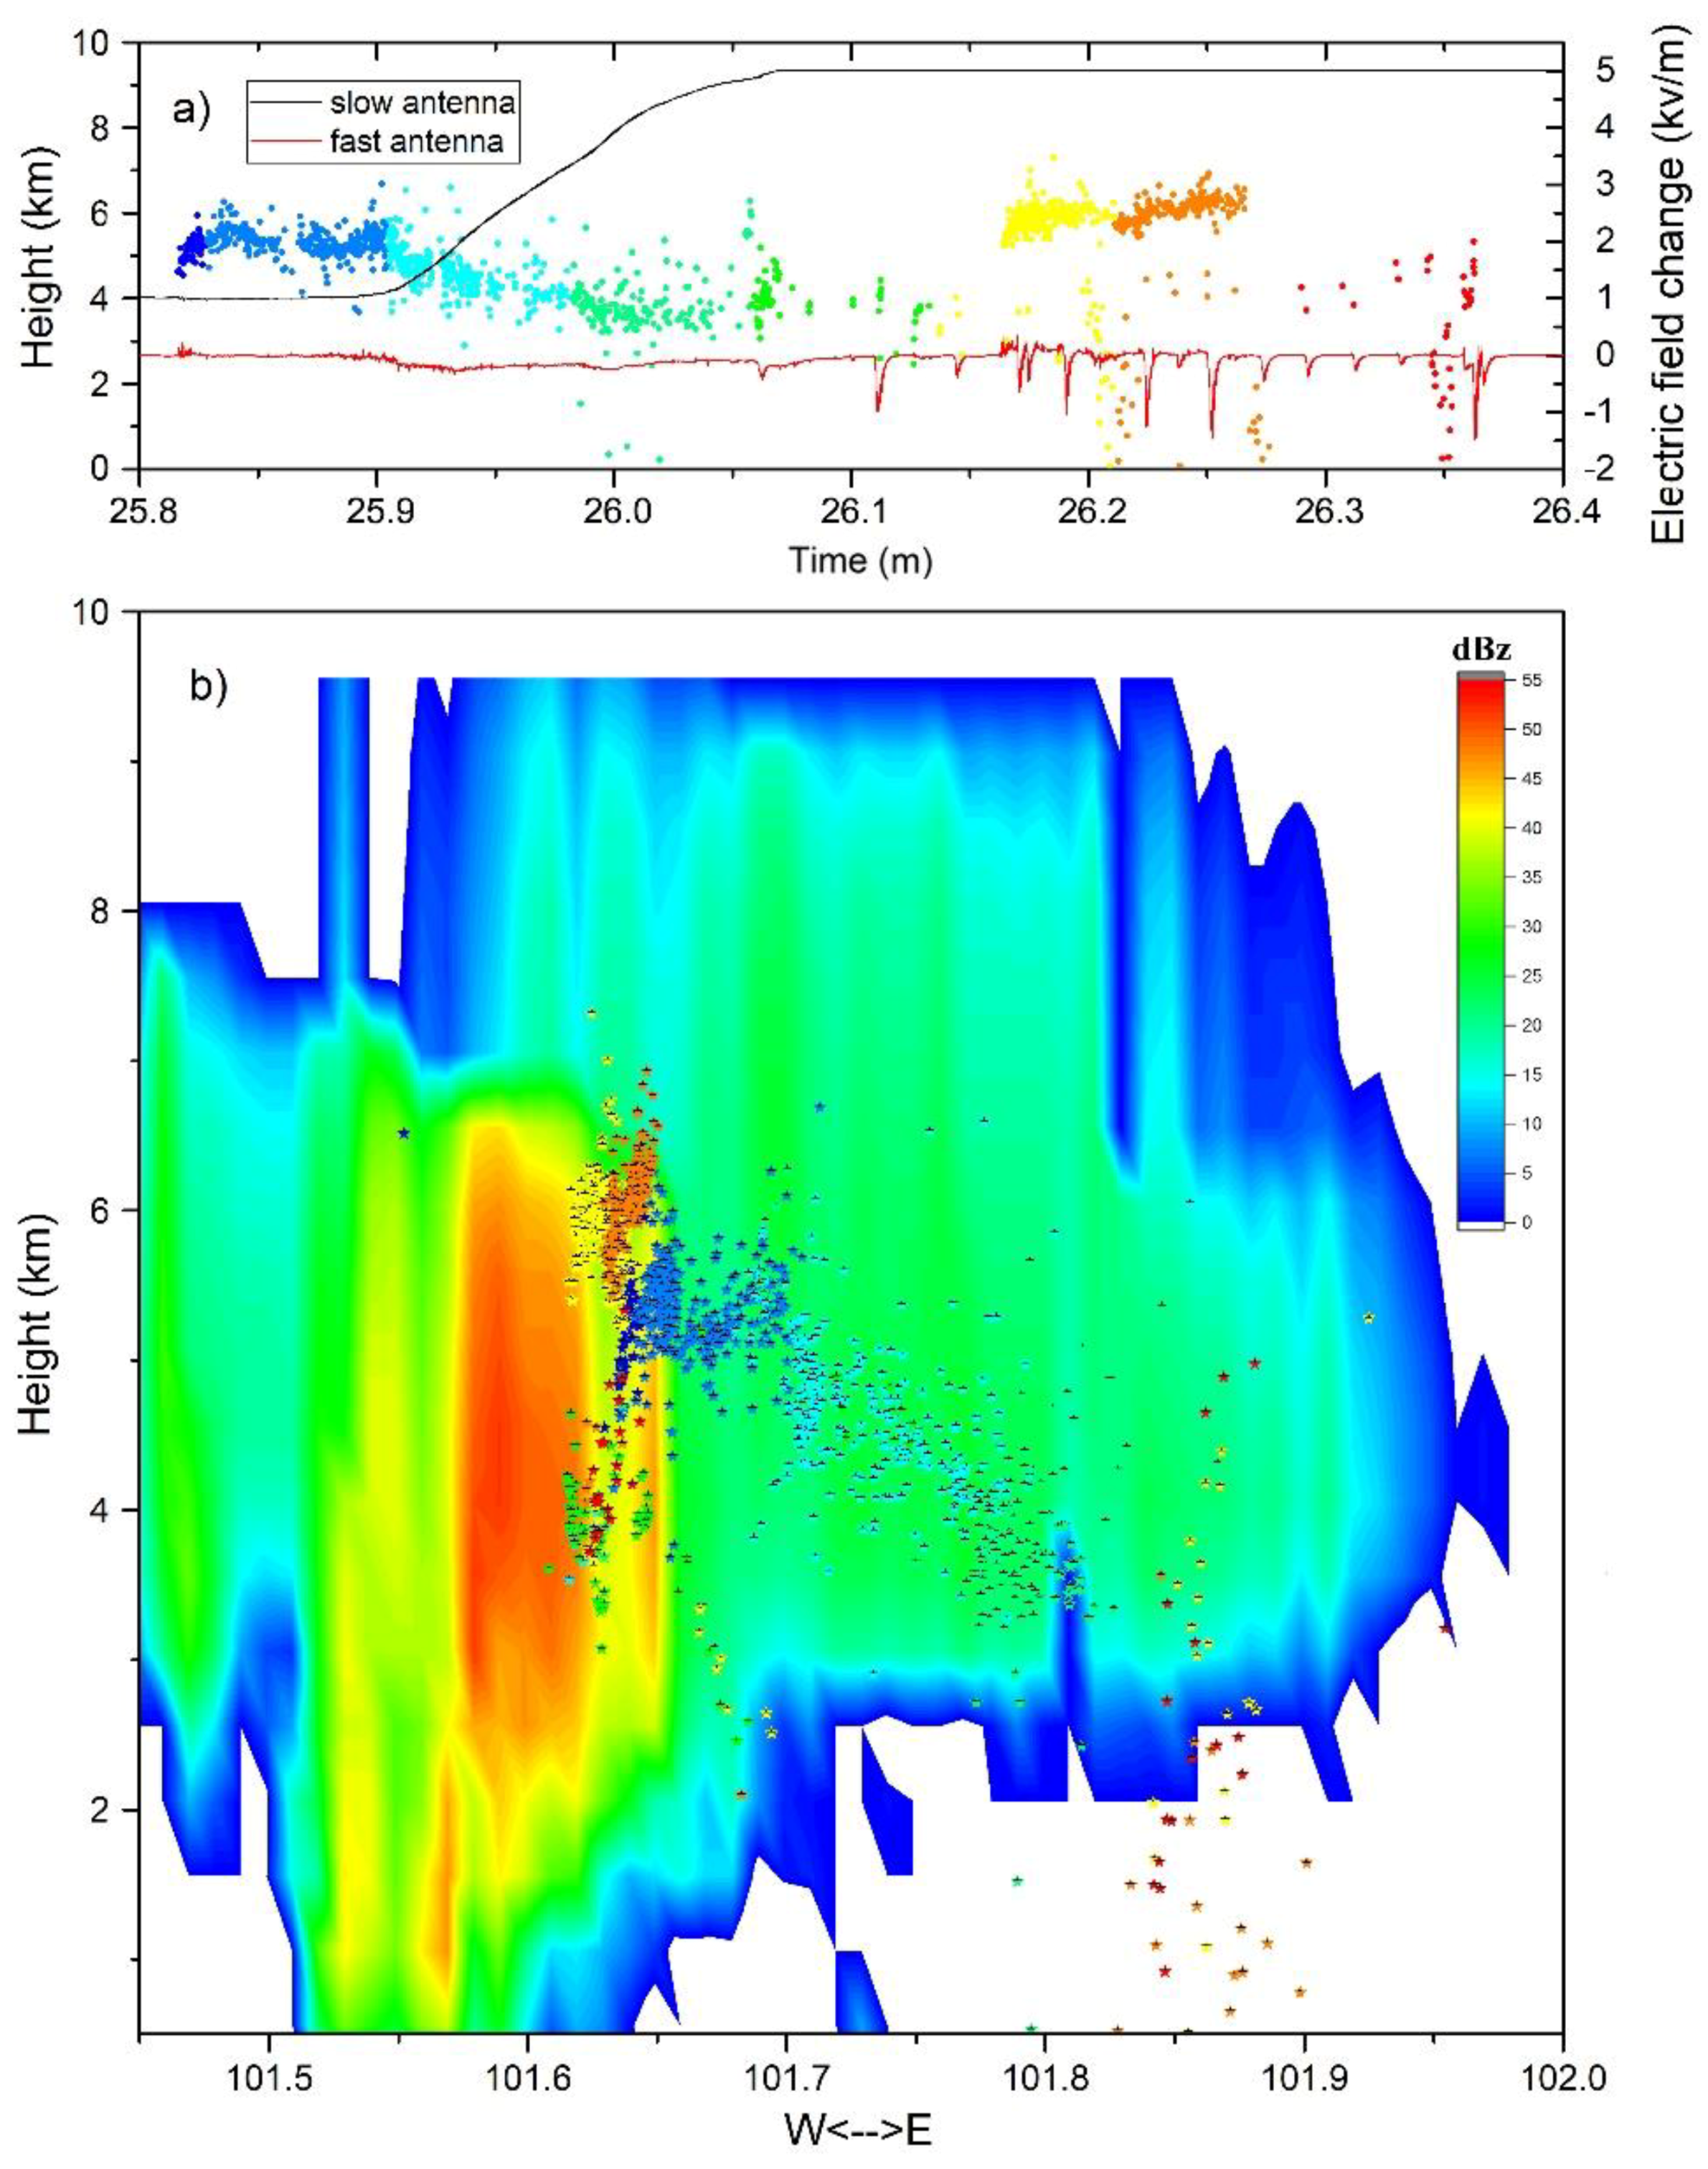
Different from the period 13:20–13:25, the channel of lightning processes discharged between the upper positive charge region and the middle negative charge region developed vertically upward, with the lightning channel between the two charge regions in this stage extending to the cloud anvil region in a larger range. As shown in
Figure 11, the location result of the radiation source of the negative ground flash numbered 134925 was compared with the radar echo, showing that the radiation location result clearly outlined the long development process of the lightning channel in the cloud for nearly 400 ms. The lightning started at a height of about 4.8 km, when the negative leader first developed upward into the upper positive charge region and then gradually expanded outward along the extension direction of the cloud anvil. During this period, it can be clearly seen that the yellow and orange negative leader branches are excited from their initial position of the lightning and propagated upward. From the extension range of the negative leader, the upper positive charge region of this stage expanded over a large area along with the development of the cloud anvil.
As shown previously, we depict the main structure of the thunderstorm cell with radar echo reflectivity greater than 20 dBZ and mark the range of the positive and negative charge region (as shown in
Figure 8b) according to the concentrated area of the VHF radiation source in
Figure 9 and the analysis of the above two lightning events. The charge structure of the cell changed to a certain extent compared to the previous stage. Specifically, due to the forced uplift by the mountain, all levels of the charge structure of the thunderstorm cloud were lifted. The central height of the negative charge region in the middle of the storm cell increased from 4 km to 5.5 km on one side and 3 km on the other side. The whole structure tilted obviously. The positive charge region in the upper part expanded markedly along with the development of the cloud anvil region. During this period, the cell was forced to rise and develop again, but the charge density continued to decrease, meaning the lightning flash rate did too.
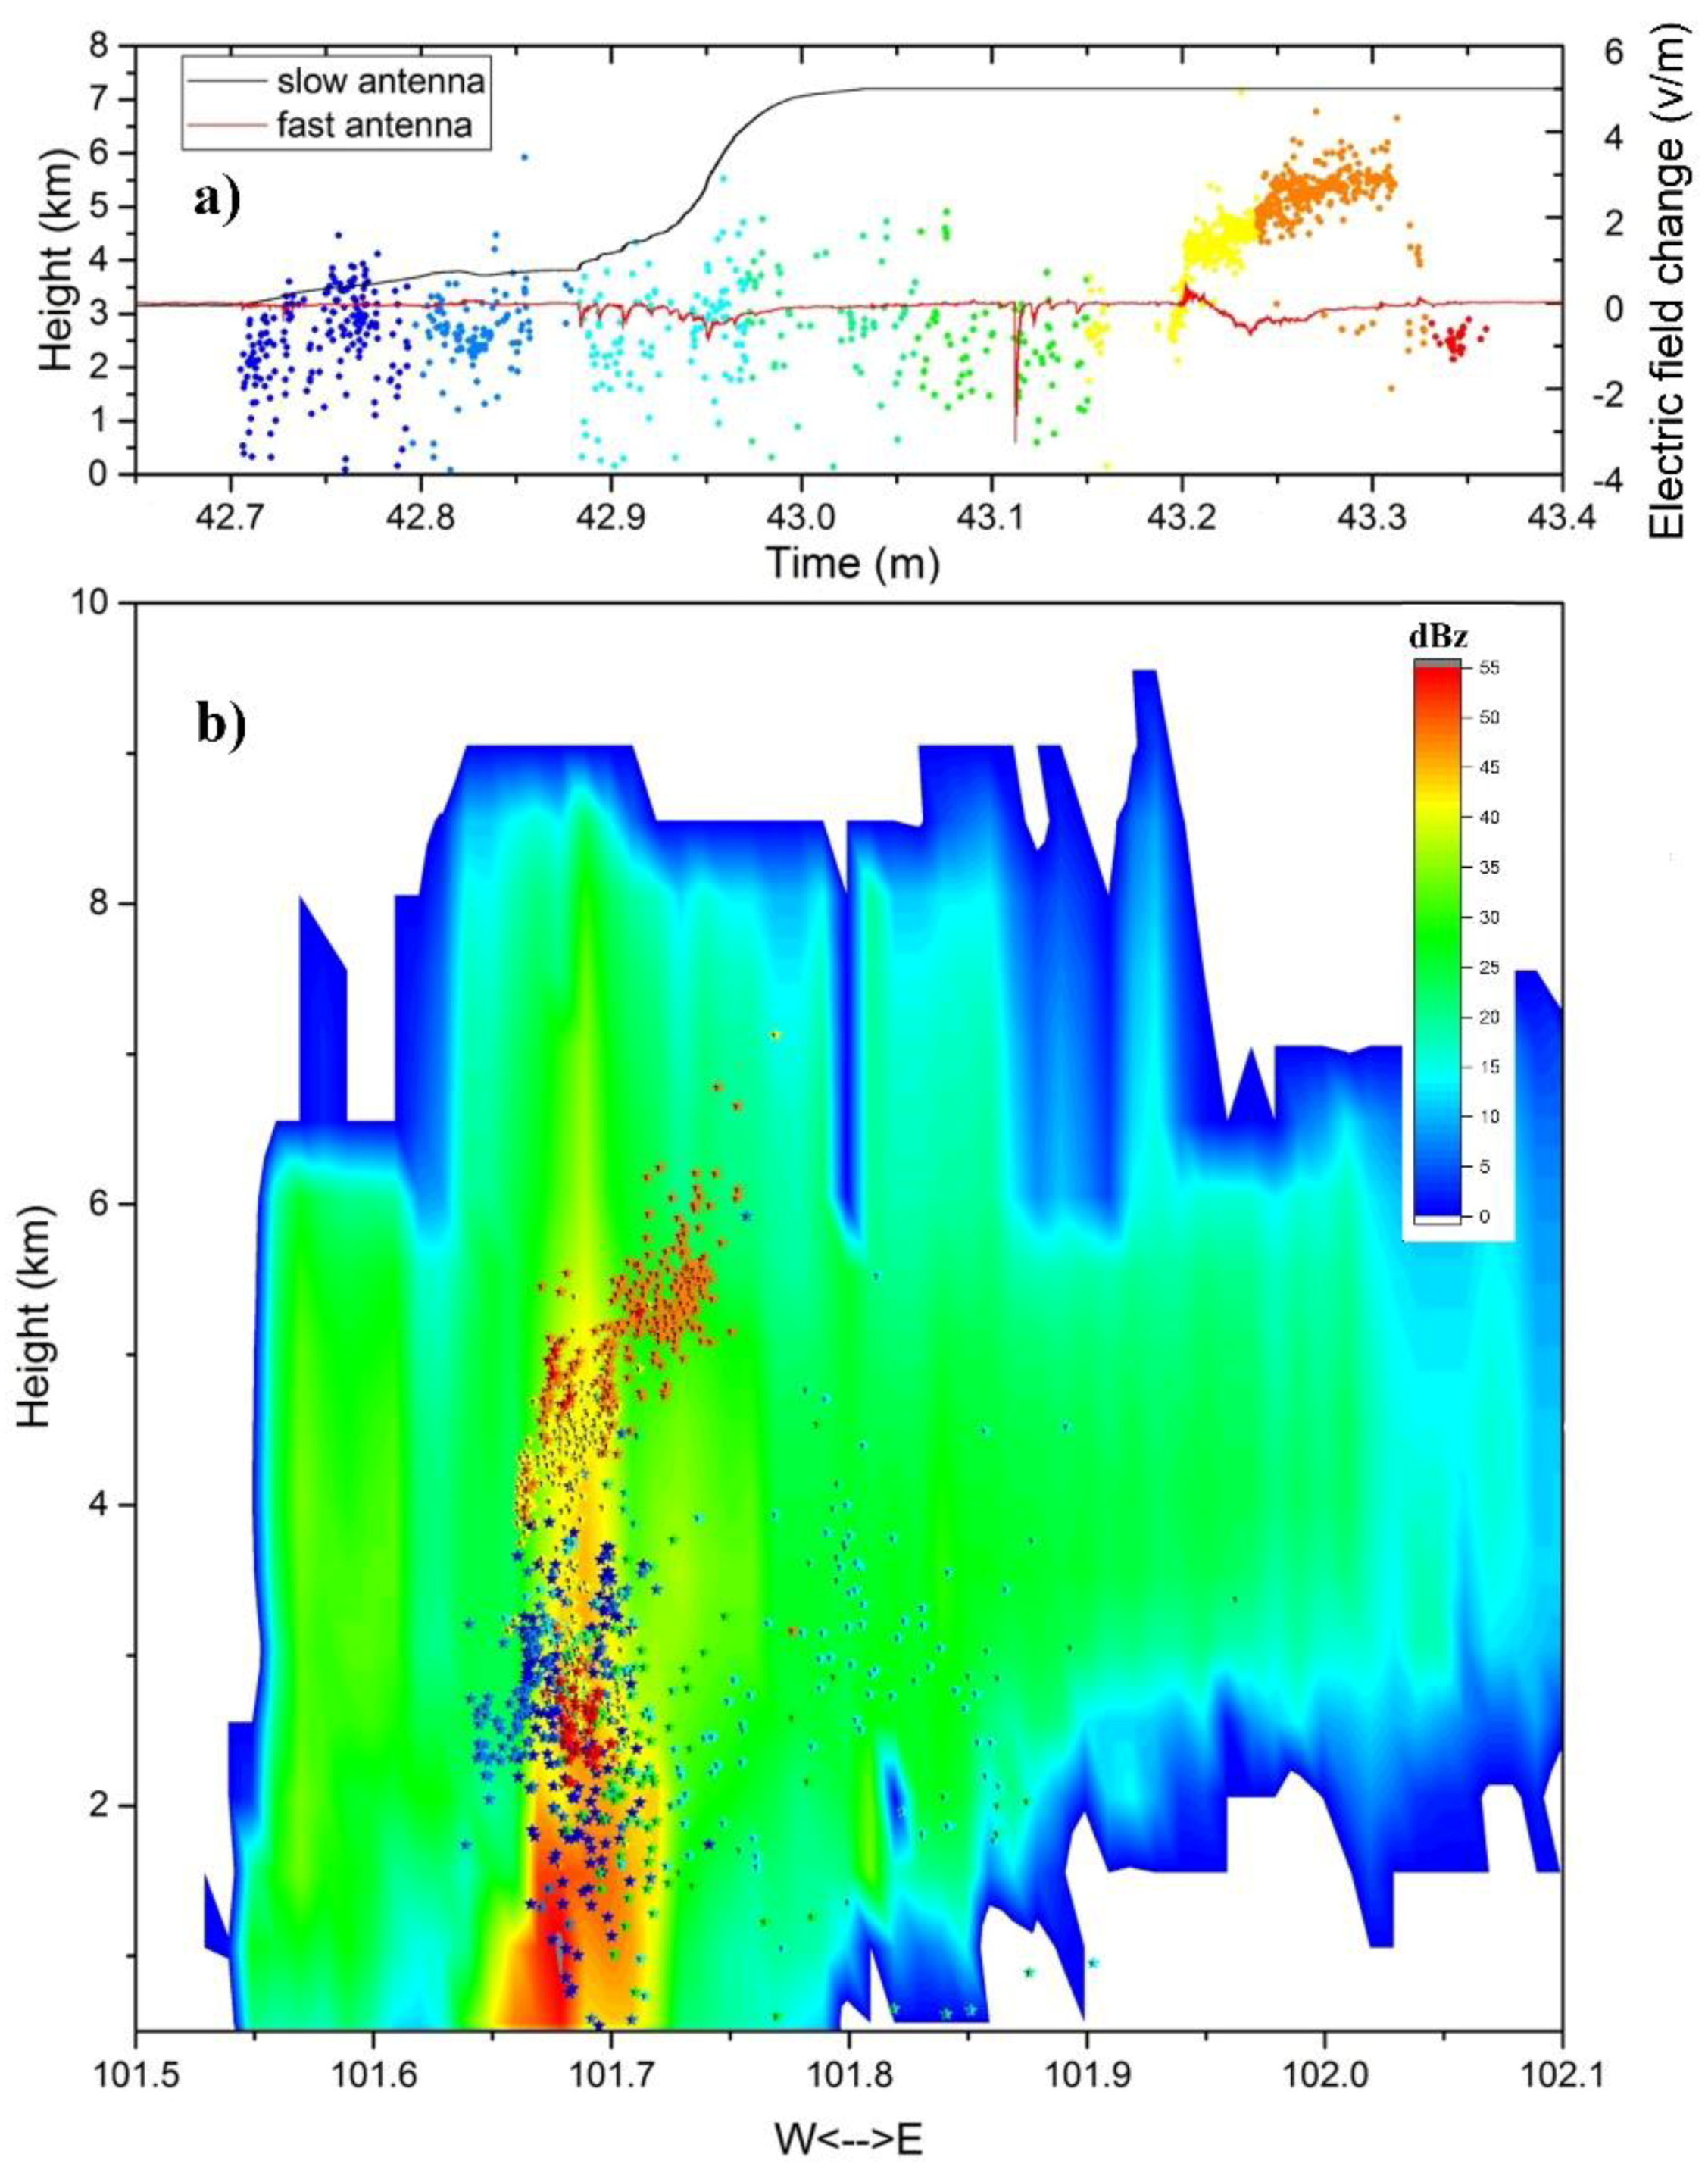
5.2.3. From 14:15 to 14:20
At 14:10, for nearly 5 min, there was a hail process. Due to the drag of this hail fall, the structure of Cell III collapsed quickly. After 14:15, the coverage of the 40 dBz area was very small and the cloud anvil area diffused outward significantly. The lightning flash rate dropped to a very low level and only one lightning discharge event (No. 141942) was detected over a period of 5 min, as shown in
Figure 12, where the location of the lightning radiation source was superimposed on the radar echo. The discharge process of lightning No. 141942 lasted almost 650 ms, having started at a height of about 3.2 km. It is clear that the negative leader penetrated the upper and lower positive charge regions and had a narrow linear distribution in the vertical direction of the strong echo center of the cell, indicating that the charge density in each charge layer was already low at this time but was relatively dense around the weaker updraft channel. The sparse charge distribution and relatively weak potential difference between the charge layers would have been difficult to break down effectively to generate lightning.
Based on the radiation source distribution characteristics of lightning No. 141942, the 20 dBz echo edge of the cell is depicted, and the charge structure in this stage marked, in
Figure 8c. The hailfall carried a large number of positive charges to the ground, and the charge structure of the thunderstorm clouds decreased significantly at all levels. The range of the lower positive charge region was compressed to the lower region below 3 km, the central height of the middle negative charge region was reduced to about 3 km, and a large tilt with the cloud structure was apparent. The upper positive charge region spread further along with the cloud, but the charge density continued to decrease.
5.2.4. Charge Structure Summary
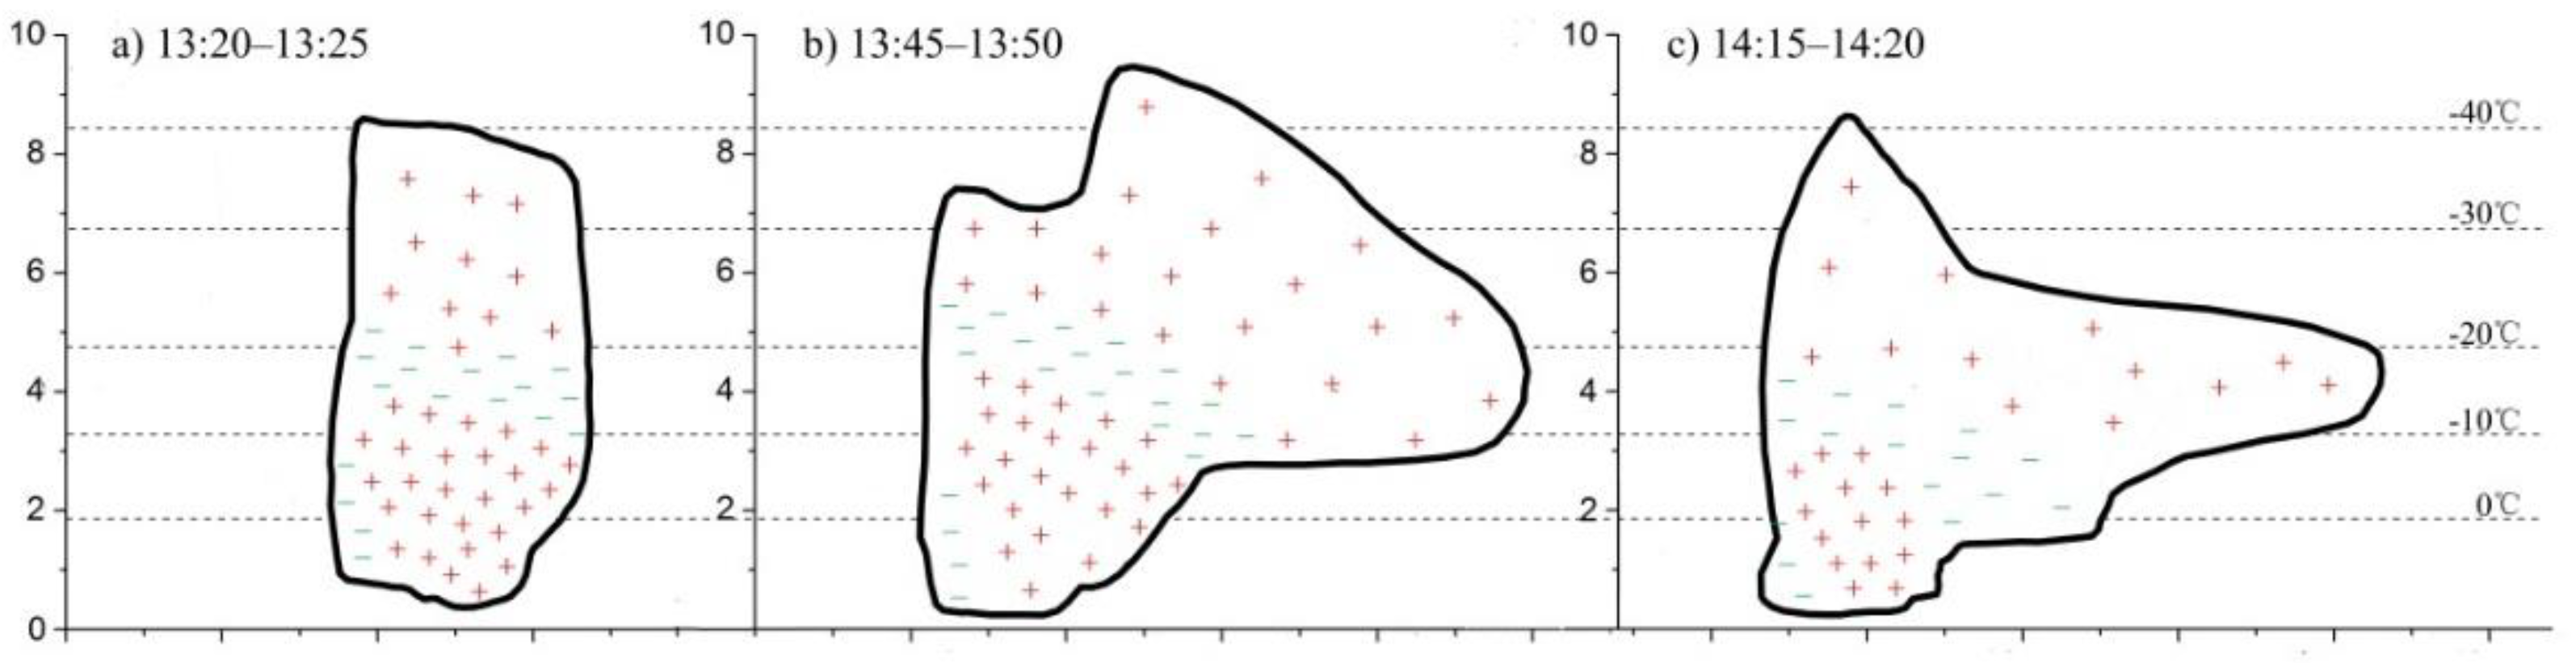
In general, the thunderstorm cell exhibited a tripolar charge structure, as shown in
Figure 8: the upper part was a positive charge region; the middle part was a negative charge region; and a larger main positive charge region existed in the lower part. There was also a small negative charge region in the lower part of the tripolar charge structure of the body. During the development of Cell III, fewer radiation sources were detected in this region, and only a few positive flashes were discharged between this region and the lower positive charge region. The center of the negative charge region in the middle of the cell was located at the height of 4 km (approximately in the −15 °C temperature layer) in the maturation stage of cell. When the storm cell was forced to rise by the mountain, the negative charge region in the middle was lifted and inclined in the vertical direction, which was roughly in the range of 3–5.5 km. After the hail, the charge structure of the whole structure was obviously downward, and the distribution of the negative charge region was inclined in the 2–4 km layer. The positive charge region in the lower part of the thunderstorm cloud was larger, which was distributed stably between the 0 °C and −15 °C temperature layers at 2–4 km and extended down to the cloud bottom region. After the hail, the positive charge area in the lower part decreased significantly in height and scope. Most lightning discharge events occurred between the lower positive charge region and the middle negative charge region. The upper charge region was greatly affected by the development of updraft, and the positive charge around the updraft was more intense in the stage of Cell III development. During the formation of the cloud anvil, the upper positive charge region expanded with the downward wind direction of the airflow.
5.3. Electrical Characteristics of Hail Occurrence and Extinction
As shown in
Figure 3 and
Figure 4, the thunderstorm cloud continued to move southeast during the process of weakening at around 13:40, and the center of the strongest radar echo gradually moved south. The thunderstorm cloud moved to the south near the mountain at about 13:55 and began to be compressed and lifted by the mountain. After 13:50, the average electric field on the ground according to the data of several stations showed a uniform positive increase ranging from 12.6 kV/m to 20.2 kV/m. The strongest echo of Cell III stabilized at line N36.90° for about 20 min after 14:00, which is the peak of the Niang Niang Mountains (
Figure 1).
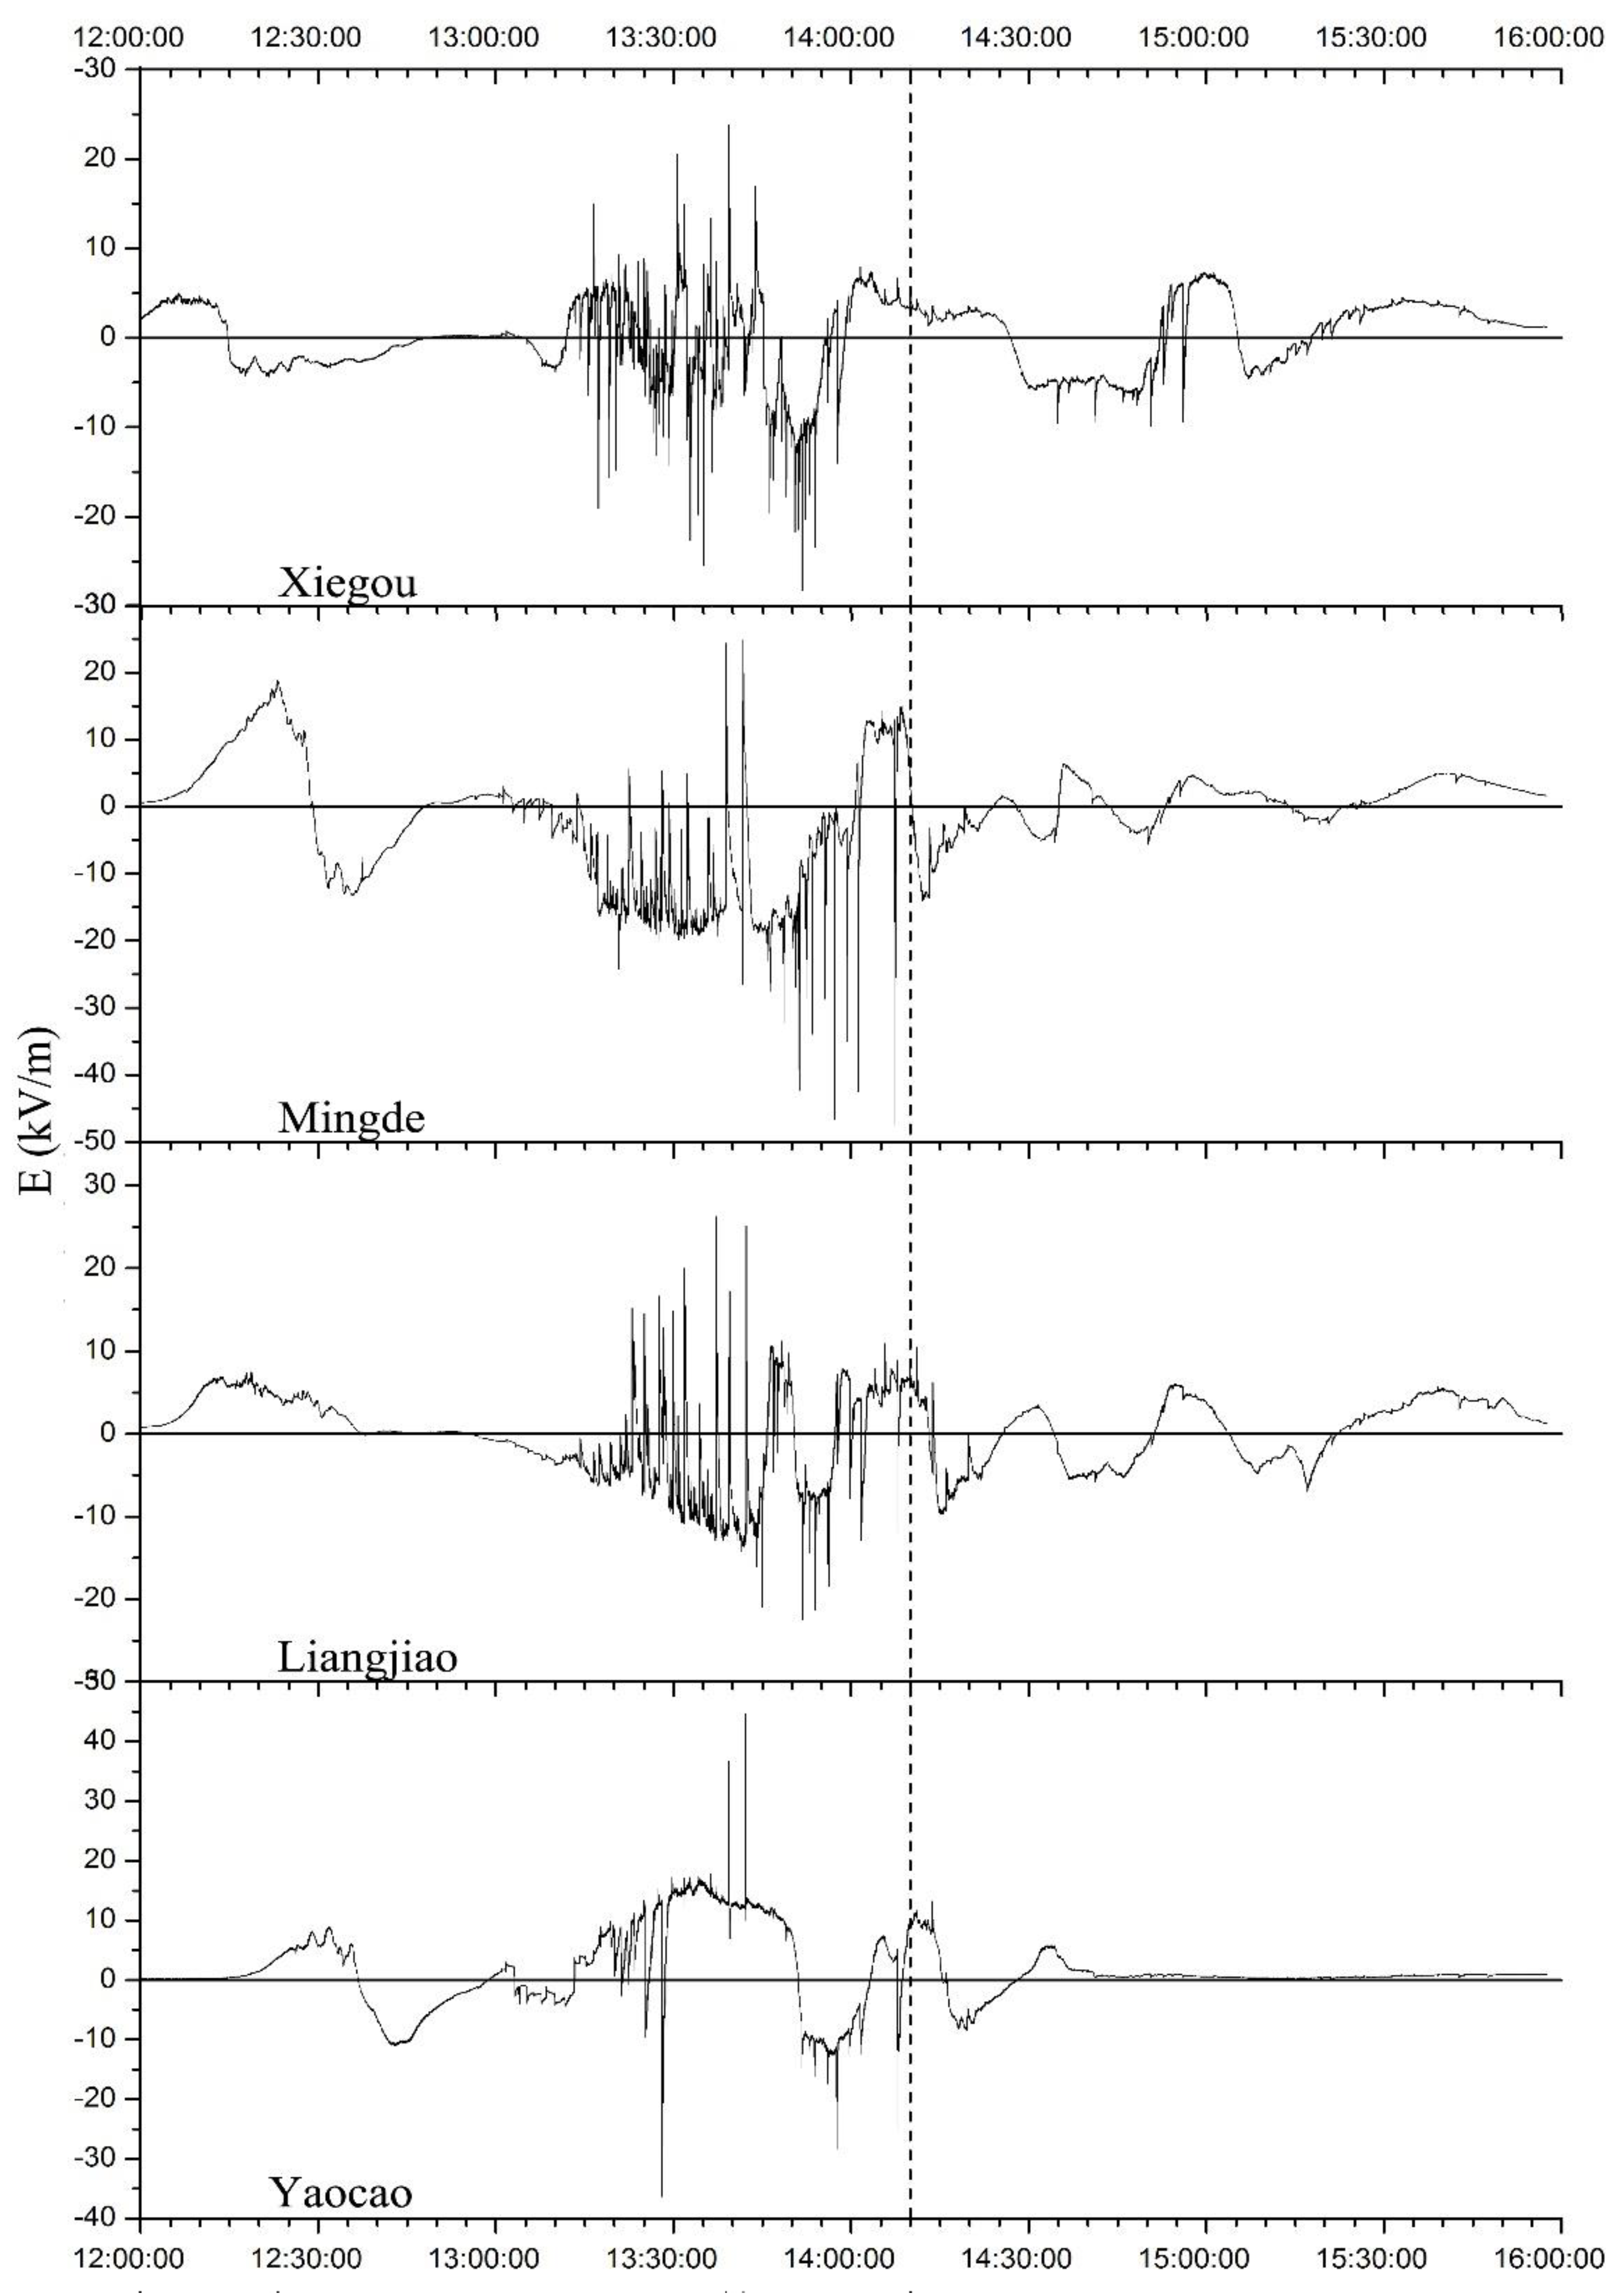
The thunderstorm cloud was forced by the terrain to rise, water vapor in the cloud quickly condensed to form hail, and hail fell at around 14:10. It is noteworthy that, after the hail, the ground electric field recorded at Mingde, Yaocao, Liangjiao and Xiegou stations, near the hailfall area, showed a consistent negative growth of about 2.5–16.3 kV/m (as shown in
Figure 13).
Before and after the hail, the four stations under the cloud anvil of Cell III recorded consistent electric field change, which seemed, from the time node and trend of change, to be related to the change in charge structure caused by the hail growth and fall in the cloud. Qie et al. [
20] observed a thunderstorm process in the same area and similarly showed a reversal in the trend of the ground electric field change when hail began to fall (Figure 1 in [
20]). We have found that the ground electric field characteristics before and after hail descent are consistent with the so-called End of Storm Oscillation (EOSO) [
34,
35]. It is generally considered that the appearance of EOSO is due to the surface field meters being exposed to the positive charge of the cloud by the downdrafts occurring in their dissipating stages, that is, when the downdraft carries the positive charge in the cloud downward, it will show this feature on the ground electric field meter. Thus, the beginning time of EOSO coincides with the time of hailstone landing. We think this is a corroboration of hail particles carrying positive charge.
6. Discussion and Analysis
6.1. Effect of Dynamic Transport on the Charge Structure of Thunderstorm Clouds
Based on the characteristics of the thunderstorm cell charge structure in the three different stages, the formation and development of the upper positive charge region was closely related to the updraft flow, which could be characterized well by the distribution characteristics of the radiation source in the upper positive charge region in the different stages. During the formation and development of the cloud anvil, the range of the upper positive charge region also expanded synchronously to the downwind direction. The distribution characteristics of the radiation source indicated that the positive charge region of the upper part of the cell extended to most of the cloud anvil region during hail growth. The multi-station electric field fitted results showed that the positive charge increased in the cloud anvil region and the negative charge increased synchronously in a certain region during hail growth. This shows that positive and negative charges were generated simultaneously under the action of some electrification mechanism, and some positively charged particles were transported to the cloud anvil region by ascending airflow and spread along with the development of the cloud anvil. In the process of hailfall, the falling of the hail itself carried positive charge to the ground, which led to the reduction in the ground electric field. From the previous analysis of the ground filed, we believe that there was also a reduction in the charge amount in the negative charge region during the same period. However, from the analysis of the location results of the radiation source, we believe that it was the result of the negative charge falling with precipitation particles. During thunderstorms discussed in this paper, the dynamic transport of the updrafts caused the charge to reach higher and further regions; however, correspondingly, the charge density reduced with the transport distance, especially in the positive charge region where the cloud anvil region participated in the discharge, and the distribution range of the radiation source was wide but very sparse. The hail process weakened the charge density of the lower positive charge region and significantly reduced the range of the lower positive charge region, making the triggering of lightning less likely.
6.2. Main Electrification Mechanism
In the study of thunderstorms in the Qinghai–Tibetan plateau, researchers found that thunderstorms in this region usually have the characteristics of weak development, relatively low height of 0 °C layer, relatively humid lower part of thunderstorm cloud but relatively dry upper part of thunderstorm cloud, etc. [
19,
20,
36,
37,
38]. These factors lead to relatively few ice particles in thunderstorm cloud in plateau area compared with other areas [
23,
24,
25,
39,
40], and the electrification effect is relatively weak. The combined effect of these factors has resulted in the low frequency of lightning during thunderstorms in the Qinghai–Tibetan plateau. Our research team introduced the charge and discharge parameterization scheme into the 3-D high resolution cloud model [
41], and studied the numerical model of a local thunderstorm process in the same region on 10 August 2013, and discussed the formation mechanism of the thunderstorm cloud charge structure in the Qinghai–Tibetan Plateau. The results of the model study show that, for the thunderstorms in the Qinghai–Tibetan Plateau, neither the induction [
42,
43] nor non-induction [
44,
45] mechanism of the particles is sufficient to form the charge density that can trigger the lightning under the condition that they work alone. Only when these mechanisms work together can the lightning cloud charged conditions be formed enough to trigger the lightning. Some studies have also shown that the non-induction mechanism is the basis for the formation of the charge structure of thunderstorm clouds in the Qinghai–Tibetan Plateau, especially for the larger positive charge region at the lower part of thunderstorm cloud: when the soft hail particles are at a height below the inversion temperature, the positive charge is carried. The underlying surface of the Qinghai–Tibetan Plateau is usually humid, and the relatively weak ascending airflow during the development of thunderstorm cell causes many soft hail particles to remain in the lower part of the cloud body. The inversion temperature is usually between −10 °C and −20 °C. This is also the temperature range of the main negative charge region in thunderstorms, corresponding to the coexistence region of negatively charged soft hail particles and ice crystal particles. For ice crystal particles above this temperature range, they carry positive charge. Because of their light weight, they are easily carried away by airflow. The non-induction electrification mechanism makes the thunderstorm cell form a certain charge stratification characteristic. Under the action of the non-induction electrification mechanism, the electric field inside the thunderstorm cloud is continuously enhanced, and the induction electrification mechanism strengthens the charge layers, especially the positive charge region at the lower part. The smaller negative charge region in the back of thunderstorm cell is probably related to the transport of particles in the middle negative charge region by the downward flow in the back of the cell.
6.3. Relationship between Charge Structure and Lightning Characteristics
Thunderstorms in the Qinghai–Tibetan Plateau are generally weak owing to relatively weak updraft, which leads to insufficient electrification. A return stroke event may fully discharge the clouds locally, which requires a long preparation time to trigger the next lightning process, resulting in a relatively small number of lightning return strokes and a low frequency of lightning. According to the distribution characteristics of the radiation source in the present study, most lightning occurred between the lower positive charge region and the middle negative charge region, indicating that the lower positive charge region was stronger than the upper positive charge region. Meanwhile, because the lower positive charge region had a larger range and was deeper, it may have taken a longer cloud process to form the ground flash, which shows a longer duration before the first return stroke. This too is a typical feature of thunderstorms in the Qinghai–Tibetan Plateau, in that it is not easy for a positive ground flash to occur, due to a tripolar charge structure with a stronger and lower positive charge region. This has been similarly noted in previous studies [
7,
19,
20,
36,
37,
38,
46,
47].
During the forced uplift of the thunderstorm cloud by the terrain, the strong updraft would have promoted the non-induction electrification mechanism, and this short-lived strong updraft would have accelerated the collision and growth process between soft hail particles and supercooled water, such that a large number of positive charges in the lower positive charge region would have solidified on hail particles, and ice crystal particles in the upper positive charge region would have been transported downward in the direction of the wind under the strong updraft. Conversely, the strong updraft would then have strengthened the internal circulation of the thunderstorm cloud, strengthening the downward flow at the back of the thunderstorm cell and transferring part of the negative charge in the middle negative charge region to the smaller negative charge region at the back of the cell. This may have been the reason for the occurrence of concentrated positive ground lightning during the forced uplift of the thunderstorm cloud before the occurrence of hail, which was similar to the concentrated occurrence of positive ground lightning in the early stage of thunderstorm process.
7. Conclusions
In this study, a thunderstorm process that caused disastrous hailfall in Datong County, Qinghai Province, China, was studied by using a variety of data and analysis methods. The process took place on 20 August 2012 and lasted for a long time. The hail of this disastrous weather event occurred in the later stage of the thunderstorm owing to the forced uplift by the local terrain.
During the whole thunderstorm process, 202 lightning events were detected simultaneously by fast and slow antennas and a radiation detection system. The peak frequency of lightning during the process was 28 times per 5 min. Ninety-two cases of cloud flashes were detected, with a relatively low proportion that accounting for 45.5% of total flash. Fifteen cases of positive ground flashes occurred in the early stage of the thunderstorm process and the stage of cell uplift caused by the topography. The duration of lightning discharge events was relatively short, with an average of less than 0.5 s; the average number of negative ground flash return strokes was 2.4, and the number of positive ground flash return strokes was 1. The duration of the in-cloud process prior to the positive ground flash return stroke was relatively longer than negative flash.
In general, the thunderstorm cell exhibited a tripolar charge structure, in which the upper part and the lower part were positive charge regions and the middle part was a negative charge region. The positive charge region in the lower part of the cloud was larger, distributed stably in the temperature layers of 0 °C to −15 °C at the height of 2–4 km, and extended downward to the cloud bottom region. After the hail, the positive charge area in the lower part decreased significantly in height and scope. The center of the middle negative charge region of the mature stage of the storm cell was located at the height of about 4 km (in the −15 °C temperature layer, approximately). When the thunderstorm cell was forced by the mountain to rise, the middle negative charge region rose and tilted in the vertical direction, ranging from approximately 3 km to 5.5 km. After the hail, the whole charge structure moved down significantly, and the negative charge region tilted and was distributed in the 2–4 km height layer. The lower positive charge region of this thunderstorm cell in the Qinghai–Tibetan Plateau had a considerable influence on the lightning characteristics. Most of the lightning occurred between the lower positive charge region and the middle negative charge region.
The dynamic transport of updrafts greatly influenced the charge structure of the thunderstorm clouds. The charge region in the upper part of the thunderstorm cell was heavily affected by the development of the updraft, and the positive charge around the updraft was denser in the strong stage of cell development. During the formation of the cloud anvil, the upper positive charge region expanded with the downward wind direction of the airflow. There was also a small negative charge region in that low part of the tripolar charge structure of the body, where less radiation was generated. Several positive flashes occurred between this region and the lower positive charge region, which may have been formed by the downward flow at the rear of the cell delivering particles from the negative charge region to the middle of the cell down.


