Communication

Snow Level Characteristics and Impacts of a Spring Typhoon-Originating Atmospheric River in the Sierra Nevada, USA

by
Benjamin J. Hatchett
1,2
1
Division of Atmospheric Sciences, Desert Research Institute, Reno, NV 89512, USA
2
Western Regional Climate Center, Desert Research Institute, Reno, NV 89512, USA
Atmosphere 2018, 9(6), 233; https://doi.org/10.3390/atmos9060233
Submission received: 24 May 2018 / Revised: 11 June 2018 / Accepted: 13 June 2018 / Published: 15 June 2018
(This article belongs to the Special Issue Tropical Cyclones and Their Impacts)

Abstract

:
On 5–7 April 2018, a landfalling atmospheric river resulted in widespread heavy precipitation in the Sierra Nevada of California and Nevada. Observed snow levels during this event were among the highest snow levels recorded since observations began in 2002 and exceeded 2.75 km for 31 h in the northern Sierra Nevada and 3.75 km for 12 h in the southern Sierra Nevada. The anomalously high snow levels and over 80 mm of precipitation caused flooding, debris flows, and wet snow avalanches in the upper elevations of the Sierra Nevada. The origin of this atmospheric river was super typhoon Jelawat, whose moisture remnants were entrained and maintained by an extratropical cyclone in the northeast Pacific. This event was notable due to its April occurrence, as six other typhoon remnants that caused heavy precipitation with high snow levels (mean = 2.92 km) in the northern Sierra Nevada all occurred during October.

1. Introduction

The maritime midlatitude Sierra Nevada mountains provide key water resources, ecosystem services, and recreation opportunities for California and Nevada [1,2]. The Sierra Nevada receives over 70% of its annual precipitation during the cool season (October–April) with approximately 40–50% derived from atmospheric rivers [1,3]. Atmospheric rivers (ARs) are narrow, elongated filaments of strong horizontal water vapor transport in the warm sector of an extratropical cyclone ahead of the cold front [4]. ARs are fundamental components of western United States hydrometeorology and hydroclimate [1,3]. The impacts of ARs can be positive [1,5] or negative [1,5,6,7,8].
The orientation of the northwest-southeast trending Sierra Nevada (Figure 1) perpendicular to the west-southwest flow during most cool season storms leads to orographic precipitation enhancement when ARs interact with the topography [9,10]. A meridional elevation gradient spans the range; the northern region is composed of lower characteristic elevations (median = 1.6 km above sea level) than the central (2.1 km) and southern (1.9 km) regions. This makes the northern region most susceptible to rain-on-snow flooding during storms with elevated snow levels and extreme precipitation [11,12]. However, when snow levels are extremely high (>2.5 km), large catchment areas of watersheds throughout the range will receive rainfall and contribute runoff from both direct precipitation and heat transfer-driven snowmelt [11]. Because this precipitation is not being stored as snowpack, these warm storms create challenges for water and emergency managers who must handle the storm as a hazard rather than a resource [1,13,14].
This communication highlights the snow level characteristics of an AR that impacted the Sierra Nevada between 5–7 April 2018. Remotely sensed and station-based data are used to relate the origin of this AR to super typhoon Jelawat, the first Pacific typhoon of the 2018 season. It describes the extremely high snow levels associated with this storm and examines five other storms with likely typhoon moisture-remnant origins (comprised of six typhoons) to further characterize snow levels during these events, two of which were previously studied [15,16]. Last, some hydrogeomorphological impacts of the 5–7 April event are documented to provide examples of how typhoon-derived moisture influences natural hazards in mountain environments and may be recorded in the sedimentary record.

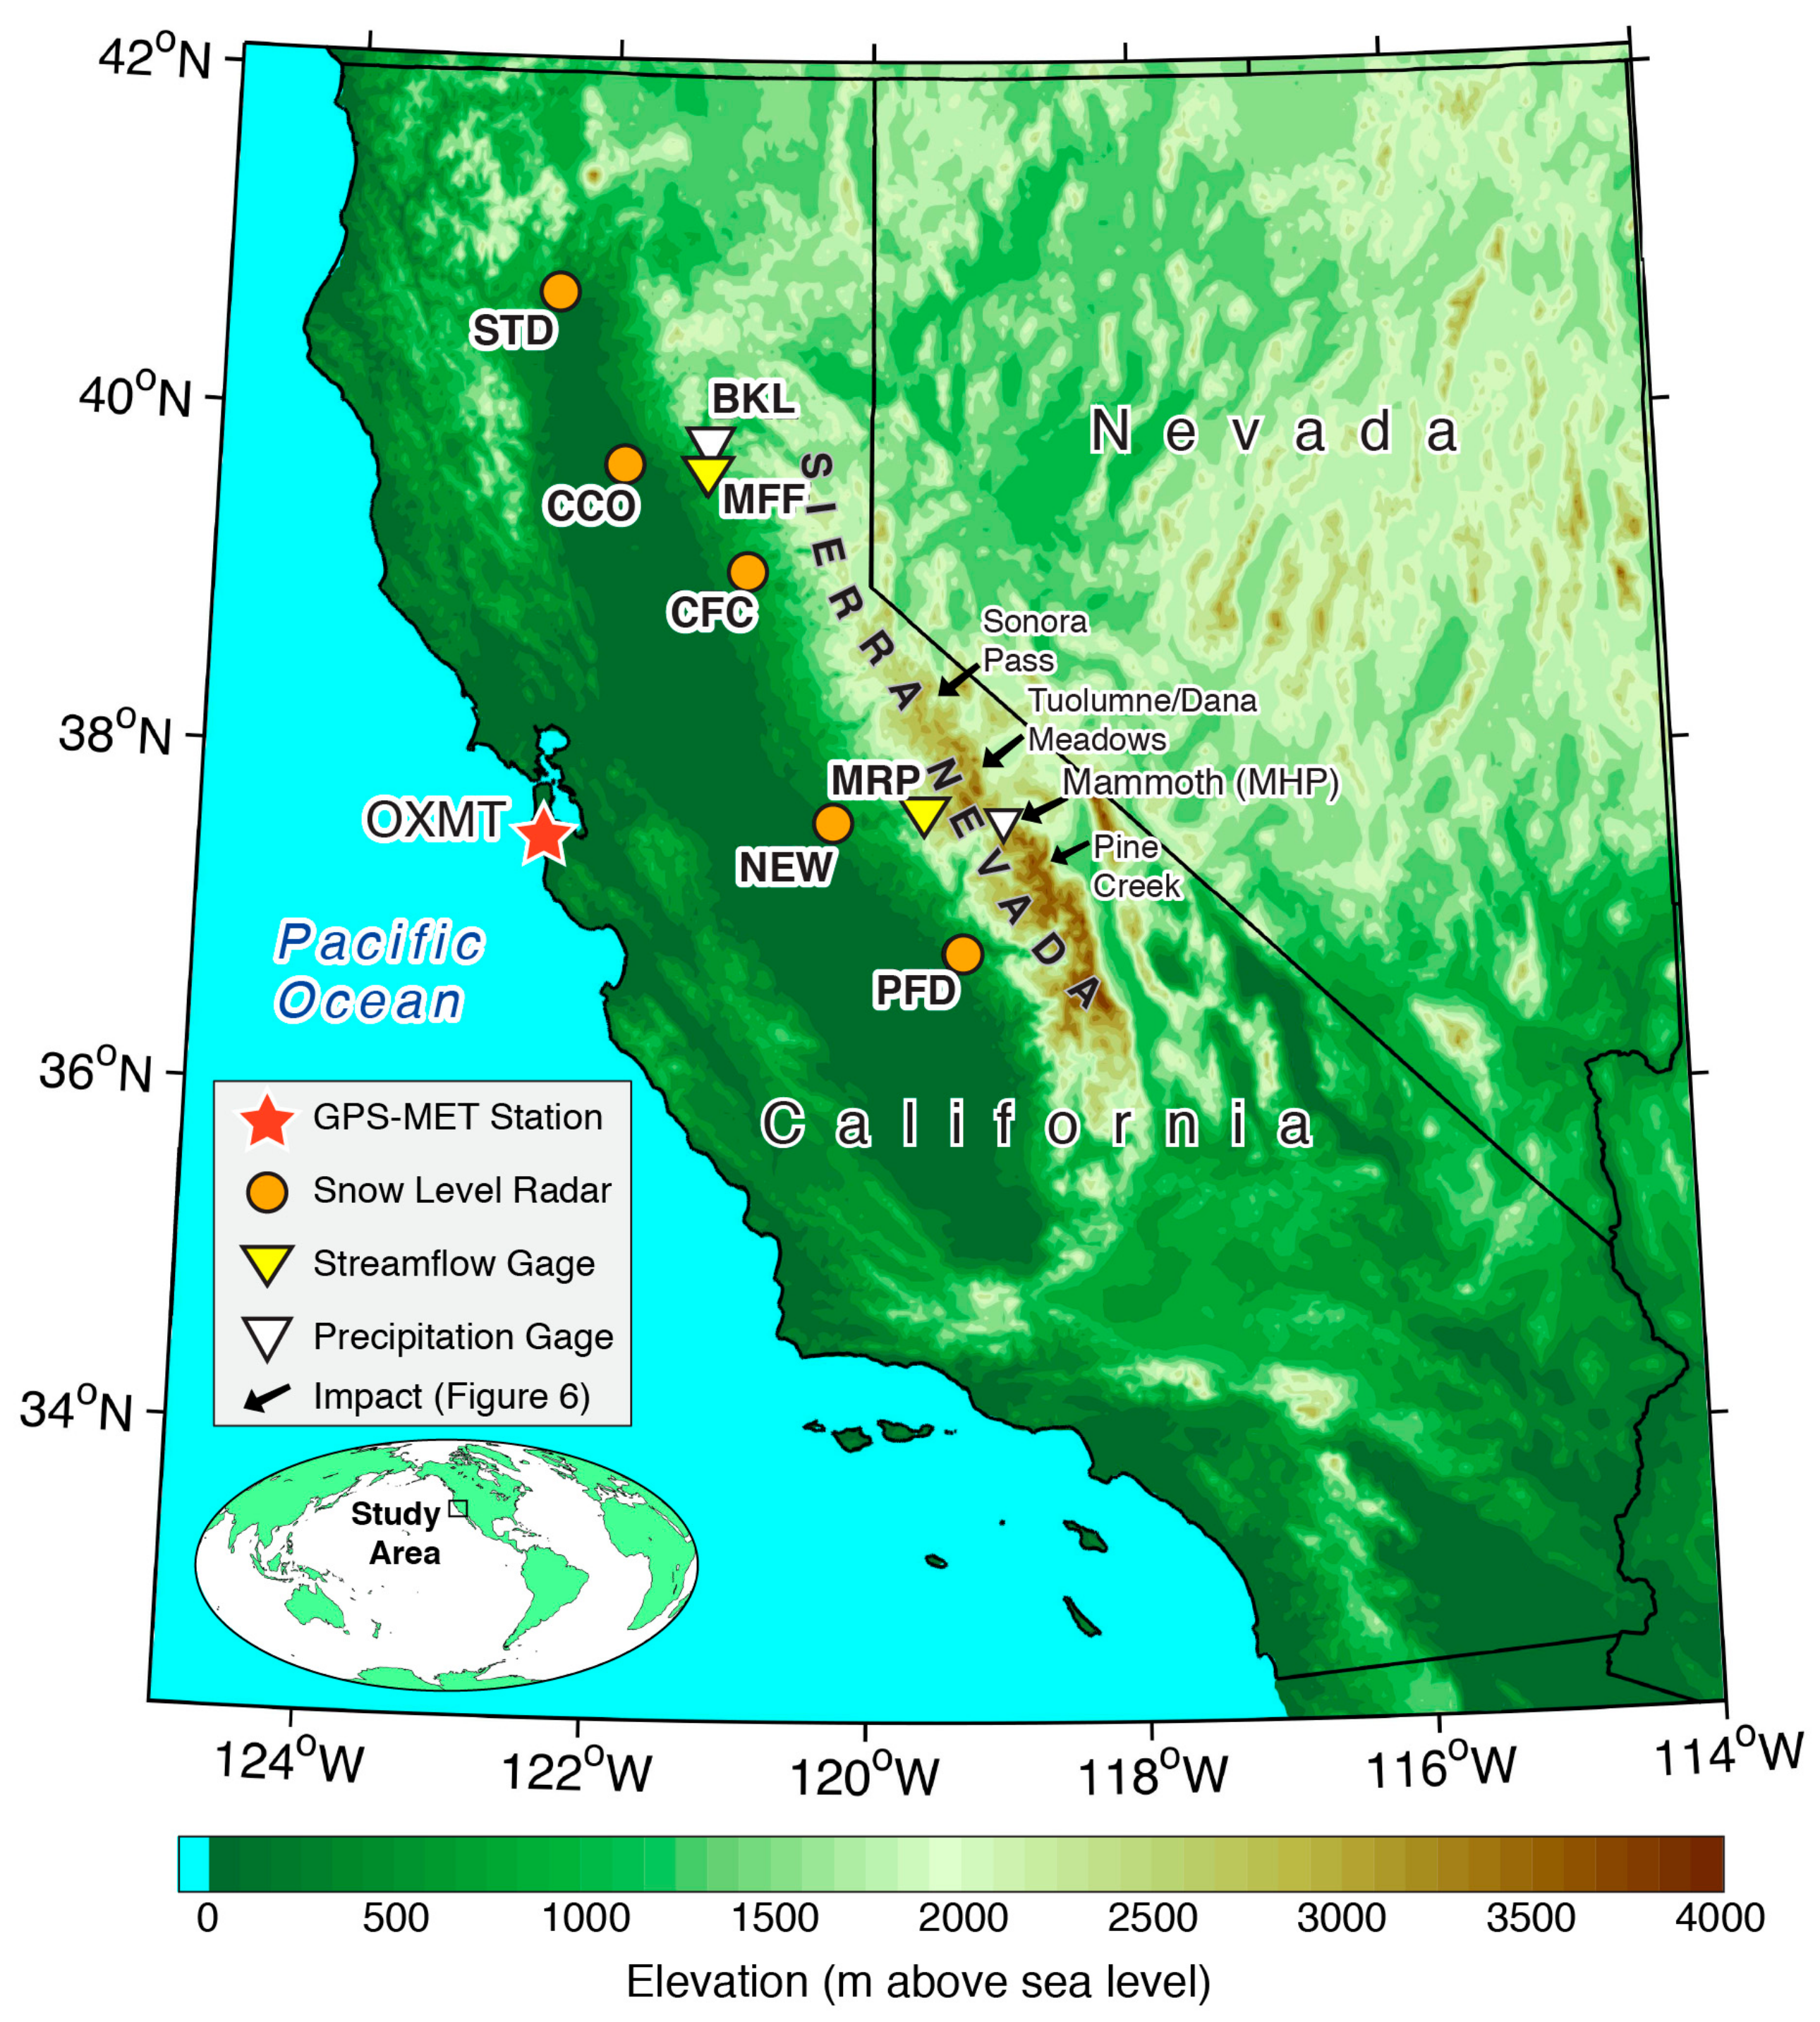
2. Materials and Methods

We focus on the period spanning from 25 March–7 April 2018, in other words, the period between when Jelawat was declared a super typhoon by the Japanese Meteorological Agency [17] and the most significant precipitation and impacts in the Sierra Nevada occurred. To identify and evaluate the possible linkage between moisture remnants of typhoon Jelawat and the landfalling AR, we use an experimental global product of total precipitable water, Morphed Integrated Microwave Imagery at CIMMS (Cooperative Institute for Meteorological Satellite Studies)-Total Precipitable Water version 2 (MIMIC-TPW2; [18]), that is based on morphological compositing of operational microwave-frequency satellite-based sensors [19]. Three-hourly, 0.5° × 0.625° horizontal resolution estimates of integrated water vapor transport are provided by the Modern-Era Retrospective analysis for Research and Applications (MERRA) product [20]. We also use 2.5° horizontal resolution National Oceanic and Atmospheric Administration non-interpolated outgoing longwave radiation (OLR) observations based on Advanced Very High Resolution Radiometer data [21]. OLR anomalies are reported as daily observations differenced from the 1979–1995 long term means averaged over a 22-day period that brackets the period of interest by four days (i.e., 21 March–11 April). Latitudes and longitudes of the center of Jelawat were acquired from the Japanese Meteorological Agency Regional Specialized Meteorological Center (RSMC) Tokyo-Typhoon Center best track typhoon dataset [17].
Observations of precipitable water were acquired from ground-based Global Positioning Satellite data acquired near Half Moon Bay along the California coast (station OXMT; Figure 1) from the COSMIC Suominet database [22]. Hourly brightband elevations, or the elevation where snow turns to rain (approximately 200 m below the 0 °C isotherm [23]), were derived from five snow level radars located west of the Sierra Nevada crest (Figure 1) [23,24,25,26]. Climatological cool season (October–April) snow levels are provided for the Chico radar from 2002–2018. To provide a comparison of snow levels during the 5–7 April event with other potential typhoon remnant-derived precipitation events, five additional events are included and provided in Table 1.
Hourly data were acquired from the California Data Exchange Center [27] and include observations of relatively unimpaired streamflow from the Merrimac gage on the Middle Fork of the Feather River (MFF) and alter-shielded weighing gauge precipitation at Bucks Lake (BKL) and Mammoth Pass (MHP; Figure 1). Daily streamflow observations were acquired from the United States Geological Survey [28] for the unimpaired gage on the Merced River at Pohono Bridge (MRP; Figure 1) between 1 October 1916–30 April 2018 to provide long-term climatological context of the runoff during the 5–7 April event.
Field observations of examples of hydrogeomorphological impacts of the event were recorded in high elevation regions of the Sierra Nevada between 15 April–10 May 2018 by Susan Burak, the Eastern Sierra Avalanche Center [29], Rob and Laura Pelewski [30] and the author. Observations of debris flows, high elevation flooding, and wet snow avalanches were conducted using ground-based and aerial photography.

3. Results

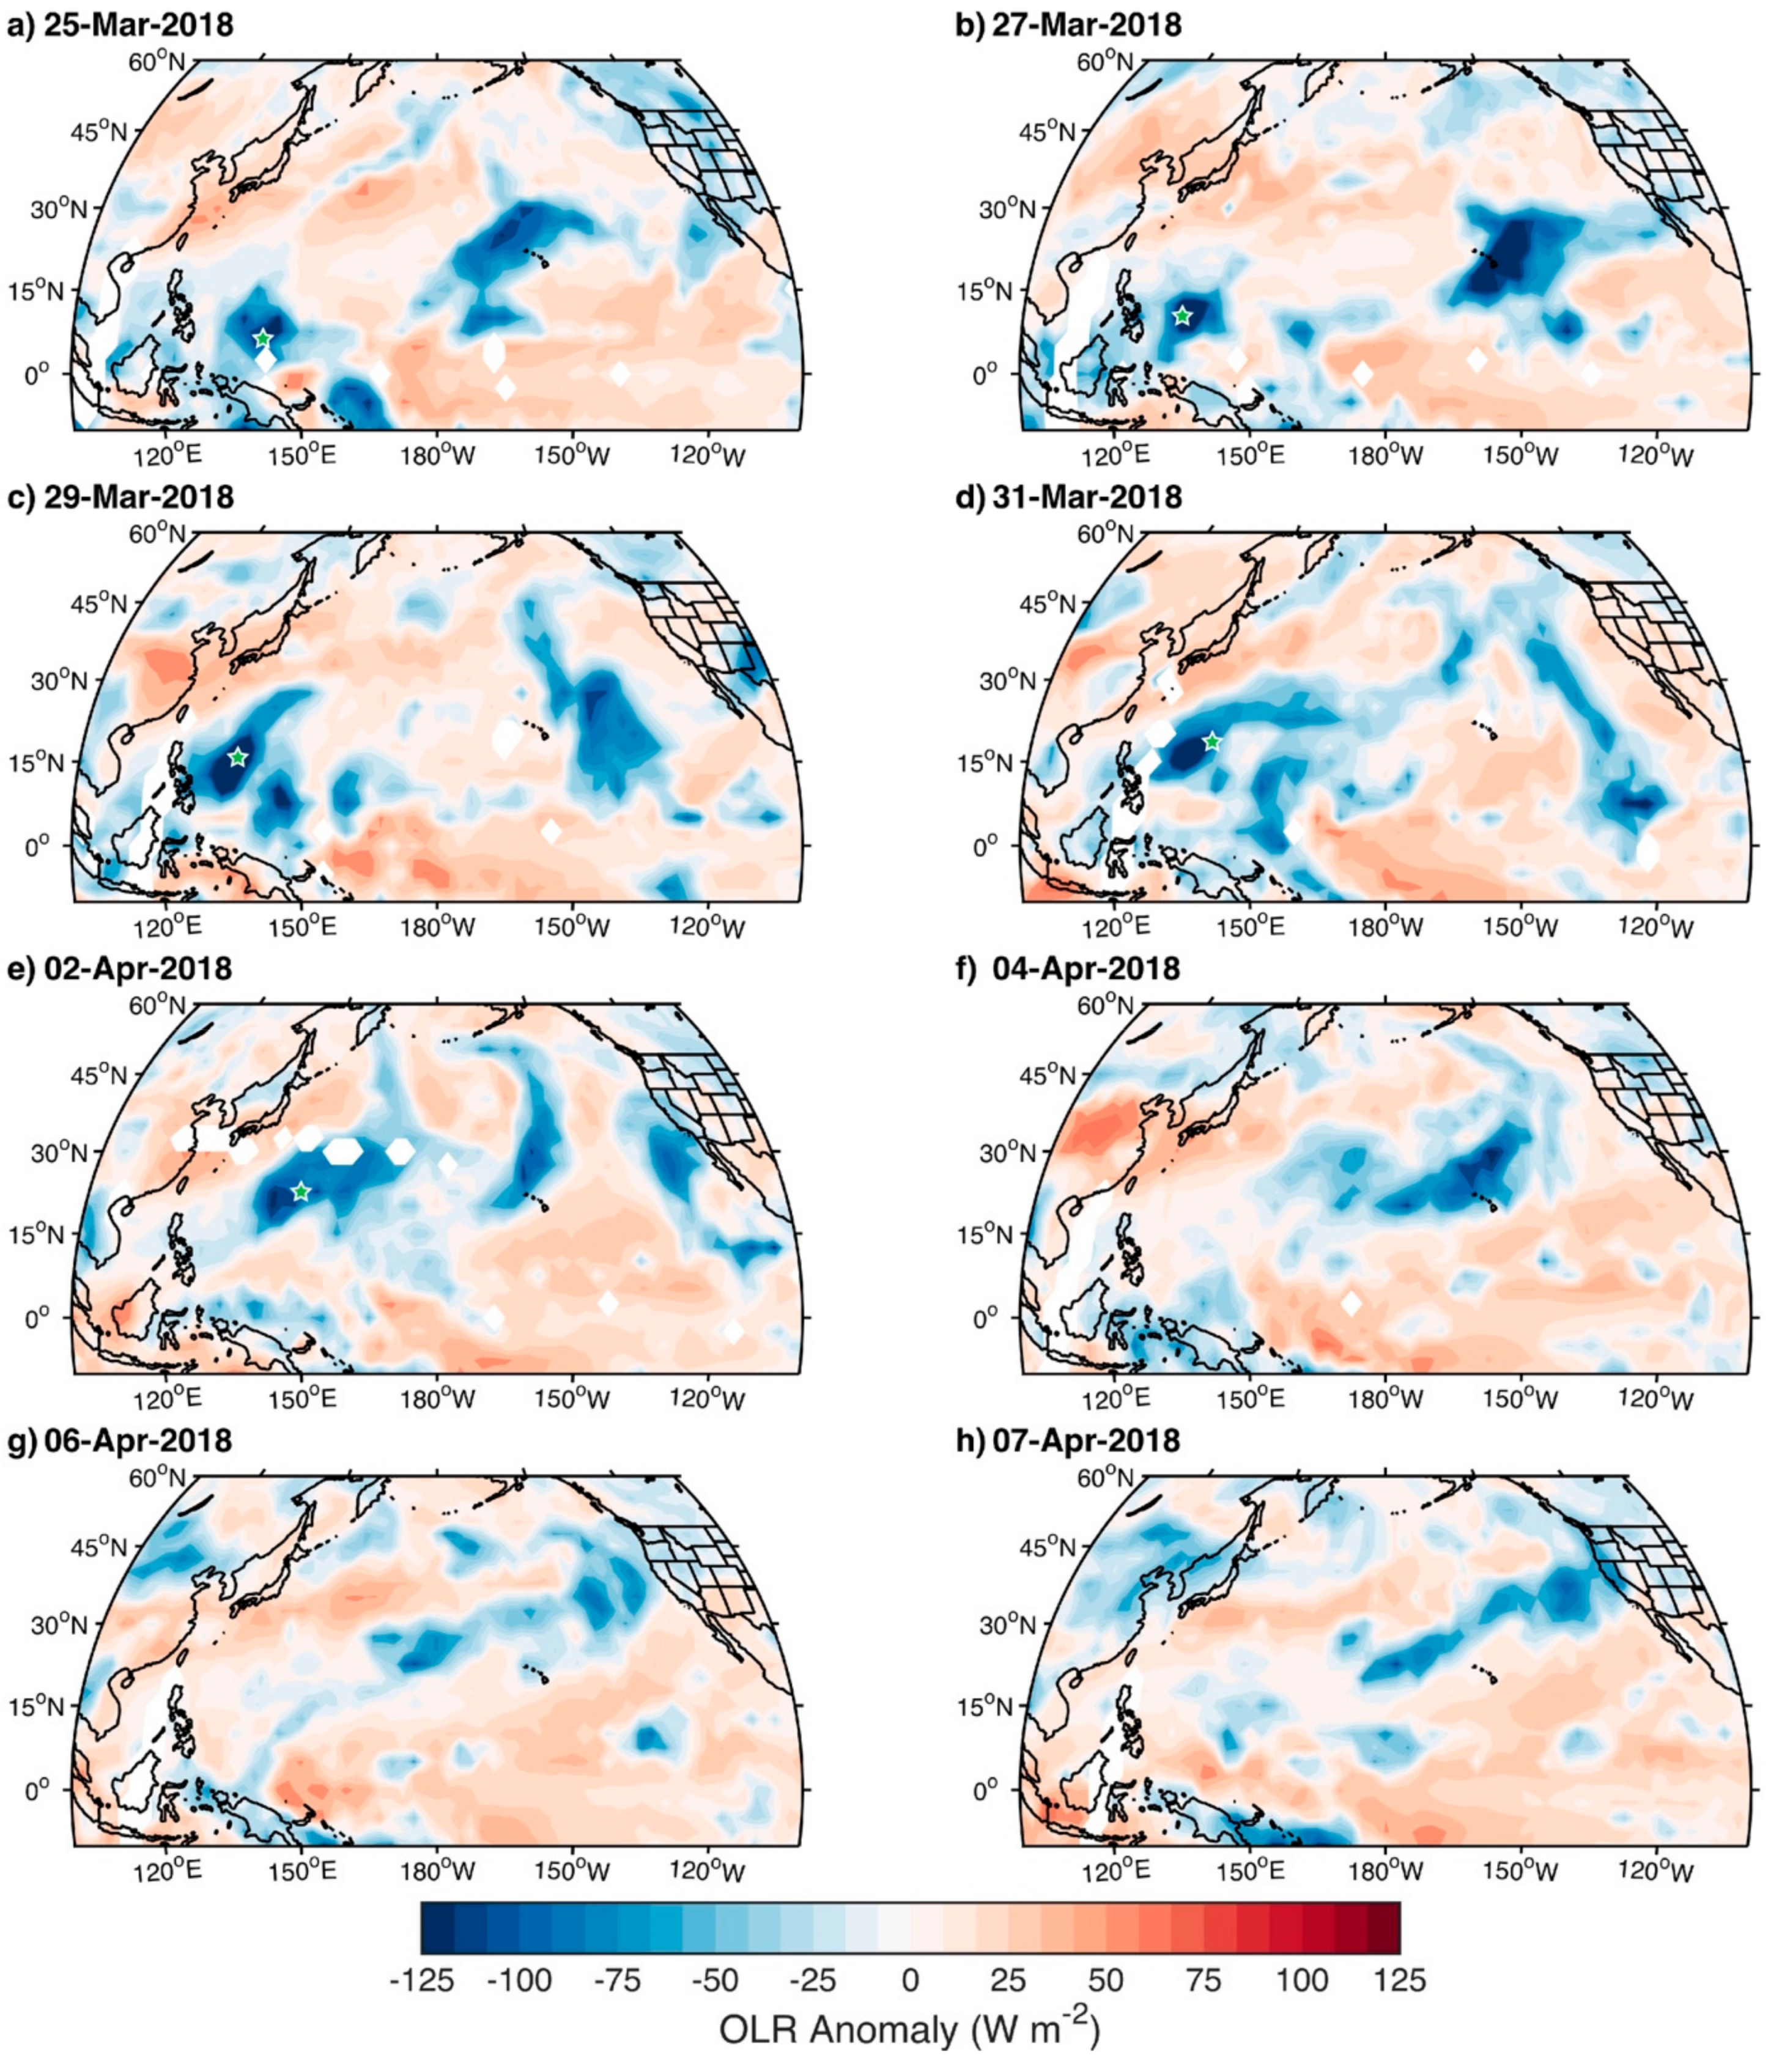
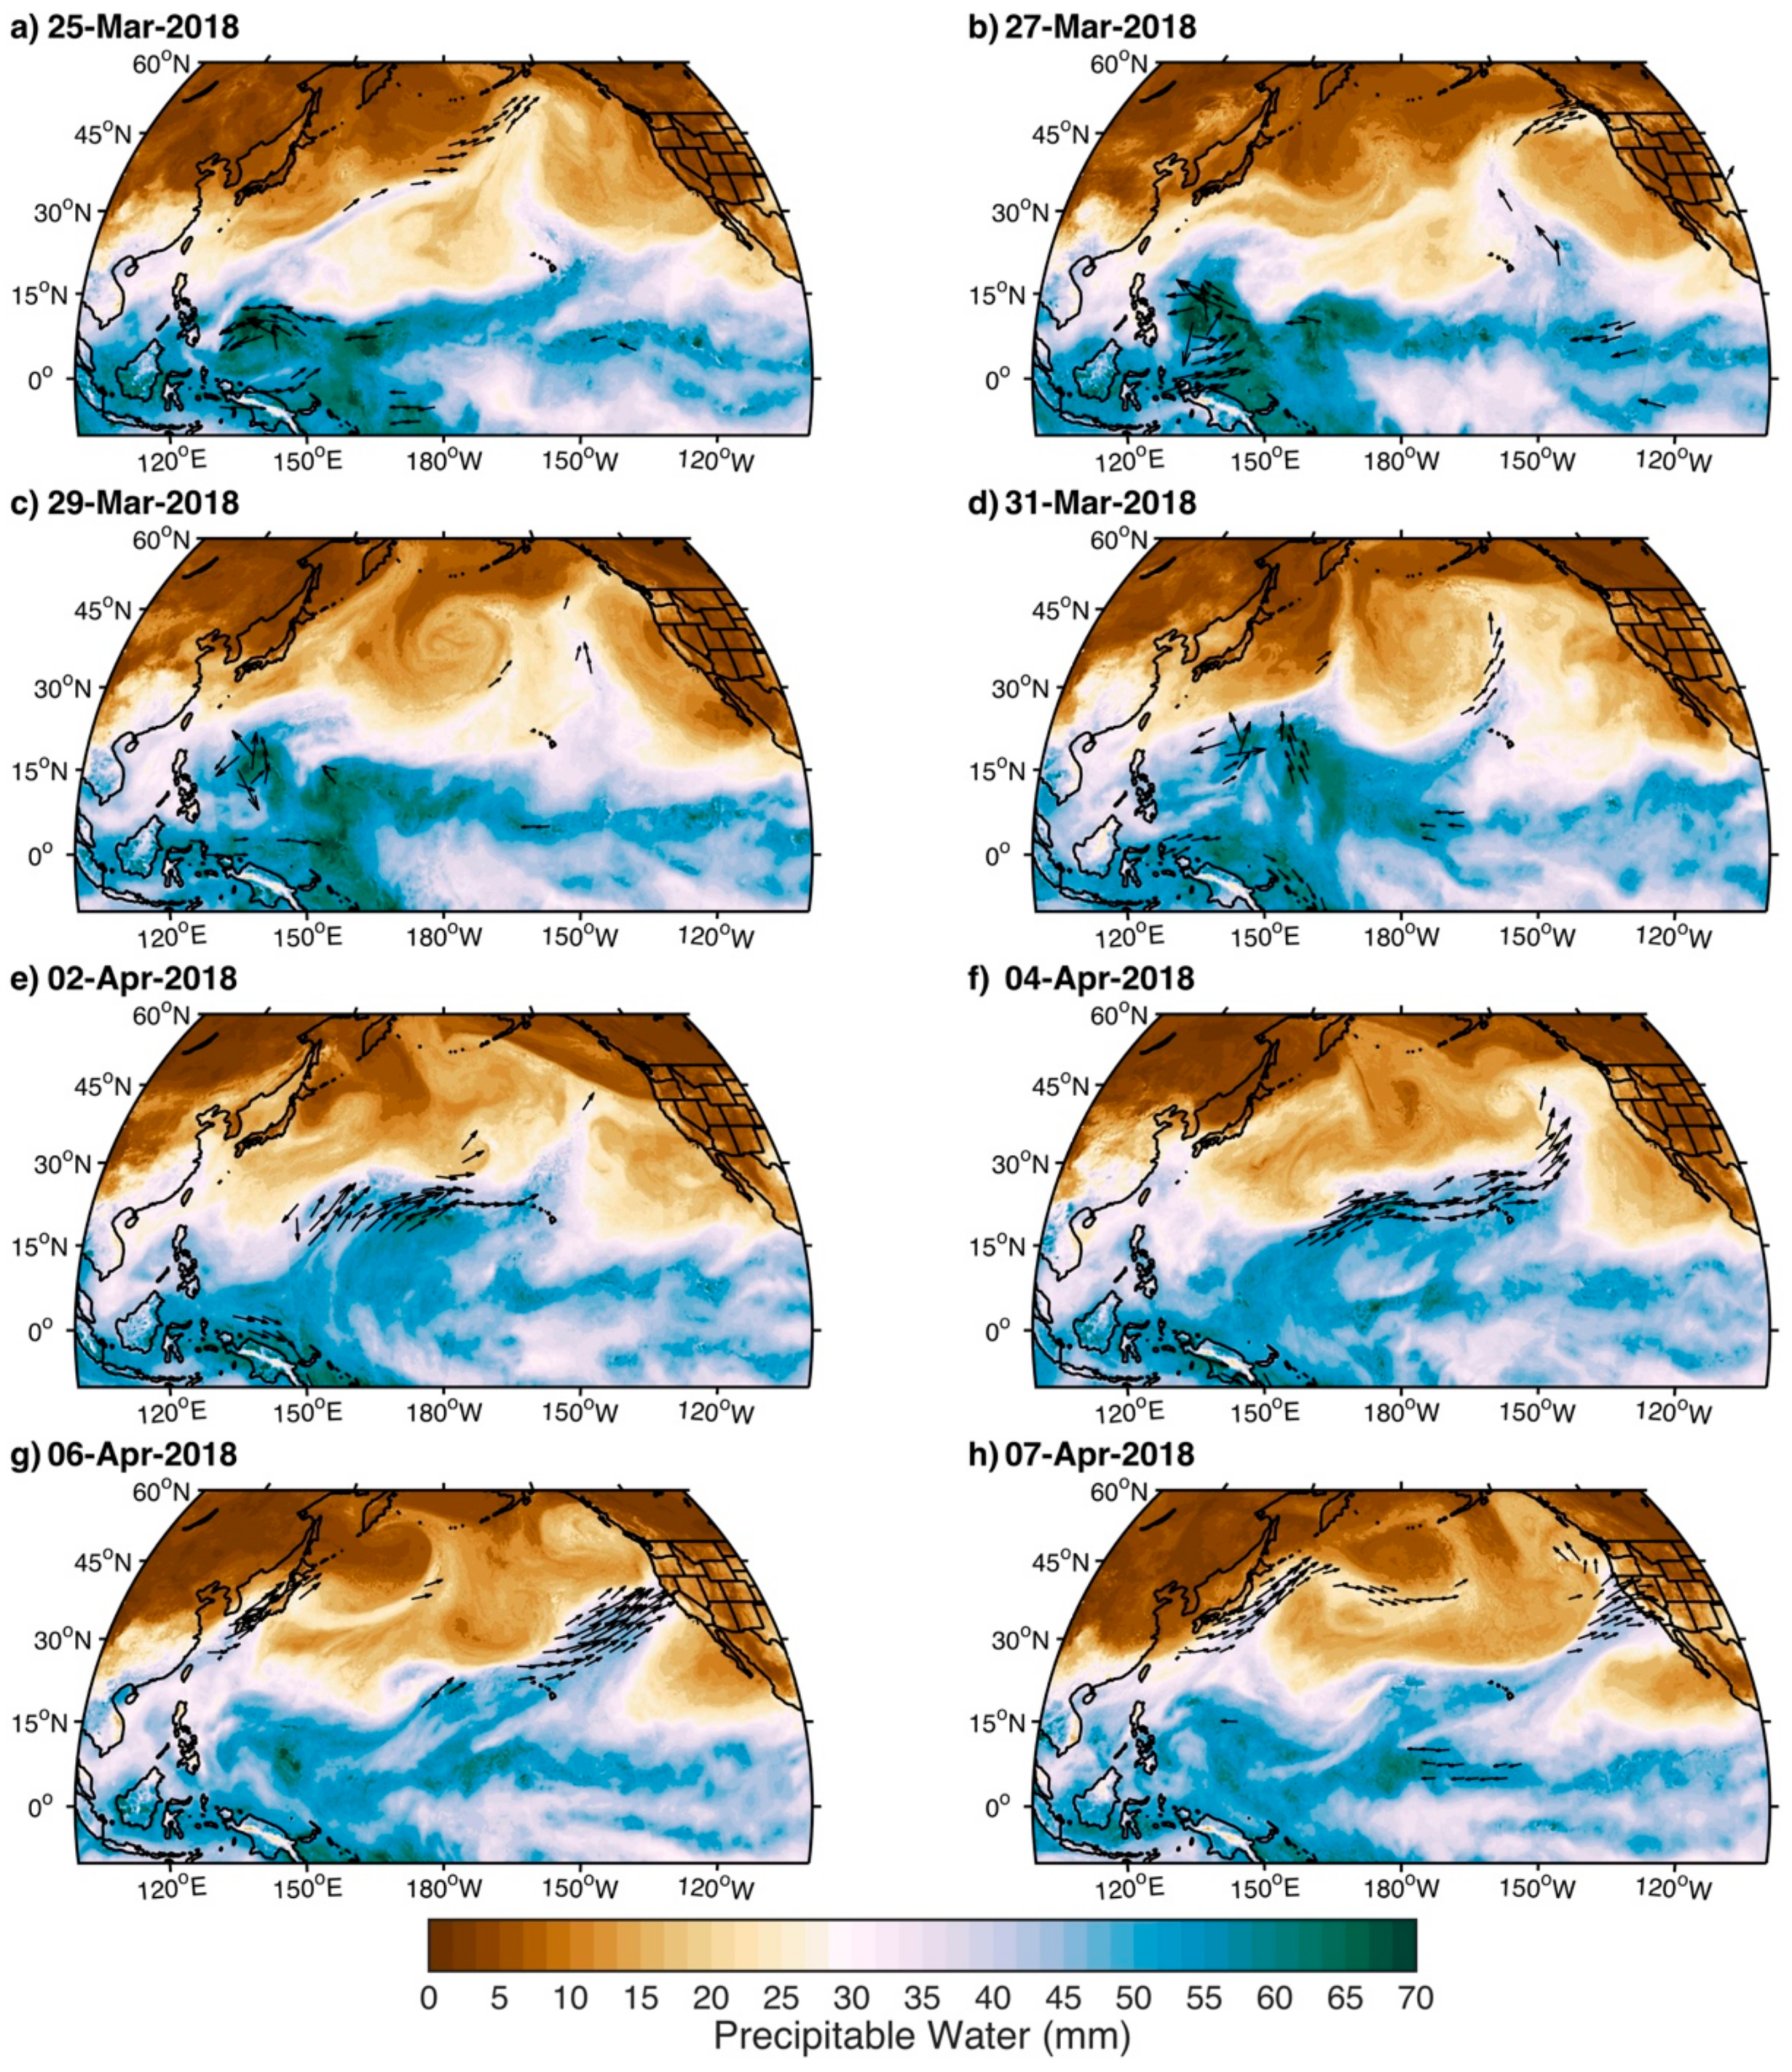
3.1. Super Typhoon Jelawat

On 25 March 2018, super typhoon Jelawat can be identified as a region of negative OLR anomalies centered at 140° E, 8° N (Figure 2a) and as a region of precipitable water exceeding 65 mm and demonstrating radial inflow (Figure 3a). Between 25–29 March, Jelawat migrated northeastward with convective outflow to the northeast as indicated by increasing negative OLR anomalies (Figure 2b,c) and enhanced precipitable water (Figure 3b,c). This outflow merged with enhanced convection centered at 140° E, 8° N on 31 March (Figure 2d). As Jelawat dissipated between 2–4 April, enhanced convection continued eastward across the Pacific along a band centered between 20° N and 30° N (Figure 2e,f). Negative OLR anomalies are observed on the equatorward side of an Aleutian low centered at the dateline (180° W; Figure 3c,d). Moisture from the remnants of Jelawat after 31 March and convective outflow from western tropical Pacific convection (Figure 2d,e) is evident in the precipitable water observations (Figure 3c–e). This moisture was entrained in the primary Aleutian low centered at the dateline (Figure 3d) before being zonally elongated by subsidiary lows moving eastward from the parent low (Figure 3e,f) towards North America. A canonical AR formed on 4 April (Figure 3f) and made landfall between 6–7 April (Figure 3g,h) with integrated vapor transport in excess of 1000 kg m−1 s−1. Just prior to and during landfall, negative OLR anomalies are observed poleward of the AR (Figure 2f–h).

3.2. The 5–7 April Atmospheric River

Precipitable water observations at the California coast indicate that atmospheric moisture began increasing at 18Z on 5 April from less than 20 mm to in excess of 40 mm on 02Z 6 April (Figure 4a). Precipitable water values remained nearly continuously above 40 mm until approximately 13Z 7 April before rapidly declining. The peak observed precipitable water value of 51.9 mm was observed at 02Z 7 April (Figure 1b and Figure 4a). Precipitation began in the northern Sierra Nevada at 04Z 6 April (Figure 4b). Two periods of intensified precipitation (>5 mm h−1) are observed, between 17Z–23Z 6 April and between 08Z–13Z 7 April. Total event precipitation was 145 mm at Bucks Lake and 83 mm at Mammoth Pass. For Bucks Lake, this represented 64% of average total April precipitation calculated from 2004–2018. Data from Pass Mammoth contained too many errors to calculate a meaningful climatology.
During the onset of the event, snow levels ranged between 2.5 km and 3.2 km (lower in the north; Figure 4c). Coincident with the increase in precipitation rates after 17Z 6 April, an abrupt snow level rise of 1–1.4 km occurred at all stations except New Exchequer, which underwent a rise approximately five hours earlier. Snow levels remained above 3 km for the remainder of the event. The highest values (>3.75 km) were observed in the southern portion of the Sierra Nevada (i.e., New Exchequer and Pine Flat Dam; Figure 4c) between 18Z 6 April and 18Z 7 April. Shasta Dam observed an approximate 0.6 km fall in snow levels after 18Z 6 April. Although Chico and Colfax also declined approximately 0.6 km during this time, snow levels rebounded to above 3.6 km during the second wave of intensified precipitation (6–10 mm h−1; Figure 4b). The greatest observed snow level rangewide was observed at New Exchequer (4.0 km); this station had 12 h of snow level observations exceeding 3.75 km.
Consistent with the onset of precipitation at 04Z 6 April, streamflow began to rise on the Middle Fork of the Feather River (Figure 4d) at 06Z 6 April and gradually increased for the next 12 h. Contemporaneous with the first intense precipitation period (Figure 4b) and abrupt rise in snow levels (Figure 4c), flow rates accelerated between 18Z 6 April and 02Z 7 April. A second period with increasing flow rates occurred at 10Z 7 April with a peak flow rate of 375 cms at 14Z 7 April. This followed the second, more intense burst of precipitation (Figure 4b).

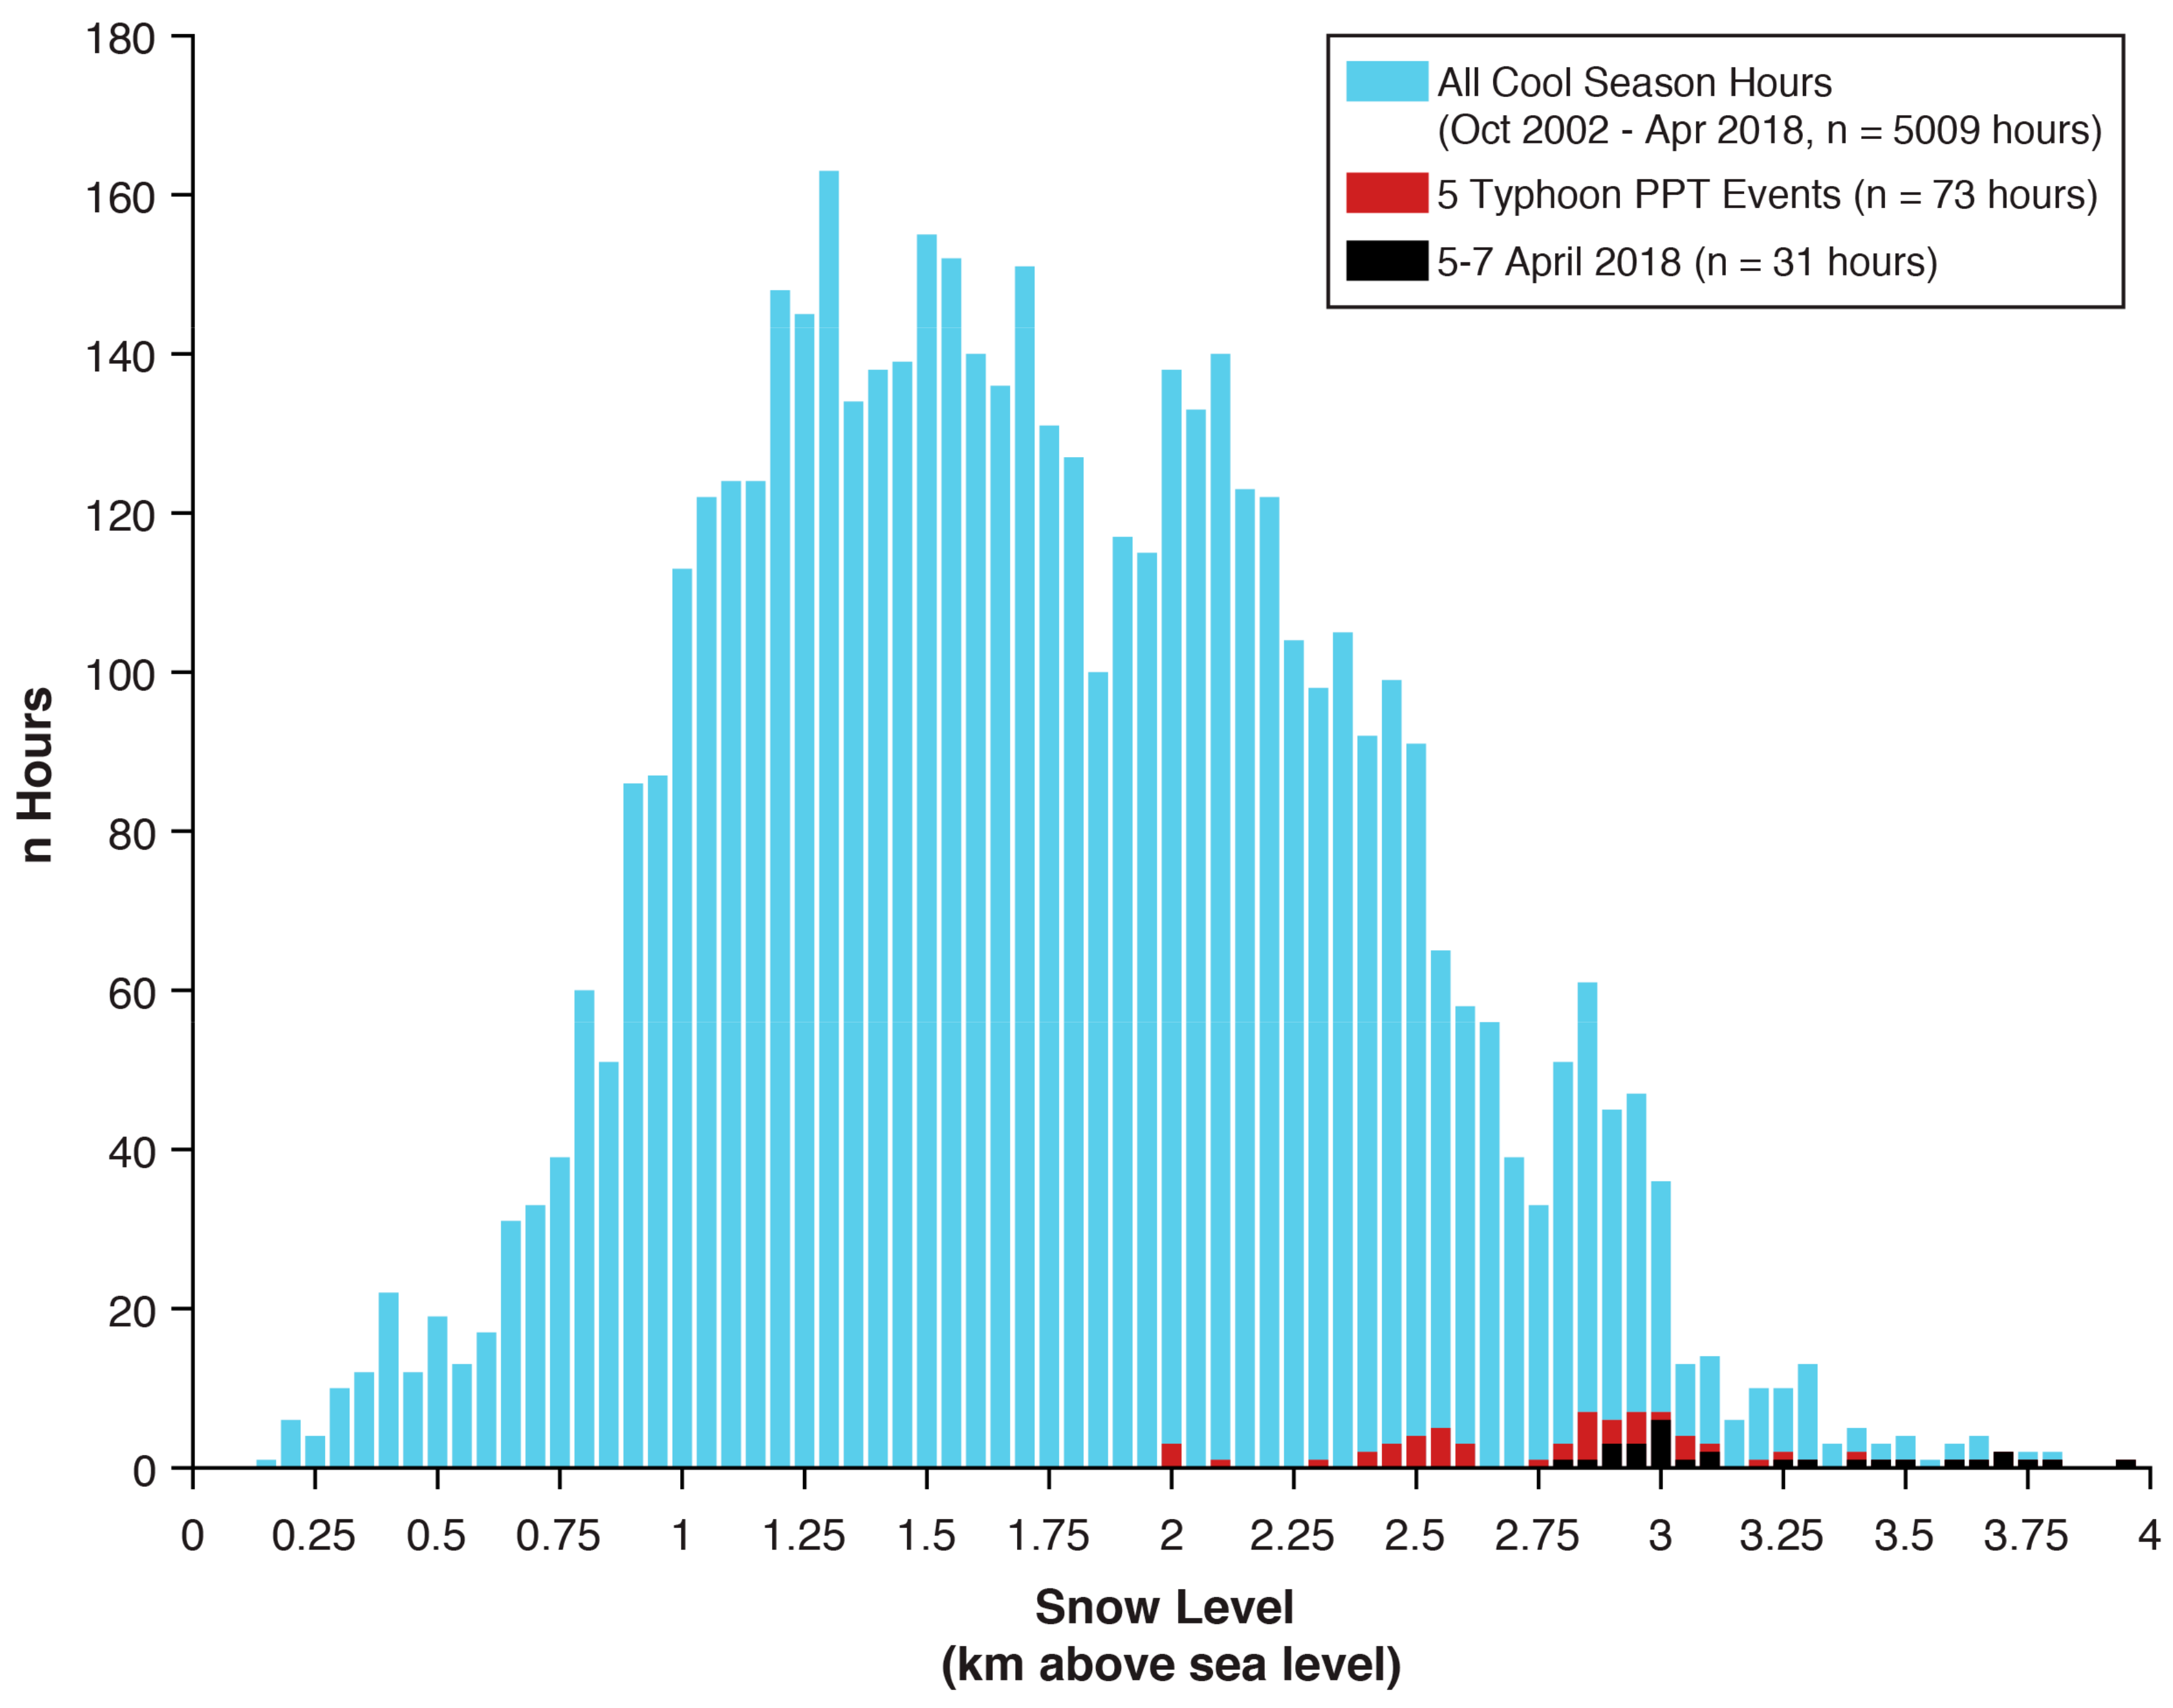
3.3. Climatological Context of Typhoon-Remnant Snow Levels

The distribution of cool season snow level observations (n = 5009 h; Figure 5) at Chico demonstrates the extremely warm nature of this event. All 31 h of observations from the 5–7 April event exceeded 2.75 km (Figure 5). This event included the greatest observed value at Chico (3.76 km) and 24% (12 h) of snow levels exceeding the 99th percentile (3.24 km). The snow levels during all typhoon-remnant precipitation events (Table 1; n = 73 h; Figure 5) have a mean of 2.92 km, which is 1.17 km higher than the cool season mean (1.75 km). A two-tailed t-test indicates significant differences (p < 0.001) between these means. 90% of snow levels during these events exceeded the 85th percentile (2.44 km) of the cool season distribution. These events compose 9% of the 85th percentile snow levels while accounting for 1.3% of the total observations. The contribution from typhoon-remnant storms increases to 16% for hours exceeding the 95th percentile and 27% for hours exceeding the 99th percentile.

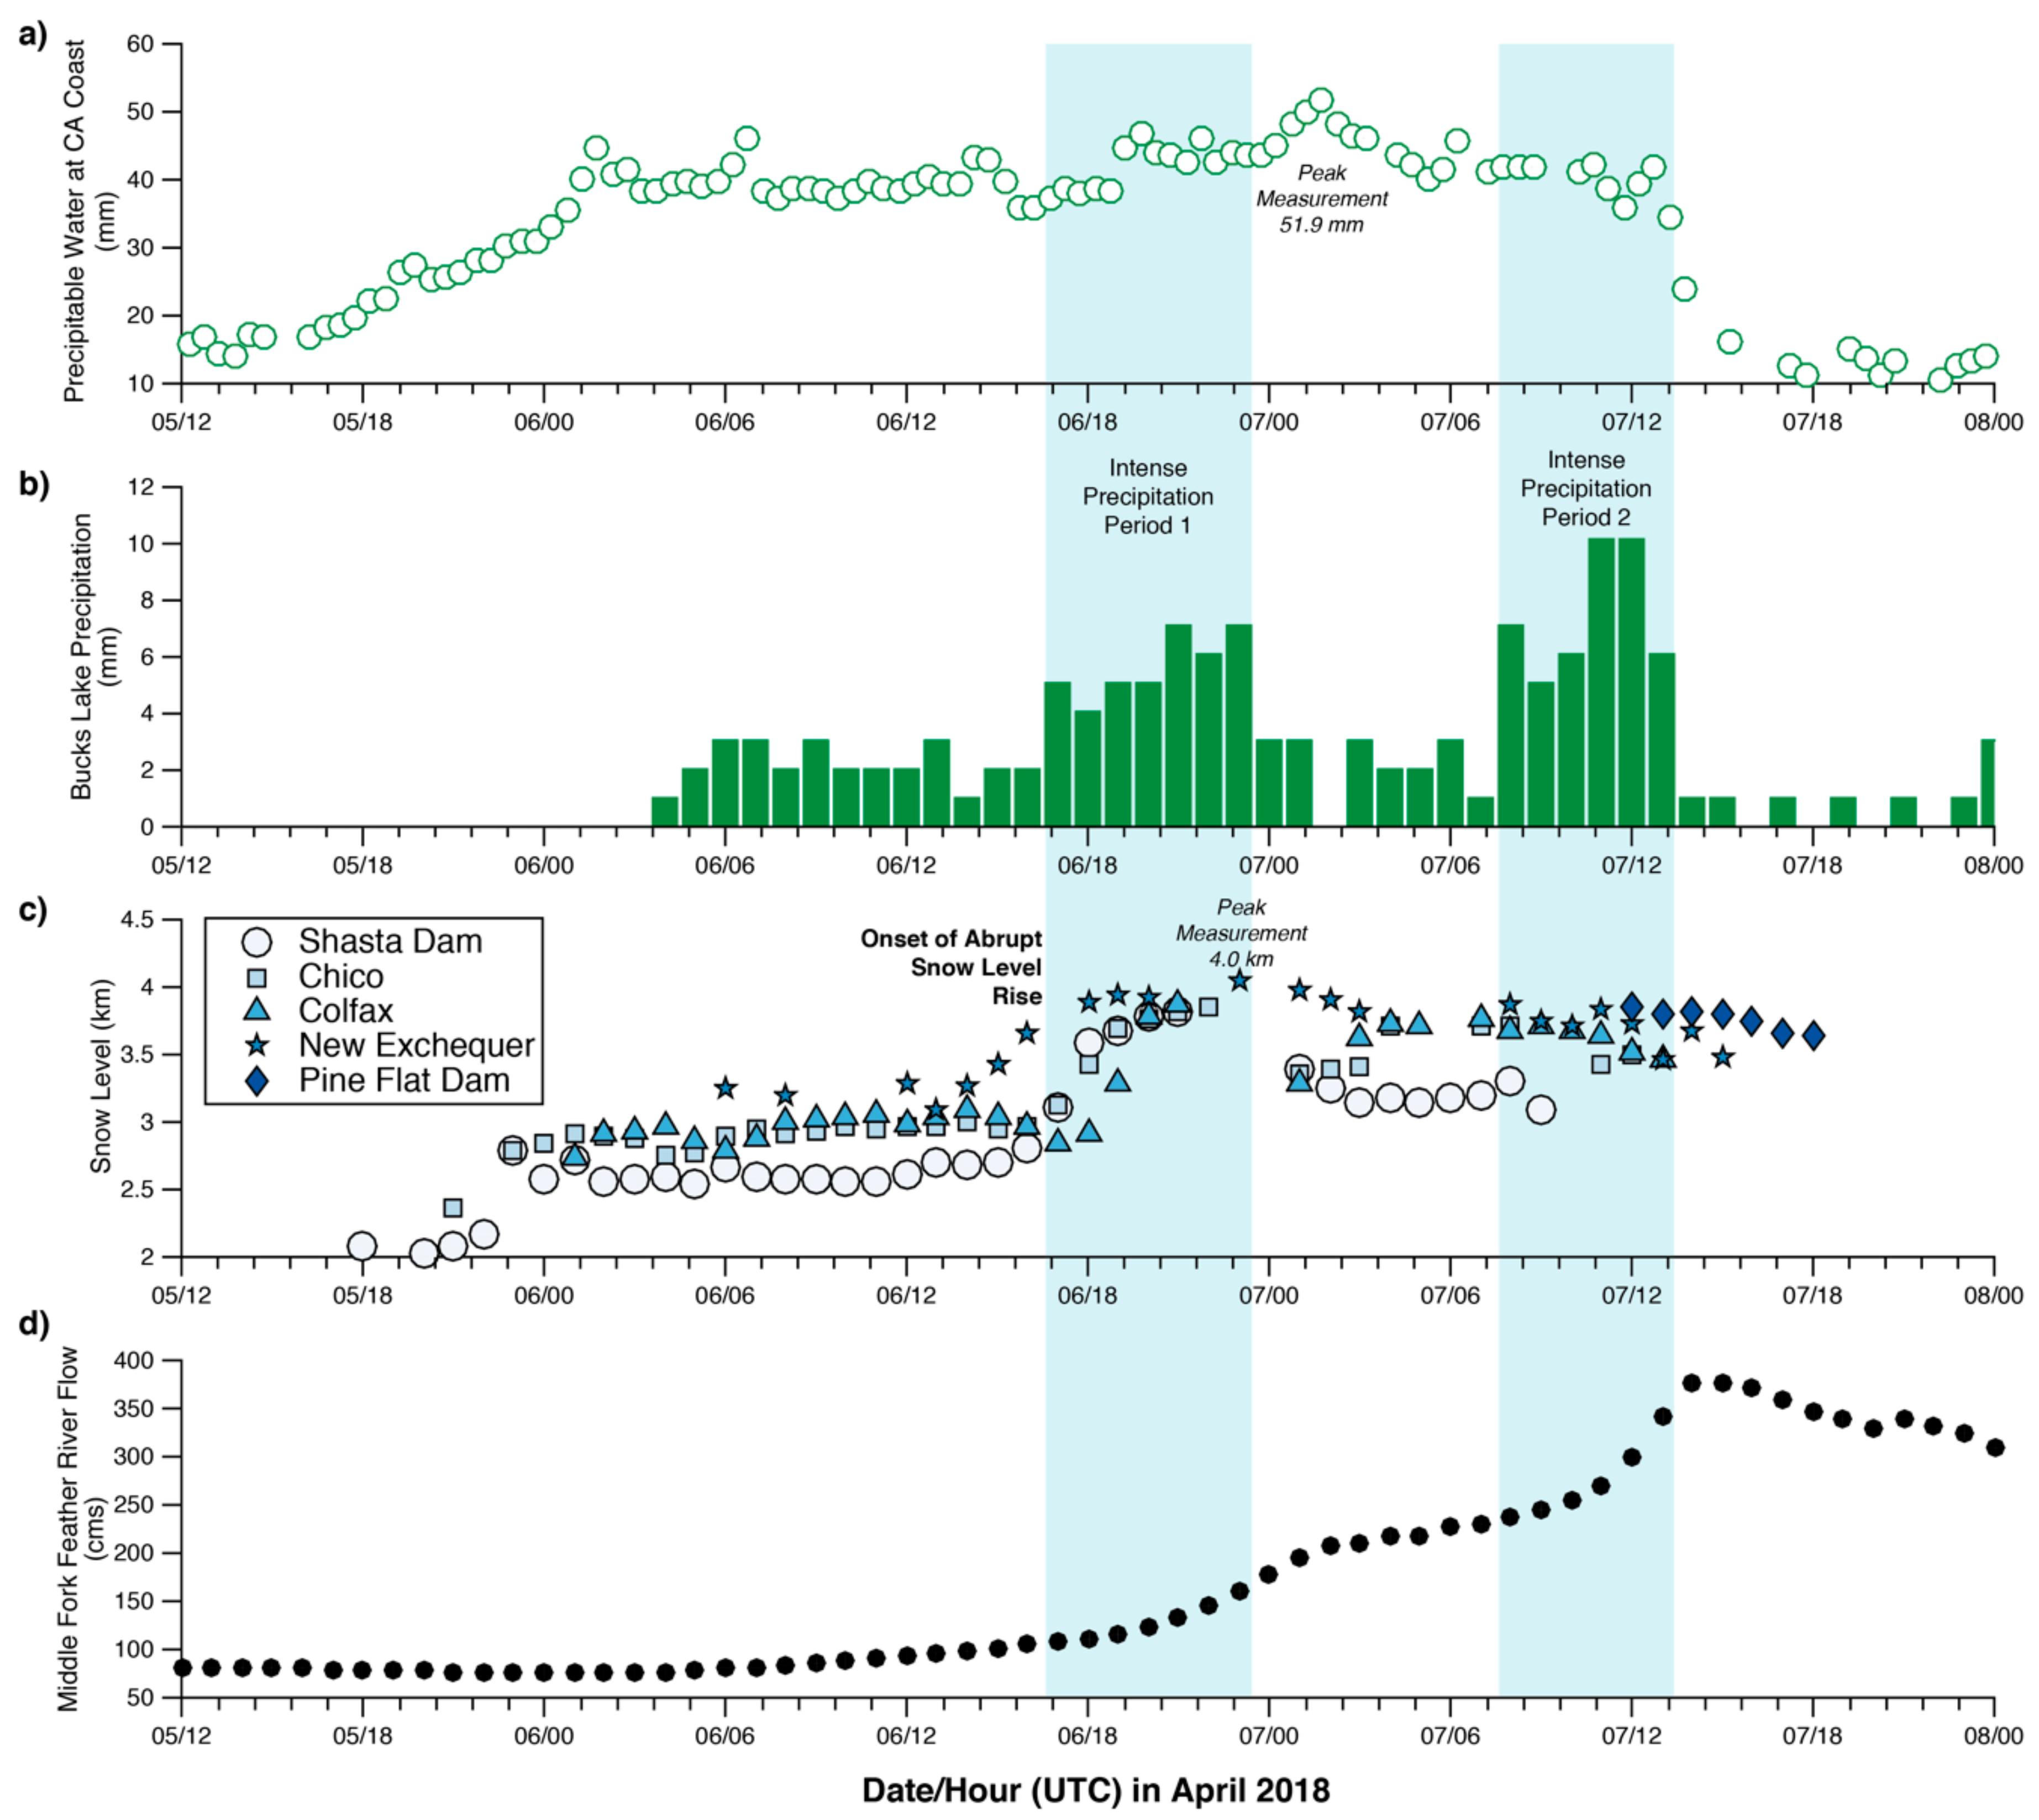
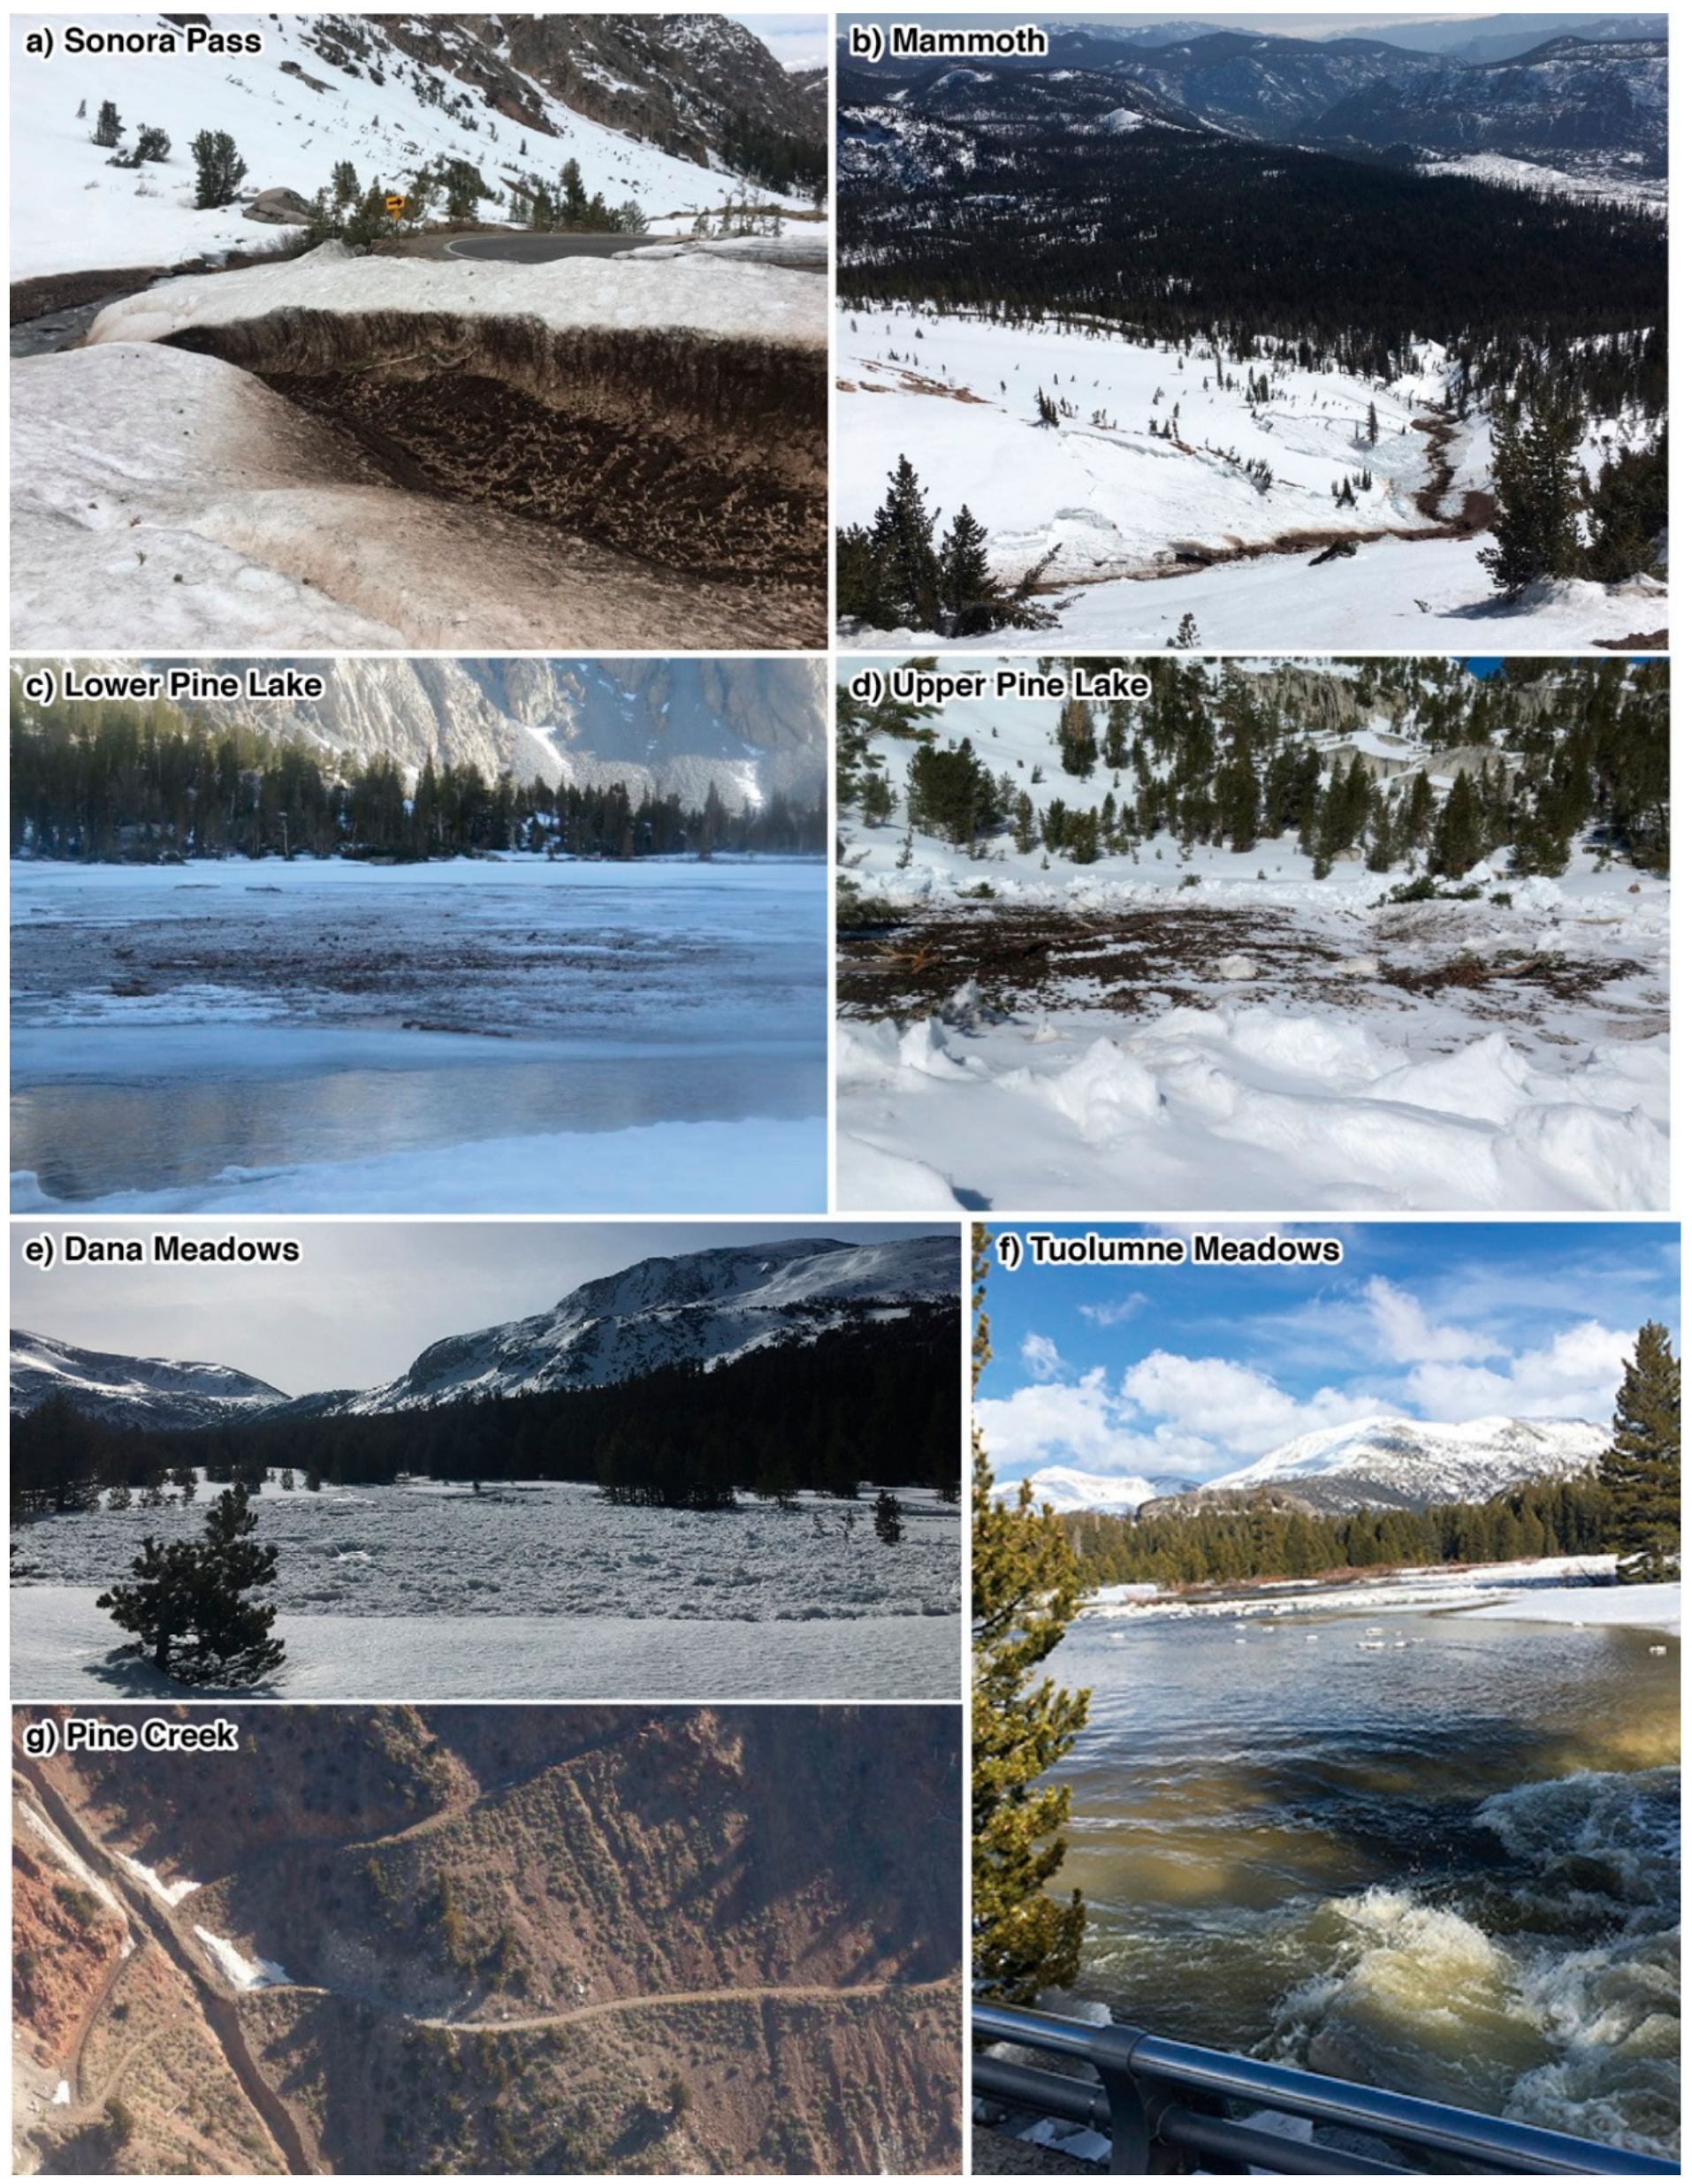
3.4. Hydrogeomorphological Impacts

Several high-elevation hydrogeomorphological impacts were documented following the event (Figure 6; see Figure 1 for location map). Anomalous high elevation (>2800 m) streamflow near Sonora Pass is demonstrated by 1 m incut channels in avalanche debris-covered creeks and the deposition of pine needles, silts and sands on the snow surface from debris-laden flow as floodwaters retreated (Figure 6a). Vegetation debris and fine-grained sediments were deposited onto the 1 m high cutbanks above the creek. Several avalanches occurred throughout the Sierra Nevada, including a wet slab avalanche that occurred on a 3000 m elevation, southwest aspect, low angle (10–15°) slope near Mammoth, California (Figure 6b). This avalanche triggered sympathetic failures on adjacent slopes and mobilized into a debris flow. The avalanche ran approximately 1000 m, was approximately 180 m wide, and had an estimated mass between 103–104 t. Other wet slab avalanches that subsequently mobilized debris flows were observed to issue debris onto the surfaces of high elevation frozen lakes, including Lower and Upper Pine Lakes (Figure 6c,d) in the Pine Creek drainage near Bishop, California. Flooding of high elevation meadows and the Tuolumne River in Tuolumne Meadows was observed immediately following the event (Figure 6e,f). Mining access roads in Pine Creek Canyon were damaged by debris chutes forming from wet snow avalanches and debris flows (Figure 6g). The high elevation hydrological response to this event was well-captured by the Merced River. The streamflow observation of 257 cms on 7 April was the highest April flow on record and the 10th largest flow since observations began in 1916 (37,102 daily observations). The severity of impacts due to Merced River flooding closed Yosemite National Park for two days [31].

4. Discussion

The evaluation of OLR, precipitable water, and integrated vapor transport over the tropical and extratropical North Pacific Ocean provides evidence for the linkage of super typhoon Jelawat to the AR that made landfall nearly two weeks later. The slowly eastward-propagating, deep northeast Pacific cyclone centered near the dateline (180° W; visible in Figure 3c) and enhanced subtropical convection (Figure 2f) following the dissipation of Jelawat on 2 April in additional to quasigeostrophic forcing and a zonally-extended North Pacific jet stream facilitated eastward and poleward transport of the typhoon’s remnant moisture. This is consistent with processes examined in a case study of two October 2010 events [16]. Precipitable water convergence along AR corridors and the role of strong frontogenesis along the poleward side of the AR [16] is evidenced by low pressure circulations and the eastward migrating region of strong (>500 kg m−1 s−1) integrated vapor transport (Figure 3g,h). This supports the notion of [32] that ARs are the “footprints” left behind from water vapor export from extratropical cyclones that converges along the cold front. However, the high snow levels associated with these events suggest that the air masses that accompany these ARs reflects the warm, tropical environment of storm origin.
A zonal extension of the East Asian subtropical jet, enhanced by poleward-propagating barotropic waves produced by western Pacific convection (the Pacific-Japan pattern), favors steering of ARs into California [33]. The present study represents a special case where the Pacific jet stream and typhoon activity influenced AR landfall. Cluster analysis performed on a regression of 850 hPa wind fields onto AR frequencies by [33] indicates three modes, the second of which is characterized by anomalously strong westerlies conducive to trans-Pacific transport of air masses from the western tropical and subtropical Pacific typhoon region. Such a pattern would contribute to the zonal elongation of precipitable water observed in the present study and noted by previous investigations [15,16]. It is also supported by composites of total water vapor (not shown) from the European Center for Medium Range Forecasting ERA-Interim product [34] for the other six typhoons (Table 1).
Although this study is focused on the time scale of weather systems, it is worth noting that super typhoon Jelawat developed during a strengthening phase of the Madden-Julian Oscillation (MJO; [35]) and during the easterly phase of the quasi-biennial oscillation (QBO; [36]). A corresponding westward shift in convection occurred between 26 March and 3 April (Figure 2a–e) with convection shifting from the Maritime Continent (phase 6) to the western Pacific (phase 7) [37]. During MJO phase 6, AR landfall activity 8–12 days later in California increases by 30–40%, with easterly QBO conditions inducing large-scale circulation anomalies over the North Pacific favoring landfall [38]. As such conditions were present during the 5–7 April event, it opens the question of whether typhoon-induced ARs may be skillfully forecast at longer-lead times. Typhoon frequency can be predicted using climate modes such as the Pacific Meridional Mode [39] and states such as Indian Ocean and Atlantic sea surface temperatures [40,41,42]. Continuing research on understanding the interannual and interseasonal variability of typhoon-induced ARs and their relations to coupled modes of ocean-atmosphere climate variability is therefore recommended. Improving long-lead time forecasts of these high impact AR events appears feasible and would provide additional time for implementing flood risk mitigation strategies [43].
This precipitation event demonstrated extremely high snow levels (Figure 4c), which are supported by comparison to the distribution of cool season snow levels (Figure 5). These high snow levels are consistent with other ARs that entrained typhoon moisture remnants (Table 1; Figure 5). The finding that ARs with typhoon-remnant origins demonstrate extremely high snow levels is consistent with the positive linear relationship between precipitable water and snow level identified during the winter season by [12]. Because this event occurred in April and a ripening antecedent snowpack was present, the impacts of the high snow levels and heavy precipitation were amplified compared to the October events. Heavy rainfall and melting snow contributed to the extreme runoff and streamflow and the magnitude of observed mass movements (Figure 6). The observations from Pine Creek, California of wet snow avalanches mobilizing debris flows that were ultimately issued upon ice-covered lakes recorded provides evidence supporting the idea that extreme hydrometeorological events can be preserved in the sedimentary record of high alpine lakes [44,45,46,47].
Typhoon-remnants entrained in ARs appear to be more common during October. October is the start of the western United States water year, which spans 1 October–30 September. The April event provides a counter-example to this perceived seasonality. Heavy October precipitation events create positive water year precipitation anomalies, which can facilitate the onset of warm snow drought conditions if rain occurs rather than snow. Warm snow droughts are characterized by near or above normal precipitation but below normal snowpack [48] and can imply that water is not being stored in the snowpack and must be managed through legally-constrained reservoir operations [14]. Other early water year warm snow droughts related to typhoons include the Columbus Day Storm in October 1962, which had origins as Typhoon Freda, and the water year 2017 warm snow drought initiated by Typhoons Songda and Haima [48].
Early water year typhoon-related precipitation events can also be beneficial. In the higher elevations of the Sierra Nevada (i.e., above 3 km) these storms can create substantial early season snowpack. At lower elevations, they can provide respite from the extended summer drought conditions that characterize California’s Mediterranean climate [49], although flooding may result [15,16]. Heavy precipitation can cause streamflows to rise above baseflow, which generally benefits ecosystems. The wetting of soils and vegetation can reduce wildfire hazard when fuel moistures are near their climatologically lowest values [50]. Conversely, under favorable synoptic and mesoscale conditions, the abundant moisture associated with these storms (Figure 4a) can generate short-duration, intense precipitation (Figure 4b), which can lead to damaging post-fire debris flows [7].

5. Conclusions

This communication provides examples of how entrainment of typhoon-originating moisture into an atmospheric river (AR) can impact hydrologic systems and natural hazards in mountain areas far removed from the region of tropical cyclogenesis. An analysis of outgoing longwave radiation and precipitable water provided evidence that super typhoon Jelawat contributed moisture to an AR that impacted the Sierra Nevada between 5–7 April 2018. This event included heavy precipitation (>80 mm) with 12 h of extremely high (>3.75 km) snow levels throughout the Sierra Nevada. This created an environment conducive to high elevation flooding and the formation of debris flows and wet snow avalanches. The deposition of debris upon frozen lakes provides direct evidence supporting [44] that lacustrine sediments in Sierra Nevada alpine environments can record extreme hydrometeorological events. Typhoon-derived precipitation appears to be more common in October in the Sierra Nevada. Compared to October events, the 5–7 April event demonstrated different impacts due to the presence of an antecedent snowpack. Typhoon-remnant storms tend to be warm, with mean snow levels that are equivalent to the 85th percentile of cool season snow levels.
Continuing work seeks to develop a robust climatology of the contributions of typhoon-remnant moisture to early water year precipitation and to explore the interannual and interseasonal variability of typhoon-induced ARs. Under projected global and regional climate change, California’s wet season is expected to become narrower and more extreme [51], which will strain existing infrastructure and water management institutions [14,52]. Warming temperatures and shifting precipitation regimes will drive increases in the fire season length [53] and intensify drought severity [37,39]. While projections vary on changes in Pacific tropical cyclogenesis frequency [54,55], tropical cyclones are expected to undergo a poleward shift [55] that may favor increases in eventual North American landfall. Future contributions of remnant typhoon moisture to early water year precipitation could become more important in relieving drought conditions and mitigating wildfire hazard along the west coast of North America, both of which have positive impacts for ecosystems and human life and property.

Funding

The project described in this publication was supported by Grant Number G14AP00076 from the United States Geological Survey. Its contents are solely the responsibility of the authors and do not necessarily represent the official views of the USGS. This manuscript is submitted for publication with the understanding that the United States Government is authorized to reproduce and distribute reprints for governmental purposes.

Acknowledgments

Susan Burak provided photographs of debris flows and wet snow avalanches in the Pine Creek drainage. MERRA products were kindly provided by Brian Kawzenuk. Two anonymous reviewers provided constructive comments and suggestions that improved the manuscript.

Conflicts of Interest

The author declares no conflict of interest. The founding sponsors had no role in the design of the study; in the collection, analyses, or interpretation of data; in the writing of the manuscript, and in the decision to publish the results.

References

  1. Dettinger, M.D.; Ralph, F.M.; Das, T.; Neiman, P.J.; Cayan, D.R. Atmospheric rivers, floods and the water resources of California. Water 2011, 3, 445–478. [Google Scholar] [CrossRef]
  2. Null, S.E.; Viers, J.H.; Mount, J.F. Hydrologic Response and Watershed Sensitivity to Climate Warming in California’s Sierra Nevada. PLOS ONE 2010, 5, e9932. [Google Scholar] [CrossRef] [PubMed]
  3. Rutz, J.J.; Steenburgh, W.J.; Ralph, F.M. Climatological characteristics of atmospheric rivers and their inland penetration over the western United States. Mon. Weather Rev. 2014, 142, 905–921. [Google Scholar] [CrossRef]
  4. Ralph, F.M.; Dettinger, M.D.; Cairns, M.M.; Galarneau, T.J.; Eylander, J. Defining “Atmospheric River”: How the Glossary of Meteorology Helped Resolve a Debate. Bull. Am. Meteorol. Soc. 2018, 99, 837–839. [Google Scholar] [CrossRef]
  5. Albano, C.; Dettinger, M.D.; Soulard, C.E. Influence of atmospheric rivers on vegetation productivity and fire patterns in the southwestern U.S. J. Geophys. Res. 2017, 122, 308–323. [Google Scholar] [CrossRef]
  6. Hatchett, B.J.; Burak, S.; Rutz, J.J.; Oakley, N.S.; Bair, E.H.; Kaplan, M.L. Avalanche Fatalities during Atmospheric River Events in the Western United States. J. Hydrometeorol. 2017, 18, 1359–1374. [Google Scholar] [CrossRef]
  7. Oakley, N.S.; Lancaster, J.T.; Kaplan, M.L.; Ralph, F.M. Synoptic conditions associated with cool season post-fire debris flows in the Transverse Ranges of southern California. Nat. Hazards. 2017, 88, 327–354. [Google Scholar] [CrossRef] [Green Version]
  8. Waliser, D.; Guan, B. Extreme winds and precipitation during landfall of atmospheric rivers. Nat. Geosci. 2017, 10, 179. [Google Scholar] [CrossRef]
  9. Hecht, C.W.; Cordeira, J.M. Characterizing the influence of atmospheric river orientation and intensity on precipitation distributions over North Coastal California. Geophys. Res. Lett. 2017, 44, 9048–9058. [Google Scholar] [CrossRef]
  10. Neiman, P.J.; Ralph, F.M.; Moore, B.J.; Hughes, M.; Mahoney, K.M.; Cordeira, J.M.; Dettinger, M.D. The Landfall and Inland Penetration of a Flood-Producing Atmospheric River in Arizona. Part I: Observed Synoptic-Scale, Orographic, and Hydrometeorological Characteristics. J. Hydrometeorol. 2013, 14, 460–484. [Google Scholar]
  11. Guan, B.; Waliser, D.E.; Ralph, F.M.; Fetzer, E.J.; Neiman, P.J. Hydrometeorological characteristics of rain-on-snow events associated with atmospheric rivers. Geophys. Res. Lett. 2016, 43, 2964–2973. [Google Scholar] [CrossRef]
  12. Hatchett, B.J.; Daudert, B.; Garner, C.B.; Oakley, N.S.; Putnam, A.E.; White, A.B. Winter Snow Level Rise in the Northern Sierra Nevada from 2008 to 2017. Water 2017, 9, 899. [Google Scholar] [CrossRef]
  13. Kapnick, S.; Hall, A. Observed Climate–Snowpack Relationships in California and their Implications for the Future. J. Clim. 2010, 23, 3446–3456. [Google Scholar] [CrossRef]
  14. Tullos, D. Opinion: How to achieve better flood risk governance in the United States. Proc. Natl. Acad. Sci. USA 2018, 115, 3731–3734. [Google Scholar] [CrossRef] [PubMed]
  15. Ralph, F.M.; Dettinger, M.D. Storms, Floods, and the Science of Atmospheric Rivers. Eos. Trans. Am. Geophys. Union. 2009, 92, 265–266. [Google Scholar] [CrossRef]
  16. Cordeira, J.M.; Ralph, F.M.; Moore, B.J. The Development and Evolution of Two Atmospheric Rivers in Proximity to Western North Pacific Tropical Cyclones in October 2010. Mon. Weather Rev. 2013, 141, 4234–4255. [Google Scholar] [CrossRef]
  17. Japanese Meteorological Agency Regional Specialized Meteorological Center Tokyo-Typhoon Center Best Track Data. Available online: https://www.jma.go.jp/jma/jma-eng/jma-center/rsmc-hp-pub-eg/trackarchives.html (accessed on 5 May 2018).
  18. MIMIC-TPW Version-2 Total Precipitable Water. Available online: ftp://ftp.ssec.wisc.edu/pub/mtpw2/data/ (accessed on 1 May 2018).
  19. Wimmers, A.J.; Velden, C.S. Seamless Advective Blending of Total Precipitable Water Retrievals from Polar-Orbiting Satellites. J. Appl. Meteorol. Climatol. 2010, 50, 1024–1036. [Google Scholar] [CrossRef]
  20. Rienecker, M.M.; Suarez, M.J.; Gelaro, R.; Todling, R.; Bacmeister, J.; Liu, E.; Bosilovich, M.G.; Schubert, S.D.; Takacs, L.; Kim, G.-K.; et al. MERRA: NASA’s modern-era retrospective analysis for research and applications. J. Clim. 2011, 24, 3624–3648. [Google Scholar] [CrossRef]
  21. National Oceanic and Atmospheric Administration (NOAA) Daily (non-interpolated) Outgoing Longwave Radiation (OLR). Available online: https://www.esrl.noaa.gov/psd/data/gridded/data.uninterp_OLR.html (accessed on 7 May 2018).
  22. COSMIC Suominet Real-time Integrated Atmospheric Water Vapor From GPS. Available online: http://suominet.ucar.edu/ (accessed on 25 April 2018).
  23. White, A.B.; Gottas, D.J.; Strem, E.T.; Ralph, F.M.; Neiman, P.J. An automated brightband height detection algorithm for use with Doppler radar spectral moments. J. Atmos. Ocean. Technol. 2002, 19, 687–697. [Google Scholar] [CrossRef]
  24. Johnston, P.E.; Jordan, J.R.; White, A.B.; Carter, D.A.; Costa, D.M.; Ayers, T.E. The NOAA FM-CW snow-level radar. J. Atmos. Ocean. Technol. 2017, 34, 249–267. [Google Scholar] [CrossRef]
  25. White, A.B.; Gottas, D.J.; Henkel, A.F.; Neiman, P.J.; Ralph, F.M.; Gutman, S.I. Developing a performance measure for snow-level forecasts. J. Hydrometeorol. 2010, 11, 739–753. [Google Scholar] [CrossRef]
  26. White, A.B.; Anderson, M.L.; Dettinger, M.D.; Ralph, F.M.; Hinojosa, A.; Cayan, D.R.; Hartman, R.K.; Reynolds, D.W.; Johnson, L.E.; Schneider, T.L.; et al. A twenty-first-century California observing network for monitoring extreme weather events. J. Atmos. Ocean. Technol. 2013, 30, 1585–1603. [Google Scholar] [CrossRef]
  27. California Department of Water Resources Data Exchange Center. Available online: http://cdec.water.ca.gov/queryTools.html (accessed on 25 April 2018).
  28. United States Geological Survey National Water Information System. Available online: https://waterdata.usgs.gov/nwis/dv?cb_00060=on&format=gif_default&site_no=11266500&referred_module=sw&period=&begin_date=1916-10-01&end_date=2018-04-30 (accessed on 30 April 2018).
  29. Eastern Sierra Avalanche Center Avalanche Observations: Wet Slab in Fresno Bowl. Available online: http://esavalanche.org/content/wet-slab-fresno-bowl (accessed on 11 May 2018).
  30. Tuolumne Meadows Winter Conditions: Update for April 11, 2008. Available online: https://www.nps.gov/yose/blogs/update-for-april-11-2018.htm (accessed on 15 May 2018).
  31. Yosemite Park Experienced Significant Impacts from The Storm. Available online: https://www.nps.gov/yose/learn/news/yosemite-national-park-experienced-significant-impacts-from-storm.htm (accessed on 16 May 2018).
  32. Dacre, H.F.; Clark, P.A.; Martinez-Alvarado, O.; Stringer, M.A.; Lavers, D.A. How Do Atmospheric Rivers Form? Bull. Am. Meteorol. Soc. 2015, 96, 1243–1255. [Google Scholar] [CrossRef]
  33. Zhang, W.; Villarini, G. Uncovering the role of the East Asian jet stream and heterogeneities in atmospheric rivers affecting the western United States. Proc. Natl. Acad. Sci. USA 2018. [Google Scholar] [CrossRef] [PubMed]
  34. Dee, D.P.; Uppala, S.M.; Simmons, A.J.; Berrisford, P.; Poli, P.; Kobayashi, S.; Andrae, U.; Balmaseda, M.A.; Balsamo, G.; Bauer, D.P.; et al. The ERA-Interim reanalysis: Configuration and performance of the data assimilation system. Q. J. R. Meteorol. Soc. 2011, 137, 553–597. [Google Scholar] [CrossRef]
  35. Zhang, C. Madden-Julian Oscillation: bridging weather and climate. Bull. Am. Meteorol. Soc. 2013, 94, 1849–1870. [Google Scholar] [CrossRef]
  36. Scaife, A.A.; Athanassiadou, M.; Andrews, M.; Arribas, A.; Baldwin, M.; Dunstone, N.; Knight, J.; MacLachlan, C.; Manzini, E.; Müller, W.A.; et al. Predictability of the quasi-biennial oscillation and its northern winter teleconnection on seasonal to decadal timescales. Geophys. Res. Lett. 2014, 41, 1752–1758. [Google Scholar] [CrossRef] [Green Version]
  37. Australian Government Bureau of Meteorology, Madden-Julian Oscillation Phase Diagram. Available online: http://www.bom.gov.au/climate/mjo/ (accessed on 4 June 2018).
  38. Mundhenk, B.D.; Barnes, E.A.; Maloney, E.D.; Baggett, C.F. Skillful empirical subseasonal forecasts of landfalling atmospheric river activity using the Madden-Julian Oscillation and the quasi-biennial oscillation. NPJ Clim. Atmos. Sci. 2018, 1, 20177. [Google Scholar] [CrossRef]
  39. Zhang, W.; Vecchi, G.A.; Murakami, H.; Villarini, G.; Jia, L. The Pacific Meridional Mode and the Occurrence of Tropical Cyclones in the Western North Pacific. J. Clim. 2016, 29, 381–398. [Google Scholar] [CrossRef]
  40. Zhan, R.; Wang, Y.; Lei, X. Contributions of ENSO and East Indian Ocean SSTA to the Interannual Variability of Northwest Pacific Tropical Cyclone Frequency. J. Clim. 2011, 24, 509–521. [Google Scholar] [CrossRef]
  41. Gao, S.; Chen, Z.; Zhang, W. Impacts of Tropical North Atlantic SST on Western North Pacific Landfalling Tropical Cyclones. J. Clim. 2018, 31, 853–862. [Google Scholar] [CrossRef]
  42. Yu, J.; Li, T.; Tan, Z.; Zhu, Z. Effects of tropical North Atlantic SST on tropical cyclone genesis in the western North Pacific. Clim. Dyn. 2016, 46, 865–877. [Google Scholar] [CrossRef]
  43. Baggett, C.F.; Barnes, E.A.; Maloney, E.D.; Mundhenk, B.D. Advancing atmospheric river forecasts into subseasonal-to-seasonal time scales. Geophys. Res. Lett. 2017, 44, 7528–7536. [Google Scholar] [CrossRef]
  44. Ashford, J. Variations in California Climate and Lake Productivity During the Holocene. M.S. Thesis, University of California, Riverside, CA, USA, September 2017. Available online: https://cloudfront.escholarship.org/dist/prd/content/qt0xq7s90m/qt0xq7s90m.pdf (accessed on 10 May 2018).
  45. Luckman, B. Drop stones resulting from snow-avalanche deposition on lake ice. J. Glaciol. 1975, 14, 186–188. [Google Scholar] [CrossRef]
  46. Nesje, A.; Bakke, J.; Dahl, S.O.; Lie, Ø.; Bøe, A.G. A continuous, high-resolution 8500-yr snow-avalanche record from western Norway. Holocene 2002, 17, 269–277. [Google Scholar] [CrossRef]
  47. Seierstad, J.; Nesje, A.; Dahl, S.O.; Simonsen, J.R. Holocene glacier fluctuations of Grovabreen and Holocene snow-avalanche activity reconstructed from lake sediments in Grningstlsvatnet, western Norway. Holocene 2002, 12, 211–222. [Google Scholar] [CrossRef]
  48. Hatchett, B.J.; McEvoy, D.J. Exploring the origins of snow drought in the northern Sierra Nevada, California. Earth Interact. 2018, 22, 1–13. [Google Scholar] [CrossRef]
  49. Polade, S.D.; Gershunov, A.; Cayan, D.R.; Dettinger, M.D.; Pierce, D.W. Precipitation in a warming world: Assessing projected hydro-climate changes in California and other Mediterranean climate regions. Sci. Rep. 2017, 7, 10783. [Google Scholar] [CrossRef] [PubMed]
  50. Nauslar, N.J.; Abatzoglou, J.T.; Marsh, P.T. The 2017 North Bay and Southern California Fires: A Case Study. Fire 2018. [Google Scholar] [CrossRef]
  51. Swain, D.L.; Langenbrunner, B.; Neelin, J.D.; Hall, A. Increasing precipitation volatility in twenty-first-century California. Nat. Clim. Change 2018, 8, 427–433. [Google Scholar] [CrossRef]
  52. Sterle, K.; Hatchett, B.; Singletary, L.; Pohll, G. Hydroclimate Variability in Snow-fed River Systems: Local Water Managers’ Perspectives on Adapting to the New Normal. Bull. Am. Meteorol. Soc. 2018. Submitted. [Google Scholar]
  53. Brown, T.J.; Hall, B.L.; Westerling, A.L. The impact of twenty-first century climate change on wildland fire danger in the western United States: an applications perspective. Clim. Change 2004, 62, 365–388. [Google Scholar] [CrossRef]
  54. Mei, W.; Xie, S.P.; Primeau, F.; McWilliams, J.C.; Pasquero, C. Northwestern Pacific typhoon intensity controlled by changes in ocean temperatures. Sci. Adv. 2015, 1, e1500014. [Google Scholar] [CrossRef] [PubMed] [Green Version]
  55. Nakamura, J.; Camargo, S.J.; Sobel, A.H.; Henderson, N.; Emanuel, K.A.; Kumar, A.; LaRow, T.E.; Murakami, H.; Roberts, M.J.; Scoccimarro, E.; et al. Western North Pacific tropical cyclone model tracks in present and future climates. J. Geophys. Res. Atmos. 2017, 122, 9721–9744. [Google Scholar] [CrossRef]
Figure 1. Map of study area. Abbreviations include: Shasta Dam (STD), Bucks Lake (BKL), Chico (CCO), Middle Fork of the Feather River at Merrimac (MFF), Colfax (CFC), Merced River at Pohono Bridge (MRP), Half Moon Bay (OXMT), Mammoth Pass (MHP); New Exchequer (NEW), and Pine Flat Dam (PFD).
Atmosphere 09 00233 g001
Figure 2. Non-interpolated outgoing longwave radiation anomalies (W m2) for (a) 25 March 2018; (b) 27 March 2018; (c) 29 March 2018; (d) 31 March 2018; (e) 2 April 2018; (f) 4 April 2018; (g) 6 April 2018; (h) 7 April 2018. The green star denotes the approximate center of the typhoon based on Japanese Meteorological Agency Regional Specialized Meteorological Center (RSMC) Tokyo-Typhoon Center best track data [17] for panels (ad). The typhoon center is estimated for panel (e) based on analysis of MERRA 1000 hPa geopotential height and sea level pressure [20].
Atmosphere 09 00233 g002
Figure 3. Morphed Integrated Microwave Imagery at CIMMS (Cooperative Institute for Meteorological Satellite Studies)-Total Precipitable Water version 2 (MIMIC-TPW2; [18]) total precipitable water (mm; filled contours) observations and MERRA (Modern-Era Retrospective analysis for Research and Applications) integrated vapor transport (IVT; kg m−1 s−1; black vectors) for: (a) 25 March 2018; (b) 27 March 2018; (c) 29 March 2018; (d) 31 March 2018; (e) 2 April 2018; (f) 4 April 2018; (g) 6 April 2018; (h) 7 April 2018. Only IVT vectors exceeding 500 kg m−1 s−1 are plotted with the largest vector equal to 1500 kg m−1 s−1. For clarity, only every fifth IVT vector is shown.
Atmosphere 09 00233 g003
Figure 4. (a) Time series of precipitable water (mm) at the California (CA) coast near Half Moon Bay; (b) precipitation observations (mm) at Bucks Lake, California; (c) brightband-derived snow levels at five snow level radars upstream of the Sierra Nevada crest (km; ordered from north to south) and (d) observed streamflow (cms) on the Middle Fork of the Feather River. Vertical blue bars denote the two periods of intense precipitation.
Atmosphere 09 00233 g004
Figure 5. Histogram of hours of observed snow levels (km) at Chico, California for all cool seasons (October–April; blue bars), five other typhoon remnant-related precipitation (PPT) events (red bars; composed of six typhoon remnants), and the 5–7 April 2018 event (black bars).
Atmosphere 09 00233 g005
Figure 6. High elevation hydrogeomorphological impacts of the 5–7 April atmospheric river. (a) Deadman Creek near Sonora Pass (2698 m); (b) Fresno Bowl avalanche near Mammoth, California (3000 m); (c) Deposition of debris onto Lower Pine Lake (3032 m); (d) Deposition of debris onto Upper Pine Lake (3109 m); (e) Flooding of Dana Meadow (2962 m); (f) Flooding of the Tuolumne River in Tuolumne Meadows (2626 m); (g) Pine Creek mining road cut by debris chute (~2700 m).
Atmosphere 09 00233 g006
Table 1. Additional potential typhoon remnant-derived precipitation events.
Precipitation Date(s)Typhoon Name (Previous Study)Typhoon Dates 1
4 October 2008Jangmi24 September–5 October 2008
14 October 2009Melor [15]9 September–11 October 2009
24–25 October 2010Megi [16]13–24 October 2010
24–25 October 2010Chaba [16]23 October–1 November 2010
15–17 October 2016Songda3–13 October 2016
28–31 October 2016Haima23 October–1 November 2016
1 Based upon the Japanese Meteorological Agency Regional Specialized Meteorological Center (RSMC) Tokyo—Typhoon Center best track typhoon dataset [17].

