Abstract
The Sea Surface Temperature (SST) in the South Tropical Indian Ocean (STIO) displays significant intraseasonal oscillation (ISO) in two regions. A striking 30–50-day ISO found over the east of thermocline ridge (Region A, 80–90° E, 6–12° S), as identified by the Empirical Mode Decomposition (EMD) method, is distinguished from the SST signature over the thermocline ridge (Region B, 52.5–65° E, 6–13° S). The 30–50-day ISO of SST in the Region A is active in March–May (MAM) and suppressed in September–November (SON). Meanwhile, a 30–50-day ISO of precipitation correlates with the SST over the Region A. SST leads precipitation by 10 days, implying a pronounced ocean–atmosphere interaction at the intraseasonal timescale, especially the oceanic feedback to the atmosphere during Madden–Julian Oscillation (MJO) events. Analysis on mechanism of the ISO manifests heat fluxes are critical to the development of the intraseasonal SST variability. The local thermocline in Region A, as the shallowest in MAM and the thickest in SON, is likely to modulate the strength of ISO and contribute to its sustainability. It suggests that thermocline plays a more important role in Region A than in Region B, leading to the difference between the two regions.
1. Introduction
The southern tropical Indian Ocean (STIO) features remarkable intraseasonal sea surface temperature (SST) variability as a result of ocean–atmosphere interaction between SST and strong atmospheric intraseasonal oscillations (ISOs) [1,2,3,4]. The eastward propagating Madden–Julian Oscillation (MJO), one of the most well-known ISOs, can affect the Indian Monsoon [5] and global climate [6,7] significantly. In particular, MJO can induce large SST variation in the Indo-Pacific. In such ocean–atmosphere coupled process, the surface heat fluxes, including the insolation and latent heat flux, play important roles [8]. Hendon and Glick [9] analyzed the ocean–atmosphere interaction in the Indo-Pacific region, and found the intraseasonal SST variability with an amplitude of ~0.3 °C lags 1/4 cycle behind the convection of MJO, suggesting the SST variation is induced by ISO. Woolnough et al. [10] complemented that warm SST anomalies lead the convective maximum about 10 days and negative SST anomalies lag the convection about 10 days. Jones et al. [11] investigated the SST variation during the life cycle of MJO was due to changes of shortwave radiation and latent heat, and suggested a possible feedback between the atmospheric and oceanic intraseasonal oscillation. Modeling studies have also been conducted on the effect of MJO [12,13,14,15,16]. Han et al. [17] utilized both observations and model to examine the impact of atmospheric ISOs on intraseasonal SST variability, noting that the wind associated with MJO contributes to the 30–90-day ISO of SST. In Saji et al. [18], the sub-seasonal SST anomalies reach the peak during December–February (DJF) and persist to March and, meanwhile, the Intertropical Convergence Zone (ITCZ) attains its most southern extension. After that, the accompanied atmospheric convection and anomalous westerly wind lead to strong SST variability [18]. All these studies mentioned above mainly examined the atmospheric forcing on SST.
The feedback of SST on atmospheric convection is also important to ISOs. According to the analysis of Wu et al. [19], SST is usually driven by atmosphere in the subtropics, while, in the tropics, atmosphere is driven by SST. Warmer SST leads to more frequent and intense deep convection [20,21]. Previous studies revealed the effect of SST on structure and propagation of ISO [22,23,24,25]. Generally, precipitation is used as a proxy for analyzing anomalous convection activities. Thus, SST can theoretically be used as a predictor of precipitation [26,27,28].
Extensive studies have documented the predictive relationships between Indian Ocean SST and precipitation on interannual and seasonal time scales. Meehl [29] showed SST anomalies contribute to the remarkable biennial oscillation of the monsoon precipitation. He further analyzed the mechanism on maintaining the coupled ocean–atmosphere interaction [30,31]. Furthermore, the intraseasonal ocean–atmosphere coupling is seasonal dependent [19,32]. Indian summer precipitation is highly relevant to the central Indian Ocean SST in the preceding September–November. The correlation is up to 0.87 for the period 1977–1994 [33]. Chen et al. [34] noted the local air–sea coupling is especially important during the March–May (MAM) for precipitation prediction. Both empirical and modeling studies have advanced in investigating the impact of SST on atmospheric ISOs at intraseasonal timescales. These studies showed that precipitation lags SST anomalies about 5–15 days [10,19,21,25,35]. Comparing models forced by daily SST and climatological SST, Pegion and Kirtman [25] emphasized the importance of intraseasonal SST variability and showed the intraseasonal signal of precipitation is the strongest in simulation forced by daily SST. Johnson and Ciesielski [36] executed a detailed examination on the dynamic and thermal properties of MJO during October and November 2011, noting two east–west precipitation bands exist over north and south of the equator where SST gradients appear to be the strongest. They argued the northern heavy precipitation is mainly caused by MJO, while the southern is attributed to ITCZ convection. Studies above focused on the seasonal and interannual variability or events during specific periods such as summer monsoon or active stage of MJO (November–February). However, studies on the comparison of different ISOs within 30–90 days are deficient.
Air–sea heat flux and interior oceanic factors are important in driving the intraseasonal variability of SST. Previous studies suggested that the Seychelles-Chagos Thermocline Ridge (SCTR, 50–75 °E, 2–12 °S) is critical to the ocean–atmosphere interaction processes on the MJO time scale. On the one hand, the SCTR is important to the onset of MJO and its rapid intensification [37,38,39]. On the other hand, SST in this region is sensitive to subsurface processes due to the raised thermocline caused by a local negative wind curl and upwelling [40,41,42,43]. It is noteworthy to investigate the role of thermocline because the oceanic states provide potential predictability for the MJO activity since the ocean retains the memory of the ocean–atmosphere interaction [41]. The ocean–atmosphere interaction and interior ocean variations over the SCTR had been extensively studied. However, the east to the SCTR, where thermocline is also relatively shoal with obvious seasonality await further investigations. Jayakumar et al. [44,45] examined atmospheric and oceanic effects for intraseasonal SST variability in the artificial box 60–90° E, 5–10° S, suggesting the intraseasonal SST variability is dominated by heat flux. However, they only focused on DJF and did not refer to the feedback of SST.
In the present study, we try to compare the intraseasonal SST variability in regions to the east of the SCTR (Region A) and in the SCTR (Region B). At the intraseasonal timescale (30–90-day), the 30–50-day ISO is notably strong (while the rest signals seem to be suppressed in Region A), which is different from Region B. Annual cycles in the two regions are also distinct. It is interesting that the 30–50-day intraseasonal SST variability in Region A is more likely to exert a consistent precipitation variability. Although significant progress has been made [46,47,48], precise prediction of MJO still remains limited due to the inadequate understanding of the coupled processes [18,49,50,51,52]. Therefore, detailed investigations are necessary.
2. Data and Methods
We use National Oceanic and Atmospheric Administration (NOAA, Boulder, CO, USA) daily Optimum Interpolation SST [53] data with 0.25° × 0.25° resolution in the period of 1982–2016. The 2.5° × 2.5° gridded pentad precipitation data derived from Merged Analysis of Precipitation (CMAP) dataset are available for the same period [54]. We temporarily convert the SST data to pentad for comparison with precipitation when analyzing their correlation. The National Centers for Environmental Prediction-National Centers for Atmospheric Research (NCEP-NCAR, Boulder, CO, USA) provide daily wind reanalysis data for our study period [55]. To analyze thermocline variability, we use the simple ocean data assimilation (SODA) version 2.2.4 product [56] for vertical sea temperature in the period of 1982–2010. It has 40 vertical levels from 5 m to 5375 m depth underneath the sea surface on a 0.5° × 0.5° grid. Thermocline depth is generally represented by the depth of 20 °C isothermal layer (Z20) [41]. Daily and monthly OAFlux product [57] with 1° × 1° resolution for 1984-2009 is used for the investigation of the net heat fluxes.
SST anomalies (SSTA) and precipitation anomalies are obtained by removing the seasonal cycles from the raw data. Along with the ISOs, the signals also include significant interannual and interdecadal variations, so that a 25–55-day band-pass filter is used to extract the 30–50-day ISOs. Then we identify the 30–50-day ISOs of SST and precipitation by Empirical Mode Decomposition (EMD) method, which is an adaptive and efficient way to decompose nonlinear and non-stationary processes to meaningful signals with local properties. The signals are defined as intrinsic mode functions (IMFs) [58].
The intensity of ISOs is represented by the root mean square (RMS) of the 30–50-day SST and precipitation variability. For the overall intensity from 1982 to 2016, we calculate the RMSs of the entire series. For the ISOs in different seasons or months, we use a 151-day (or 31-pentad) time-window for intraseasonal SST (precipitation) time series from 1983 to 2015. Each time-window contains about three oscillations. Average of each calendar month over 33 years stands for monthly intensity. Similar processing is applied to calculating seasonal intensity.
3. Results
3.1. The 30–50-Day ISO of SST
Figure 1a shows the variance of intraseasonal SST variability extracted by the 30–90-day band-pass filter. In the open ocean, two areas display RMS maxima. One is located in the eastern STIO, marked as Region A, 80–90° E, 6–12° S box in Figure 1a. The other area, marked as Region B by 52.5–65° E, 6–13° S, is in the SCTR in the western STIO. Over Region B, atmospheric processes interact with the thermocline ridge, and the cold water beneath the shallow mixed layer can easily lead to large SST anomalies. This phenomenon is significant in DJF, when the MJO is the strongest of the year [59]. The spectral significance spans from several days to 75 days in Region B (Figure 1c), where many studies have been focused on (see review by 59). However, Region A has not been well investigated. Specifically, the feature of Region A is different from that of Region B. The ISOs of SSTA averaged in Region A peak at 30–50 days period (Figure 1b), which is typically associated with MJO. The intraseasonal SST variabilities off Somali and Sumatra are also significant, but these are not discussed in this study. For further exploration, the 30–50-day ISO is extracted from the raw SST data. We apply EMD method to SSTA in Region A. The correlation coefficient of IMF6 and the 30–50-day SST oscillation extracted by the band-pass filter is remarkable (0.93, Figure 2a). The IMF6 also shows a peak on 30–50 days periods (Figure 2b). Thus, the 30–50-day ISO can be regards as an individual mode in Region A.
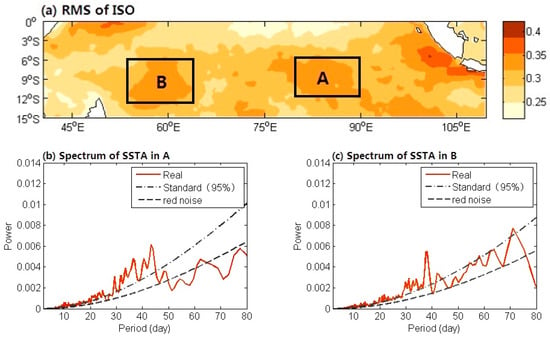
Figure 1.
(a) RMS variance distribution of 30–90-day band-passed SST (°C) during 1982–2016. Boxes A and B indicate location of the relatively significant signal over the open ocean. Power spectra of SSTA averaged in: (b) Region A; and (c) Region B during the same period. The red-noise spectrum is computed from the lag 1 autocorrelation.
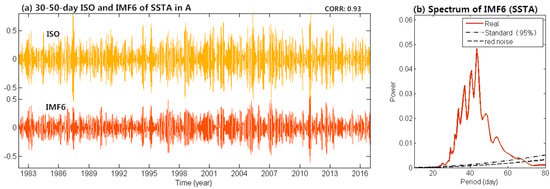
Figure 2.
(a) The 30–50-day ISO (yellow) and IMF6 (red) of SSTA averaged in Region A. Correlation coefficient of the two time-series is 0.93. This result exceeds 95% confidence level by student t-test. (b) Spectrum of IMF6. The red-noise spectrum is computed from the lag 1 autocorrelation.
The monsoonal winds generate seasonal SST variations in the tropical Indian Ocean. The activity of 30–50-day ISO also displays a seasonal variation. We exhibit the intensity distributions of 30–50-day SST variability in different seasons (Figure 3a). For Region A, the variance maximum appears during MAM, reaching the most active in March (Figure 3b). By contrast, in Region B, the 30–50-day SST oscillation peaks during DJF, accompanied by the strongest MJO signals [60]. The peak leads that in Region A by about one month. Note the seasonal SST variation reaches the maximum in MAM (Figure 3c), and this favors the intensification of the intraseasonal activity. Usually, a local SST minimum in climatology exists over a shallow thermocline, which is associated with the wind-induced upwelling in the STIO. This phenomenon is more obvious during June–August (JJA). Since SST in Region B is significantly lower than that in Region A, this dramatic difference corresponds to the shallowest thermocline. However, during DJF, the seasonal SST in the two regions are almost the same (Figure 3c).
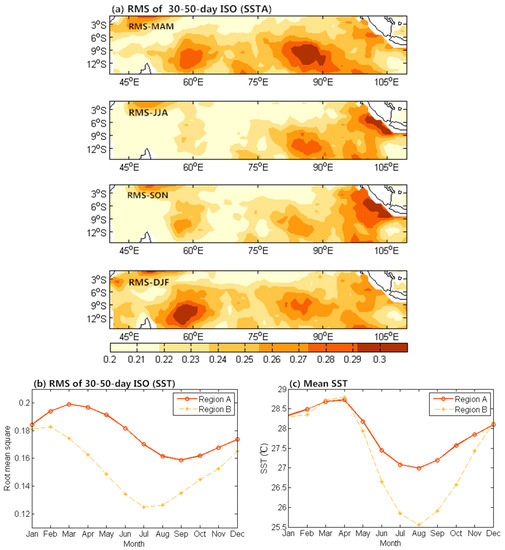
Figure 3.
(a) RMS variance distribution of 30–50-day SST (°C) variability in different seasons; and spatial-averaged: (b) RMS variance; and (c) mean SST in Regions A and B as a function of calendar month during 1982–2016.
3.2. Precipitation
Precipitation in the tropics is also characterized by notable intraseasonal variability coupled with underlying SST fluctuations [10], and positive SSTA leads precipitation by about 10 days [25]. Figure 4b shows the power spectrum of precipitation anomalies averaged in Region A. The significant signal suggests a 30–50-day precipitation oscillation. The IMF2 of spatial averaged precipitation anomalies, which is significantly correlated with the band-pass filtered time series (r = 0.77, Figure 4a), resembles the ISO timescale. Its power spectrum also peaks at 30–50 days period (Figure 4c).
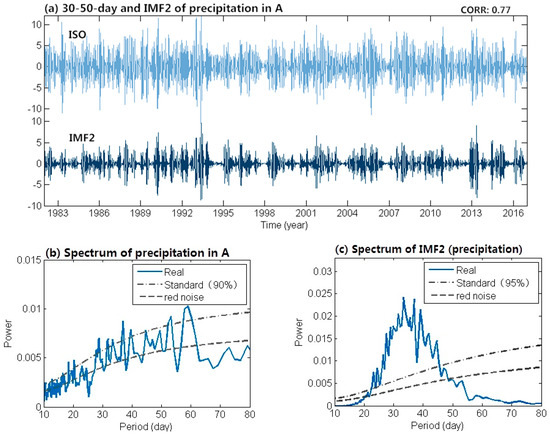
Figure 4.
(a) The 30–50-day ISO (bright blue) and IMF2 (dark blue) of precipitation anomaly averaged in Region A. Correlation coefficient of the two time-series is 0.77. Spectra for: (b) precipitation anomaly; and (c) IMF2. This result exceeds 90% confidence level by student t-test. The red-noise spectrum is computed from the lag 1 autocorrelation.
The RMS variance of 30–50-day ISO of precipitation in the southeastern equatorial Indian Ocean is shown in Figure 5a, concurring with that of SST. It is noticeable that the signals are extremely weak in the western STIO, where it is anticipated to manifest strong ocean–atmosphere interactions. Generally, the background precipitation maximum between 3° and 6° S leads to the maximum of 30–50-day variability within the same zonal band. The mean precipitation band to the south of equator is mainly associated with ITCZ convection [36]. Seasonal cycle of 30–50-day ISO of precipitation is in phase with that of SST (Figure 3a). The 30–50-day precipitation ISO is active through MAM and JJA. During December–March, as the ITCZ shifts to the south, significant signals spread to further southern places. However, despite the large mean precipitation, intensity of the ISO in DJF is not so high as that in MAM, when the mean precipitation is at its low point. The result potentially suggests the 30–50-day precipitation variability is not dominated by ITCZ convection. We further examine the local variability. In Region B, the phase-locked ISO develops rapidly during DJF, peaks in February, and gradually decays from MAM to September–November (SON). In Region A, the seasonal cycle peaks in March, and reaches the low point in July. The increasing mean precipitation in Region A related to southward-shift of ITCZ leads to the intensification in DJF. During MAM, although mean precipitation decreased sharply, the intensity of local ISO remains relatively high (Figure 5b). At the same time, 30–50-day ISO of SST is notably active (Figure 3b). Thus, we propose SST change is crucial to dominate the 30–50-day precipitation variability.
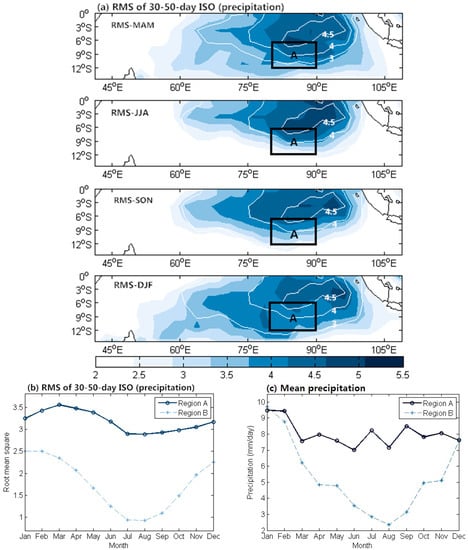
Figure 5.
(a) RMS variance distribution of 30–50-day precipitation (mm/day) for the whole study period (contours) and different seasons (color shade); spatial-averaged; and (b) RMS variance; and (c) mean precipitation in Regions A and B as a function of calendar month during 1982–2016.
The strongest intraseasonal precipitation variability is driven by the MJO, which is linked to equatorial waves. Thus, although coherent oceanic and atmospheric ISOs are significant over Region A, the maximum of RMS variance in precipitation appears in 0–6° S (Figure 5a), to the north of that in SST (Figure 3a). Two processes might favor this northward deviation. First, the precipitation ISO can be influenced by the mean state of ITCZ that is located to the north of Region A, where the cloudiness convection and precipitation have the maxima. Second, in the STIO, mean meridional wind is southerly (Figure 6). It drives northward advection of water vapor in favor of enhancing precipitation. Furthermore, the 30–50-day precipitation oscillation in Region A exhibits relatively weak seasonality and keeps at a high level all year around with abundant background precipitation (Figure 5c). The mean state supports enough fuel to sustain the intraseasonal variability. The monthly averages of precipitation vary within a small range, despite the slight increase in January and July. In comparison, the seasonal variation in Region B is larger. Both the intensity of 30–50-day ISO and seasonal variation of precipitation reach the maximum in DJF and the minimum in JJA. The peak in DJF is probably due to the shallowest thermocline at the same period, which triggers intensified ocean–atmosphere interaction [45].
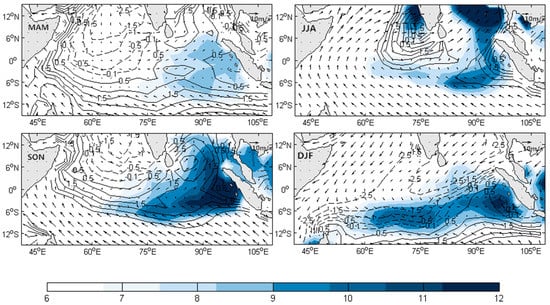
Figure 6.
Mean precipitation (shade, mm/day), surface wind velocity (vectors, m/s) and meridional wind (contours, m/s, interval: 0.5 m/s). Solid ones indicate southerlies and dashed ones indicate northerlies.
3.3. Relationship of SST and Precipitation
The 30–50-day ISOs of SST and precipitation have high correlation at seasonal timescale. Figure 7 shows longitude–time diagrams of 30–50-day ISO of SST and precipitation averaged between 6° and 12° S. Both SST and precipitation have an annual cycle. For SST, the strongest signals appear in the areas at around 55° E and 88° E, corresponding to Regions B and A, respectively. The 30–50-day ISO in Region A peaks during MAM and is suppressed during SON. In Region B, it develops from SON, reaching the strongest stage in DJF, leading Region A by ~1 month. According to the year-round comparison, the overall intensity of the 30–50-day ISO in Region A is stronger than that in Region B. For precipitation, significant 30–50-day signals are shown in Region A (Figure 5b), featured with the similar seasonality as SST which reaches the maximum in MAM, while the mean precipitation is inadequate (Figure 6). Specifically, both 30–50-day ISOs, SST and precipitation, peak in March. Within a coupled air–sea system, MJO, SST and precipitation have pronounced lag–lead relationships [19]. In Region A, SST leads precipitation by 10 days and lags by 5 days with the maximum correlation ~0.32 (Figure 7c). Considering Region A is in the tropics where the atmospheric variability is usually driven by SST [19], as well as the reasons mentioned in last section, the local SST variability is regarded as the forcing of atmospheric convection. Hence, the 30–50-day ISO of SST is presumably generated in Region B in DJF, and then propagates eastward. When reaching Region A, the 30–50-day ISO intensifies under favorable background condition in the ocean and atmosphere. There is a co-variability in precipitation, as an influence of SST on the atmosphere.
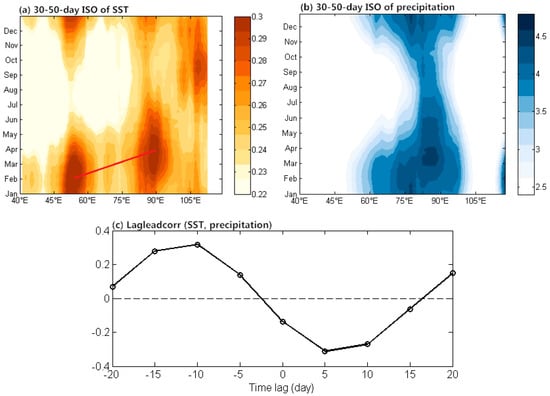
Figure 7.
Hovmöller diagrams of RMS variance of 30–50-day: (a) SST (°C); and (b) precipitation (mm/day) anomaly averaged in 6–12° S. The red line in (a) indicates the approximation of maximum 30–50-day SST variability. (c) Lag correlations of 30–50-day SST with precipitation anomaly averaged in A. SST leads precipitation at negative lags. The statistical significance of correlation is assessed by student-t test. The effective DOF is 1070 with the sample number of 2555, and the correlation is 95% significant at a minimal value.
4. Conclusions and Discussion
The present study examines the intraseasonal SST variability in the STIO, including its spatial distribution, frequency distribution and seasonality. The result shows significant intraseasonal signals not only appear over the center of the SCTR (Region B), but also over the area near the east of the SCTR (Region A). Compared with the wide spectrum of ISOs in Region B, the energy of ISO in Region A mainly concentrates on 30–50 days. The 30–50-day ISO in Region A can be approximately represented by IMF6 generated from EMD. This confirms the existence of the oscillation extracted by band-pass filter. The strength of this 30–50-day ISO features seasonality with the strongest activity in March and the weakest in September. By contrast, the ISO in Region B peaks in February, leading Region A by ~1 month. The precipitation ISO is regarded as an atmospheric response to SST. ITCZ and northward wind provide favorable conditions for northward shift of precipitation ISO. Considering the significant correlation between SST and ~10-day lagged precipitation, we infer that the ISO in Region A reflects the intensified MJO processes in the STIO as a result of ocean–atmosphere interactions.
We further explore the mechanism of the 30–50-day SST oscillation in the STIO. The 30–50-day ISO in Region B leads that in Region A about a month (Figure 3b and Figure 7a). It is formed as a MJO process. The oscillation generates in Region B, then propagates eastward, and strengthens in Region A. We investigate the variability of the heat fluxes, a major contributor of the intraseasonal SST variability [16,42,43,44,45]. The intensity of 30–50-day net heat flux peaks during March and February in Regions A and B, respectively (Figure 8a), which is consistent with SST and precipitation (Figure 3b and Figure 5b). Thus, the net heat flux is considered to motivate the 30–50-day SST variability. However, the 30–50-day ISO signal in Region A remains relatively strong in April–May and reaches its minimum in September while the mean net heat flux decreases rapidly after March and reaches the low point in JJA (Figure 8b). Thus, the net heat flux cannot sufficiently explain the sustainability of 30–50-day ISO. The intensification of 30–50-day ISO in Region A also requires other supporting mechanism. Such intensification and sustainability of ISO is probably attributed to thermocline variation.
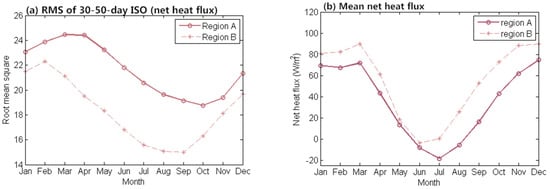
Figure 8.
(a) RMS variance; and (b) mean net heat flux averaged in Regions A and B as a function of calendar month during 1984-2009.
We suggest such intensification and sustainability of ISO could be attributed to thermocline variation. Because Region A is located to the east of SCTR, local thermocline is sensitive to the ocean dynamics. The shallowest thermocline forms in MAM (Figure 9), but accompanying with the high SST (Figure 3c). At that time, seawater from subsurface layer could cool down the SST, hence leading to a significant intraseasonal variability. Oceanic state underneath the surface seems to account for more in SST variability in Region A than Region B, leading to the different seasonality between the two regions. We will study the interaction between thermocline and SST in future work.
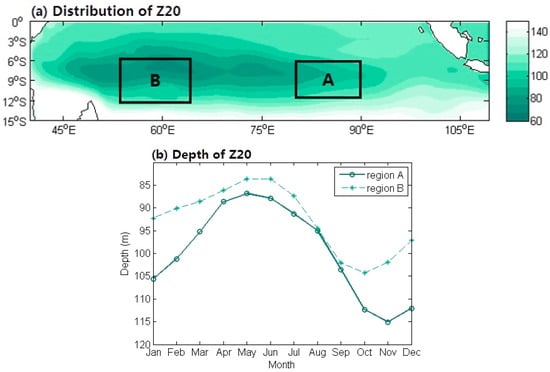
Figure 9.
(a) Annual mean depth (m) of Z20; and (b) monthly Z20 averaged in Regions A and B as a function of calendar month during 1982–2010.
Acknowledgments
This work is supported by the National Natural Science Foundation of China (41525019) and the State Oceanic Administration of China (GASI-IPOVAI-02). OISST, CMAP precipitation data and NCEP-NCAR reanalysis wind data are obtained from the website http://www.earl.noaa.gov/psd/. SODA version 2.2.4 products were provided by Asia-Pacific Data Research Center, University of Hawaii, USA from website http://apdrc.soest.hawaii.edu/data/.
Author Contributions
Yun Liang: literature search, figures, study design, data collection, data analysis, data interpretation and writing; Yan Du: literature search, study design, data analysis, data interpretation and writing; Lianyi Zhang: writing; Xiaotong Zheng: writing; Shuang Qiu: writing.
Conflicts of Interest
The authors declare no conflict of interest.
References
- Kawamura, R. Intraseasonal variability of sea surface temperature over the tropical Western Pacific. J. Meteorol. Soc. Jpn. 1988, 66, 1007–1012. [Google Scholar] [CrossRef]
- Krishnamurti, T.N.; Oosterhof, D.K.; Mehta, A.V. Air-sea interaction on the time scale of 30 to 50 days. J. Atmos. Sci. 1988, 39, 2088–2095. [Google Scholar] [CrossRef]
- Weller, R.A.; Anderson, S.P. Surface meteorology and air-sea fluxes in the western equatorial Pacific warm pool during the TOGA Coupled Ocean-Atmosphere Response Experiment. J. Clim. 1996, 9, 1959–1990. [Google Scholar] [CrossRef]
- Sengupta, D.; Goswami, B.N.; Senan, R. Coherent intraseasonal oscillations of ocean and atmosphere during the asian summer monsoon. Geophys. Res. Lett. 2001, 28, 4127–4130. [Google Scholar] [CrossRef]
- Annamalai, H.; Sperber, K.R. Regional heat sources and the active and break phases of boreal summer intraseasonal (30–50 day) variability. J. Atmos. Sci. 2005, 62, 2726–2748. [Google Scholar] [CrossRef]
- Zhang, C. Madden-Julian oscillation: Bridging weather and climate. Bull. Am. Meteorol. Soc. 2013, 94, 1849–1870. [Google Scholar] [CrossRef]
- Serra, Y.L.; Jiang, X.; Tian, B.; Amador, A.J.; Maloney, E.D.; Kiladis, G.N. Tropical intra-seasonal modes of the atmosphere. Ann. Rev. Environ. Resour. 2014, 39, 189–215. [Google Scholar] [CrossRef]
- Shinoda, T.; Hendon, H.H.; Glick, J. Intraseasonal variability of surface fluxes and sea surface temperature in the tropical Western Pacific and Indian Ocean. J. Clim. 1998, 11, 1685–1702. [Google Scholar] [CrossRef]
- Hendon, H.H.; Glick, J. Intraseasonal air-sea interaction in the tropical Indian and Pacific Oceans. J. Clim. 1997, 10, 647–661. [Google Scholar] [CrossRef]
- Woolnough, S.J.; Slingo, J.M.; Hoskins, B.J. The relationship between convection and sea surface temperature on intraseasonal time scales. J. Clim. 2000, 13, 2086–2104. [Google Scholar] [CrossRef]
- Jones, C.; Waliser, D.E.; Gautier, C. The influence of the Madden-Julian Oscillation on ocean surface heat fluxes and sea surface temperature. J. Clim. 1998, 11, 1057–1072. [Google Scholar] [CrossRef]
- Shinoda, T.; Hendon, H.H. Mixed layer modeling of intraseasonal variability in the tropical western Pacific and Indian Oceans. J. Clim. 1998, 11, 2668–2685. [Google Scholar] [CrossRef]
- Schiller, A.; Godfrey, J.S. Indian Ocean intraseasonal variability in an ocean general circulation model. J. Clim. 2003, 16, 21–39. [Google Scholar] [CrossRef]
- Waliser, D.E.; Jin, K.; Kang, I.S.; Stern, W.F.; Schubert, S.D.; Wu, M.L.C.; Lau, K.M.; Lee, M.I.; Krishnamurthy, V.; Kitoh, A.; et al. AGCM simulations of intraseasonal variability associated with the Asian summer monsoon. Clim. Dyn. 2003, 21, 423–446. [Google Scholar] [CrossRef]
- Waliser, D.E.; Murtugudde, R.; Lucas, L.E. Indo-Pacific Ocean response to atmospheric intraseasonal variability: 2. Boreal summer and the Intraseasonal Oscillation. J. Geophys. Res. Oceans 2004, 109, C03030. [Google Scholar] [CrossRef]
- Duvel, J.P.; Roca, R.; Vialard, J. Ocean Mixed Layer Temperature Variations induced by Intraseasonal Convective Perturbations over the Indian Ocean. J. Atmos. Sci. 2004, 61, 1004–1023. [Google Scholar] [CrossRef]
- Han, W.Q.; Yuan, D.L.; Liu, W.T.; Halkides, D.J. Intraseasonal variability of Indian Ocean sea surface temperature during boreal winter: Madden-Julian Oscillation. J. Geophys. Res. 2007, 112, C04001. [Google Scholar] [CrossRef]
- Saji, N.H.; Xie, S.P.; Tam, C.Y. Satellite observations of intense intraseasonal cooling events in the tropical South Indian Ocean. Geophys. Res. Lett. 2006, 33. [Google Scholar] [CrossRef]
- Wu, R.G.; Kirtman, B.P.; Pegion, K. Local rainfall-SST relationship on subseasonal time scales in satellite observations and CFS. Geophys. Res. Lett. 2008, 35, L22706. [Google Scholar] [CrossRef]
- Zhang, C. Large-scale variability of atmospheric deep convection in relation to sea surface temperature in the tropics. J. Clim. 1993, 6, 1898–1913. [Google Scholar] [CrossRef]
- Xi, J.Y.; Zhou, L.; Murtugudde, R.; Jiang, L.H. Impacts of intraseasonal SST anomalies on precipitation during Indian summer monsoon. J. Clim. 2015, 28, 4561–4575. [Google Scholar] [CrossRef]
- Flatau, M.; Flatau, P.J.; Phoebus, P.; Niller, P.P. The feedback between equatorial convection and local radiative and evaporative processes: The implications for intraseasonal oscillations. J. Atmos. Sci. 1997, 54, 2373–2386. [Google Scholar] [CrossRef]
- Wang, B.; Xie, X. Coupled modes of the warm pool climate system. Part I: The role of air-sea interaction in maintaining Madden-Julian oscillation. J. Clim. 1998, 11, 2116–2135. [Google Scholar] [CrossRef]
- Kemball-Cook, S.; Wang, B. Equatorial waves and air-sea interaction in the boreal summer intraseasonal oscillation. J. Clim. 2001, 14, 2923–2942. [Google Scholar] [CrossRef]
- Pegion, K.; Kirtman, B.P. The impact of air-sea interactions on the simulation of tropical intraseasonal variability. J. Clim. 2008, 21, 6616–6635. [Google Scholar] [CrossRef]
- Shukla, J.; Misra, B.M. Relationships between sea surface temperature and wind speed over the central Arabian Sea, and monsoon rainfall over India. Mon. Weather Rev. 1977, 105, 998–1002. [Google Scholar] [CrossRef]
- Webster, P.J.; Moore, A.M.; Loschnigg, J.P.; Leben, R.R. Coupled ocean-atmosphere dynamics in the Indian Ocean during 1997–98. Nature 1999, 401, 356–359. [Google Scholar] [CrossRef] [PubMed]
- Saji, N.H.; Goswami, B.N.; Vinayachandran, P.N.; Yamagata, T. A dipole mode in the tropical Indian Ocean. Nature 1999, 401, 360. [Google Scholar] [CrossRef] [PubMed]
- Meehl, G.A. The annual cycle and interannual variability in the tropical Pacific and Indian Ocean regions. Mon. Weather Rev. 1987, 115, 27–50. [Google Scholar] [CrossRef]
- Meehl, G.A. A Coupled Air-Sea Biennial Mechanism in the Tropical Indian and Pacific Regions: Role of the Ocean. J. Clim. 1993, 6, 31–41. [Google Scholar] [CrossRef]
- Meehl, G.A. The South Asian Monsoon and the Tropospheric Biennial Oscillation. J. Clim. 1997, 10, 1921–1943. [Google Scholar] [CrossRef]
- Li, T.; Wang, B. The influence of sea surface temperature on the tropical intraseasonal oscillation: A numerical study. Mon. Weather Rev. 1994, 122, 2349–2362. [Google Scholar] [CrossRef]
- Clark, C.O.; Cole, J.E.; Webster, P.J. Indian Ocean SST and Indian summer rainfall: Predictive relationships and their decadal variability. J. Clim. 2000, 13, 2503–2519. [Google Scholar] [CrossRef]
- Chen, M.Y.; Wang, W.Q.; Kumar, A. Ocean surface impacts on the seasonal-mean precipitation over the tropical Indian Ocean. J. Clim. 2012, 25, 3566–3582. [Google Scholar] [CrossRef]
- Arakawa, O.; Kitoh, A. Comparison of local precipitation-SST relationship between the observation and a reanalysis dataset. Geophys. Res. Lett. 2004, 31, L12206. [Google Scholar] [CrossRef]
- Johnson, R.H.; Ciesielski, P.E. Structure and properties of Madden-Julian oscillations deduced from DYNAMO sounding arrays. J. Atmos. Sci. 2013, 70, 3158–3179. [Google Scholar] [CrossRef]
- Rui, H.; Wang, B. Development characteristics and dynamic structure of tropical intraseasonal convection anomalies. J. Atoms. Sci. 1990, 47, 357–379. [Google Scholar] [CrossRef]
- Zhao, C.B.; Li, T.; Zhou, T.J. Precursor signals and processes associated with mjo initiation over the tropical Indian Ocean. J. Clim. 2013, 26, 291–307. [Google Scholar] [CrossRef]
- Halkides, D.J.; Waliser, D.E.; Lee, T.; Menemenlis, D.; Guan, B. Quantifying the processes controlling intraseasonal mixed layer temperature variability in the tropical Indian Ocean. J. Geophys. Res. Oceans 2015, 120, 692–715. [Google Scholar] [CrossRef]
- Harrison, D.E.; Vecchi, G.A. January 1999 Indian Ocean Cooling Event. Geophys. Res. Lett. 2001, 28, 3717–3720. [Google Scholar] [CrossRef]
- Xie, S.-P.; Annamalai, H.; Schott, F.A.; McCreary, J.P. Structure and mechanisms of South Indian Ocean climate variability. J. Clim. 2002, 15, 864–878. [Google Scholar] [CrossRef]
- Duvel, J.P.; Vialard, J. Indo-Pacific Sea surface temperature perturbations associated with intraseasonal oscillations of tropical convection. J. Clim. 2007, 20, 3056–3082. [Google Scholar] [CrossRef]
- Vialard, J.; Foltz, G.R.; McPhaden, M.J.; Duvel, J.P.; Montégut, C.D.B. Strong Indian Ocean sea surface temperature signals associated with the Madden-Julian Oscillation in late 2007 and early 2008. Geophys. Res. Lett. 2008, 35, L19608. [Google Scholar] [CrossRef]
- Jayakumar, A.; Vialard, J.; Lengaigne, M.; Gnanaseelan, C.; McCreary, J.P.; Kumar, B.P. Processes controlling the surface temperature signature of the Madden-Julian oscillation in the thermocline ridge of the Indian Ocean. Clim. Dyn. 2011, 37, 2217–2234. [Google Scholar] [CrossRef]
- Jayakumar, A.; Gnanaseelan, C. Anomalous intraseasonal events in the thermocline ridge region of Southern Tropical Indian Ocean and their regional impacts. J. Geophys. Res. 2012, 117, C03021. [Google Scholar] [CrossRef]
- Miyakawa, T.; Masaki, S.; Miura, H.; Tomita, H.; Yashiro, H.; Noda, A.T.; Yamada, Y.; Kodama, C.; Kimoto, M.; Yoneyama, K. Madden-Julian oscillation prediction skill of a new-generation global model demonstrated using a supercomputer. Nat. Commun. 2014, 5, 3769. [Google Scholar] [CrossRef] [PubMed]
- Vitart, F. Evolution of ECMWF sub-seasonal forecast skill scores. Q. J. R. Meteorol. Soc. 2014, 140, 1889–1899. [Google Scholar] [CrossRef]
- Demott, C.A.; Klingaman, N.P.; Woolnough, S.J. Atmosphere-ocean coupled processes in the Madden-Julian oscillation. Rev. Geophys. 2015, 53, 1099–1154. [Google Scholar] [CrossRef]
- Liu, F.; Wang, B. An Air-Sea Coupled Skeleton Model for the Madden-Julian Oscillation. J. Atomos. Sci. 2013, 70, 3147–3156. [Google Scholar] [CrossRef]
- Wang, W.; Hung, M.-P.; Weaver, S.; Kumar, A.; Fu, X. MJO prediction in the NCEP Climate Forecast System version 2. Clim. Dyn. 2013, 42, 2509–2520. [Google Scholar] [CrossRef]
- Neena, J.M.; Lee, J.Y.; Waliser, D.; Wang, B.; Jiang, X. Predictability of the Madden-Julian oscillation in the Intraseasonal Variability Hindcast Experiment (ISVHE). J. Clim. 2014, 27, 4531–4543. [Google Scholar] [CrossRef]
- Jiang, X.; Waliser, D.E.; Xavier, P.K.; Petch, J.; Klingaman, N.P.; Woolnough, S.J.; Guan, B.; Bellon, G.; Crueger, T.; DeMott, C.; et al. Vertical structure and physical processes of the Madden- Julian oscillation: Exploring key model physics in climate simulations. J. Geophys. Res. Atmos. 2015, 120, 4718–4748. [Google Scholar] [CrossRef]
- Reynolds, R.W.; Smith, T.M.; Liu, C.; Chelton, D.B.; Casey, K.S.; Schlax, M.G. Daily high-resolution-blended analyses for sea surface temperature. J. Clim. 2007, 20, 5473–5496. [Google Scholar] [CrossRef]
- Xie, S.-P.; Arkin, P.A. Analyses of global monthly precipitation using gauge observations, satellite estimates, and numerical model predictions. J. Clim. 1996, 9, 840–858. [Google Scholar] [CrossRef]
- Kalnay, E.; Kanamitsu, M.; Kistler, R.; Collins, W.; Deaven, D.; Gandin, L.; Iredell, M.; Saha, S.; White, G.; Woollen, J.; et al. The NCEP/NCAR 40-year reanalysis project. Bull. Amer. Meteor. Soc. 1996, 77, 437–471. [Google Scholar] [CrossRef]
- Carton, J.A.; Giese, B.S. A Reanalysis of Ocean Climate Using Simple Ocean Data Assimilation (SODA). Mon. Weather Rev. 2008, 136, 2999–3017. [Google Scholar] [CrossRef]
- Yu, L.; Weller, R.A. Objectively analyzed air-sea heat fluxes (OAFlux) for the global ocean. Bull. Am. Meteor. Soc. 2007, 88, 527–539. [Google Scholar] [CrossRef]
- Huang, N.E.; Shen, Z.; Long, S.R.; Wu, M.C.; Shih, E.H.; Zheng, Q.; Tung, C.C.; Liu, H.H. The empirical mode decomposition method and the Hilbert spectrum for non-stationary time series analysis. Proc. R. Soc. 1998, 454A, 903–995. [Google Scholar] [CrossRef]
- Schott, F.A.; Xie, S.P.; McCreary, J.P., Jr. Indian Ocean Circulation and Climate Variability. Rev. Geophys. 2009, 47, RG1002. [Google Scholar] [CrossRef]
- Madden, R.A. Seasonal variations of the 40–50 day oscillation in the tropics. J. Atmos. Sci. 1986, 43, 3138–3158. [Google Scholar] [CrossRef]
© 2018 by the authors. Licensee MDPI, Basel, Switzerland. This article is an open access article distributed under the terms and conditions of the Creative Commons Attribution (CC BY) license (http://creativecommons.org/licenses/by/4.0/).