Article

Random Forest Algorithm for the Relationship between Negative Air Ions and Environmental Factors in an Urban Park

1
School of Agriculture and Biology and Research Centre for Low Carbon Agriculture, Shanghai Jiao Tong University, 800 Dongchuan Rd., Shanghai 200240, China
2
Shanghai Urban Forest Ecosystem Research Station, National Forestry and Grassland Administration, 800 Dongchuan Rd., Shanghai 200240, China
3
Key Laboratory for Urban Agriculture, Ministry of Agriculture and Rural Affairs, 800 Dongchuan Rd., Shanghai 200240, China
4
Shanghai Forest Station, 1053-7 Hutai Rd., Shanghai 200072, China
*
Author to whom correspondence should be addressed.
These authors contributed equally to this work.
Atmosphere 2018, 9(12), 463; https://doi.org/10.3390/atmos9120463
Submission received: 27 October 2018 / Revised: 21 November 2018 / Accepted: 22 November 2018 / Published: 26 November 2018

Abstract

:
Negative air ions (NAIs) are a natural component of air and have a positive impact on the health of urban residents. Few studies have focused on the relationship between NAI concentration (NAIC) in the urban atmosphere and environmental factors, such as meteorological factors and air pollutants. Therefore, we established observation points in Zhongshan Park in downtown Shanghai, China, and continuously measured and recorded changes in NAIC for one year. We also monitored nine meteorological factors and six atmospheric pollutants. Through correlation analysis and multiple linear regression analysis, the key factors influencing NAIC were screened, and the effects of those factors on NAIC were explored using the random forest algorithm. The results show that NAIC is most sensitive to humidity, followed by radiation and temperature, and finally to PM2.5. Humidity is the most critical factor, primarily because it directly affects the formation of NAIs from both the environment and vegetation. Furthermore, our results reveal that the mechanisms through which NAIC is influenced by the same factor varies seasonally. We analyzed the relationship between NAIC in an urban atmosphere and environmental factors by using big data, which is a new method for studying the relationships between NAIs and environmental factors. Our results indicate potential explanations for the mechanisms underlying NAI response to various environmental factors.

1. Introduction

Negative air ions (NAIs) are gaseous molecules and light ions that are electronegative [1]; they are known as “vitamins and auxins” in air [2]. They can sterilize, drop dust, and clean the air, which play an important role for the health of residents and, thus, have significant functions in medical health, environmental sanitation, ecotourism, industry, and agriculture [3]. Because the oxygen molecule has a relatively strong electrical affinity, it can obtain electrons in preference to other molecules in the air under the same conditions, thereby forming a negative oxygen ion [4,5,6]. These negative oxygen ions are the main components of NAIs; thus, NAIs are sometimes called negative oxygen ions [7]. The source of NAIs can be either natural or anthropogenic. There are four reaction mechanisms of NAI formation [8,9,10,11]: (1) the collision and separation effect; (2) the Lenard effect; (3) the neutral dielectric charge effect; and (4) thermoelectric and piezoelectric effects. Under normal environmental conditions, NAIs are produced by more than one effect [12].
NAI concentration (NAIC) in the atmosphere has high spatial heterogeneity and temporal variability and is greatly influenced by the surrounding environment [13,14]. This, coupled with the colinearity among the environmental influencing factors, renders the outcomes of different studies more complicated [12]. One study shows that the environmental factors that affect NAIC are mainly divided into two types: meteorological factors and air pollutants [15,16]. Regarding meteorological factors, some scholars have shown that the distribution of NAIC is affected by local climatic factors and has a significant negative correlation with regional temperature and a positive correlation with humidity [15,16]. However, Reiter found that NAIC is positively correlated with temperature and negatively correlated with local relative humidity [17]. Dhanorkar and Kamra found that the influence of diurnal sunshine on NAIC was a single peak type at Pune (18°32′ N, 73°51′ E, 559 m above msl), India, during February 1990 to January 1991 [18]. Retalis and Nastos analyzed the diurnal, monthly, and seasonal variations of NAIs from 1968 to 1984 at the National Observatory of Athens and found that the maximum concentrations occurred in summer [19]. Different weather conditions also significantly affect NAIC. As a source of NAIs, rainfall can effectively increase NAIC. Lightning, as a natural discharge phenomenon, can ionize the air and produce a large number of NAIs; thus, NAIC increases significantly after a thunderstorm [20,21]. Reiter et al. found that NAIC decreases with an increase in fog and drops to its lowest point in cloudy weather [17]. In a study of air pollutants, Retalis et al. indicated that NAIC is negatively correlated with the degree of environmental pollution and is lower in environments with high environmental pollution. CO, PM2.5, PM10, nitrogen oxides (NOx), and SO2 concentrations have been shown to be negatively correlated with NAIC [20,22,23], possibly because of the adsorption of NAI and the formation of a macromolecule, which cause sedimentation and result in a decreased NAIC.
Previous studies have generally adopted the traditional statistical analysis method to explore correlations between NAIC and various environmental factors [3,12,13,14], without giving much consideration to the colinearity of environmental factors and the complex nonlinear relationship [17,19,20]. Because of the limitations of the test conditions and experimental data, few studies have investigated the ranking of the impact of environmental factors under the condition of big data. Moreover, most related studies have been conducted in mountain forests or ecological protection zones with extremely high NAIC [18,20,21]; few have been conducted in urban environments, especially central urban areas of large cities. Thus, such studies have yielded no useful recommendations for improving air quality in the living environments of urban residents.
Therefore, through long-term fixed monitoring of NAIs and various environmental factors in Shanghai’s city park, we obtained a temporal variation pattern of urban NAIs and used correlation and multiple linear regression analyses to determine the most crucial environmental factors affecting NAIC. Furthermore, the impact of these factors on NAIs was analyzed using the random forest algorithm. Our findings may provide an explanation for the impact mechanism of characteristic environmental factors on NAIC.
This article attempts to answer the following questions:
  • What meteorological factors and air pollutants correlate with NAIC in urban areas?
  • What are the correlations between NAIC and the main environmental factors? What are the main factors affecting NAIC?
  • What is the order of the major environmental factors that impact NAIC?

2. Materials and Methods

2.1. Test Site

In this study, Zhongshan Park was selected as the experimental site. As a very large city in China, Shanghai is representative of rapid urbanization. Shanghai is located on the western shore of the Pacific Ocean, the east edge of the Asian continent, and the mouth of the Yangtze River Delta. It has a subtropical monsoon climate with an average annual temperature of 15.8 °C and average annual precipitation of 1145.1 mm; the annual sunshine duration is approximately 2000 h and the frost-free period is 241 days (Shanghai Tongzhi Climate). Zhongshan Park is located in the center of Shanghai and covers a total area of 21.42 ha, including 11.86 ha of forest area, 1.22 ha of water area, and 3.69 ha of lawn area (Figure 1). Many subtropical tree species (e.g., Cinnamomum camphora, Metasequoia glyptostroboides, and Cedrus deodara) are distributed in the forest, totaling more than 30,000 plants. The park adopts a Chinese–Western gardening method and is an essential place for the residents and tourists to perform leisure activities; the average visitor volume is approximately 20,000 per day.

2.2. Data Collection

Data were collected according to “Observation Methodology for Long-term Forest Ecosystem Research” of the National Standards of China (GB/T 33027-2016). Automatic observation equipment was installed in the Cinnamomum camphora forest in the center of the park. The observation equipment had an air inlet 3 m above the ground. From March 2017 to February 2018, continuous monitoring and data collection were conducted. In addition to NAIC, seven types of atmospheric pollutants (PM2.5, PM10, CO, SO2, NO2, NOx, O3) and nine meteorological factors (air temperature, relative humidity, air pressure, wind direction, wind speed, rainfall, full radiation, effective radiation, and ultraviolet radiation) were monitored. Japanese COM3200PRONAI was used to measure NAIC. Meteorological factors were measured by the automatic weather station (Beijing HC Company, FRT X06A automatic weather station) and air pollutants were measured by Thermo Fisher’s (Waltham, MA, USA) continuous air pollutant measuring equipment (PM10 and PM2.5 were measured using a 5014i Beta analyzer; NO and NOx with a 42iQ analyzer; SO2 with a 43i-TLE trace analyzer; CO with a 48i analyzer; O3 with a 49i analyzer). All data were measured every 5 min and automatically stored in the server.

2.3. Data Processing

NAIC data were first selected by R language (v3.3.2) and analyzed by software including Excel, SPSS, and R Studio. Through Pearson analysis, we monitored both the atmospheric pollutants and meteorological factors, which were automatically collected over a whole year by the long-term observation station in Zhongshan Park. We monitored a total of 16 environmental factors over four seasons (spring, summer, autumn, and winter) to explore the correlation of each influencing factor with NAIC from the overall situation.
Since NAIC is affected by multiple environmental factors, combined with the results of Pearson correlation analysis, we conducted multiple linear regression for the relevant factors in each season to analyze the contribution of different influencing factors on NAIC. Matrix analysis of the correlation coefficients for 16 environmental factors was performed to explore the colinearity among these factors.
In order to eliminate the colinearity among these factors, we used the random forest algorithm to rank the importance of four typical influencing factors.
The random forest algorithm—a data mining method based on class notification and regression trees—is a relatively new combination learning classifier technology proposed by Breiman and Cutler in 2001 [24]. Nowadays, it is applied in many studies that could have also been designed to apply other machine learning techniques, such as artificial neural networks. The random forest algorithm compared to traditional classification regression methods improves the accuracy of model prediction by aggregating a large number of classification trees, which can be used to classify, regress, and evaluate the importance of variables, detect singular values in data, and interpolate missing data [25]. The algorithm generates a new training self-help sample set by repeatedly and randomly extracting n samples from the original training set through the bootstrap resampling technique, and then generates n classification trees according to the self-help sample set to form the random forest algorithm. The classification results of the new data are determined based on the number of scores formed by voting on the classification trees [26,27], as shown in Figure 2.
This algorithm has a wide range of applications in ecological research, such as ecological circulation model prediction [26], ecological classification research [28], and simulation research to assess the impact of environmental changes on species distribution [29]. The environmental NAIC that we studied was highly variable and the influencing factors were multidimensional; in addition, highly complex nonlinear relationships between the variables were observed. Some non-stress-resistant factors in the field measurement process, such as instrument destruction and extreme weather, etc., can lead to missing values. Thus, traditional statistical analysis methods are inadequate for revealing the patterns and relationships in the complex process [30]. The random forest model comprehensively uses classification and regression tree methods, which can deal with nonlinear relationships, high-order correlations, and missing values and can more accurately explore the effects of NAIs to environmental factors in urban parks [27].
The process of using the random forest algorithm to rank the importance of feature factors includes the following two characteristic importance indicators.
  • IncMSE is equivalent to Mean Decrease Accuracy, which refers to the mean square error:
This method directly measures the influence of each feature on the accuracy of model prediction. It rearranges the order of a certain column of feature values and observes how much the model accuracy is reduced to measure the influence of the feature value, and the level of model accuracy reduction that can be observed. This indicator represents importance as decreasing the mean square error. The larger the value, the greater is the influence of this independent variable on the dependent variable. Negative values indicate that the model predictions are affected negatively by the dependent variable.
  • IncNodePurity is equivalent to Mean Decrease Gini, which refers to node purity:
This method ranks the features according to the impurity (Gini) for each tree and then calculates the average for the whole forest. The selection of the optimal condition is based on impurity. This indicator represents importance in the sense of diminishing precision. The larger the indicator value, the greater is the influence of the independent variable on the dependent variable. A value close to 0 indicates little to no relationship with the dependent variable.

3. Results

3.1. NAIC Changes Month by Month

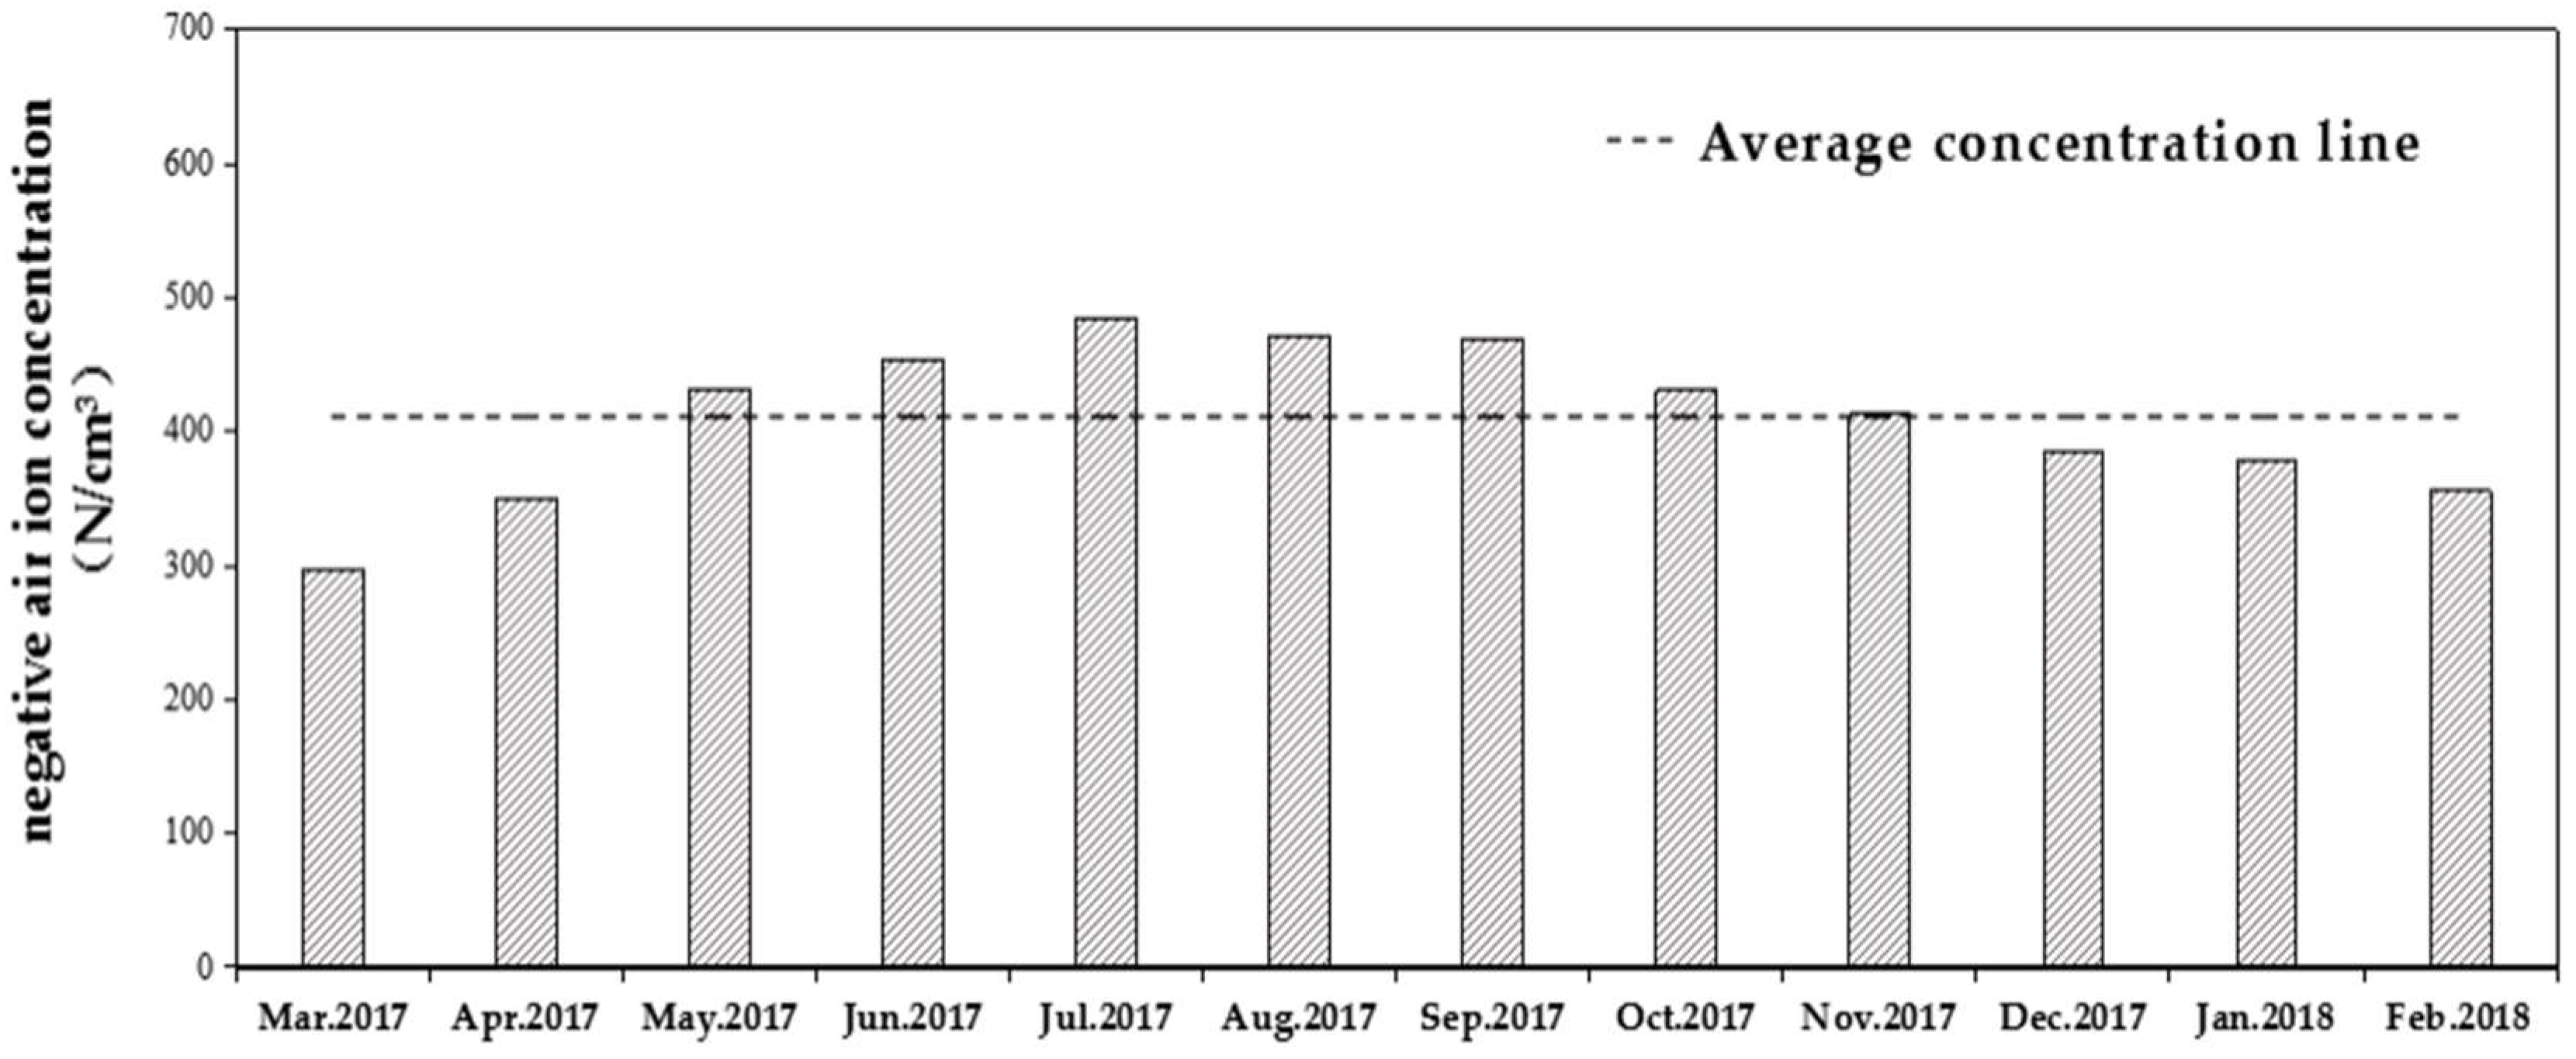
The temporal variation pattern of NAIs was analyzed using the 1-year data from Zhongshan Park. The monthly average of NAIC was calculated based on the hourly average, and the change pattern of NAIC at the Zhongshan Park observation point over the year was obtained (N represents number in unit N/cm³).
As shown in Figure 3, the annual average NAIC at the Zhongshan Park observation point was 410 N/cm3, with the highest value of 485 N/cm3 in July 2017 and the lowest value of 296 N/cm3 in March 2017. The average NAIC in Zhongshan Park was much lower than that of Shanghai Outer Suburb Forest Park [31], likely because of interference from human activity in the central urban area. Regarding the seasonal distribution of NAI, NAIC and dispersion were higher in summer and autumn (from June to October) than at other times. The NAIC in spring and winter (from November to May) was low and the dispersion was small.

3.2. Correlation Analysis of Environmental Characteristics

Significant changes in NAIC with seasonal changes were observed (Figure 2). Therefore, the effects of environmental factors of different seasons on NAIC were further explored. We divided the environmental factor data of the long-term location observation station of Zhongshan Park by season into four selections, and we analyzed correlations between NAIC and environmental factors by using the Pearson test to obtain the results (Table 1).
Regarding meteorological factors, we found that temperature and humidity were significant influencing factors on NAIC in all seasons except autumn. NAIC was positively correlated with temperature and humidity in spring and summer, whereas NAIC was negatively correlated with temperature and humidity in summer.
The correlation analysis of air pollutants revealed that NAIC in spring was negatively correlated with PM2.5, NOx, PM10 and CO. NAIC in summer was significantly negatively correlated with PM10 and positively correlated with CO. The pollutants in autumn and winter were not significantly correlated with NAIC. These results indicate that the influence of different environmental factors on NAIC varied significantly by season.

3.3. Multiple Linear Regression of Environmental Characteristics

With Pearson’s correlation analysis (Table 1), we found that in spring, NAIs had significant correlations with four meteorological factors (temperature, humidity, rain, and ultraviolet radiation) and two air pollutants (PM2.5 and NOX). Multiple regression analysis on these significant influencing factors and NAIC revealed the following equation:
n = 7145588973 0.076 T + 0.091 H + 0.193 e 0.137 u 0.022 a 0.005 c ( r 2 = 0.086 , F = 24.992 , p < 0.001 )
where n represents NAIC (N/cm3);
a represents PM2.5 concentration (μg·m−3);
c represents NOx concentration (ppb);
d represents CO concentration (ppb);
e represents rainfall (mm);
u represents ultraviolet radiation intensity (w·m−2);
f represents total radiation intensity (w·m−2);
T represents temperature (°C);
H represents humidity (%).
The bold parts represent the significance of individual regression coefficients.
This equation revealed that the factors significantly influencing NAIC in spring were precipitation and ultraviolet radiation.
NAIC in summer was significantly correlated with temperature, humidity, PM10, and CO; multivariate regression analysis was performed to obtain the following equation:
n = 2190593355 0.039 T + 0.102 H 0.094 a 0.092 d ( r 2 = 0.022 , F = 12.992 , p < 0.001 )
From the equation, the factors that had a significant influence on NAIC in the summer were humidity, PM10 concentration, and CO concentration.
There was no multivariate regression analysis done for autumn because the correlation analysis (Table 1) showed no significant correlations in autumn.
NAIC in winter was significantly correlated with temperature, humidity, total radiation, and ultraviolet radiation, and the four factors were returned in multiple manners. The following equation was obtained:
n = 0.678 0.067 T 0.093 H 0.057 f + 0.027 u ( r 2 = 0.019 , F = 11.867 , p < 0.001 )
The equation revealed that the only factor that had a significant influence on NAIC in winter was humidity.
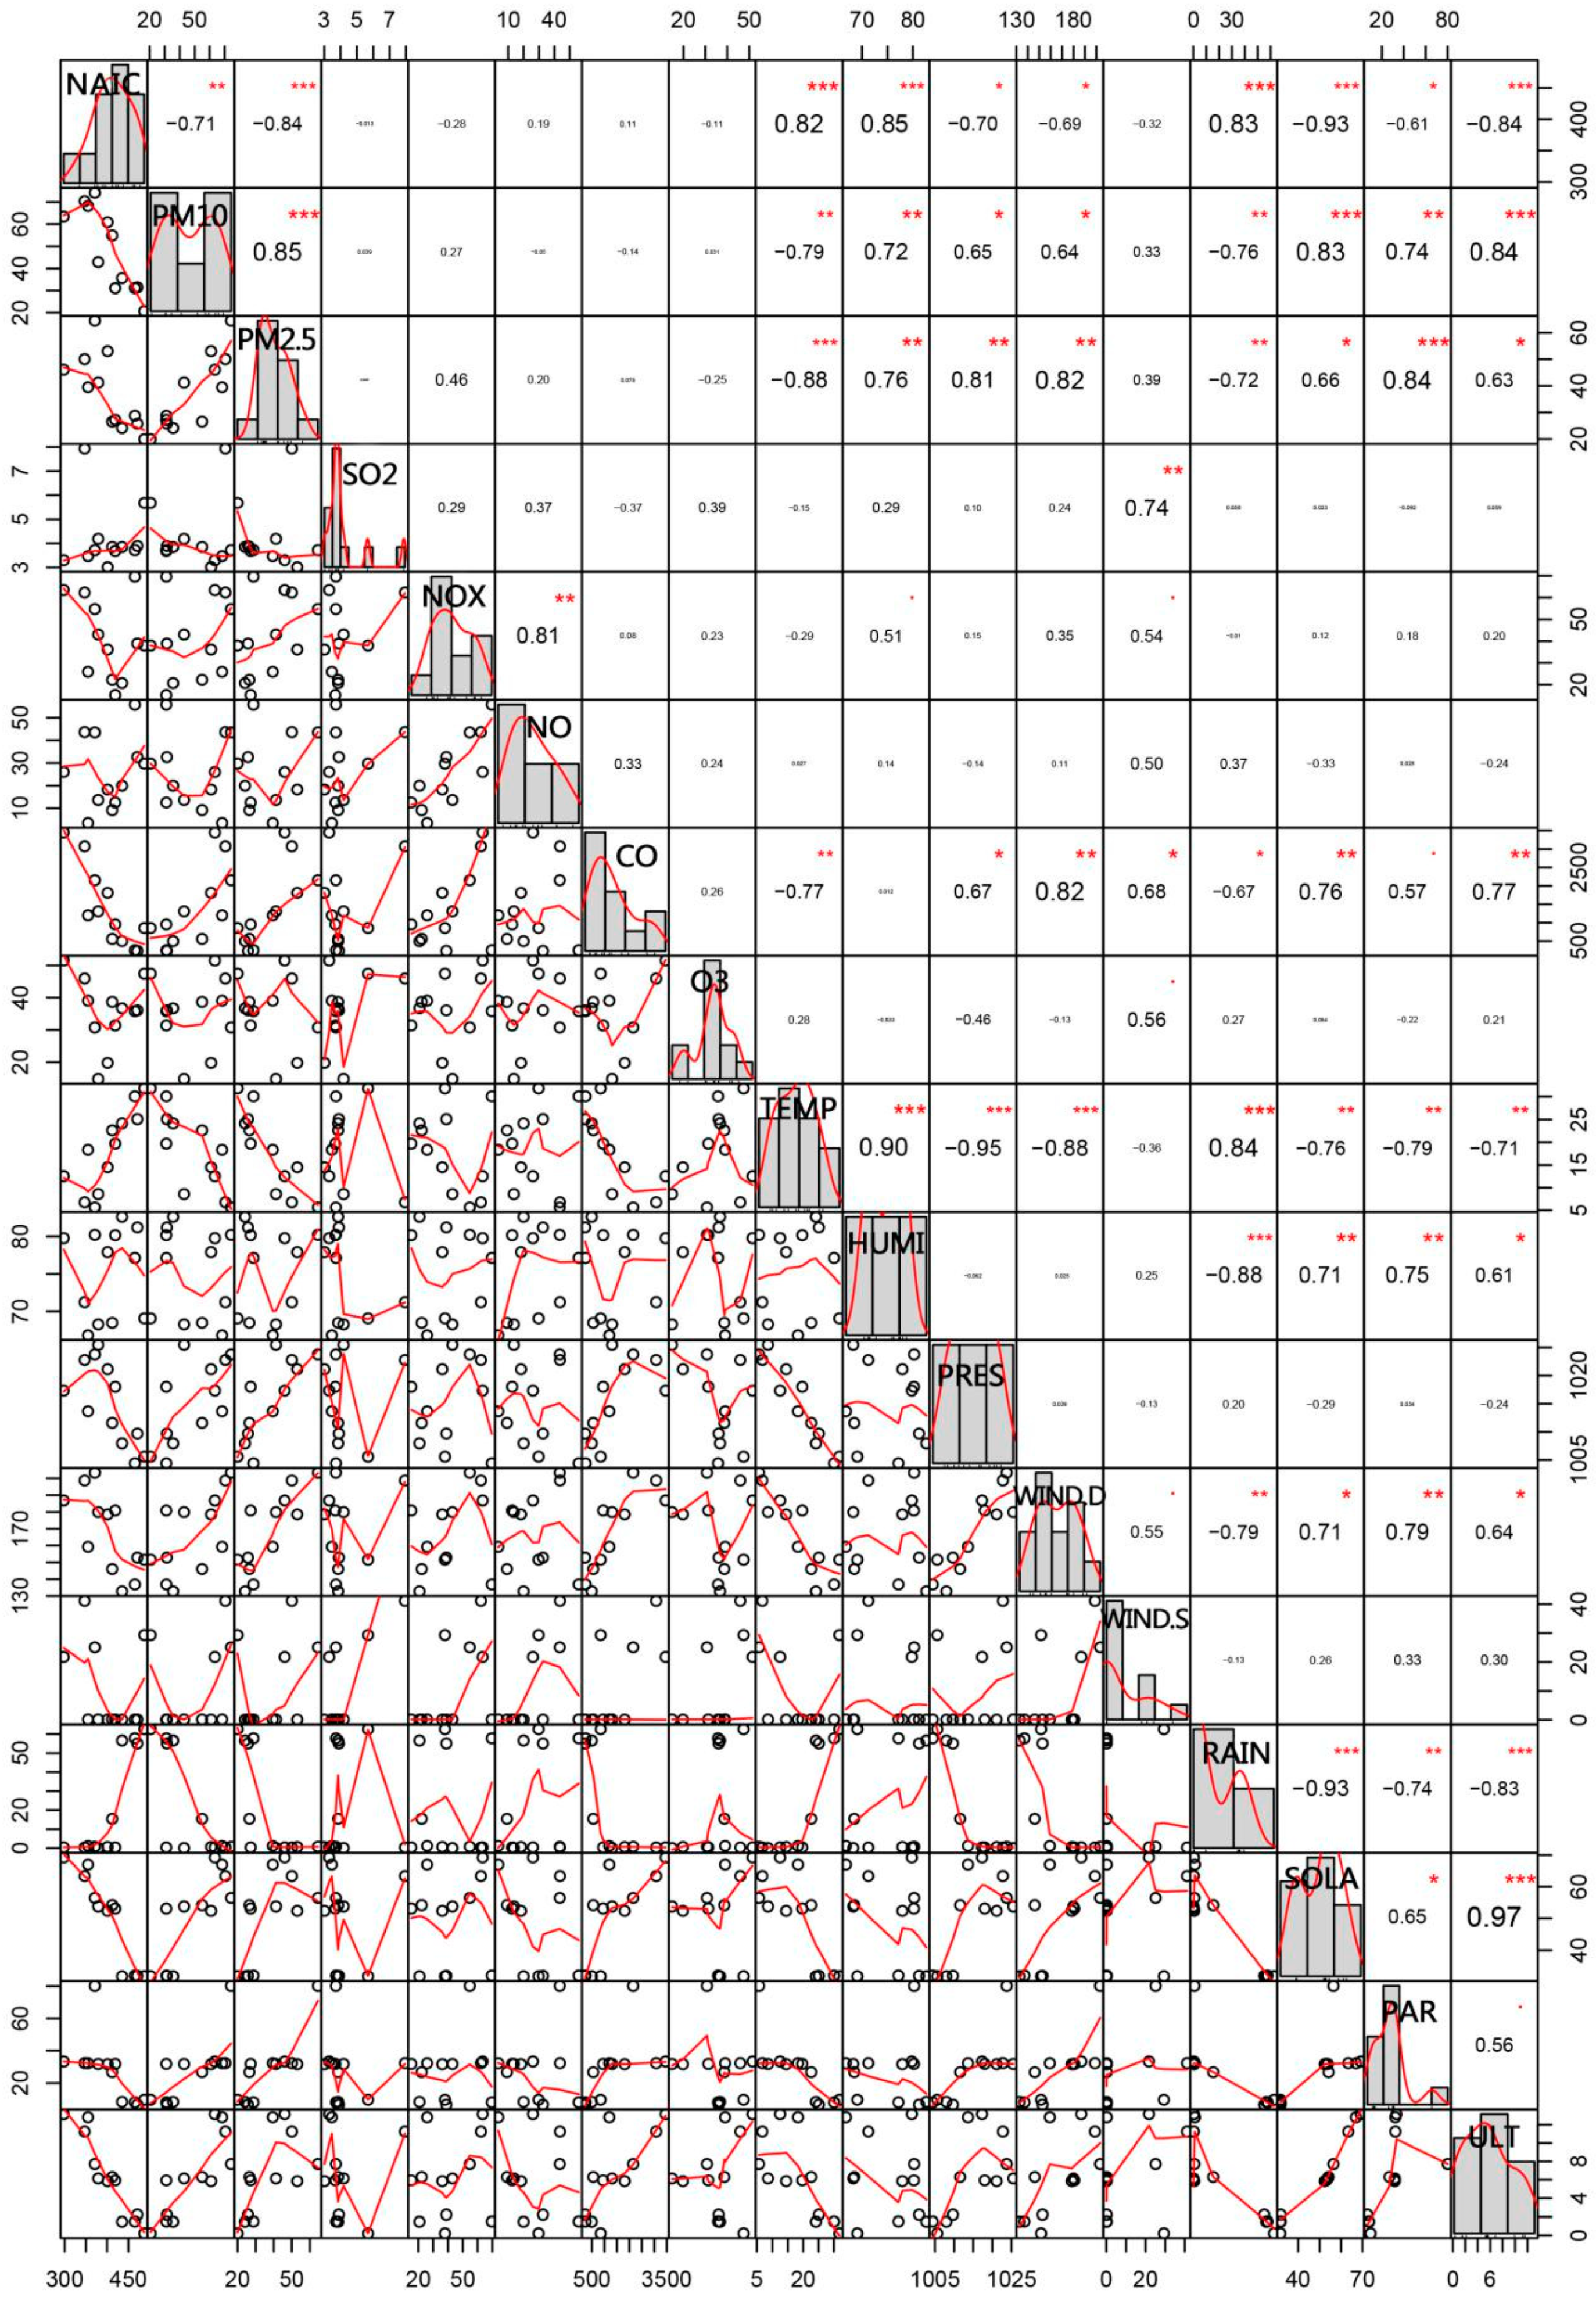
Based on Equations (1) to (3), the coefficient of determination r2 of the equation in spring, summer, and winter was relatively small and the significant influencing factors of different seasons varied under multivariate regression. In order to further explore the correlation among various environmental factors of NAIC, we did a correlation coefficient matrix analysis for 16 factors.
We can conclude from Figure 4 that there is colinearity in environmental factors, and the factors will interact with each other to influence the change in NAIC. It shows a significant correlation between NAIC and PM2.5, temperature, humidity, rainfall, and radiation with the whole year’s data. As the generation and extinction mechanisms of NAIs are highly complex, in order to eliminate the colinearity among environmental factors, we selected the four typical influencing factors mentioned above and introduced a random forest algorithm for further discussion. (The data of annual rainfall were discontinuous and not enough to analyze; total radiation (SOLA) with the highest significant correlation was selected for further analysis).

3.4. Random Forest Regression of Environmental Characteristics

The impact of four typical influencing factors (temperature, humidity, PM2.5 concentration, and total radiation) on NAIC was analyzed by the random forest regression algorithm. Multivariate regression analysis of four typical influencing factors after eliminating colinearity was done again. The output results (partially) are shown in Table 2.
As shown in Table 2, the regression equation of the F-statistic corresponds to p being considerably lower than 0.05 and the revised coefficient of 460.9, indicating that the model passed the F-test. The regression effect was more significant and a regression relationship was observed among variables. After adjustment, the coefficient r2 reached 0.501; the closer to 1, the stronger is the regression effect.
In the multivariate regression of each significant test, in addition to PM2.5, each factor (T, H, and S) exhibited an extremely significant correlation (all p < 0.001). Because the p-value of PM2.5 reached 0.983, it was eliminated from the regression model. Next, the random forest algorithm was used for regression analysis. The number of trees was set to 100 and the goodness of fit (% Var) was 44.31. The goodness of fit was similar to r2 in the regression analysis; it could be said that r2 = 44.31% had a better fitting result.
After verifying the regression relationship among the variables, the random forest algorithm was further used to rank the importance of four typical influencing factors. The importance score results obtained after operation are shown in Figure 5.
When using the random forest algorithm to rank the importance of feature factors, only when the two indices are ranked equally can the influence of independent variables on dependent variables be explained. Figure 4 shows that the two indices were in the same order and that the importance of the four independent variables was H > S > T > PM2.5.

4. Discussion

4.1. Influential Factors from Correlation Analysis and Multiple Linear Regression

From the correlation analysis of 3.2, the results showed that there were significant seasonal differences in the effects of meteorological factors on NAIC. In spring, the temperature rises, and the amount of sunlight is sufficient for plants to grow and develop rapidly; these factors promote photosynthesis and help plants and air molecules to ionize, thereby generating more NAIs. In summer, the temperature and humidity are relatively high, and extreme weather such as heavy rain and lightning enhance the photoelectric reaction and generate NAIs. In winter, compared with spring, summer, and autumn, temperature, humidity, and radiation are greatly weakened. The shedding of plant leaves reduces the discharge and photoelectric reaction at the tips of leaves, and NAI generation mainly depends on thermoelectric and piezoelectric effects, etc. In addition, rainfall increases the water molecule content in the air, which increases the source of NAIs and enhances NAIC. Thus, the mechanisms underlying the influence of temperature, humidity, and radiation on NAIC are relatively complex. However, the effect of air pollutants is mainly through the combination of particulate pollutants and NAI, which form macromolecular sedimentations and affect NAIC.
By the results from multiple regression analysis of 3.3, it was found that the key factors of the three seasons were different. Through further correlation coefficient matrix analysis, we concluded that PM2.5, temperature, humidity, rainfall, and radiation were the typical influencing factors. However, due to the fact that rain and heat happen almost at the same period in a year in Shanghai (Figure 4 could also prove this), there was high temperature and radiation during high humidity seasons. The radiation can directly affect NAIC, or it can also affect NAIC by raising the temperature. The interactions among environmental factors were still unclear and the degree of independent contribution of each factor to NAIC needed to be explored by random forest algorithm.

4.2. Typical Environmental Factors from Random Forest

Random forest regression results indicate that humidity was the most critical factor; this is consistent with previous studies [32,33,34]. Humidity affects mainly NAIC from its generation and extinction mechanisms.
  • Generation mechanism:
    High air humidity means high water content in the environment. According to the generation mechanism of air NAIs, they are the products of the combination of molecules with excess charges and water molecules and, thus, sufficient water content in the environment is required to form NAIs. More importantly, a certain amount of OH-(H2O)n forms by combining OH with the water phase contained in the air. When the humidity is high, OH-(H2O)n increases and, thus, the NAIC also increases. Moreover, with an increase in air humidity, which weakens the transpiration of plant leaves, the opening of stomata promotes photosynthesis to generate NAIs.
  • Extinction mechanism
    An increase in air humidity changes the main force of particles colliding and coagulating to enhance the coagulating effect, so that small particles coagulate and settle into large particles, thereby reducing the loss of NAIs and maintaining the NAIC.
Although Reiter et al. [17] and Ye et al. [35] considered temperature as a more critical factor [1], these conclusions were based on measurements of field sites with clear and calm weather and little environmental variability. By contrast, our research was based on results from a fixed-point observation of a central urban area for one year, during which all environmental factors changed to a great extent. In our study, the main reason why effects by humidity was higher than that by radiation, temperature, and PM2.5 might have been the direct effect on the source of NAIs. However, radiation can improve the chances of NAIs in the air acquiring energy from the molecular state to the ionic state, thereby improving the conversion efficiency. Temperature mainly increases the speed of intermolecular movement and the probability of collision between molecules; it also enhances the ability of oxygen molecules to be ionized, thereby increasing NAIs. PM2.5 affects NAIC by settling with negative air ions [21,36].
Humidity as a key factor that could better explain the different influences of the same factor on the change of NAIC in different seasons (as explained in Section 3.2). Temperature and humidity had significant positive correlations with NAIC in spring and summer and significant negative correlations in winter. Rain and heat are plentiful in spring and summer, plants are vigorous, green plants produce photoelectric effect under the action of radiation, and coniferous plants increase NAIC by discharge function at the tip. The meteorological factors in the measurement area were relatively stable. Increased precipitation at the turn of spring and summer leads to increases in humidity to create favorable conditions for NAI. In winter, plant vitality is weak and thus the influence of environmental changes on NAI is more evident; the other environmental factors such as temperature, humidity, and radiation etc. have relatively strong effects on NAIC. However, precipitation in a dry environment increases the condensing radius and combination rate among ions, thereby decreasing the migration rate of small ions; this accelerates the precipitation of NAI and reduces NAIC [19,37].
In summary, when using the random forest model to rank the importance of environmental factors, it is impossible to make predictions beyond the data range of the training set during regression, and all indicators cannot be introduced. Therefore, the random forest algorithm needs to be established on the basis of some traditional screening. Otherwise, it is difficult to reach a consistent conclusion. The explained variance was relatively low as compared to the total variance of NAIC (r² values). This could be also part of a new part of the discussion regarding model limitations and potentially additional influencing factors that were not covered by the study.

5. Conclusions

In this paper, we collected one-year monitoring data in an urban park and studied the relationships between NAIC and influencing factors, such as meteorological factors and air pollutants. The influence of various factors on NAIC differed by season, and their synergistic mechanisms were relatively complicated. Random forest algorithm analysis was introduced innovatively in this paper, which could eliminate the colinearity among environmental factors. The results showed that the ranking of the main influencing factors impact was humidity > radiation > temperature > PM2.5 concentration. Humidity was the most critical factor, primarily because it directly affects the formation of NAIs from both the environment and vegetation.
This paper addressed a new method for exploring the relationship between NAIC and environmental factors, whereas only four typical factors were chosen in the random forest algorithm analysis. Future studies could consider the impact of all other factors with both direct and indirect paths that influence NAIC. The use of new methods for deep data mining, such as support vector machines, neural networks, and structural equations, could provide the methodology of determining the environmental factors to NAIC under gradient changes or different pollution levels in the urban atmosphere.

Author Contributions

Conceptualization, S.M. and S.Y.; Methodology, S.M. and S.Y.; Software, S.M.; Validation, S.M., X.Z. and W.S.; Formal analysis, S.M.; Investigation, S.M., X.Z. and W.S.; Resources, C.L. and Y.H..; Data curation, S.M.; Writing—original draft preparation, S.M.; Writing—review and editing, X.Z. and S.Y.; Visualization, C.L.; Supervision, C.L.; Project administration, S.Y. and Y.H.; Funding acquisition, Y.H.

Funding

This research was co-funded by the National Key R&D Program of China (2017YFC0505501), the National Natural Science Foundation of China (71333010), and Shanghai Landscaping and City Appearance Administrative Bureau (G171206).

Acknowledgments

Authors appreciate the administration of Zhongshan Park for providing the research area. And this work is supported by CFERN & BEIJING TECHNO SOLUTIONS Award Funds on excellent academic achievements.

Conflicts of Interest

The authors declare that there are no conflicts of interest regarding the publication of this paper.

References

  1. Rong, S.H.; Tang, H.Q.; Ping, Y.H.; Zhi, H. Spatio-temporal changes of negative air ion concentrations in Beijing. J. Beijing For. Univ. 2005, 27, 35–39. [Google Scholar]
  2. Jovanić, B.R.; Jovanić, S.B. The Effect of High Concentration of Negative Ions in the Air on the Chlorophyll Content in Plant Leaves. Water Air Soil Pollut. 2001, 129, 259–265. [Google Scholar] [CrossRef]
  3. Yan, X.; Wang, H.; Hou, Z.; Wang, S.; Zhang, D.; Xu, Q.; Tokola, T. Spatial analysis of the ecological effects of negative air ions in urban vegetated areas: A case study in Maiji, China. Urban For. Urban Green. 2015, 14, 636–645. [Google Scholar] [CrossRef]
  4. Krueger, A.P. The biological effects of air ions. Int. J. Biometeorol. 1985, 29, 205–206. [Google Scholar] [CrossRef] [PubMed]
  5. Wu, C.C.; Lee, G.W.M. Oxidation of volatile organic compounds by negative air ions. Atmos. Environ. 2004, 38, 6287–6295. [Google Scholar] [CrossRef]
  6. Kosenko, E.A.; Yug, K.; Stavrovskaya, I.G.; Sirota, T.V.; Kondrashova, M.N. The stimulatory effect of negative air ions and hydrogen peroxide on the activity of superoxide dismutase. FEBS Lett. 1997, 410, 309–312. [Google Scholar] [CrossRef] [Green Version]
  7. Lin, H.F.; Lin, J.M. Generation and determination of negative air ions. J. Anal. Test. 2017, 1, 6. [Google Scholar] [CrossRef]
  8. Iwama, H. Negative air ions created by water shearing improve erythrocyte deformability and aerobic metabolism. Indoor Air 2010, 14, 293–297. [Google Scholar] [CrossRef] [PubMed]
  9. Yates, A.; Gray, F.B.; Misiaszek, J.I.; Wolman, W. Air ions: Past problems and future directions. Environ. Int. 1986, 12, 99–108. [Google Scholar] [CrossRef]
  10. Wang, J.; Li, S.H. Changes in negative air ions concentration under different light intensities and development of a model to relate light intensity to directional change. J. Environ. Manag. 2009, 90, 2746–2754. [Google Scholar] [CrossRef] [PubMed]
  11. Tikhonov, V.P.; Tsvetkov, V.D.; Litvinova, E.G.; Sirota, T.V.; Kondrashova, M.N. Generation of negative air ions by plants upon pulsed electrical stimulation applied to soil. Russ. J. Plant Physiol. 2004, 51, 414–419. [Google Scholar] [CrossRef]
  12. Ling, X.; Jayaratne, R.; Morawska, L. Air ion concentrations in various urban outdoor environments. Atmos. Environ. 2010, 44, 2186–2193. [Google Scholar] [CrossRef] [Green Version]
  13. Pawar, S.D. Diurnal and seasonal air ion variability at rural station ramanandnagar (17°2′ N, 74° E), India. Aerosol Air Qual. Res. 2010, 10, 154–166. [Google Scholar] [CrossRef]
  14. Hõrrak, U.; Salm, J.; Tammet, H. Diurnal variation in the concentration of air ions of different mobility classes in a rural area. J. Geophys. Res. Atmos. 2003, 108. [Google Scholar] [CrossRef] [Green Version]
  15. Jin, Q.; Yan, J.; Yang, Z.; Wang, H. Spatial-temporal characteristics of spring air negative oxygen ions and its relationship with environmental factors in Hubei. Meteorol. Sci. Technol. 2015, 43, 728–733. [Google Scholar]
  16. Zhang, Z.P.; Yu, Y.W.; Zhang, M.R.; Du, Q.Z.; Chen, J.X.; Mao, F.C. Negative air ion concentration and environmental factors for Mount Tianmu of Zhejiang Province. J. Zhejiang For. Coll. 2008, 25, 481–485. [Google Scholar]
  17. Reiter, R. Part B Frequency distribution of positive and negative small ion concentrations, based on many years’ recordings at two mountain stations located at 740 and 1780 m ASL. Int. J. Biometeorol. 1985, 29, 223–231. [Google Scholar] [CrossRef]
  18. Dhanorkar, S.; Kamra, A.K. Diurnal and seasonal variations of the small-, intermediate-, and large-ion concentrations and their contributions to polar conductivity. J. Geophys. Res. Atmos. 1993, 98, 14895–14908. [Google Scholar] [CrossRef]
  19. Retalis, A.; Nastos, P.; Retalis, D. Study of small ions concentration in the air above Athens, Greece. Atmos. Res. 2009, 91, 219–228. [Google Scholar] [CrossRef]
  20. Retalis, D.; Pitta, A.; Psallidas, P. The conductivity of the air and other electrical parameters in relation to meteorological elements and air pollution in Athens. Meteorol. Atmos. Phys. 1991, 46, 197–204. [Google Scholar] [CrossRef]
  21. Vana, M.; Ehn, M.; Petäjä, T.; Vuollekoski, H.; Aalto, P.; Leeuw, G.D.; Ceburnis, D.; O’Dowd, C.D.; Kulmala, M. Characteristic features of air ions at Mace Head on the west coast of Ireland. Atmos. Res. 2008, 90, 278–286. [Google Scholar] [CrossRef]
  22. Retalis, D.A. On the relationship between small atmospheric ions concentration and (1) smoke, (2) sulfur dioxide and (3) wind speed. Pure Appl. Geophys. 1977, 115, 575–581. [Google Scholar] [CrossRef]
  23. Li, S.; Lu, S.; Chen, B.; Pan, Q.; Zhang, Y.; Yang, X. Distribution characteristics and law of negative air ions in typical garden flora areas of Beijing. J. Food Agric. Environ. 2013, 11, 1239–1246. [Google Scholar]
  24. Oliveira, S.; Oehler, F.; San-Miguel-Ayanz, J.; Camia, A.; Pereira, J.N.C. Modeling spatial patterns of fire occurrence in Mediterranean Europe using Multiple Regression and Random Forest. For. Ecol. Manag. 2012, 275, 117–129. [Google Scholar] [CrossRef]
  25. Breiman, L. Random Forests. Mach. Learn. 2001, 45, 5–32. [Google Scholar] [CrossRef] [Green Version]
  26. Archer, K.J.; Kimes, R.V. Empirical characterization of random forest variable importance measures. Comput. Stat. Data Anal. 2008, 52, 2249–2260. [Google Scholar] [CrossRef]
  27. De’Ath, G.; Fabricius, K.E. Classification and regression trees: A powerful yet simple technique for ecological data analysis. Ecology 2000, 81, 3178–3192. [Google Scholar] [CrossRef]
  28. Prasad, A.M.; Iverson, L.R.; Liaw, A. Newer classification and regression tree techniques: Bagging and random forests for ecological prediction. Ecosystems 2006, 9, 181–199. [Google Scholar] [CrossRef]
  29. Cutler, D.R.; Edwards, T.C., Jr.; Beard, K.H.; Cutler, A.; Hess, K.T.; Gibson, J.; Lawler, J.J. Random forests for classification in ecology. Ecology 2007, 88, 2783–2792. [Google Scholar] [CrossRef] [PubMed]
  30. Peters, J.; Baets, B.D.; Verhoest, N.E.C.; Samson, R.; Degroeve, S.; Becker, P.D.; Huybrechts, W. Random forests as a tool for ecohydrological distribution modelling. Ecol. Model. 2007, 207, 304–318. [Google Scholar] [CrossRef]
  31. Zhang, K.; Wang, R.; Shen, C.; Da, L. Temporal and spatial characteristics of the urban heat island during rapid urbanization in Shanghai, China. Environ. Monit. Assess. 2010, 169, 101–112. [Google Scholar] [CrossRef] [PubMed]
  32. Peng, Y. Exploration and Evaluation of Ecological Benefits of Urban Near-Natural Forest-Contrast with Artificial Plantations and Nature Forests. Master’s Thesis, East China Normal University, Shanghai, China, 2008. (In Chinese). [Google Scholar]
  33. Xu, M.; Chen, B.F.; Su, J.; Shi, X.; Pan, Y.; Zhou, S. Dynamic of negative air ions and its relationship to environmental factors in Maofeng Mountain, Guangzhou. Ecol. Environ. 2008, 17, 179–185. [Google Scholar]
  34. Wang, C. The Study of Tourism Resource Distribution, Causes and Development and Use of Negative Air Ion in Mount Huangshan. Master’s Thesis, Anhui Agricultural University, Hefei, China, 2003. (In Chinese). [Google Scholar]
  35. Ye, C.; Wang, X. The study of the relationship between negative air ion concentration and meteorological conditions. Meteorol. Sci. Technol. 2000, 28, 51–52. (In Chinese) [Google Scholar]
  36. Tammet, H.; Hõrrak, U.; Laakso, L.; Kulmala, M. Factors of air ion balance in a coniferous forest according to measurements in Hyytiälä, Finland. Atmos. Chem. Phys. 2006, 6, 3377–3390. [Google Scholar] [CrossRef] [Green Version]
  37. Laakso, L.; Petäjä, T.; Lehtinen, K.E.J.; Kulmala, M. Ion production rate in a boreal forest based on ion, particle and radiation measurements. Atmos. Chem. Phys. Discuss. 2004, 4, 245–261. [Google Scholar] [CrossRef]
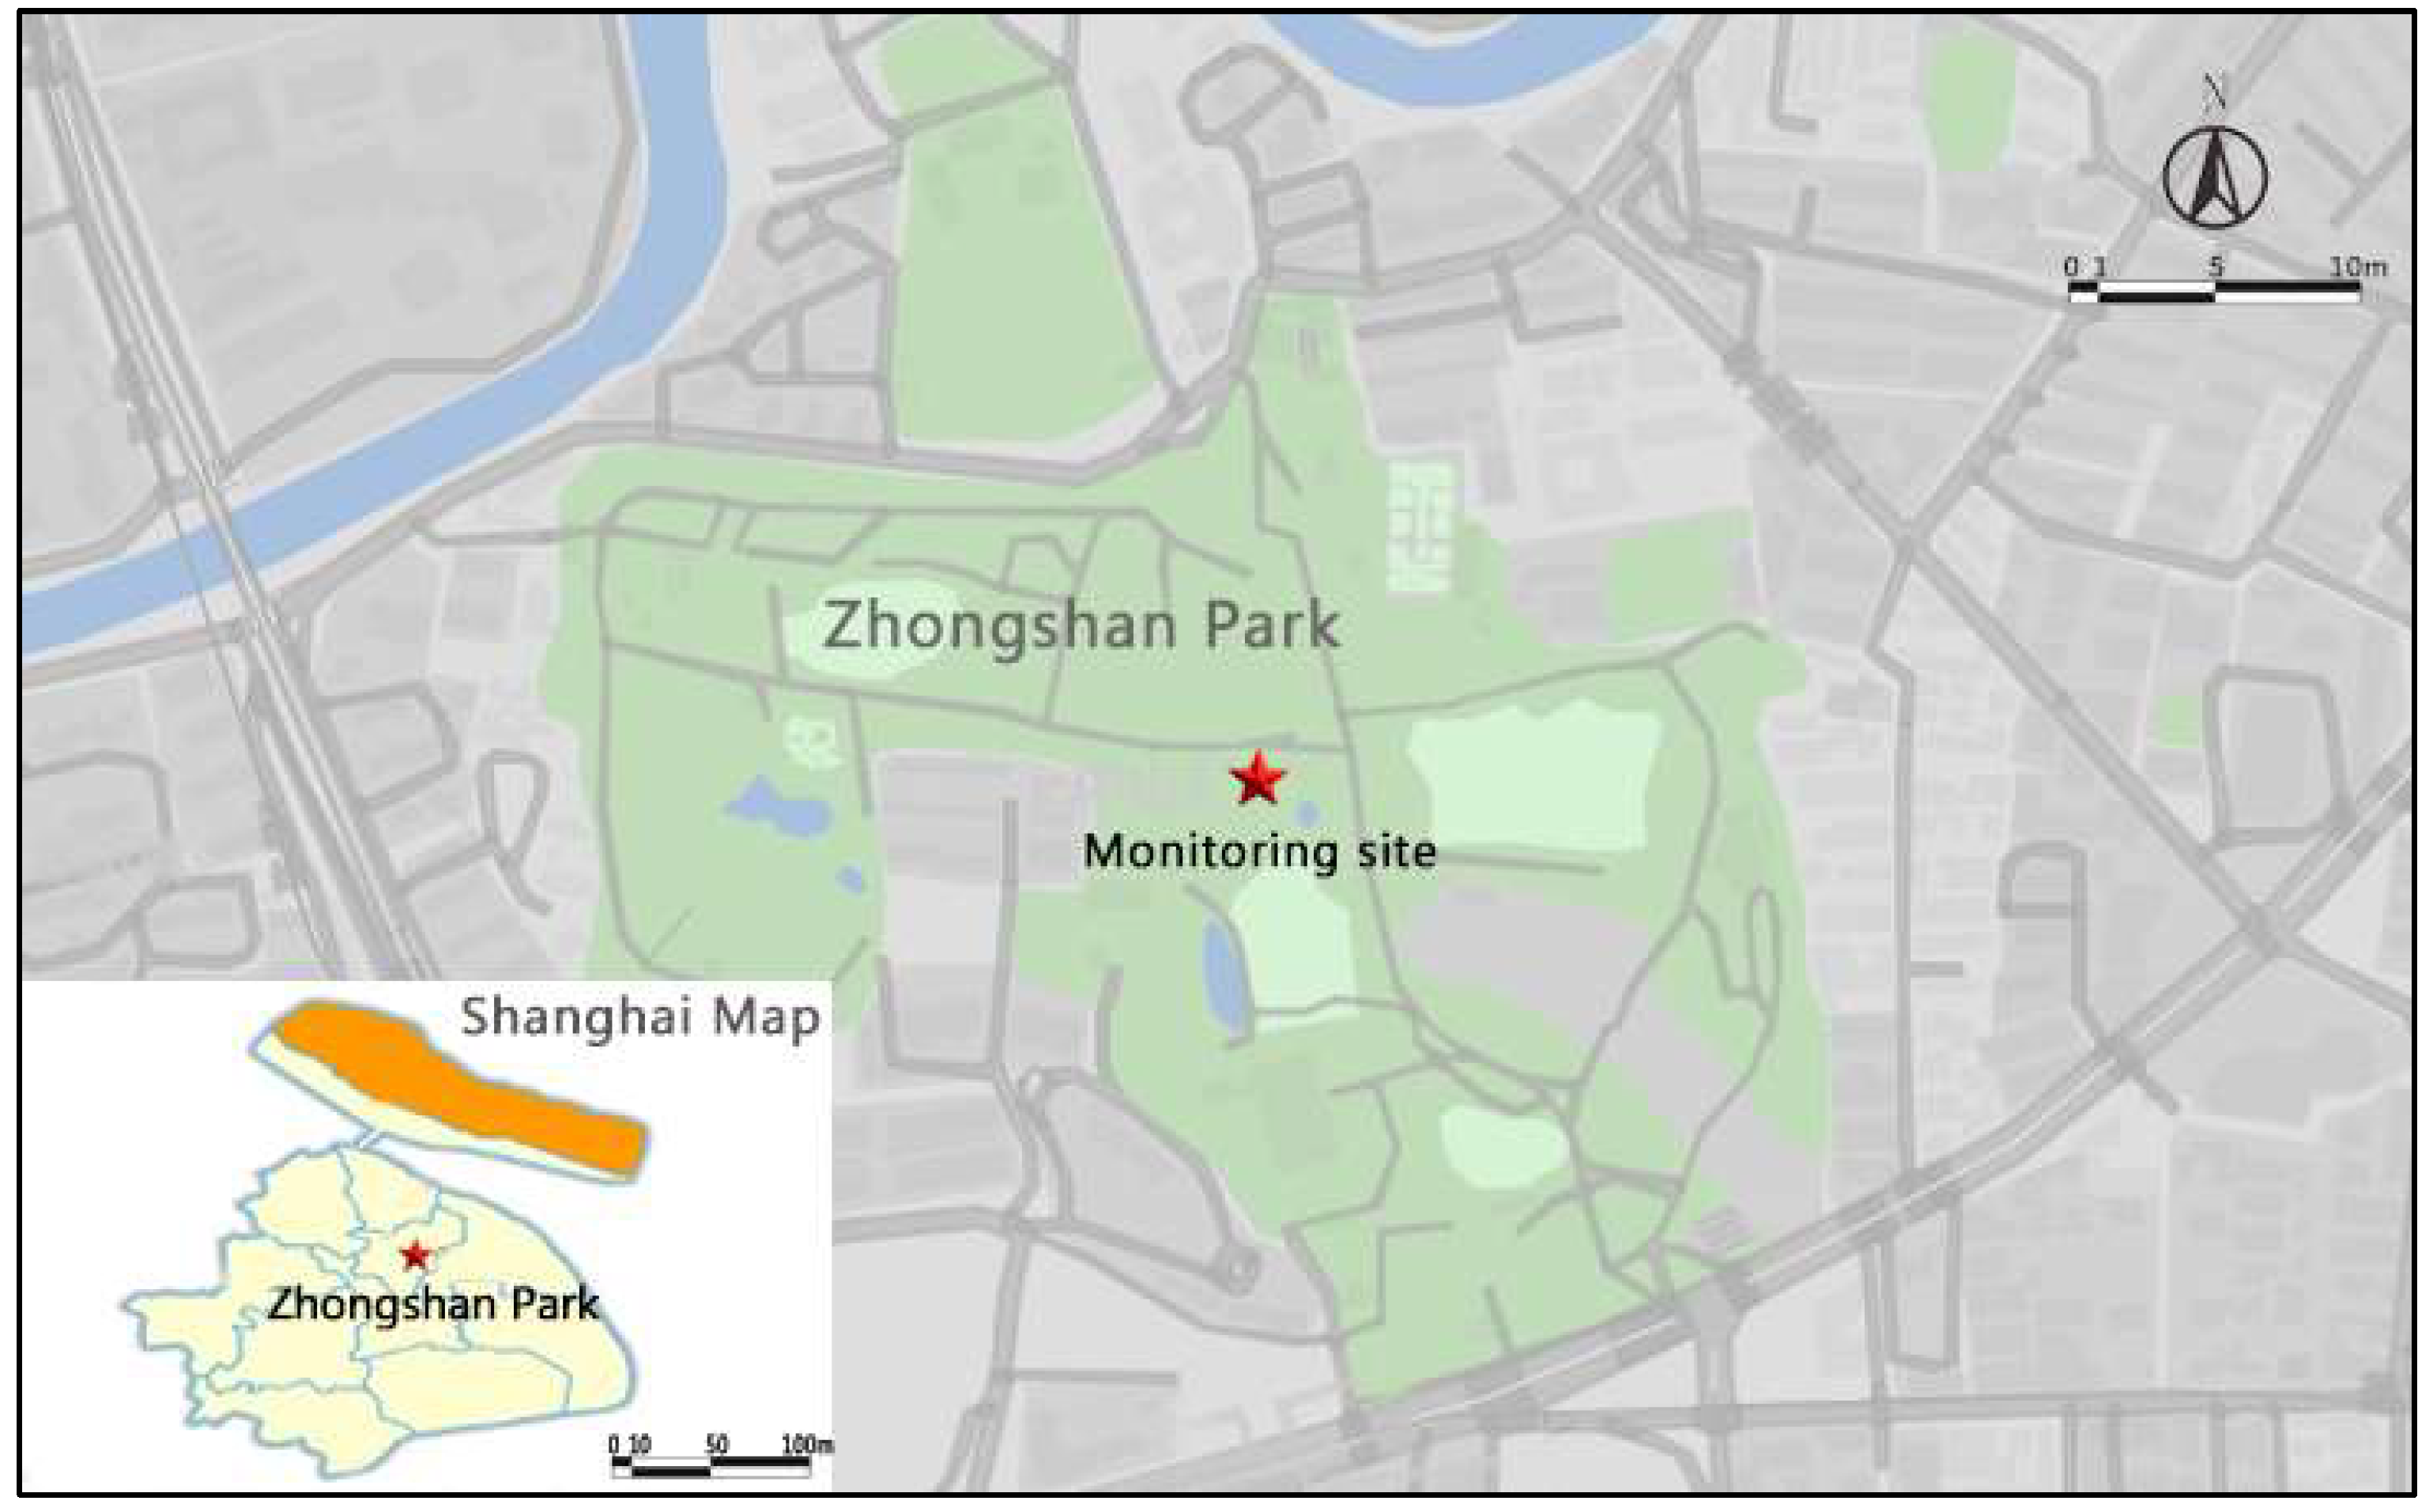
Figure 1. The location of Zhongshan Park and the monitoring site.
Atmosphere 09 00463 g001
Figure 2. Random forest classifier. (n represents each sample size; C trees represents classification trees).
Atmosphere 09 00463 g002
Figure 3. Monthly variation of NAIs in Zhongshan Park.
Atmosphere 09 00463 g003
Figure 4. Factor correlation analysis matrix. ***: p < 0.001, **: p < 0.01, *: p < 0.05. The more significant, the larger the characters.
Atmosphere 09 00463 g004
Figure 5. Importance ranking of independent variables. * %IncMSE represents the percent increase of the mean square error, IncNodePurity represents the increase of node purity, T represents temperature, H represents humidity, and S represents (total) radiation.
Atmosphere 09 00463 g005
Table 1. Pearson correlation between NAIC and environmental influencing factors. (TEMP represents temperature, HUMI represents humidity, PRES represents pressure, WIND.D represents wind direction, WIND.S represents wind speed, RAIN represents rainfall, SOLA represents full radiation, PAR represents photosynthetically active radiation, ULT represents ultraviolet radiation).
Environmental Influential FactorsSpringSummerAutumnWinter
rrrr
Meteorological factorsTEMP0.073 **0.067 **−0.009−0.086 **
HUMI0.069 **0.090 **0.012−0.114 **
PRES−0.052 *−0.0030.0130.002
WIND.D0.012−0.016−0.016−0.020
WIND.S−0.0350.0200.008−0.009
RAIN0.269 **0.0180.0190.001
SOLA−0.048−0.0040.002−0.080 **
PAR−0.246 **−0.0010.013−0.009
ULT−0.020−0.035−0.002−0.092 **
Air pollutantsPM10−0.074 *−0.092 **0.0080.008
PM2.5−0.112 **−0.0070.0050.013
SO2−0.0490.005−0.0220.003
NOX−0.069 **−0.010−0.003−0.005
NO−0.0450.0000.000−0.002
CO−0.059 *0.096 **0.0280.004
O30.0330.0060.001−0.004
Remarks: **. At the 0.01 level (two-tailed), significant correlation *. At the 0.05 level (two-tailed), significant correlation.
Table 2. Multiple regression analysis results by R (T represents temperature, H represents humidity, S represents total radiation).
CoefficientsEstimateVariancetp
PM2.50.0030.1300.0210.983
T−1.4260.432−3.302<0.001 *
H7.5060.20037.524<0.001 *
S−0.7940.114−6.969<0.001 *
(Intercept)655.16522.72928.825<0.001 *
Residual standard error: 315 on 7290 degrees of freedom. Multiple R2: 0.5019. Adjusted R2: 0.5014. F-statistic: 460.9 on 4 and 7290 degrees of freedom. Significance level < 0.001. * p < 0.001.