Review

A Review on the Methods for Observing the Substance and Energy Exchange between Atmosphere Boundary Layer and Free Troposphere

1
Environment Research Institute, Shandong University, Qingdao 266237, China
2
School of Atmospheric Sciences, Nanjing University, Nanjing 210023, China
*
Author to whom correspondence should be addressed.
Atmosphere 2018, 9(12), 460; https://doi.org/10.3390/atmos9120460
Submission received: 30 September 2018 / Revised: 16 November 2018 / Accepted: 20 November 2018 / Published: 22 November 2018

Abstract

:
Atmosphere boundary layer (ABL or BL) acts as a pivotal part in the climate by regulating the vertical exchange of moisture, aerosol, trace gases and energy between the earth surface and free troposphere (FT). However, compared with research on the exchange between earth surface and ABL, there are fewer researches on the exchange between ABL and FT, especially when it comes to the quantitative measurement of vertical exchange flux between them. In this paper, a number of various methodologies for investigating the exchange of the substance and energy between ABL and FT are reviewed as follows: (1) methods to obtain entrainment rate, which include method by investigating the height of inversion layer, method of flux-jump, estimating with dataset from the ASTEX Lagrangian Experiments and method of using satellite observations and Microwave Imager; (2) mass budget method, which can yield quantitative measurements of exchange flux between ABL and FT; (3) qualitative measurements: method based on Rayleigh distillation and mixing processes, methods of ground-based remote sensing and airborne tracer-tracer relationship/ratio method.

1. Introduction

As lowest part of the atmosphere, ABL is formed by aerodynamic drags due to surface frictional resistance which is largely determined by the properties of the underlying surface. ABL usually responds to changes in surface radiative forcing in an hour or less. In this layer physical quantities such as flow velocity, temperature, moisture and so forth, display rapid fluctuations (turbulence) and vertical mixing is strong. The atmosphere just above the ABL, which is less influenced by surface friction, is referred as Free Troposphere (FT). FT differs from turbulent ABL, it is always non-turbulent or only intermittently turbulent. Stull considers that the evolution of ABL from stably stratified in the morning to well-mixed at noon is a multifaceted process and may lead to an enhanced mixing process between ABL and FT [1]. There is a transition layer which is called inversion layer (or entrainment zone) between ABL and FT. Entrainment zone (EZ) is a layer at the top of ABL where air masses from the FT are entrained into the capping inversion layer and thus can interact with convective thermals from the ABL. It was estimated that the depth of EZ accounts for 20~40% of ABL depth [2]. The diurnal variation of boundary layer above the ocean is different from that above the land surface and we named the ABL above the ocean as marine boundary layer (MBL) customarily. On land, the diurnal variation of ABL height is often over 1000 m because of the large diurnal change of surface temperature. While above the ocean, the temperature above the sea surface generally has fewer effects on diurnal variation which leads to a less diurnal change of ABL height with only a few hundred meters [3].
If chemical species are constrained in the boundary layer, they may lead to a local pollution problem. However, if they are transported to higher FT, these chemical species can have a chance to experience a long-range transport and cause a regional pollutant event. The mechanisms of exchange between ABL and FT is summarized by Dacre et al. as following [4]: (1) advective processes include transport by the warm and cold conveyor belts associated with frontal systems, sea breeze circulations and coastal outflow and mountain venting; (2) mixing processes include deep convection, shallow convection, frontal convection and BL turbulence.
A few articles focused on the exchange between ABL and FT because such exchange of materials may be significant to the air quality in BL and FT. This review focused on the methods for observing the exchange, quantitative measurement will be introduced in Part 2 while qualitative measurement in Part 3. In Part 4, all of the methods will be concluded.

2. Quantitative Measurement

2.1. Method by Investigating the Height of Inversion Layer

At present, it is hard to assess the exchange directly and quantitatively based on up-to-now knowledge. A possible approach to make a quantitative assessment of the total exchange is to investigate the height of inversion layer on fair weather, which reflects the dynamic balance between entrainment and subsidence. Entrainment means the air masses from FT go across the inversion layer into BL due to the growth of BL and then BL thickness increases [5] and large-scale subsidence tends to decrease BL thickness [6,7]. An entrainment velocity We is defined as:
W e = d h d t W +
where d h d t is the change rate of inversion layer height (h). The evolution of h can be observed by many approaches, such as the aerosol backscatter lidar chose in Stevens et al.’ work [8]. Actually, in MBL, the level of cloud tops can be defined as the height of the base of the inversion [9]. W+ is the large-scale subsidence velocity (defined as positive upwards) and can be obtained from NCEP/NCAR (National Centers for Environmental Prediction/National Center for Atmospheric Research) Reanalysis data provided by the NOAA-CIRES (National Oceanic and Atmospheric Administration- Cooperative Institute for Research in Environmental Sciences) Climate Diagnostics Center or European Centre for Medium-Range Weather Forecasts (ECWMF). The divergence method to evaluate entrainment rate from Equation (1):
W e = d h d t + 0 h D d z
where D is the divergence of the horizontal wind which can be obtained from forecast model. With the development of techniques, D can be estimated by GPS (Global Positioning System) corrected wind fields. If the divergence D is constant with height, W+ = − Dh.
With the entrainment velocity We, a simple and height integrated scalar conservation equation in the ABL can be written with the assuming: (1) the bulk of the ABL is fully mixed so that the concentration is uniform; (2) the surface layer (where concentration change rapidly with height) is thin compared with the height of ABL.
d s m d t = F s h + ( s + s m h )   W e
where s m and s + are the scalar concentrations in and just above the ABL. F s is the scalar flux density measured at the surface and is often referred as the net ecosystem exchange (NEE), which is an important parameter to reveal the interaction between the ecosystem and ABL.
Usually, surface flux obtained by eddy covariance (EC) method is assessed by NEE from Equation (3). The results show that they had a good agreement [10,11,12,13,14,15,16,17,18]. Here, the surface flux measured by EC method may be used in Equation (3) to estimate the entrainment rate of FT air into the BL.

2.2. Method of Flux-Jump

Measuring the entrainment rate by investigating the height of inversion layer in Equations (1) and (2) seems irrelevant to the observation of a specific chemical constituents. To make direct measurement of the entrainment rate by observing a chemical constituents, method of flux-jump can be applied.
The entrainment rate We can be estimated in terms of its below-inversion flux and across-inversion jump because ozone has only weak sources and sinks at the inversion layer [19,20]:
W e = ( w s ¯ ) l _ s
where ( w s ¯ ) l _ is the flux of scale s at below inversion layer, s is the change of quantity s across the inversion layer. The entrainment velocity is the rate at which air from the FT is entrained into the BL by turbulence processes.
On 12,13/19,20 June 1992, Bretherton et al. measured the ozone flux at the below of inversion layer with EC method at the northeast of Atlantic Ocean during the two Lagrangian Intensive Observing Periods (the Lagrangian Intensive Observing Periods will be introduced later in Section 2.3). The results showed that the access of the accuracy of filtered fluxes was extremely difficult and can be trusted only to ± 50% [21,22]. The measured s from Lagrangian Intensive Observing Periods (IOPs) varied greatly from −5 to 25 ppbv, so they only adopted s which was both consistent and lager than 3 ppbv in absolute value. A typical measurement uncertainty for s is 1,2 ppbv. For We derived from ozone, nominal uncertainty is ± 0.5 cm s−1. In two Lagrangian IOPs, the estimated We is 0.6 ± 0.5 and 0.3 ± 0.5 cm s−1.
Different from Bretherton et al., Lenschow et al. did not measure the below-inversion flux (flux underneath the inversion layer) directly and applied the method to extrapolate flux values [23]. They measured the ozone vertical flux at levels of 15, 160, 326 m above the Gulf of Mexico on 11 June 1980 and at levels of 15, 60, 325 m above it on 12 June 1980. Further, they obtained the height of the mixed layer (or called as MBL) by airborne vertical sounding to extrapolate the flux values linearly to the height of the mixed layer zi, that is ( w s ¯ ) l _ . They considered the temporal and spatial changes of zi on 11 and 12 June to be negligible, thus We Wzi (Wzi is the entrainment rate at zi). The estimated entrainment rates on 11 and 12 June are 0.4 and 0.8 cm s−1, respectively. These values are in agreement with Bretherton et al.’s [21,22] although they measured at different places.
It is notorious that entrainment rate is hard to be measured [24], one of the reasons is that the flux of scalar should be measured in high rate. With the development of high rate mass spectrometric techniques, some species’ flux, such as, the flux of dimethyl sulfide (DMS) has been measured [25]. Based on Equation (3), the entrainment rate of DMS can be obtained. We based on DMS is more unambiguous than it based on other scalars (e.g., ozone) because its chemical lifetime limits it to the MBL and the concentration of DMS in FT aloft is nearly zero. Therefore, the derived entrainment rate is not influenced by the vertical structure, which can cause considerable uncertainty on other scalars.
What needs to be noticed is that the scale of humidity and temperature cannot be extrapolated to the height of zi to estimate entrainment velocity [23]. First reason is that the magnitude of ozone flux at sea surface is considerably less than the magnitude of ozone entrainment flux at zi. Second is that, while mixed layers were cloud covered, radiative processes and water phase changes add additional terms to temperature and humidity’s budget. However, ozone is negligibly soluble in water and is free of the influence of clouds. However, Faloona et al. stated that in the absence of DMS flux measurement, using the total water method rather than ozone method generated the more accurate We [25]. What makes the difference is that Faloona et al. substituted the humidity to total water, consideration of water droplets in clouds can effectively eliminate the influence of clouds.

2.3. Estimating with Dataset from the ASTEX Lagrangian Experiments

The horizontal advection makes an uncertainty to the estimation of entrainment. In order to make the estimated entrainment rate be free of the effect of horizontal advection, the method of Lagrangian experiments may be applied.
A goal of the Atlantic Stratocumulus Transition Experiment (ASTEX) implemented at the southeast of the Azores Islands in the east-central Atlantic Ocean during June 1992 was to examine the coupled evolution of cloud, dynamical and thermodynamical vertical structure in a MBL air mass, as it advected from cold to warm water in the trade winds [21]. During ASTEX, Bretherton and Pincus decided to follow and intensively measure the physical and chemical processes and the evolution of cloudiness in a single BL air mass for up to two days, they called this project as “Lagrangian” strategy. During the two Lagrangian intensive observation periods (IOPs), an air column in the convective MBL was tracked for 36–38 h. With the supplement of satellite, ship and balloon observations, they achieved an unprecedentedly complete measurement of MBL and cloud evolution by nearly continuous airplane coverage using three boundary layer aircrafts.
With the dataset from Lagrangian observations, two different methods were applied to estimate entrainment rate [21]:

2.3.1. ECMWF Synoptic-scale Analyses of Vertical Motion, Coupled with the Observed Rate of Change of Inversion Height Following the MBL Air Column

Calculate by the following expression:
W e = ( ω i d p i d t ) / ρ i g
where ω i is the vertical pressure velocity obtained from ECMWF (subsidence while > 0), dpi/dt is the average rate of change of the inversion pressure which represents the change of inversion height following the MBL air column, ρi is the air density and g is the gravitational acceleration.
The prominent oscillations of ω i due to slight dynamical imbalance between the ECMWF initialized winds and pressure were not large compared to vertical motions in midlatitude storms. However, they were as large as typical values (which are expected to see in the research) of subsidence, 0–0.1 Pa s−1. Thus, the method can be applied only to a long averaging timescale (here they use the entire duration of Lagrangian IOP). The entrainment rate estimated during two Langrangian IOPs is 0.9 ± 0.5 and 0.6 ± 0.3 cm s−1.
Equation (5) looks quite similar with Equation (1). Indeed, Equation (5) is a deformation of Equation (1). Generally speaking, the parameters such as ω, p and ρ are difficult to obtain continuously at the height of inversion layer. Compared with these parameters which are difficult to obtain, the height of BL in Equation (1) is much easier to obtain to estimate the entrainment rate.

2.3.2. Calculation of Entrainment Drying as a Residual in the Water Budget of the MBL Air Column

Since Lagrangian observation strategy traced and observed the air column continuously, the horizontal advection into and out of the air column is negligible. Thus Lagrangian observation strategy is ideal for budget calculations. The water budget of the MBL is of particular interest because the only term not directly measured is the entrainment drying. This allows the entrainment rate to be calculated by inferring entrainment drying as a residual.
Assuming for simplicity that the horizontal divergence D and the area-averaged horizontal velocity components u ¯ and v ¯ are constant with height in the MBL. Consider a scalar with mixing ratio ξ = ξ ¯ + ξ and an internal source S(x,y,p,t). The transport equation is:
ξ / t + u ξ / x + v ξ / y + ω ξ / p   =   S
Invoking the continuity equation u / x + v / y + ω / p = 0 to put (6) into flux form and writing it in terms of means and perturbations:
ξ ¯ / t + u ¯ ξ ¯ / x + v ¯ ξ ¯ / y + ω ¯ ξ ¯ / p + ( u ξ ¯ ) / x + ( v ξ ¯ ) / y + ( ω ξ ¯ ) / p = S ¯
Over a large horizontal averaging area the terms ( u ξ ¯ ) / x and ( v ξ ¯ ) / y can be neglected. Then d ξ ¯ / d t = ξ ¯ / t + u ¯ ξ ¯ / x + v ¯ ξ ¯ / y is the “Lagrangian” derivative of ξ ¯ following a moving MBL air column which can be measured in Lagrangian IOPs. Thus, (7) can be simplified to:
d ξ ¯ / d t + ω ¯ ξ ¯ / p + ( ω ξ ¯ ) / p   =   S ¯
Define MBL column-averaged ξ a to be the mass weighted average of ξ ¯ over the MBL. Since a constant horizontal divergence d ω ¯ / d p = D does not affect ξ a (because it squeezes mass out of each part of a vertical column at an equal rate), ξ a is affected only by the internal source averaged over the height of MBL, Sa.
Taking the average of Equation (8) between the surface pressure ps and the inversion pressure pi and applying Equation (8) to the MBL column-averaged total water mixing ratio qa:
ρiwe (qaqi+) = Fq0R − (pspi) (dqa/dt)/g
where ρi is the air density at the inversion base, qa is the MBL column-averaged total water (vapor + liquid) mixing ratio, qi+ is the total water mixing ratio above the inversion layer, Fq0 is the upward surface water vapor flux, −R is the surface drizzle flux and ps and pi are the pressures at surface and in the inversion layer.
All data except we in Equation (9) can be derived from sounding and surface fluxes. The entrainment rate estimated during two Langrangian IOPs were 1.0 ± 0.4 and 0.9 ± 0.3 cm s−1.

2.4. Method of Using Satellite Observations and Microwave Imager

The height of MBL is often measured by aircrafts or shipborne remote sensing. However, Wood and Bretherton put forwards a novel method to estimate MBL height by satellite observations from Moderate Resolution Imaging Spectroradiometer (MODIS) and the Tropical Rainfall Measuring Mission (TRMM) Microwave Imager (TMI) in Californian coast [26]. Then, Wood and Bretherton combined the MBL height obtained from these methods and NCEP reanalysis data to calculate the entrainment rate We.
The height of MBL z i (similar to h in Equation (1)) is written as:
z i t + u ( z i ) z i = W e W + ( z i )
where u( z i ) is the horizontal wind velocity. u( z i ) and large-scale subsidence W + ( z i ) can be got from NCEP reanalysis data. In the case of a period long enough, z i t goes for zero:
W e ¯ = u ( z i ) z i ¯ + W + ( z i ) ¯
The authors assumed that u ( z i ) z i ¯ u ( z i ) ¯   z i ¯ and Equation (11) is simplified to:
W e ¯ u ( z i ) ¯   z i ¯ + W + ( z i ) ¯
To achieve a reasonably small noise, the shortest averaging time scale is 2 months. In another word, the data should be averaged over at least 2 months. Estimated W e ¯ varied geographically and the maxima W e ¯ is reached at downwind (about 0.4–0.5 cm s−1).
Compared with the methods introduced before, this method has a much longer time period to average the data while the methods mentioned before usually have a time period of several hours. As a result, this method will issue in a W e which represents the average situation over months. In contrast, the three methods mentioned before only result in W e of a specific day. Moreover, this method used the data from MODIS rather than from in-situ airborne measurement, it gives a novel view of estimating entrainment rate.

2.5. Mass Budget Method

Apart from calculating entrainment rate, mass budget method is also an approach to assess the exchange between BL and FT.
In the study of the circulation and fluxes of the halogens [27] and sulfur [28] in the tropical marine atmosphere, the net exchange rates of these materials between MBL and FT need to be evaluated [3]. It is especially important for sulfur because there might be significant influxes of both SO2 and sulfate into the BL from upper atmosphere. In order to obtain such an exchange coefficient, Kritz analyzed the concentration of Sr-90, Pb-210, Bi-210 and Po-210 measured in and above the MBL [29] and the exchange coefficient based on these radionuclides was derived. Rn-222 is a gas liberated from earth surface and it is the product of radioactive decay of Ra-226. Rn-222 (with a 3.8-day half-life) decays to form Pb-210 via several short-lived intermediaries, Pb-210 is quickly and irreversibly scavenged by atmosphere aerosols. This Pb-210 (with a 22-year half-live) in turn decays to form Bi-210 (5.0-day half-life) and thence Po-210 (138-day half-life). Kritz considered the Pb-210, Bi-210 and Po-210 reach a quasi-steady state between the net exchange from free troposphere, the ingrowth and decay of radionuclides and the removal to ocean surface. Although Sr-90 is not a Radon daughter and is produced by nuclear bomb tests [30], it had a similar situation of quasi-steady. Kritz considered that in the system of marine atmosphere (bounded below by sea surface and above by trade wind inversion), the fluxes of materials in and out of it are equal and may be represented by:
Φ i n = Q / τ = Φ o u t
where Q is the total quantity (or called as column density) of material in the marine atmosphere and τ is mean residence time of the material. If calculating the column density by multiplying the concentration measured several metres above the sea level by height H (determined as 1000 m) [27,31], then Equation (13) can be rewritten as:
Φ i n = C b l H / τ b l = Φ o u t
where Cbl is the concentration of the constituent at near-surface, H is scale height (MBL height) and τ bl is its mean residence time in the BL.
The movement of radionuclides between the FT and MBL could be led by both diffusive and quasi-advective processes. Here diffusion is the classical concept of a flux arising from small scale random motions, proportional to the product of a concentration gradient and a diffusion coefficient. Processes of quasi-advective are not well defined, they might include entrainment, redefinition, cumulus convection and subsidence. Kritz did not distinguish the two types of processes in detail and modeled the exchange by a simple parametric expression:
Φ f t b l = ( C f t C b l ) k d
Φ f t b l   = C f t v p
where Φ f t b l is the net rate of exchange across the boundary layer-free troposphere interface, C f t is the observed radionuclide concentration in the lower FT and k d and v p are exchange coefficients expressed in terms of distance per unit time. Equation (15a) represents a primarily diffusive exchange. In another way of expression, Equation (15b) is written in analogy with “piston velocity” which represents for the dry deposition of an atmospheric trace constituent at the earth surface.
Thus in the remote marine atmosphere, for a specified radionuclide, the budget equation can be written as follow:
Φ f t b l + i n g r o w t h d e c a y = C b l H / τ b l
The diffusion coefficients obtained from Equation (15a) were 265,354,292 m d−1 and “piston velocity” coefficients gained from Equation (15b) were 185,228,203 m d−1 for Pb-210, Bi-210 and Sr-210, respectively. It is noteworthy that these radionuclides are different and Sr-90 is not a Radon daughter, however, their exchange coefficients are quite similar. But for Po-210, k d and v p are 1028 and 392 m d−1, respectively, which are larger than the exchange coefficient of other radionuclides. Kritz considered that it is due to additional sources of Po-210 in marine atmosphere, one of which is sea surface [32].
The mass budget methods can be applied not only in ocean but also in mountain valleys. Since the Mesolcina and Leventina valleys in the Swiss Alps all have the characteristics of steep slopes, small floor width and large depth, an air mass budget can be applied to estimate venting of BL air to FT during fair weather and daytime conditions [33]. Henne et al. set a valley box model with three open interfaces—two vertical cross sections within the main valley and a horizontal lid. The vertical mass flux F Z can be expressed as:
F Z = F y o u t F y , i n + F T F U V W
where F y o u t F y , i n is the convergence of horizontal mass flux, F T is additional flow into and out of tributary valleys and F U V W is the change of the up-valley wind layer air mass with time.
Some simplifications were made. First is the assumption of net vertical mass flux being approximately equal to upward mass flux. The second is the neglect of F T since the valleys in study have no tributaries. According to the estimated F Z , under fair weather condition, the venting of valley air mass to FT is about 3 times per day.

3. Qualitative Measurement

3.1. Method Based on Rayleigh Distillation and Mixing Processes

Yet the shallow convection and entrainment were investigated a lot, the vertical moisture exchange between BL and FT is not fully understood. This method measured water vapor mixing ratio and the stable isotope ratio 18 O / 16 O in pairs to evaluate processes of moist convective mixing and entrainment to improve our understanding of moisture transport between BL and FT. During 6–9 May 2010, Bailey et al. measured the water vapor mixing ratio (q), the oxygen and hydrogen isotope ratios, temperature and the submicron aerosol number size distributions on the Big Island of Hawaii [34]. Observed Isotope ratios (obs) were denoted in the notation of δ to be compared with Standard Mean Ocean Water (std):
δ D = ( D / H o b s D / H s t d 1 )   ×   1000
δ 18 O = ( 18 O / 16 O o b s 18 O / 16 O s t d 1 ) × 1000
Because the outcome of δ D measured by the instruments is inferior to δ 18 O [34,35,36], Bailey et al. used δ 18 O in analysis preferentially.
Since heavy and light isotopologues of water share different saturation vapor pressures [37,38], the relationship between the isotope ratio (R) and observed vapor mixing ratio (q) can be used to diagnose moisture fluxes [39,40,41]. It is also a method to distinguish the mechanisms between moistening and dehydrating [42,43]. The research carried out by González et al. on Tenerife in the subtropical North Atlantic and that carried out by Noone et al. in Mauna Loa of Hawaii in the Pacific, both proved that the shifting of the q δ D pairs (in an diagram of q versus δ D ) to the upper side of the distribution diagram is the result of relatively drier FT air mixing into the top of moist MBL [41,44]. In the case of unsaturation, both q and R are conserved variables and the mixing of air mass will cause the observed data to show a line in δ 1/q space (an isotopic mixing diagram of δ versus the inverse of water vapor 1/q). By comparison, when air mass goes through a pseudoadiabatic process where condensate is promptly removed as precipitation, its δ value falls along a curve of theoretical Rayleigh distillation in δ 1/q space. By measuring the water vapor mixing ratio (q), temperature (T) and the heavy-to-light isotope ratio (R) at a certain height zi and preceding height zi−1, Rayleigh distillation is expressed as:
R i = R i 1 ( q i q i 1 ) α 1
In the case of slow condensation, α is defined as equilibrium fractionation factor meaning how much heavy isotopes can be removed from vapor phase. α is a function of T. Since q was assumed at saturation during condensation, T was approximated as the dew point temperature.
A parameter ε of precipitation efficiency which varied from zero to one is defined. On condition that all condensate is kept together with the ascending vapor, ε is zero. However, if all condensate is converted to precipitation, ε increases to one.
As shown in Figure 1, when air masses in mixed layer mix with FT air, observed data plot the straight (solid) line. However, pseudoadiabatic processes of Rayleigh distillation issue in a dashed line. In the case of moist adiabatic, observations will fall along one of the dotted lines depending on their precipitation efficiency (ε). When it comes to a fully reversible moist adiabatic process, precipitation efficiency parameter ε is 0 and the total water and total water isotope ratio are conserved.
This research investigates processes that promote moisture transport between the ocean surface and the lower FT near an oceanic island by measuring the stable isotope ratio in water. Below the inversion layer, the isotopic mixing profile of daytime appeared as wet adiabatic convection in some conditions. In other conditions, the profiles appeared as a series of stratification that varied daily and showed the evidence of dry turbulent mixing. With the support of isotope ratios, the effect of cloud processes and moisture mixing in the convective boundary layer (CBL) could be differentiated. Because re-evaporation of condensate in clouds was critical for making the isotope ratios observed around the roof of the BL clear, Rayleigh distillation is insufficient for characterizing moisture transport processes in the Hawaiian BL.
Different from below the inversion layer, moisture transport between the BL and FT was better characterized by a simple model of vertical mixing, which is displayed as a straight line on isotopic mixing diagram in the δ18O −1/q space. Deviations from the straight-line demonstrated the existence of residual layer (RL) formed in previous mixing events. In more than half of the sampled profiles, residual layers capping the CBL appeared. In these situations, fundamental assumptions of synoptic-scale transport controlling the air mass at the top of CBL were not adequate for characterizing the moisture vertical exchange in the low part of subtropical marine atmosphere. Actually, it was the RL which influenced the mixing events in transition layer. The RL formed by strong mixing events may influence vertical mixing for several days.

3.2. Method of Ground-Based Remote Sensing

In the past, we could only investigate the turbulent condition of ABL by aircraft observations or measuring on somewhat tall towers. However, with the development of remote sensing techniques, we can move forward to examine turbulence statistics over most of the depth of the CBL. This is impossible for in-situ measurements operated in the past.
In order to observe the exchange between ABL and FT, Takahashi et al. investigated the diurnal variation of water vapor mixing between the ABL and FT over the Loess Plateau in China in 2005 and 2006 [45]. Vertical profiles of atmospheric water were measured from the ground-based microwave radiometry (MR) equipment, the time step was 1 min and the height was up to 10 km. In addition, vertical profiles of wind velocity were also observed by a 1290-MHz wind profiler radar up to a height of about 8 km. And the air temperature, precipitation, amount and types of clouds were observed as well. These results revealed characteristic diurnal variations of atmospheric water vapor in the southern Loess Plateau in summer. On sunny days in early summer, a strong vertical wind was generated in the afternoon and led to the development of ABL. With the development of active cumulus convection in the afternoon, strong convection was enhanced. An interesting situation was detected, from the early morning until the afternoon, water vapor decreased in the lower atmosphere and increased in the upper atmosphere. This finding demonstrated that atmospheric water vapor between the ABL and FT was exchanged diurnally. The strong convection in the ABL developed by sensible heat from land surface and cumulus convection, together, played critical roles on vertical mixing of water vapor.
Additionally, the horizontal advection of clouds may influence the vertical distribution of water vapor. Although strong vertical mixing event was not observed by wind profile radar in one cloudy day, the profile of water vapor between ABL and FT showed diurnal variation. This result demonstrated the significance of horizontal advection and was incompatible with the assumption that horizontal direction is homogenous.
Except for microwave radiometry, the Raman Lidar (RLID) can also observe the profiles of water vapor in atmosphere. The U.S. Department of Energy Atmospheric Radiation Measurement (ARM) program’s Raman lidar has collected water vapor mixing ratio (q) profile data more than 90% of the time since October 2004 at the ARM Southern Great Plains site in north central Oklahoma. Turner et al. analyzed 300 cases where the CBL was quasi-stationary and well mixed for a 2h period. They found the q skewness ( q 3 ¯ ( q 2 ¯ ) 3 / 2 ) at altitudes between 0.6zi (where zi is the depth of the convective mixed layer) and 1.2zi is correlated with the magnitude of the q variance ( q 2 ¯ ) at zi, with increasingly negative values of skewness observed lower down in the mixed layer (or called as ABL) as the variance at zi increases. This suggests that in cases with lager variance at zi there is deeper penetration of warm, dry FT air into ABL [46].

3.3. Airborne Tracer-Tracer Relationship/Ratio Method

To improve the understanding of vertical exchange between ABL and FT, tracer-tracer relationship/ratio method may be applied.
Berkes et al. made the field observation at the Taunus Observatory at the summit of Mount Kleiner Feldberg (825 m a.s.l.) during the PARADE (PArticles and RAdicals: Diel observations of the impact of urban and biogenic Emissions) field campaign [47]. Berkes et al. measured the concentration of CO2 and O3, ambient temperature and humidity, pressure and particle number concentration by aircraft [47]. The descending flights were spiral-shaped and the diameter was about 10 to 15 km. The highest flight altitude was 3000 m above sea level and the observation time was about 2 to 3 hr. Meanwhile, Berkes et al. launched radiosondes 4 to 10 times every day and the radiosondes were usually released from an hour before sunrise to an hour after sunset [47]. The measurement of CO2 and O3 was also performed by ceilometer and surface base. With the data from radio soundings, Berkes et al. used the surface-based bulk Richardson number RiB to calculate the planetary boundary layer (ABL) height [48,49]. Furthermore, the height of ABL can be determined by ceilometer [50]. Once the mean value of backscatter decreases to half the maximum average value inside the ABL, this altitude is determined as the ABL height.
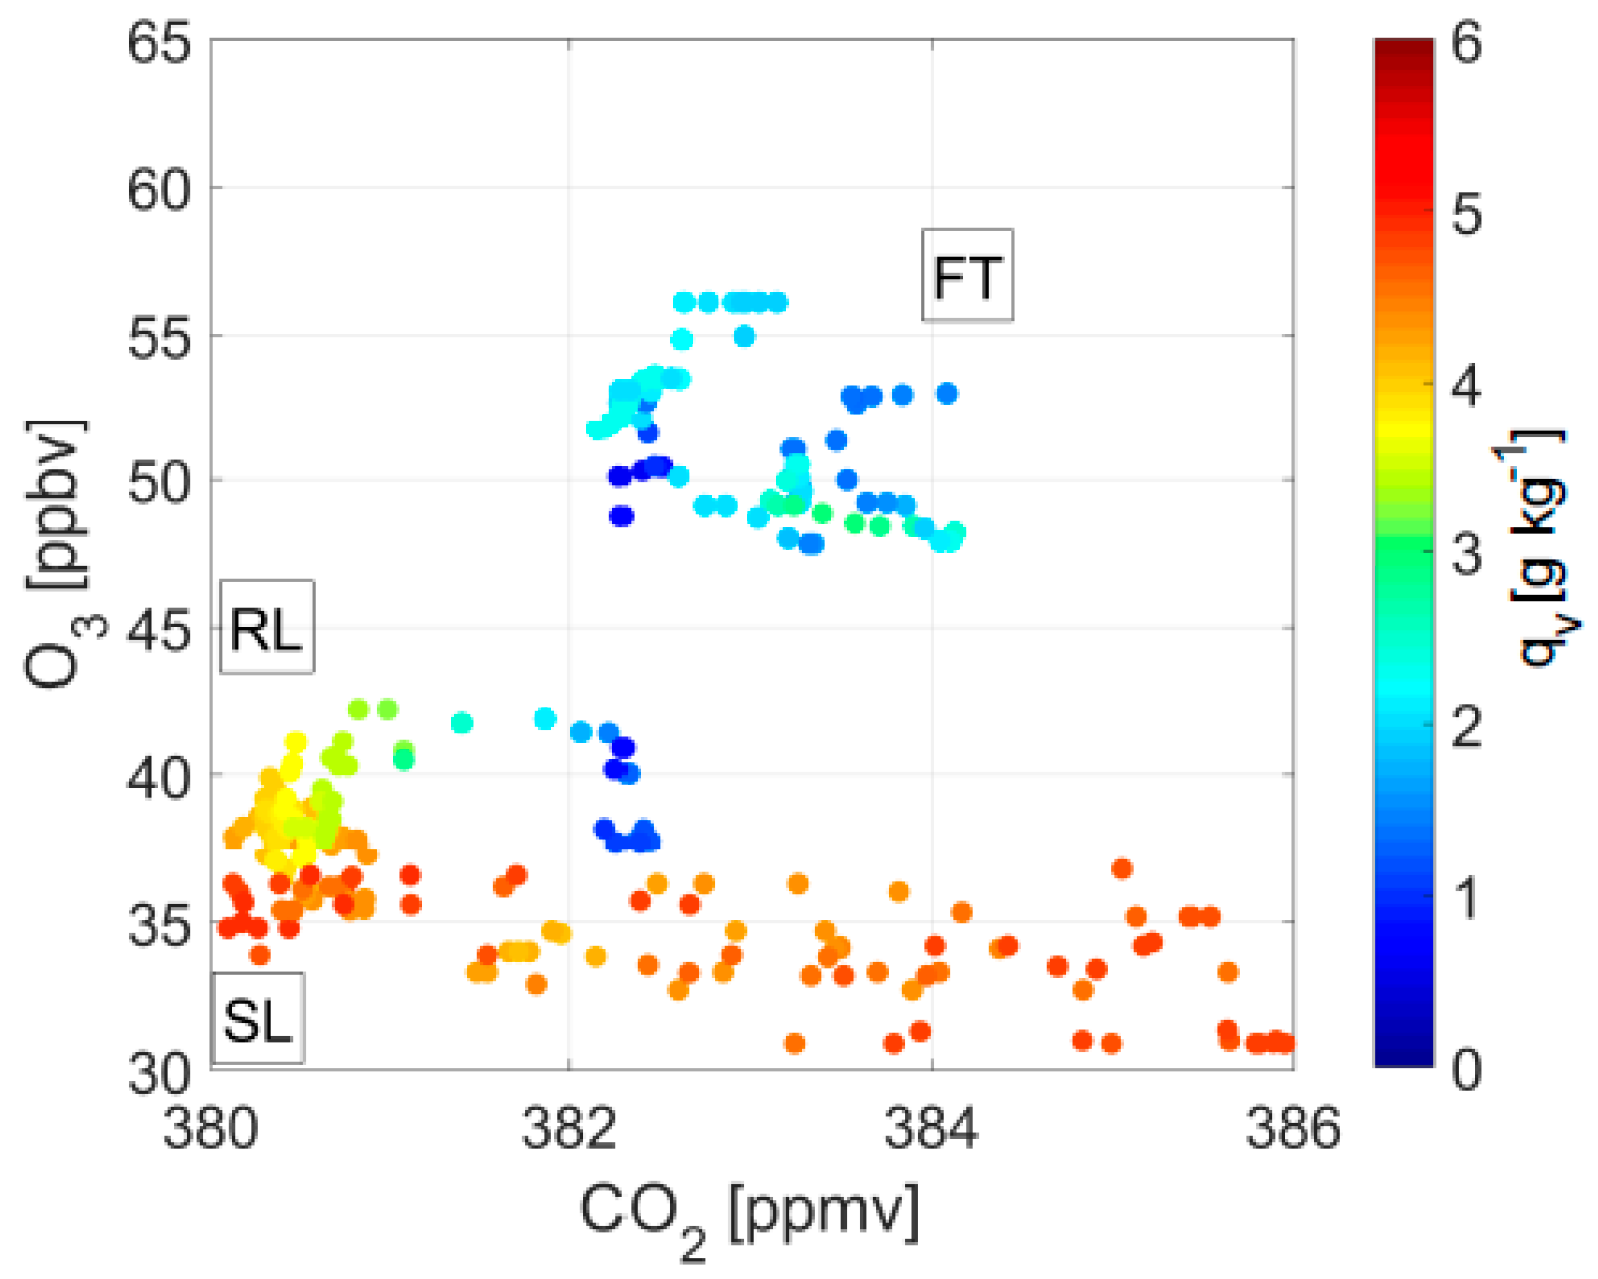
Figure 2 is the scatter diagram of O3 and CO2 in the morning (07: 27 UTC) of 6 September 2011, we can distinguish the air masses between BL and FT obviously from the humidity and concentration of O3 and CO2. The air mass in the RL and stable layer (SL) (all belonging to ABL) has low O3 values and variable values of CO2 and qV (humidity). However, the air mass in the FT is observed with larger values of O3, lower values of qV and less variability in CO2.
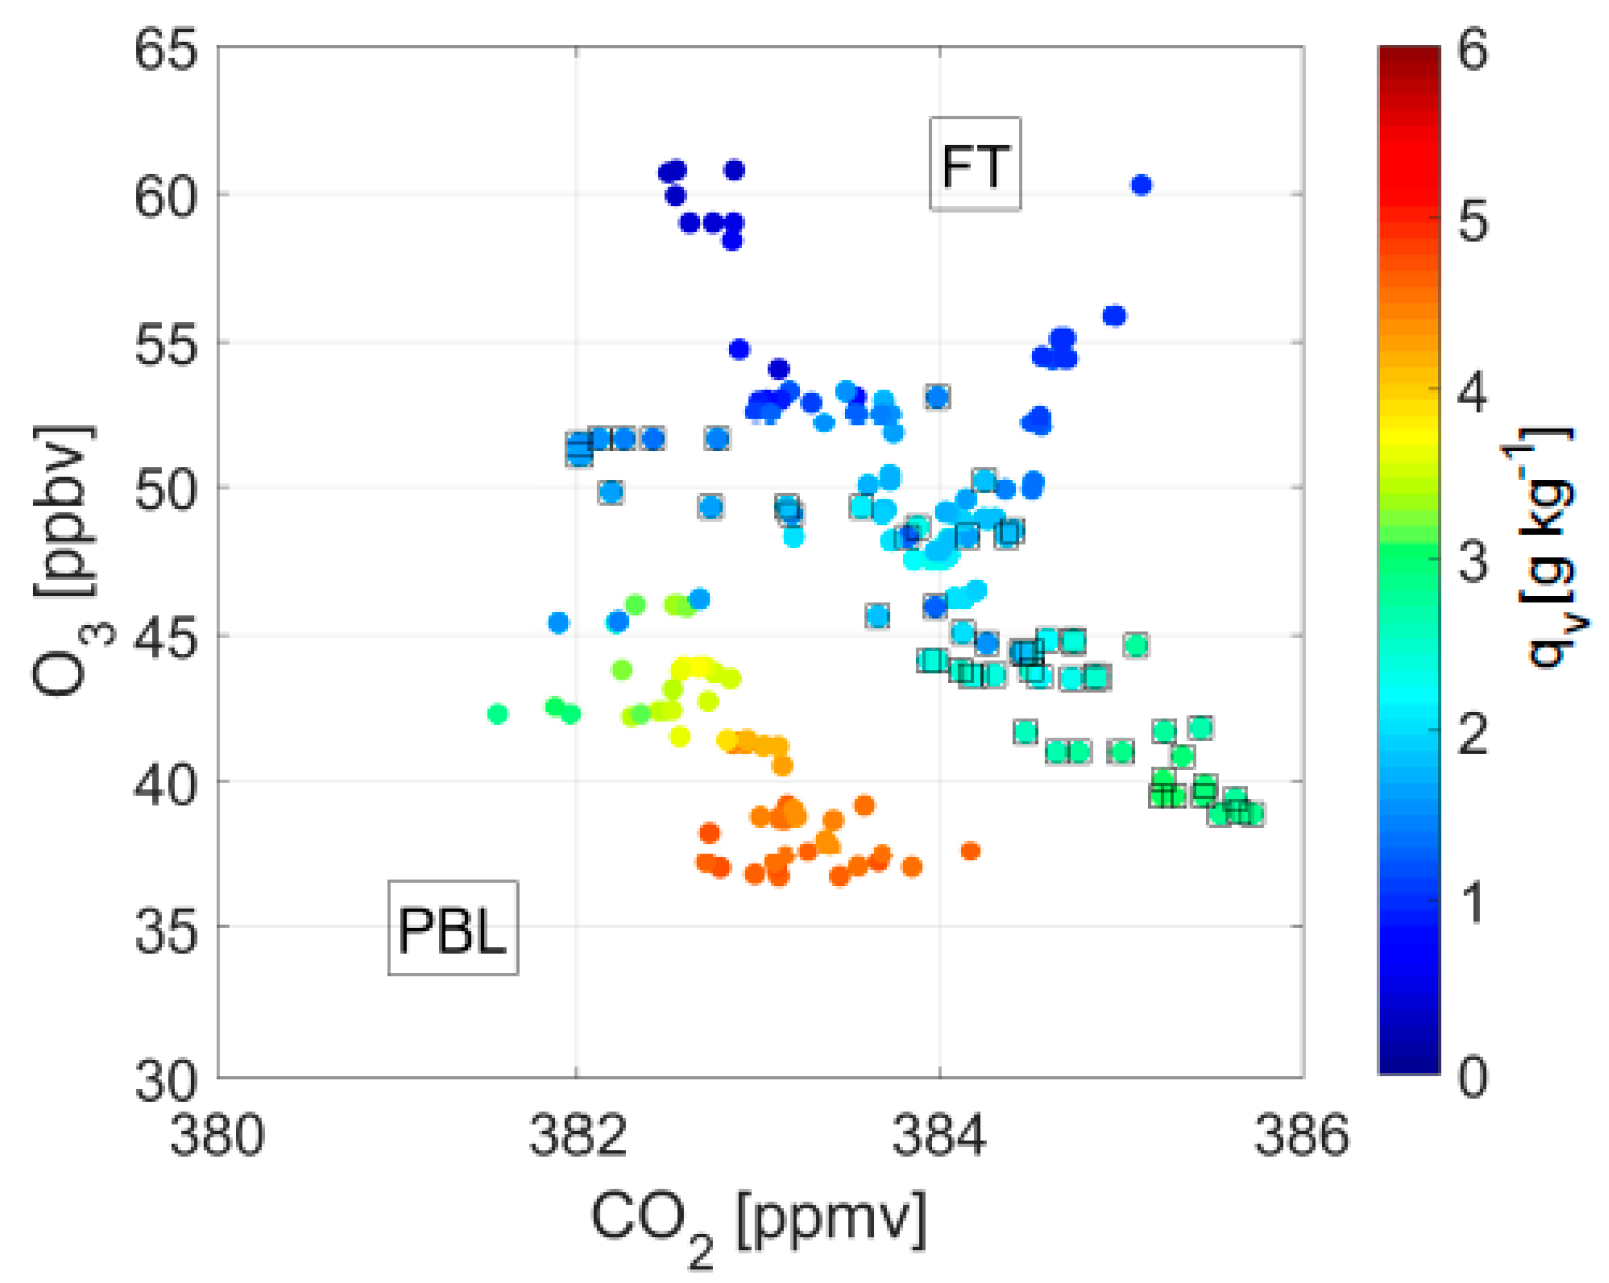
At noon (11:42UTC), the scatter diagram of O3 and CO2 changed (Figure 3). The characterization of two different air masses can still be distinguished from each other; the qV of BL air mass is higher while the qV is lower in FT. Nevertheless, the air mass in the FT appears different to that in the morning and shows a larger variability in CO2—this is considered an indicator of an ABL air mass that has entered the FT. Moreover, the O3 mixing ratios in the ABL are also increased slightly which could be related to downward transport of a FT air mass. The line made up of black boxes which were measured above the ABL in Figure 3 is the boundary of FT and BL. The qV of the boundary line is slighter higher than the background value of FT.
Berkes et al. investigated the origin of the probed air masses with 24 h kinematic backward trajectories and found the air masses around the top of the BL is separated by inversion layer [47]. This is the evidence that the air masses originated from different locations. Thus, air mass from ABL and FT must mix at the measurement location or shortly before.
At the time of measurement, the top of the BL is influenced by clouds. The existence of clouds will affect the strength of inversion layer and the mixing between ABL and FT. Radiative cooling at the upper edge of the clouds promotes a downward mixing of air and thus affect the inversion strength and might also contribute to the observed mixing event by entrainment of dry air from FT into BL [51,52]. The authors considered that the evolution of shallow convection and consecutive cloud formation at the top of the ABL will influence the mixing and make efficient exchange between ABL and FT.
Tracer-tracer relationship method can judge whether air masses are from FT or BL by analyzing the relations among O3, CO2 and humidity. Thus, it can find the exchanges between FT and BL by the time evolution of these scales. Analogous to this, by analyzing the relations among O3 and other different scales, the evidences of exchange processes between FT and BL can be found. In transported air masses, positive correlation between ozone and CO is a signature of photochemical ozone production from anthropogenic precursors and increases in ozone with little change or decreases in CO indicates vertical ozone transport from the FT or stratosphere [53]. The relationships between ozone and NOX (NOX = NO + NO2) can also indicate the vertical mixing processes between BL and FT. Whether in urban or rural areas, positive correlation between ozone and the products of NOX oxidation is a signature of ozone production from anthropogenic NOX emission [54]. Furthermore, since HNO3 is an oxidation product of NOX, the positive correlations between ozone and HNO3 can also prove the anthropogenic influence. On the contrary, a negative or flat correlation between ozone and HNO3 can be caused by entrainment of FT air with more ozone and less HNO3 into BL [55]. In conclusion, we can decide the sources of BL ozone by the relationship among O3, CO, humidity or O3, HNO3, humidity. Since the humidity of FT is lower and of BL is higher, the humidity can represent the height of air masses roughly.
Potential pseudo-equivalent temperature can be obtained when wet unsaturated air masses ascend to where the water vapor in the air masses all condensates and they then descend to the height of 1000 hPa via a dry adiabatic process. When the atmosphere is convectively unstable, potential pseudo-equivalent temperature decreases as altitude increases. In adiabatic, the potential pseudo-equivalent temperature of the same air mass is conserved. This character is usually used to identify the source of air masses. Jia et al. observed the nighttime ozone at Guncheng, Hebei, they found the value of O3 increased remarkably as the concentration of NOX and CO decreased with the decrease in potential pseudo-equivalent temperature [56]. This is an indicator that the downward flow from lower and middle FT brought the air masses to ground and caused ozone mixing ratio to increased. This result is corresponding to the preceding paragraph of the text.
In Weiss-Penzias et al.’ study at Mount Bachelor, the enhancement ratio between ΔTGM (total gaseous mercury) and ΔCO was used as an effective tracer to represent the long-range transport from Asian BL to North American FT [57]. The ΔTGM/ΔCO measured at Mount Bachelor Observatory (2763m above sea level) on 24 April 2004 was similar to the value obtained from pollution plumes downwind of east Asia, demonstrating the Asian long-range transport to North America.

4. Conclusions

Compared with qualitative measurement, quantitative measurement may be more difficult in observing the exchange of substance and energy between ABL and FT. The exchange between BL and FT can be assessed quantitatively by estimating the entrainment rate or mass budget method. By observing the height of inversion layer, we can make a quantitative assessment of the total exchange between ABL and FT. Moreover, it is potentially an efficient method to estimate entrainment rate with the observation of chemical constituents by measuring the scalar flux below the inversion and the cross-inversion jump. The scalar flux below the inversion can be obtained by extrapolating the profile of scalar to the height of inversion-below or measuring on aircraft directly. However, the result of direct measurement is not accurate. Comparing with in-situ measurement, the method of estimating by dataset from Lagrangian strategy can be free of the influence of horizontal advection which is difficult to get reliable data and is a main uncertainty. Combining the satellite observations and NCER reanalysis data provided a novel view of estimating entrainment rate over a long period.
Mass budget method by using long-lived Radon daughters as indicators of exchange can be used in ocean. In mountain valleys, vertical mass flux may also be calculated by mass budget method.
By measuring the water vapor mixing ratio and stable isotope ratio 18 O / 16 O in pair on an island to evaluate moist convective mixing and entrainment processes between MBL and FT, it can be found that the transition layer between MBL and FT is corresponding to mixing model rather than Rayleigh distillation model. With the improvement of ground based remote sensing techniques, mixing events between ABL and FT can be observed continuously. In addition, tracer-tracer correlation/ratio method gives a valid and clear approach to observe the mixing/transport of species between FT and BL by analyzing the relations among species or their ratios.

Author Contributions

Writing-original draft preparation, H.Z.; writing-revision and suggestion, X.Z., J.Z., Q.D and X.W.; help and discussion, L.X., W.W., W.W., N.Z., A.D. and J.S.

Funding

This research was funded by The National Key Research and Development Program of China, grant number 2016YFC0200500.

Acknowledgments

Thank for the support of School of Atmospheric Sciences, Nanjing University.

Conflicts of Interest

The authors declare no conflict of interest. The funders had no role in the design of the study; in the collection, analyses, or interpretation of data; in the writing of the manuscript, or in the decision to publish the results.

References

  1. Stull, R.B. An Introduction to Boundary Layer Meteorology; Springer International Publishing: Dordrecht, The Netherland, 1988; pp. 1–26. [Google Scholar]
  2. Martin, S.; Beyrich, F.; Bange, J. Observing entrainment processes using a small unmanned aerial vehicle: A feasibility study. Bound. Layer Meteorol. 2014, 150, 449–467. [Google Scholar] [CrossRef]
  3. Kritz, M.A. Use of long lived radon daughters as indicators of exchange between the free troposphere and the marine boundary-layer. J. Geophys. Res. Oceans 1983, 88, 8569–8573. [Google Scholar] [CrossRef]
  4. Dacre, H.F.; Gray, S.L.; Belcher, S.E. A case study of boundary layer ventilation by convection and coastal processes. J. Geophys. Res. Atmos. 2007, 112. [Google Scholar] [CrossRef] [Green Version]
  5. Driedonks, A.G.M.; Tennekes, H. Entrainment effects in the well-mixed atmospheric boundary-layer. Bound. Layer Meteorol. 1984, 30, 75–105. [Google Scholar] [CrossRef]
  6. Neiburger, M.; Chen, W.C.; Johson, D.S. Studies of the structure of the atmosphere over the eastern pacific ocean in summer. 1, inversion over the eastern north Pacific Ocean. Phys. Rev. B 1961, 61, 4033–4040. [Google Scholar]
  7. Albrecht, B.A. Model of the thermodynamic structure of the trade-wind boundary-layer: 2. Applications. J. Atmos. Sci. 1979, 36, 90–98. [Google Scholar] [CrossRef]
  8. Stevens, B.; Lenschow, D.H.; Vali, G.; Gerber, H.; Bandy, A.; Blomquist, B.; Brenguier, J.L.; Bretherton, C.S.; Burnet, F.; Campos, T.; et al. Dynamics and chemistry of marine stratocumulus-dycoms-II. B. Am. Meteorol. Soc. 2003, 84, 579–593. [Google Scholar] [CrossRef]
  9. Augstein, E.; Schmidt, H.; Ostapoff, F. The vertical structure of the atmospheric planetary boundary layer in undisturbed trade winds over the atlantic ocean. Bound. Layer Meteorol. 1974, 6, 129–150. [Google Scholar] [CrossRef]
  10. Helliker, B.R.; Berry, J.A.; Betts, A.K.; Bakwin, P.S.; Davis, K.J.; Denning, A.S.; Ehleringer, J.R.; Miller, J.B.; Butler, M.P.; Ricciuto, D.M. Estimates of net CO2 flux by application of equilibrium boundary layer concepts to CO2 and water vapor measurements from a tall tower. J. Geophys. Res. Atmos. 2004, 109. [Google Scholar] [CrossRef]
  11. Lai, C.T.; Schauer, A.J.; Owensby, C.; Ham, J.M.; Helliker, B.; Tans, P.P.; Ehleringer, J.R. Regional CO2 fluxes inferred from mixing ratio measurements: Estimates from flask air samples in central kansas, USA. Tellus. B 2006, 58, 523–536. [Google Scholar] [CrossRef]
  12. Desai, A.R.; Helliker, B.R.; Moorcroft, P.R.; Andrews, A.E.; Berry, J.A. Climatic controls of interannual variability in regional carbon fluxes from top-down and bottom-up perspectives. J. Geophys. Res. Biogeosci. 2010, 115, 02011–02115. [Google Scholar] [CrossRef]
  13. Dang, X.; Lai, C.-T.; Hollinger, D.Y.; Schauer, A.J.; Xiao, J.; Munger, J.W.; Owensby, C.; Ehleringer, J.R. Combining tower mixing ratio and community model data to estimate regional-scale net ecosystem carbon exchange by boundary layer inversion over four flux towers in the united states. J. Geophys. Res. Biogeosci. 2011, 116, 113–120. [Google Scholar] [CrossRef]
  14. Denmead, O.T.; Raupach, M.R.; Dunin, F.X.; Cleugh, H.A.; Leuning, R. Boundary layer budgets for regional estimates of scalar fluxes. Glob. Chang. Biol. 1996, 2, 255–264. [Google Scholar] [CrossRef]
  15. Levy, P.E.; Grelle, A.; Lindroth, A.; Molder, M.; Jarvis, P.G.; Kruijt, B.; Moncrieff, J.B. Regional-scale CO2 fluxes over central sweden by a boundary layer budget method. Agric. Forest Meteorol. 1999, 98, 169–180. [Google Scholar] [CrossRef]
  16. Kuck, L.R.; Smith, T.; Balsley, B.B.; Helmig, D.; Conway, T.J.; Tans, P.P.; Davis, K.; Jensen, M.L.; Bognar, J.A.; Arrieta, R.V.; et al. Measurements of landscape-scale fluxes of carbon dioxide in the peruvian amazon by vertical profiling through the atmospheric boundary layer. J. Geophys. Res. Atmos. 2000, 105, 22137–22146. [Google Scholar] [CrossRef]
  17. Lloyd, J.; Francey, R.J.; Mollicone, D.; Raupach, M.R.; Sogachev, A.; Arneth, A.; Byers, J.N.; Kelliher, F.M.; Rebmann, C.; Valentini, R.; et al. Vertical profiles, boundary layer budgets and regional flux estimates for CO2 and its C-13/C-12 ratio and for water vapor above a forest/bog mosaic in central siberia. Glob. Biogeochem. Cycles 2001, 15, 267–284. [Google Scholar] [CrossRef]
  18. Styles, J.M.; Lloyd, J.; Zolotoukhine, D.; Lawton, K.A.; Tchebakova, N.; Francey, R.J.; Arneth, A.; Salamakho, D.; Kolle, O.; Schulze, E.D. Estimates of regional surface carbon dioxide exchange and carbon and oxygen isotope discrimination during photosynthesis from concentration profiles in the atmospheric boundary layer. Tellus. B 2002, 54, 768–783. [Google Scholar] [CrossRef]
  19. Lilly, D.K. Models of cloud-topped mixed layers under a strong inversion. Q. J. R. Meteorol. Soc. 1968, 94, 292–309. [Google Scholar] [CrossRef] [Green Version]
  20. Kawa, S.R.; Pearson, R. An observational study of stratocumulus entrainment and thermodynamics. J. Atmos. Sci. 1989, 46, 2649–2661. [Google Scholar] [CrossRef]
  21. Bretherton, C.S.; Pincus, R. Cloudiness and marine boundary-layer dynamics in the astex lagrangian experiments: 1. Synoptic setting and vertical structure. J. Atmos. Sci. 1995, 52, 2707–2723. [Google Scholar] [CrossRef]
  22. Bretherton, C.S.; Austin, P.; Siems, S.T. Cloudiness and marine boundary-layer dynamics in the astex lagrangian experiments.2. Cloudiness, drizzle, surface fluxes and entrainment. J. Atmos. Sci. 1995, 52, 2724–2735. [Google Scholar] [CrossRef]
  23. Lenschow, D.H.; Pearson, R.; Stankov, B.B. Measurements of ozone vertical flux to ocean and forest. J. Geophys. Res. C. Oceans Atmos. 1982, 87, 8833–8837. [Google Scholar] [CrossRef]
  24. Stevens, B.; Lenschow, D.H.; Faloona, I.; Moeng, C.H.; Lilly, D.K.; Blomquist, B.; Vali, G.; Bandy, A.; Campos, T.; Gerber, H.; et al. On entrainment rates in nocturnal marine stratocumulus. Q. J. R. Meteorol. Soc. 2003, 129, 3469–3493. [Google Scholar] [CrossRef] [Green Version]
  25. Faloona, I.; Lenschow, D.H.; Campos, T.; Stevens, B.; Van-Zanten, M.; Blomquist, B.; Thornton, D.; Bandy, A.; Gerber, H. Observations of entrainment in eastern pacific marine stratocumulus using three conserved scalars. J. Atmos. Sci. 2005, 62, 3268–3285. [Google Scholar] [CrossRef]
  26. Wood, R.; Bretherton, C.S. Boundary layer depth, entrainment and decoupling in the cloud-capped subtropical and tropical marine boundary layer. J. Clim. 2004, 17, 3576–3588. [Google Scholar] [CrossRef]
  27. Kritz, M.A.; Rancher, J. Circulation of Na, Cl and Br in the tropical marine atmosphere. J. Geophys. Res. Oceans 1980, 85, 1633–1639. [Google Scholar] [CrossRef]
  28. Kritz, M.A. Exchange of sulfur between the free troposphere, marine boundary-layer and the sea-surface. J. Geophys. Res. C Oceans Atmos. 1982, 87, 8795–8803. [Google Scholar] [CrossRef]
  29. Moore, H.E.; Poet, S.E.; Martell, E.A.; Wilkening, M.H. Origin of Rn-222 and its long-lived daughters in air over hawaii. J. Geophys. Res. 1974, 79, 5019–5024. [Google Scholar] [CrossRef]
  30. Libby, W.F. Radioactive fallout and radioactive strontium. Science 1956, 123, 657–660. [Google Scholar] [CrossRef] [PubMed]
  31. Gordon, C.M.; Jones, E.C.; Larson, R.E. Vertical distribution of particulate Na and Cl in a marine atmosphere. J. Geophys. Res. C Oceans Atmos. 1977, 82, 988–990. [Google Scholar] [CrossRef]
  32. Turekian, K.K.; Kharkar, D.P.; Thomson, J. The fates of Pb-210 and Po-210 in the ocean surface. J. Rech. Atmos. 1974, 8, 639–646. [Google Scholar]
  33. Henne, S.; Furger, M.; Nyeki, S.; Steinbacher, M.; Neininger, B.; de Wekker, S.F.J.; Dommen, J.; Spichtinger, N.; Stohl, A.; Prevot, A.S.H. Quantification of topographic venting of boundary layer air to the free troposphere. Atmos. Chem. Phys. 2004, 4, 497–509. [Google Scholar] [CrossRef] [Green Version]
  34. Bailey, A.; Toohey, D.; Noone, D. Characterizing moisture exchange between the hawaiian convective boundary layer and free troposphere using stable isotopes in water. J. Geophys. Res. Atmos. 2013, 118, 8208–8221. [Google Scholar] [CrossRef]
  35. Schmidt, M.; Maseyk, K.; Lett, C.; Biron, P.; Richard, P.; Bariac, T.; Seibt, U. Concentration effects on laser-based del O-18 and del H-2 measurements and implications for the calibration of vapour measurements with liquid standards. Rapid Commun. Mass. Sp. 2010, 24, 3553–3561. [Google Scholar] [CrossRef] [PubMed]
  36. Aemisegger, F.; Sturm, P.; Graf, P.; Sodemann, H.; Pfahl, S.; Knohl, A.; Wernli, H. Measuring variations of delta o-18 and delta h-2 in atmospheric water vapour using two commercial laser-based spectrometers: An instrument characterisation study. Atmos. Meas. Tech. 2012, 5, 1491–1511. [Google Scholar] [CrossRef]
  37. Bigeleisen, J. Statistical mechanics of isotope effects on thermodynamic properties of condensed systems. J. Chem. Phys. 1961, 34, 1485–1493. [Google Scholar] [CrossRef]
  38. Dansgaard, W. Stable isotopes in precipitation. Tellus 1964, 16, 436–468. [Google Scholar] [CrossRef]
  39. Gat, J.R. Oxygen and hydrogen isotopes in the hydrologic cycle. Annu. Rev. Earth. Pl. Sci. 1996, 24, 225–262. [Google Scholar] [CrossRef]
  40. He, H.; Smith, R.B. Stable isotope composition of water vapor in the atmospheric boundary layer above the forests of new England. J. Geophys. Res. Atmos. 1999, 104, 11657–11673. [Google Scholar] [CrossRef]
  41. Noone, D.; Galewsky, J.; Sharp, Z.D.; Worden, J.; Barnes, J.; Baer, D.; Bailey, A.; Brown, D.P.; Christensen, L.; Crosson, E.; et al. Properties of air mass mixing and humidity in the subtropics from measurements of the D/H isotope ratio of water vapor at the Mauna Loa Observatory. J. Geophys. Res. Atmos. 2011, 116, 898–908. [Google Scholar] [CrossRef]
  42. Worden, J.; Noone, D.; Bowman, K.; Tropospheric-Emission, S. Importance of rain evaporation and continental convection in the tropical water cycle. Nature 2007, 445, 528–532. [Google Scholar] [CrossRef] [PubMed]
  43. Noone, D. Pairing measurements of the water vapor isotope ratio with humidity to deduce atmospheric moistening and dehydration in the tropical midtroposphere. J. Clim. 2012, 25, 4476–4494. [Google Scholar] [CrossRef]
  44. Gonzalez, Y.; Schneider, M.; Dyroff, C.; Rodriguez, S.; Christner, E.; Elena Garcia, O.; Cuevas, E.; Jose Bustos, J.; Ramos, R.; Guirado-Fuentes, C.; et al. Detecting moisture transport pathways to the subtropical north Atlantic free troposphere using paired H2O-delta D in situ measurements. Atmos. Chem. Phys. 2016, 16, 4251–4269. [Google Scholar] [CrossRef]
  45. Takahashi, A.; Hiyama, T.; Nishikawa, M.; Fujinami, H.; Higuchi, A.; Li, W.; Liu, W.; Fukushima, Y. Diurnal variation of water vapor mixing between the atmospheric boundary layer and free atmosphere over Changwu, the loess plateau in China. Sola 2008, 4, 33–36. [Google Scholar] [CrossRef]
  46. Turner, D.D.; Wulfmeyer, V.; Berg, L.K.; Schween, J.H. Water vapor turbulence profiles in stationary continental convective mixed layers. J. Geophys. Res. Atmos. 2014, 119, 11151–11165. [Google Scholar] [CrossRef]
  47. Berkes, F.; Hoor, P.; Bozem, H.; Kunkel, D.; Sprenger, M.; Henne, S. Airborne observation of mixing across the entrainment zone during parade 2011. Atmos. Chem. Phys. 2016, 16, 6011–6025. [Google Scholar] [CrossRef]
  48. Vogelezang, D.H.P.; Holtslag, A.A.M. Evaluation and model impacts of alternative boundary-layer height formulations. Bound. Layer Meteorol. 1996, 81, 245–269. [Google Scholar] [CrossRef]
  49. Seibert, P.; Beyrich, F.; Gryning, S.E.; Joffre, S.; Rasmussen, A.; Tercier, P. Review and intercomparison of operational methods for the determination of the mixing height. Atmos. Environ. 2000, 34, 1001–1027. [Google Scholar] [CrossRef]
  50. Schneider, J.; Eixmann, R. Three years of routine Raman lidar measurements of tropospheric aerosols: Backscattering, extinction and residual layer height. Atmos. Chem. Phys. 2002, 2, 313–323. [Google Scholar] [CrossRef]
  51. Stevens, B. On the growth of layers of nonprecipitating cumulus convection. J. Atmos. Sci. 2007, 64, 2916–2931. [Google Scholar] [CrossRef]
  52. Malinowski, S.P.; Haman, K.E.; Kopec, M.K.; Kumala, W.; Gerber, H. Small-scale turbulent mixing at stratocumulus top observed by means of high resolution airborne temperature and lwc measurements. J. Phys. Conf. Ser. 2011, 318, 072013. [Google Scholar] [CrossRef]
  53. Parrish, D.D.; Trainer, M.; Holloway, J.S.; Yee, J.E.; Warshawsky, M.S.; Fehsenfeld, F.C.; Forbes, G.L.; Moody, J.L. Relationships between ozone and carbon monoxide at surface sites in the north atlantic region. J. Geophys. Res. Atmos. 1998, 103, 13357–13376. [Google Scholar] [CrossRef]
  54. Trainer, M.; Parrish, D.D.; Buhr, M.P.; Norton, R.B.; Fehsenfeld, F.C.; Anlauf, K.G.; Bottenheim, J.W.; Tang, Y.Z.; Wiebe, H.A.; Roberts, J.M.; et al. Correlation of ozone with NOy in photochemically aged air. J. Geophys. Res. Atmos. 1993, 98, 2917–2925. [Google Scholar] [CrossRef]
  55. Neuman, J.A.; Trainer, M.; Aikin, K.C.; Angevine, W.M.; Brioude, J.; Brown, S.S.; de Gouw, J.A.; Dube, W.P.; Flynn, J.H.; Graus, M.; et al. Observations of ozone transport from the free troposphere to the Los Angeles basin. J. Geophys. Res. Atmos. 2012, 117, 214–221. [Google Scholar] [CrossRef]
  56. Jia, S.; Xu, X.; Lin, W.; Wang, Y.; He, X.; Zhang, H. Increased mixing ratio of surface ozone by nighttime convection process over the north china plain. J. Appl. Meteor. Sci. 2015, 26, 280–290. [Google Scholar]
  57. Weiss-Penzias, P.; Jaffe, D.A.; Swartzendruber, P.; Dennison, J.B.; Chand, D.; Hafner, W.; Prestbo, E. Observations of Asian air pollution in the free troposphere at mount bachelor observatory during the spring of 2004. J. Geophys. Res. Atmos. 2006, 111, D10304. [Google Scholar] [CrossRef]
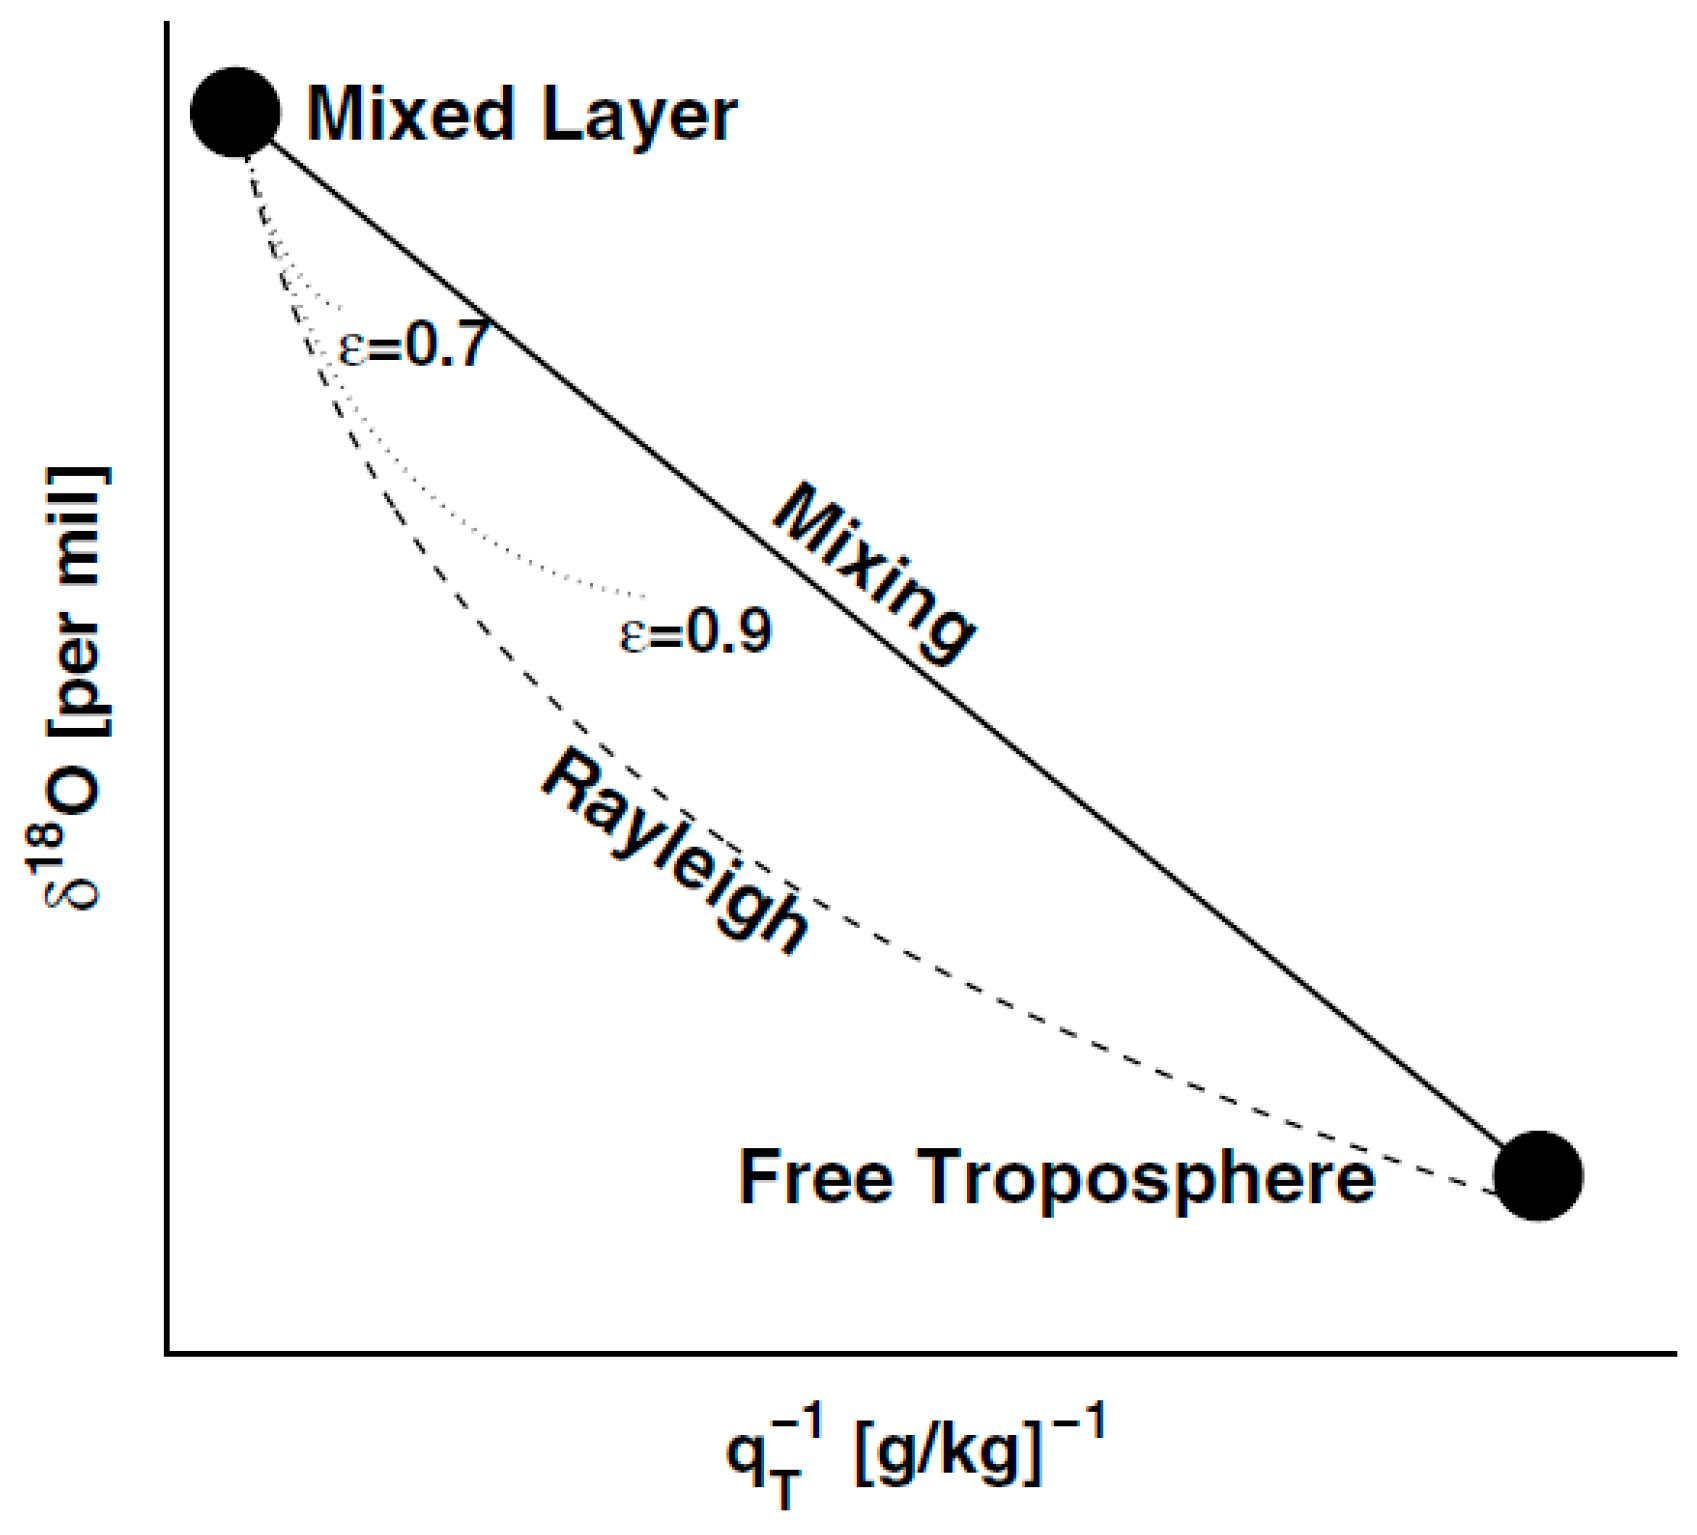
Figure 1. An isotopic mixing diagram of δ 18 O versus the inverse of the total water mixing ratio (qT−1) [34].
Atmosphere 09 00460 g001
Figure 2. Scatter diagram of O3 and CO2 07:27UTC [47].
Atmosphere 09 00460 g002
Figure 3. Scatter diagram of O3 and CO2 11:42UTC [47].
Atmosphere 09 00460 g003