1. Introduction
Over the last several decades, dangerous weather events such as severe rain, heavy snow, drought, and heat wave caused by climate change have been concentrated over densely populated urban and industrial areas. In particular, in Korea, localized torrential rainfall has caused flash floods and mountain landslides, sometimes resulting in heavy casualties and property loss [
1]. To prevent such substantial damage, it is important to predict heavy rainfall over densely populated and industrial areas within a short time range.
In this study, the forecasting is focused on the local atmospheric circulation over the complex megacities in Korea. The 1-km resolution forecasting model has a highly resolved model configuration, and its forecasting skills are sensitive to the input data and configuration. Thus, such information plays an important role in improving the skills of the forecasting model for local atmospheric circulation. Sensitivity analyses of model performances have traditionally focused on model physics, initial conditions, and sea surface temperature (SST). The analyses associated with outer domain size and lead time are rarely considered. The objective of this study is thus to investigate the ability of a forecasting model, representing complex megacities and large urban areas, for heavy rainfall events by examining the effects of model configuration and various input data sources, such as outer domain size, sea surface temperature, initial conditions, and lead-time effect. Although this study does not attempt to reach conclusions for the optimal configuration for all heavy rainfall events, as a pilot study, it identifies the weaknesses and strengths of various model configurations, and provides insight into high resolution model configuration for multi-hazard impact-based forecasting and warning services.
Three-dimensional primitive-equation atmosphere circulation models, such as the Weather Research and Forecasting (WRF) model [
2], the Global/Regional Integrated Model System (GRIMs) [
3], and others, have been utilized to forecast precipitation events. In addition, high-resolution numerical simulations of local atmospheric flow in regions that include urban areas have begun to provide credible representations of the three-dimensional local atmospheric circulation on horizontal scales of several kilometers [
4,
5,
6,
7]. For this study, the WRF model developed at the National Center of Atmospheric Research (NCAR) is utilized. The numerical model has been used for high-resolution configurations to resolve and understand the meteorological challenges faced by complex megacities and large urban areas, which include buildings of various heights, paved streets, and parks [
8].
In atmospheric research, there have been few studies on the predictability of heavy rainfall in terms of uncertainties associated with domain size and lead time in high resolution models. Wang et al. [
9] examined the sensitivity of heavy precipitation to horizontal resolution, domain size, and rain rate assimilation for case studies using a convection-permitting model. Dravitzki and McGregor [
10] investigated heavy rainfall events over the Waikato River Basin of New Zealand generated with higher-resolution WRF, and Goswami et al. [
11,
12] showed that domain size is as important as grid spacing and initial conditions for heavy rainfall events. Additionally, Li et al. [
13] analyzed the influence of horizontal resolution, domain size, and physical parameterization schemes to evaluate an optimized WRF precipitation forecast over a region of complex topography during the flood season. The research-grade and storm-scaled operational Numerical Weather Prediction (NWP) models of the Korea Meteorology Administration (KMA) regularly produce simulations with a horizontal grid spacing as fine as 1 km over the megacity of Seoul and its surrounding cities, and have been used to obtain new insights to develop a high-resolution model configuration based on WRF [
14,
15].
This paper is organized as follows.
Section 2 provides a summary of the default model configuration and the meteorological aspects of a heavy precipitation event and also evaluates the numerical results by comparing with observations.
Section 3 describes the design of the sensitivity experiments, documents their results, and provides an overall discussion. Finally, a summary and concluding remarks are provided in
Section 4.
3. Sensitivity Results
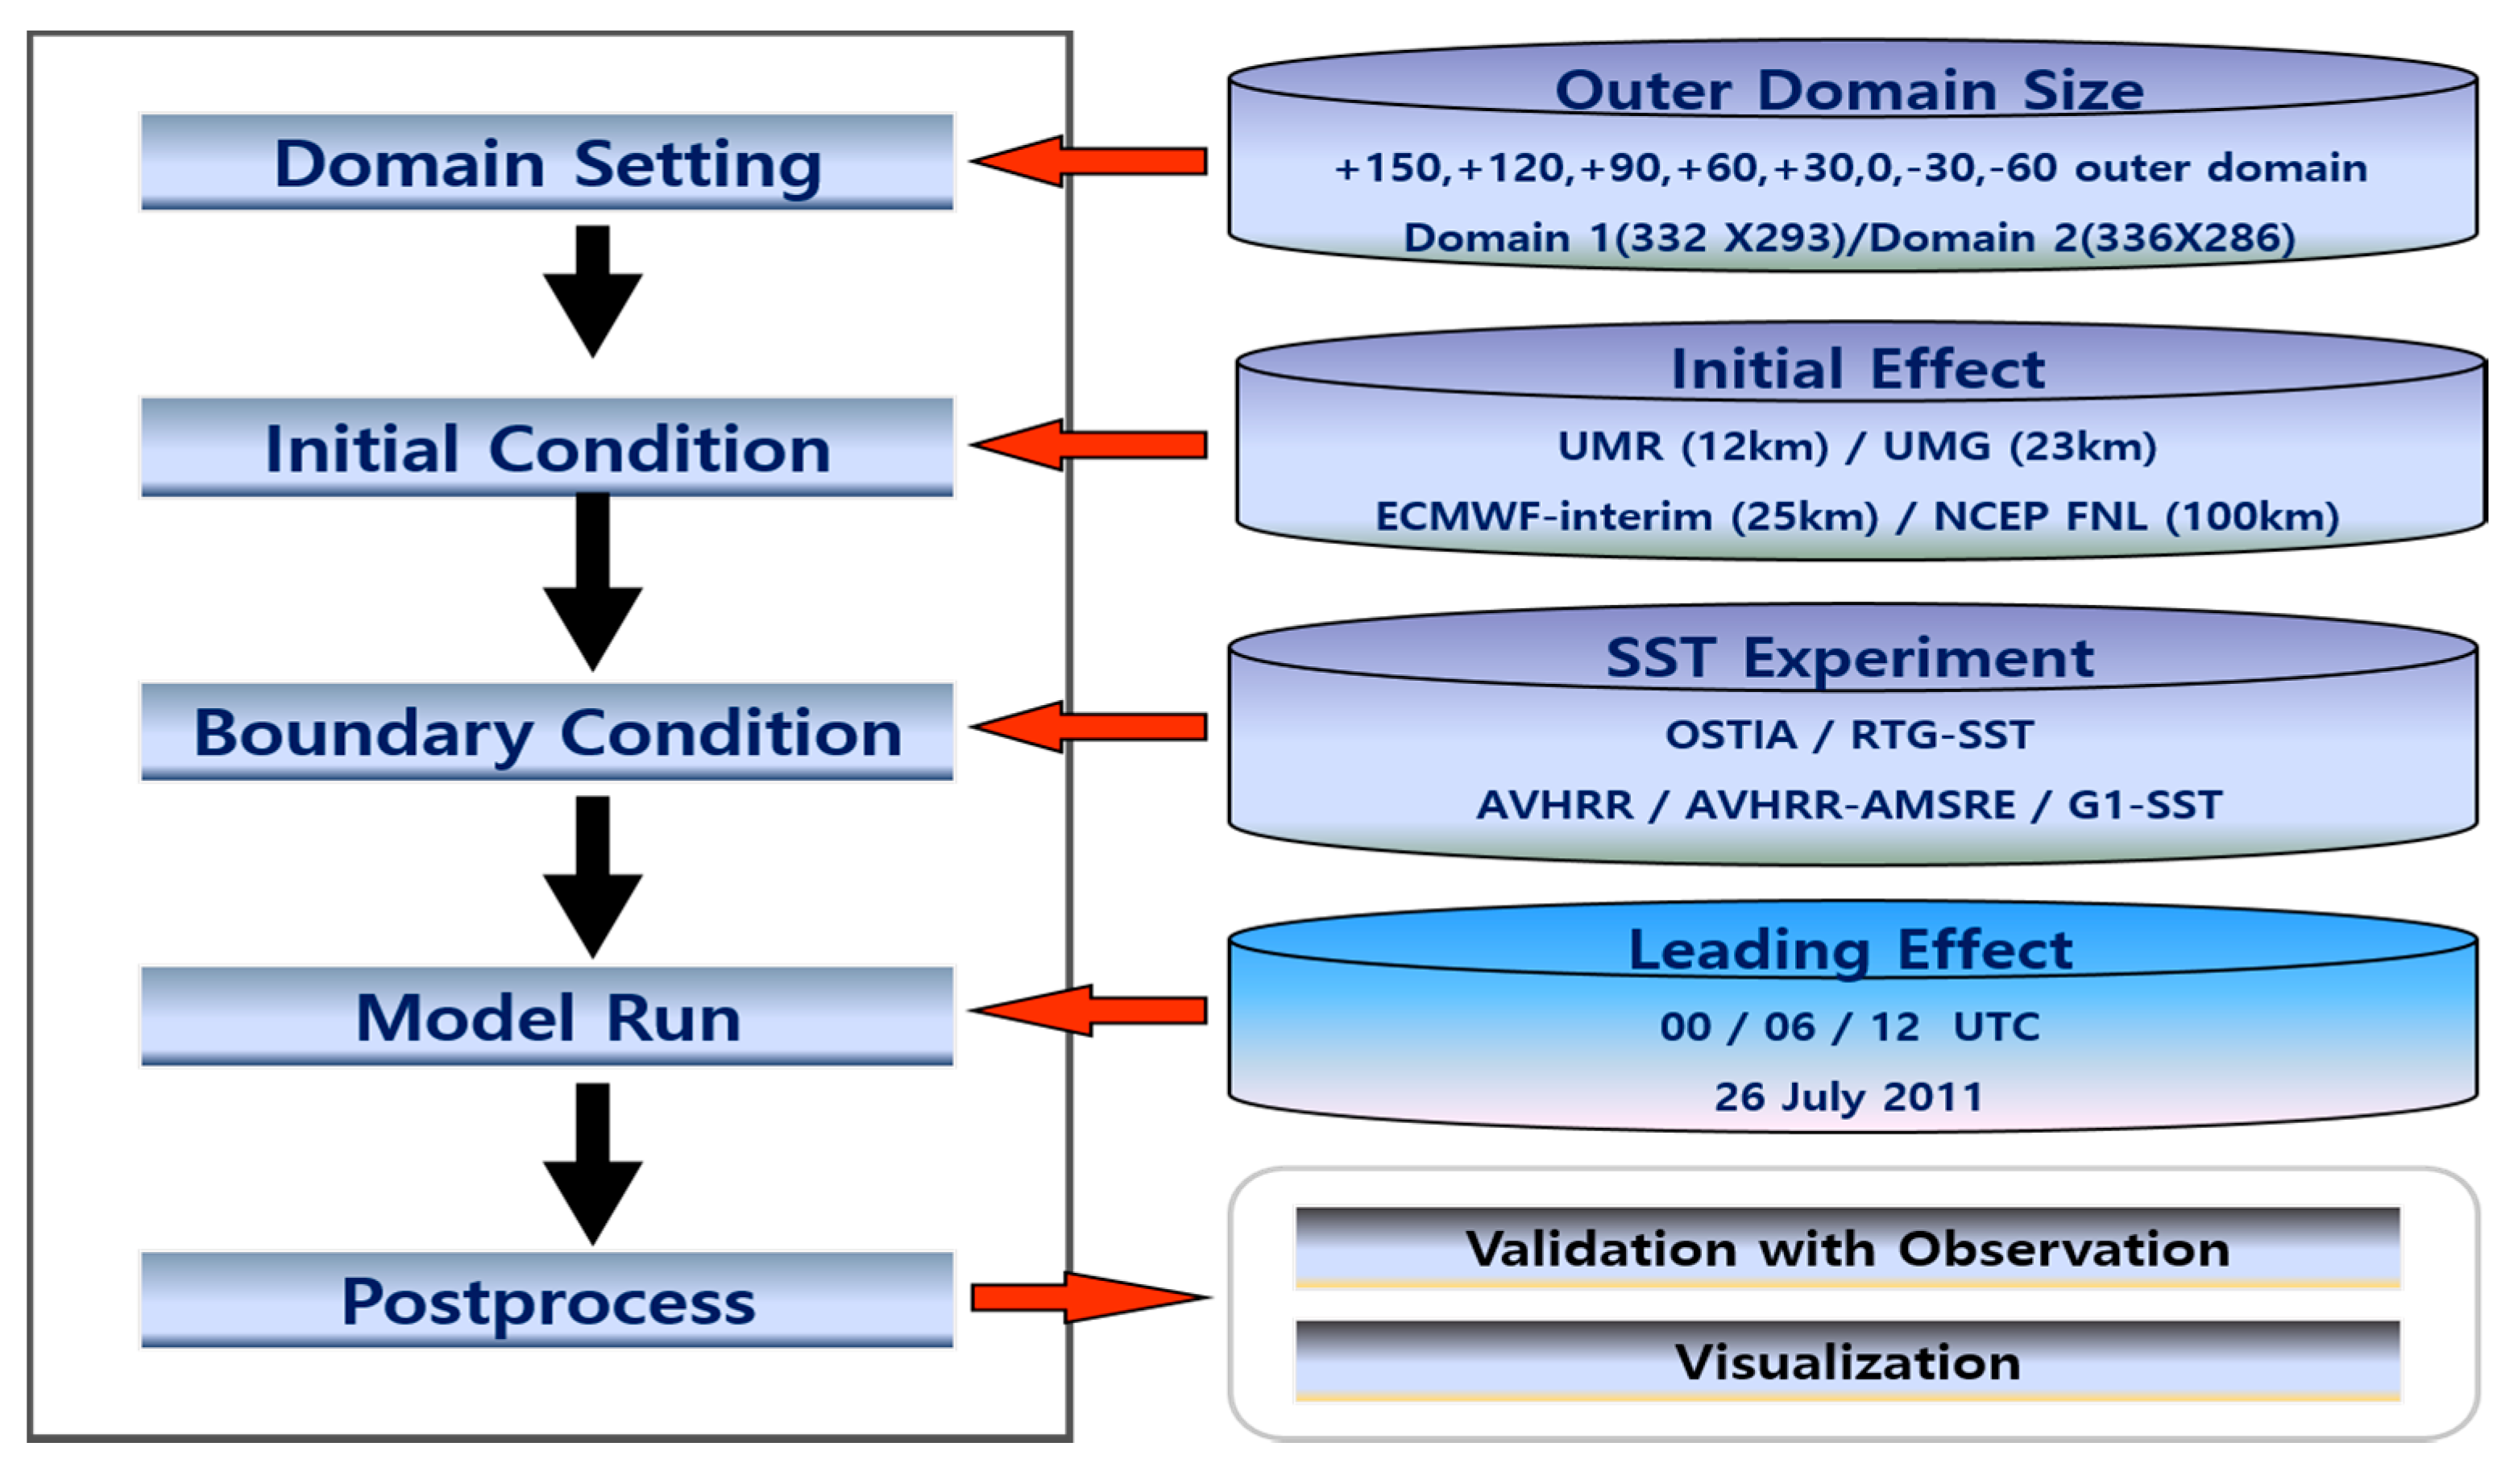
In the previously configured WRF system, there are model configuration and data incorporation processes that influence the model performance, such as outer domain size, sea surface temperature data, initial conditions, and lead time effect (
Figure 6). In the present study, a series of sensitivity tests were performed by changing the model configuration and input data source.
Table 2 summarizes all the experiments performed, and each sensitivity experiment consists of various simulations that have model inputs or configurations different from those of the default model. Note that lead times of 18, 12, and 6 h mean that the model starts at 18, 12, and 6 h before 18 UTC 26 July 2011, which are 00 UTC, 6 UTC, and 12 UTC on 26 July 2011, respectively. See a more detailed explanation of each experiment in the following subsection.
3.1. Impact of Domain Size
There is no “rule of thumb” for configuring a domain for WRF, and nesting options with ratios (inner to outer domain) of 3, 4, and 5 are available. This study employed a ratio of 5 so that the inner and outer domains had resolutions of 1 and 5 km, respectively. As mentioned previously, such a resolution was chosen because the KLAPS is operated by the KMA for a very short-range high-resolution numerical prediction with 15-km resolution for the outer domain and 5-km data-assimilated nested inner domain. In addition, a smoother transition from the outer domain to the inner domain is important to prevent numerical instabilities around the borders as well as propagation of numerical artifacts into the center of the domain. Therefore, the model configuration for the inner domain was retained for all simulations, opting for an ample buffer zone of five grid points and an exponential transition at the border.
Previous studies showed that different domains might be required for different sub-regions within the model domain to produce mean precipitation close to observations over the study region [
9,
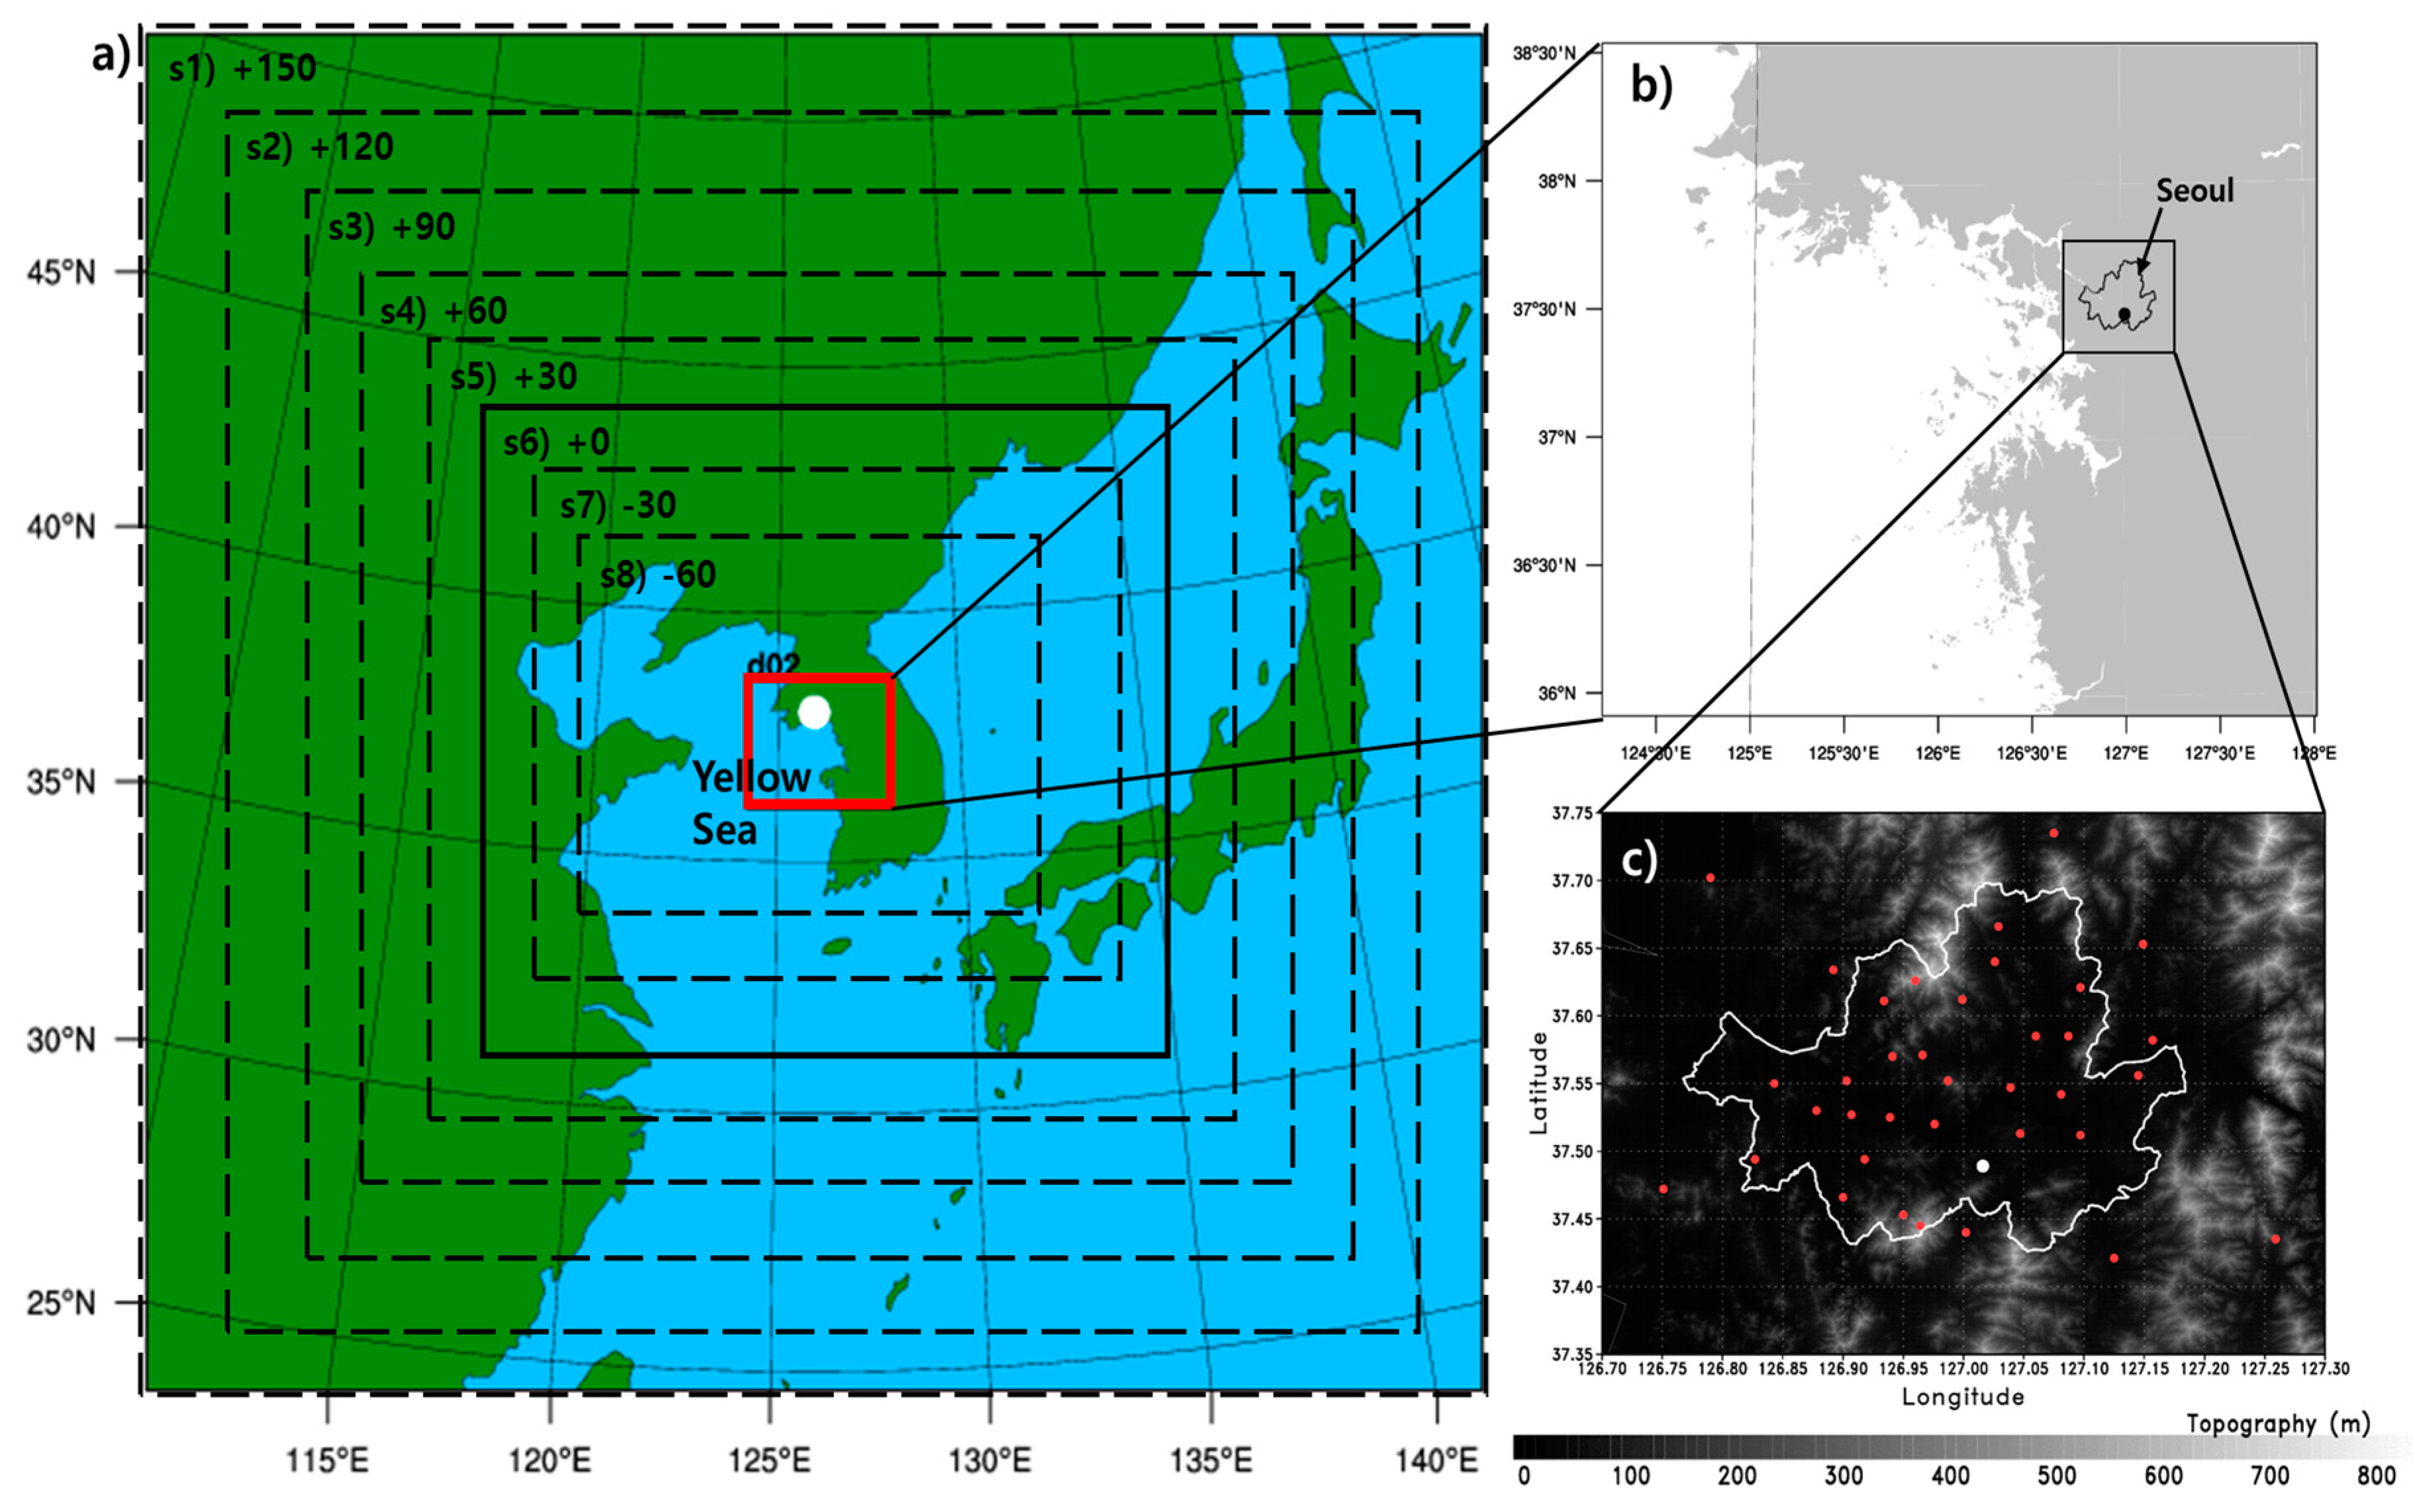
26]. To evaluate the effects of such transitions on precipitation forecasting for the inner domain, the size of the outer domain was increased or decreased such that a number of grids from −60 to +150 by increments of +30 was added to the basic configuration of the outer domain for all directions (dashed rectangular boxes from the interior to the exterior in
Figure 1a). A domain size of 0 indicates the default model configuration.
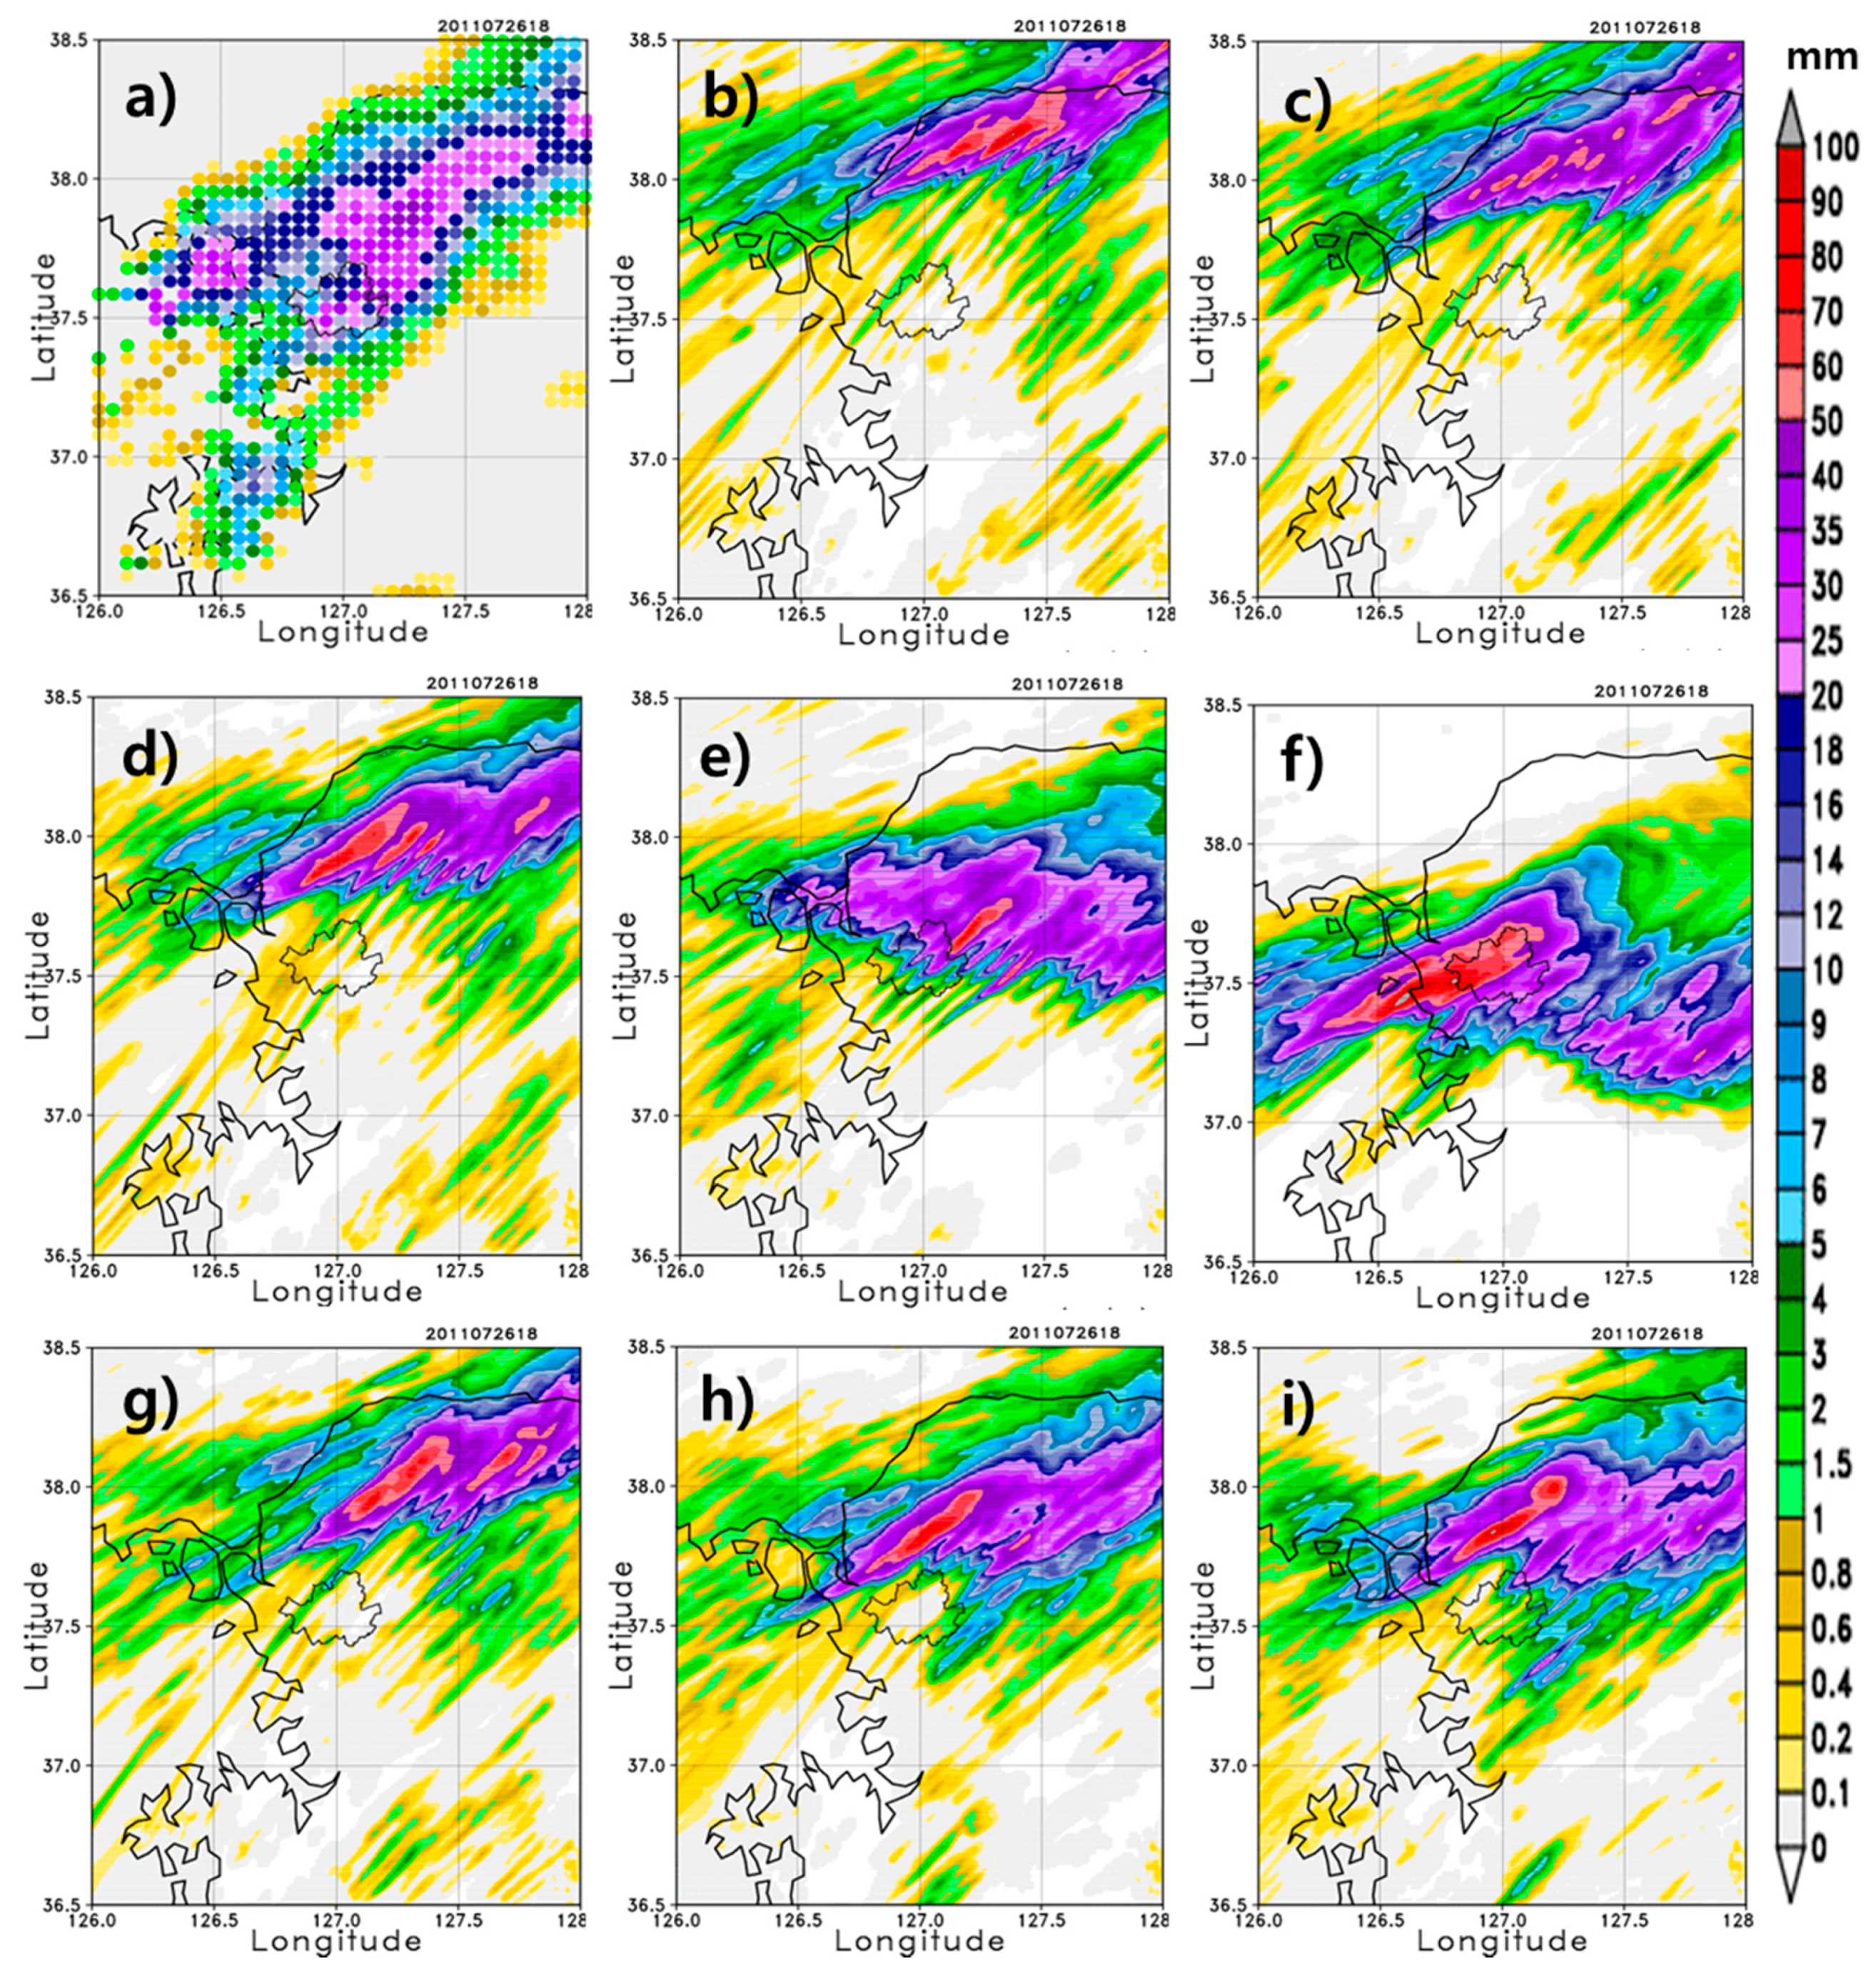
Figure 7 shows the simulation results of the forecasting model over the inner domain for various outer domain sizes. For better comparison, the AWS rainfall analysis field shown in
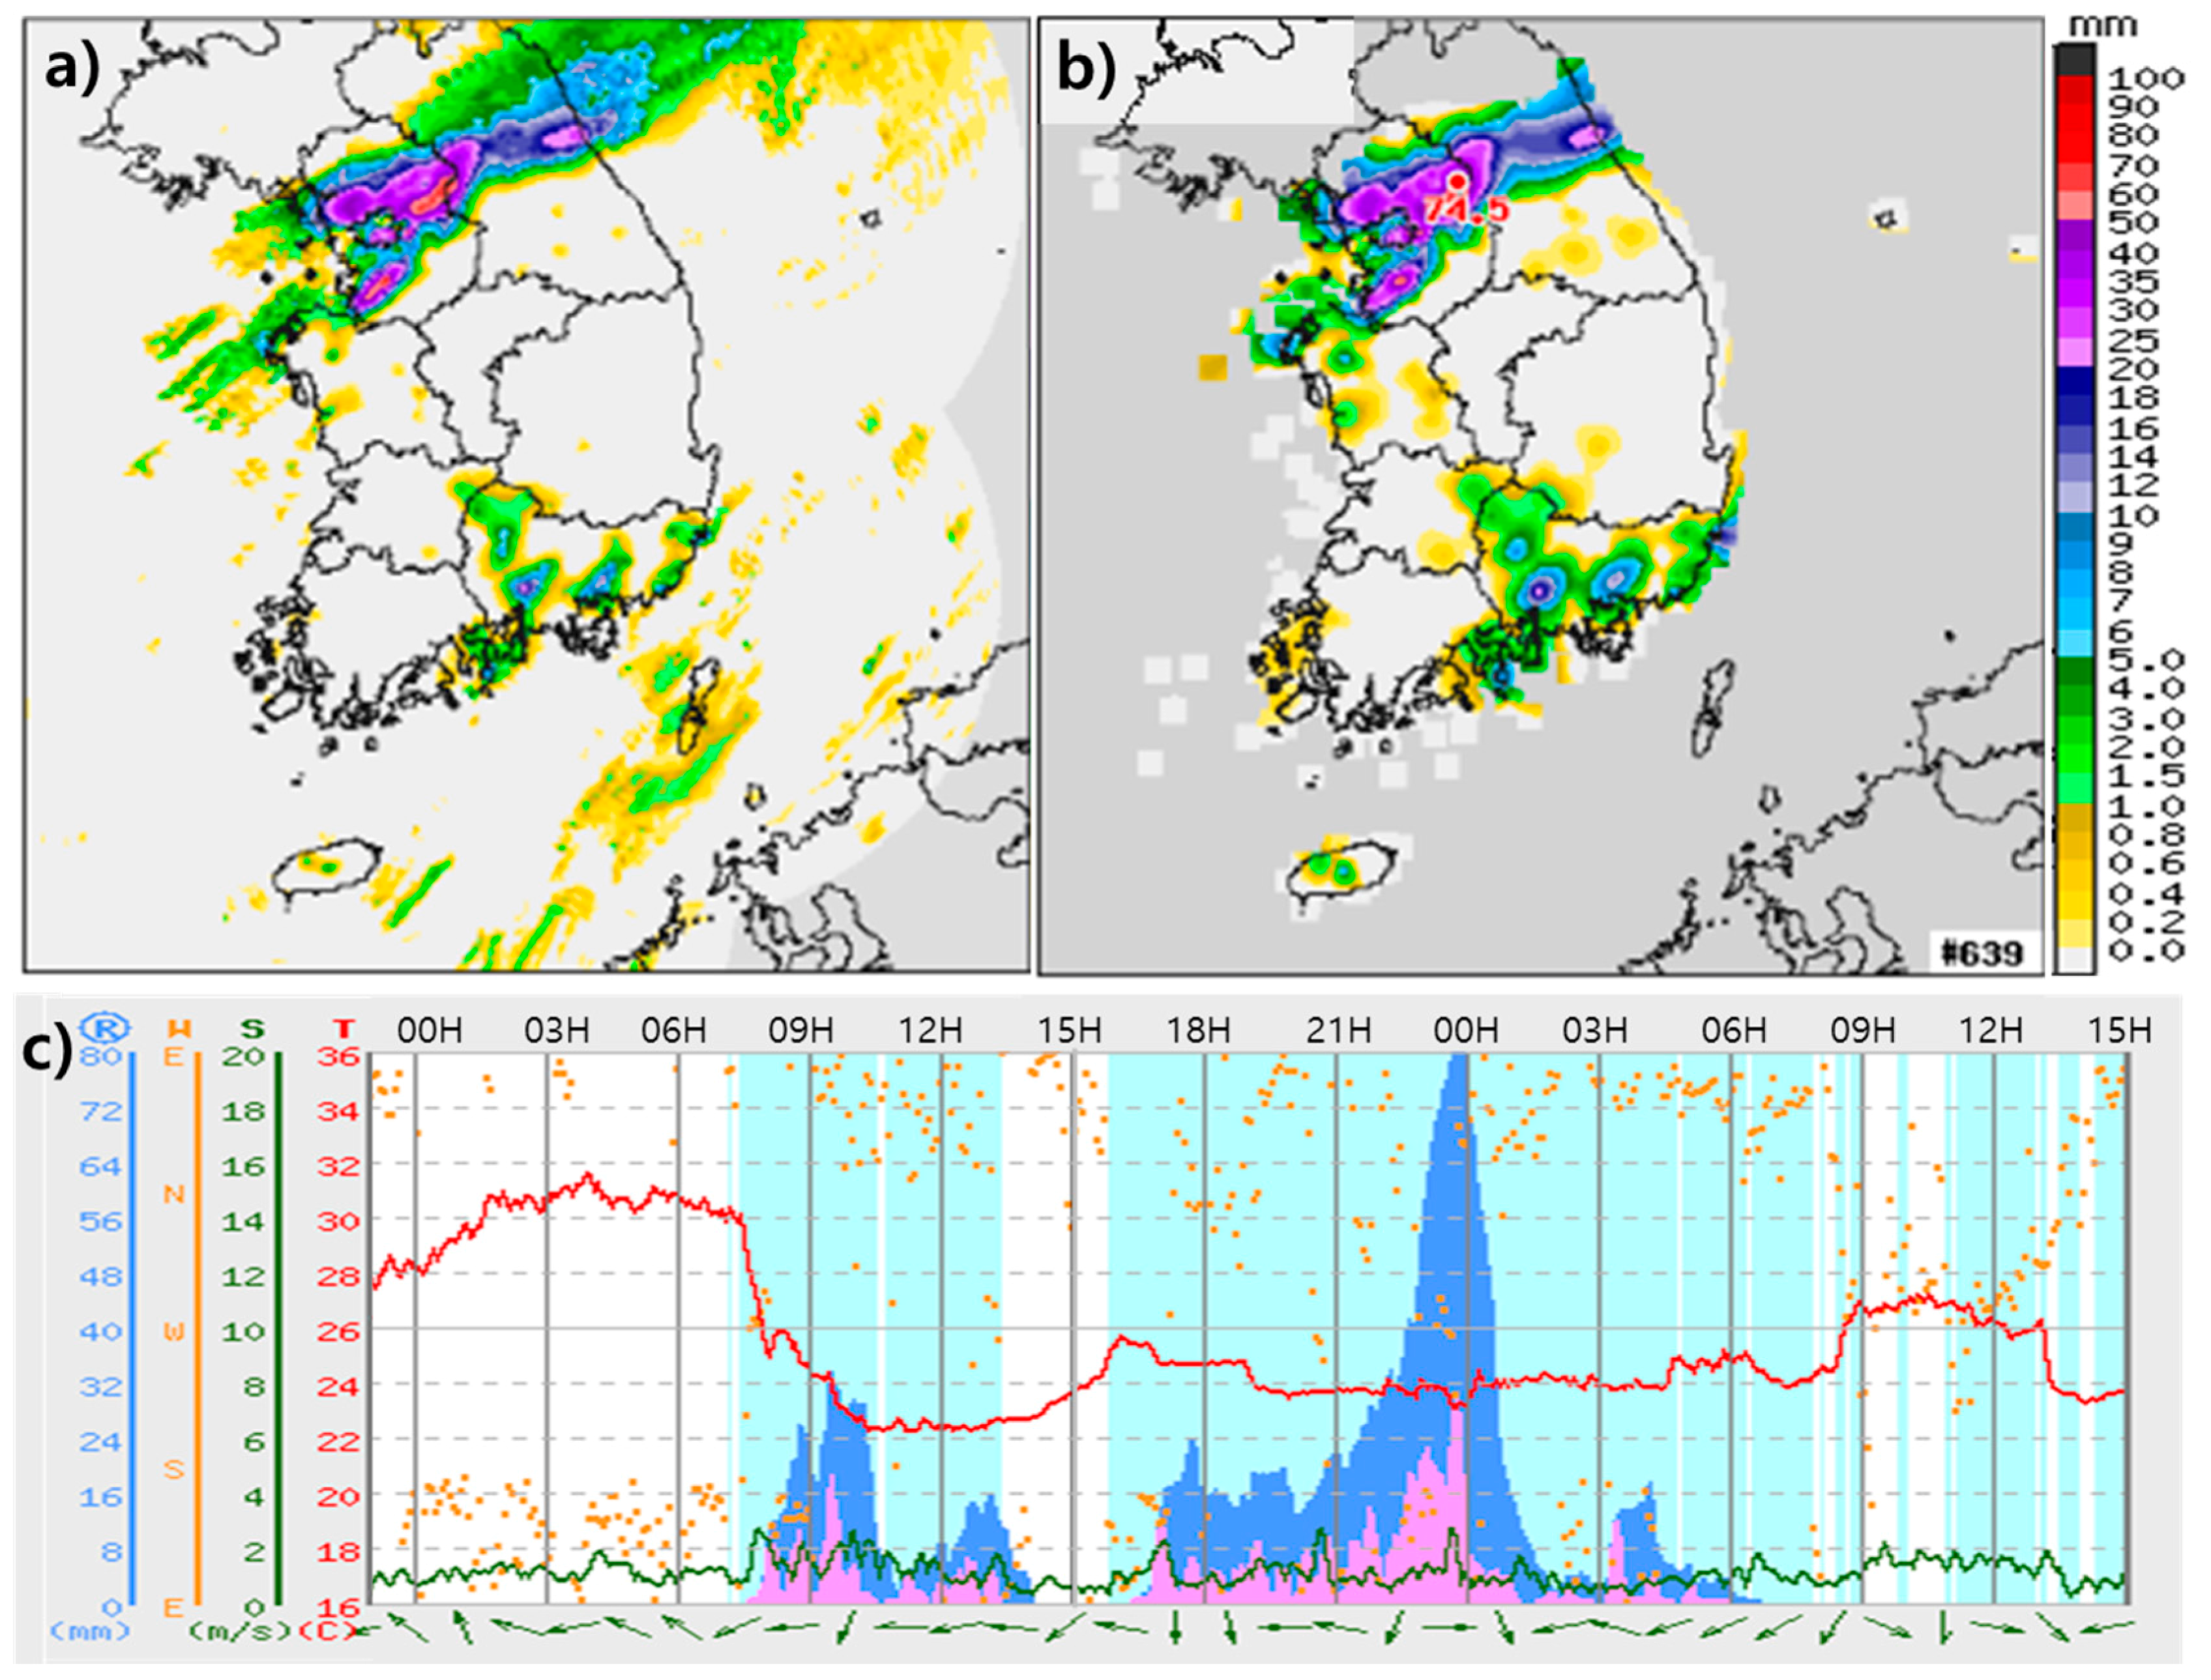
Figure 4a is also shown in
Figure 7, in which the rainband is located over northeast Seoul.
The model results show the effect of the outer domain size on the performance of the inner domain.
Figure 7b–f clearly show that the precipitation range gets progressively wider and the location of the rainfall band moves southward closer to Seoul as the outer domain size is decreased. Subsequent decreases in size result in insignificant changes in the precipitation range and location of the rainband (
Figure 7f–i). When compared with the observation, a smaller outer domain size produces a better performing forecasting model. That is, given the inner domain size for the forecasting model, the model performance is better with smaller outer domain sizes relative to larger outer domain sizes. This occurs partly because under larger outer domains, the northeastward synoptic wind drives the rainfall band over the northeast side of Seoul, and the rainfall core and its rainband are located too far north of the target area. Therefore, the initial/boundary conditions for the inner domain are relatively well represented by those of a smaller outer domain. Additionally, the 2-m temperature shows similar behavior to the precipitation, such that the temperature drop is shown more clearly in the smaller outer domain size than in the default (figure not shown). The second onset of rainfall is also better represented by the smaller domains than the larger domains.
3.2. Sea Surface Temperature
Both the moisture flux convergence and moisture availability over adjacent oceans are important factors in heavy rainfall events [
27,
28]. The Yellow Sea is located on the west coast of the Korean Peninsula, a tide-dominated area with a complex coastal shape and many islands (
Figure 1a). This marginal sea is a well-known shallow sea with an average depth of about 40 m. Rainfall events obtain additional moisture when they travel over the sea and develop heavy rainfall features. In this section, the impact of the Sea Surface Temperature (SST) of the Yellow Sea on the heavy rainfall over inland Korea is evaluated.
Input data for SST from different sources were incorporated to evaluate the performance of the forecasting model. The SST data were obtained from the OSTIA, with approximately 5-km resolution (default option); the Real-Time, Global, Sea Surface Temperature (RTG_SST) analysis, with about 900-m resolution; the Advanced Very-High-Resolution Radiometer (AVHRR), with 1-km resolution; the Advanced Microwave Scanning Radiometer-EOS (AMSR-E) blended with AVHRR (AVHRR+AMSRE); the Global 1 km Sea Surface Temperature (G1-SST), which includes AVHRR, AMSR-E, in situ data from drifting and moored buoys, and other radiometer and satellite images.
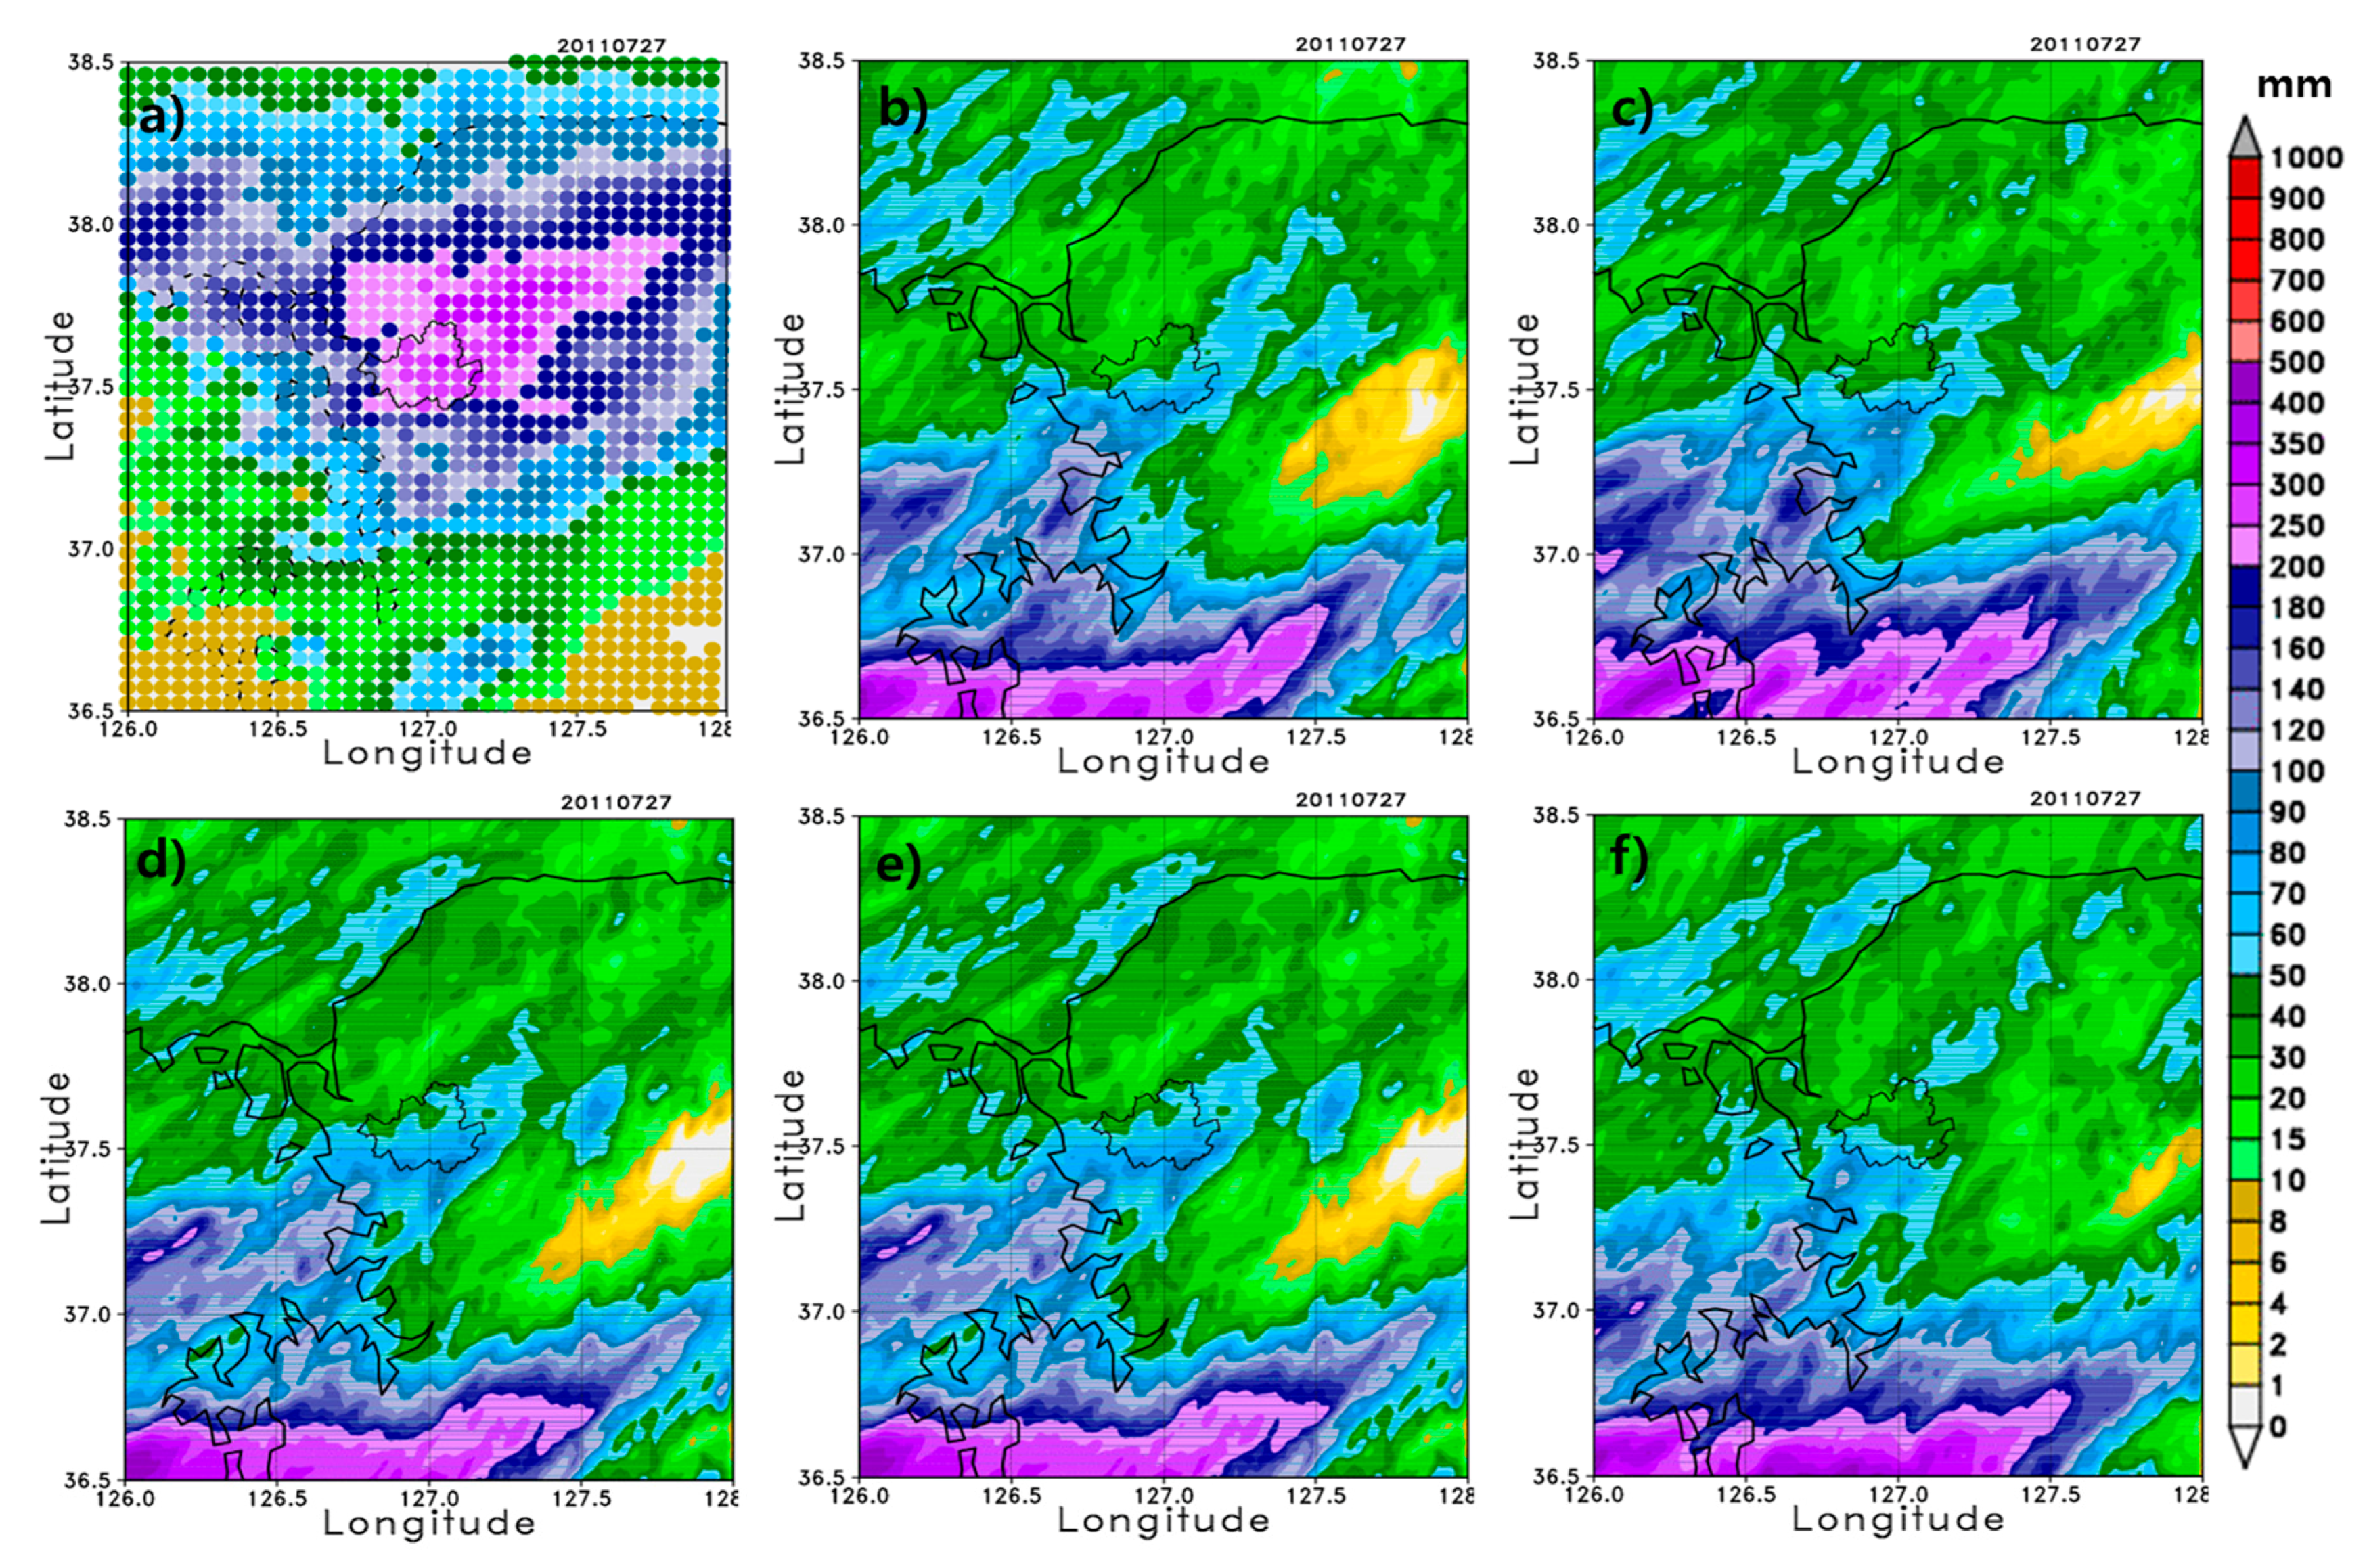
Figure 8 shows the daily accumulated rainfall in the inner domain from 00 UTC 26 July 2011 to 00 UTC 27 July 2011. The spatial patterns of the heavy rainfall cores for all simulations are similar in that the cores are shifted southeastward, but the weak rainfall cores from the default of OSTIA are more widely spread than those from the other SST data. Although spatially different patterns exist among the SST data, the simulation results do not show much difference. This is partly due to the small magnitude in the differences between the SST data. The maximum differences for the precipitation and 2-m temperature time series among simulations are less than 2 mm/h and 1.4 °C, respectively. In this experiment, there is no significant effect on the second onset in any simulation. That is, the detailed analysis of SST and its diurnal cycle may not be needed in the short-range high resolution forecasting model because these vary too slowly to affect the model in this study.
However, it is worth noting that sometimes the initial input of SST plays a key role in other severe weather, especially in the case of important precipitation events, which are dependent on evaporation. Previously, Manda et al. [
27] showed the impacts of the Yellow Sea on torrential rainfall organized under the Asian Summer Monsoon and found that heavy rainfall will increase significantly under the projected warming of the marginal sea and overlying atmosphere.
3.3. Initial Conditions
Higher resolution forecast models generally have greater sensitivity and dependency on initial conditions than coarser resolution models [
28]. In this experiment, various initial conditions for the 5-km outer domain were simulated to evaluate their effects on the precipitation forecasting performance of the forecasting model. As indicated previously, the initial and boundary conditions were obtained as a default simulation by spatial interpolation of the 12-km UM regional model forecast (UMR) field of 70 vertical layers, which is assimilated from KMA data, such as radar, AWS, satellite, and profile data. For other sensitivity simulations, various initial conditions were used for meteorological variables that were initialized from the UM Global Prediction Model (UMG) at 23-km resolution with 70 vertical layers, the ECMWF Interim Reanalysis (ERA-interim) at 25-km resolution (interpolated from 0.75 degrees resolution) with 60 vertical layers, and the NCEP-FNL at 100-km resolution with 27 vertical layers. Time-varying lateral boundary conditions were provided every 1 h for UMR, every 3 h for UMG, and every 6 h for ERA-interim and NCEP-FNL.
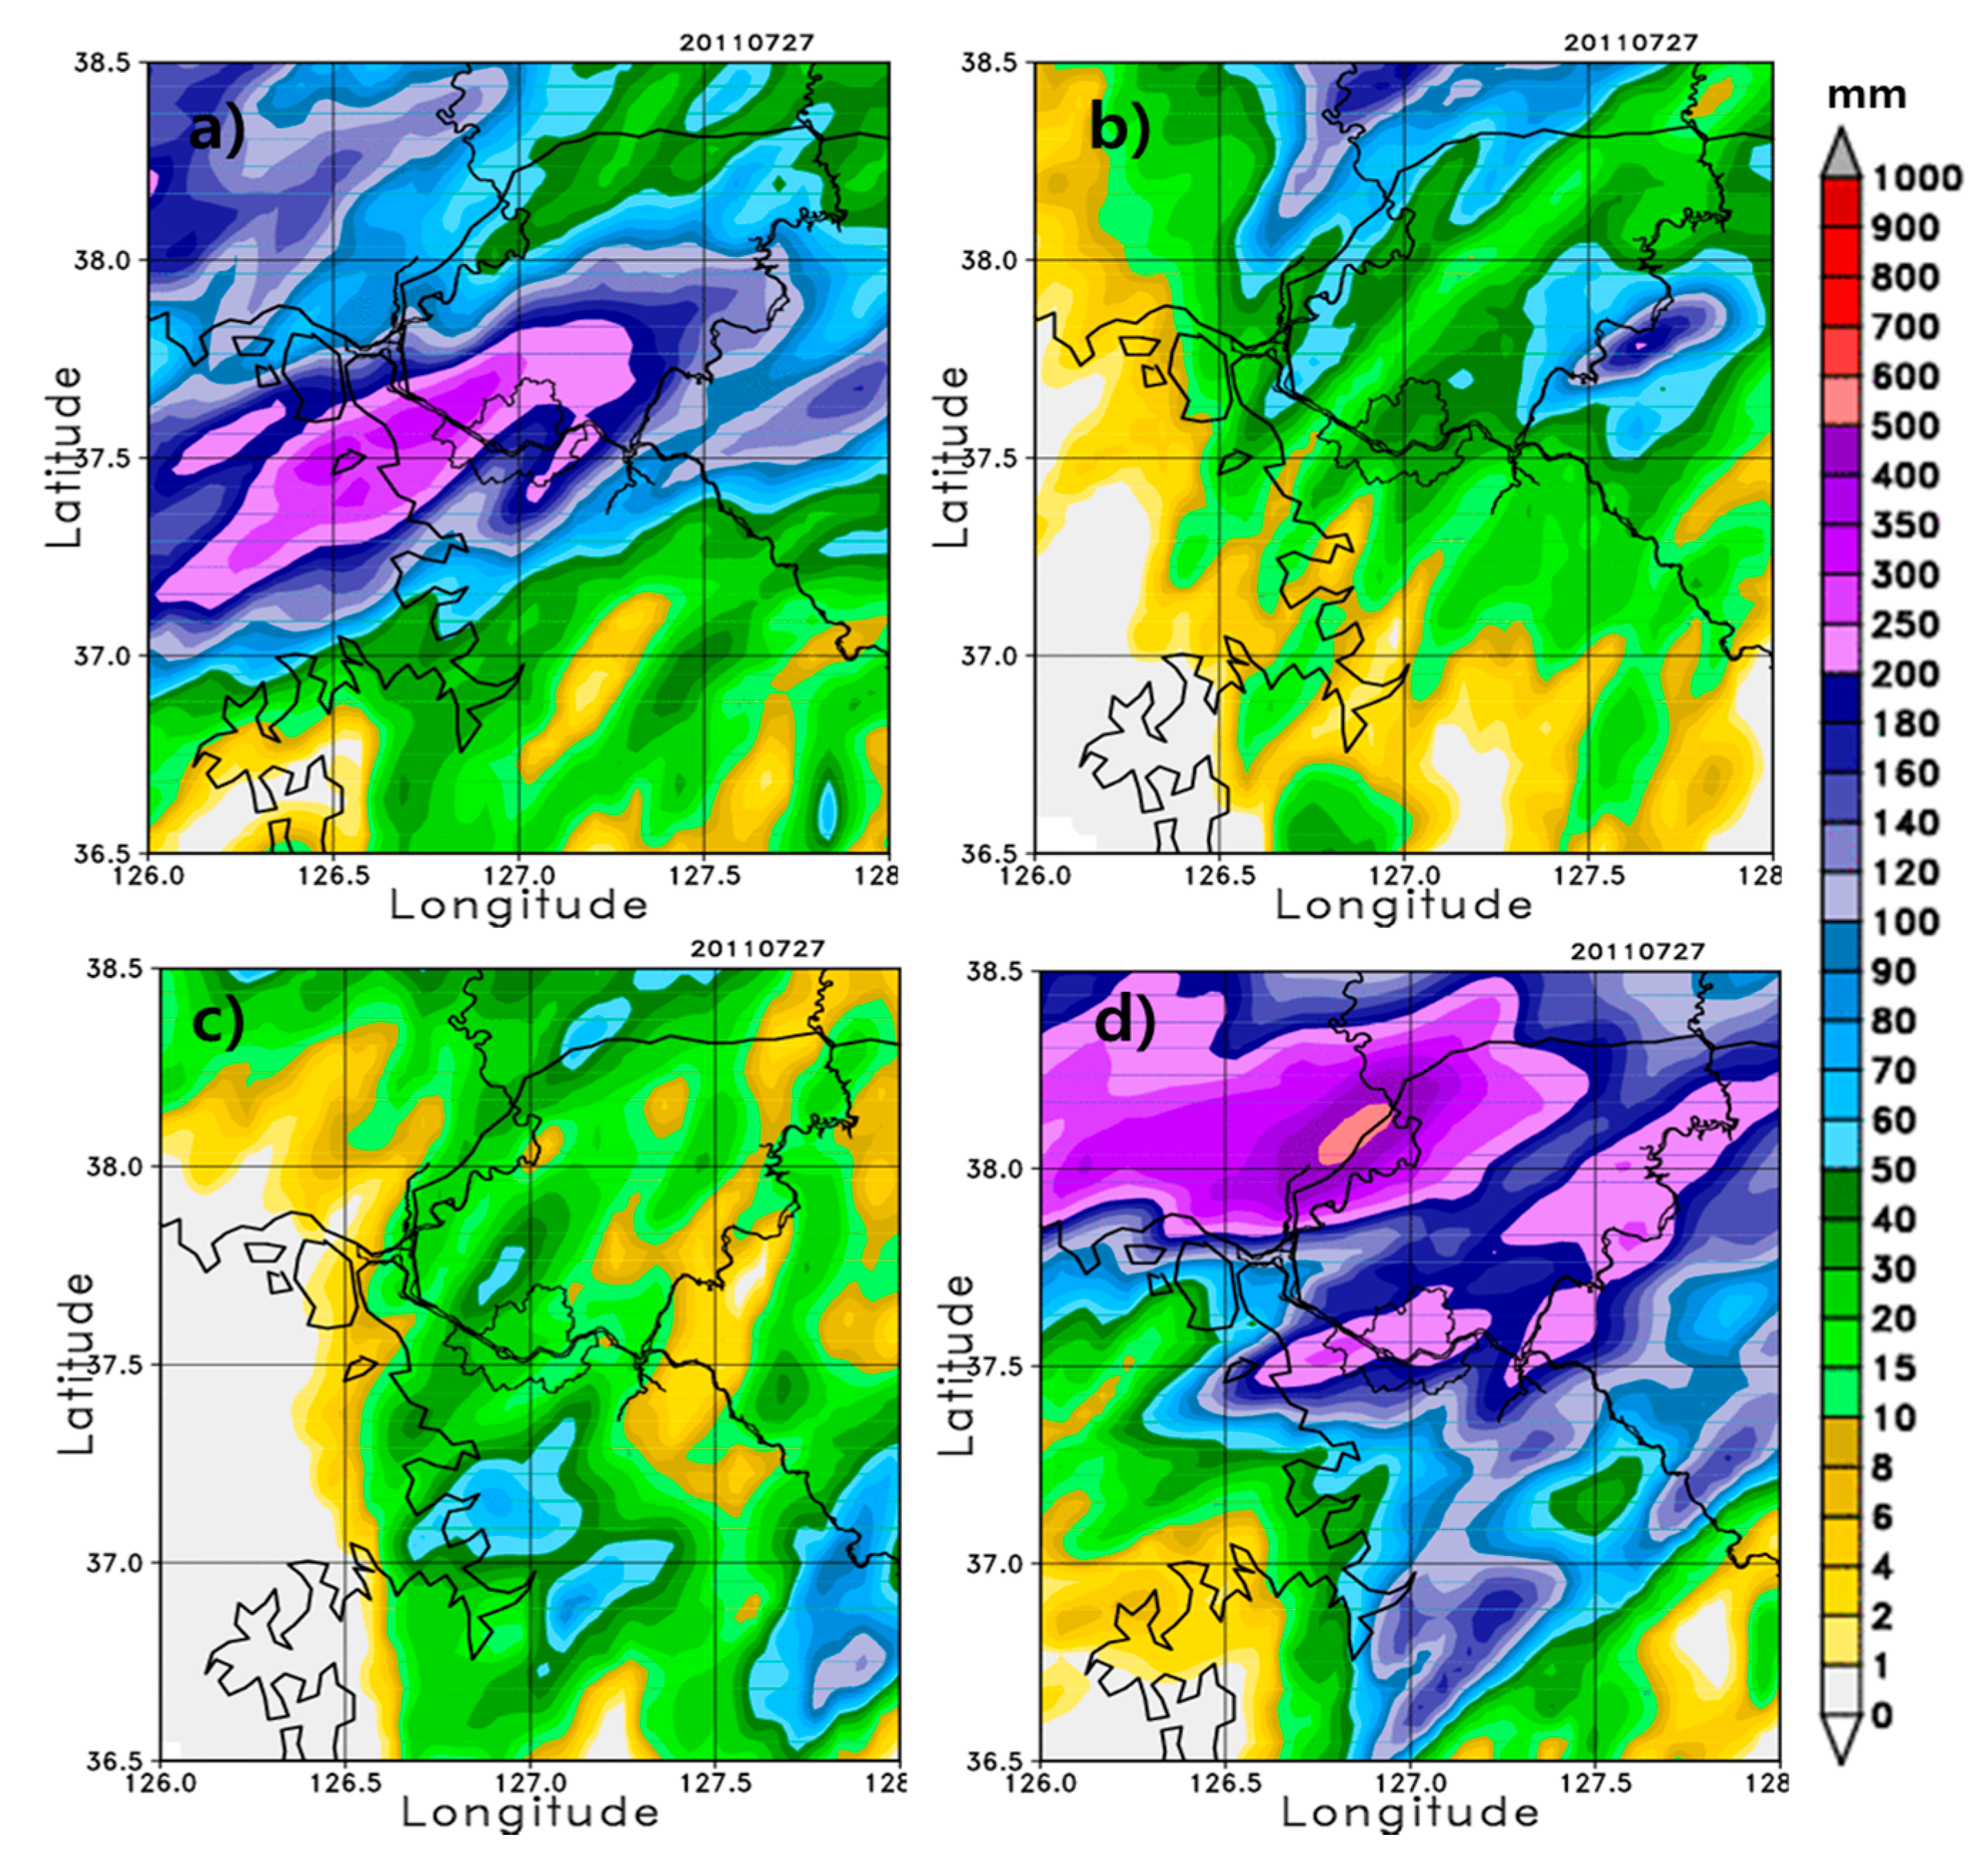
Figure 9 shows the daily accumulated rainfall model results for all simulations. The maximum rainfall for UMR and NCEP-FNL are similar to the observation in
Figure 7a, but the rainband locations are skewed southwest in UMR, and northwest in NCEP-FNL. For UMG and ECMWF-interim, both results provide relatively poor representation of the rainband location and rainfall amount compared to those for UMR and NCEP-FNL. The initial condition for NCEP-FNL uses the coarser resolution data than the other initial conditions, but the performance of the forecasting model is relatively good in terms of the precipitation amount and rainband location. This suggests that for better convective initiation, better data assimilations directly applied at the regional scale, with the possible inclusion of local observations, are needed. Experimental results suggest that the performance of the high resolution forecasting model is sensitive to the initial conditions regardless of the resolution of the initial conditions. In order to improve the accuracy of precipitation for the forecasting model, the results also imply that ensemble forecasting with various initial conditions could be a good strategy.
3.4. Lead Time Effect
Lead time generally refers to how long the forecasting is simulated by the NWP model, but the lead time here is the latency between the initiation and the target time of 18 UTC 26 July 2011. Previous studies of the lead time effect over Korea, such as the study by Jang and Hong [
24], suggested that both the effects of horizontal resolution and lead time should be considered for forecasting heavy rainfall, but with greater weighting on horizontal resolution because heavy rainfall over Korea is primarily a mesoscale phenomenon. For a 1-km high-resolution model, the systematic behavior of such lead time features has not yet been articulated. However, it seems clear that for forecasting models of resolution <1 km, the lead time becomes very important because the accuracy of precipitation forecasts embedded in the initial conditions decreases. In addition, it is generally accepted that numerical models behave differently with varying model configurations, target regions, or target forecasting times. In particular, the lead time experiments can provide some insights to end-users on the best numerical model performance given a specific forecasting time.
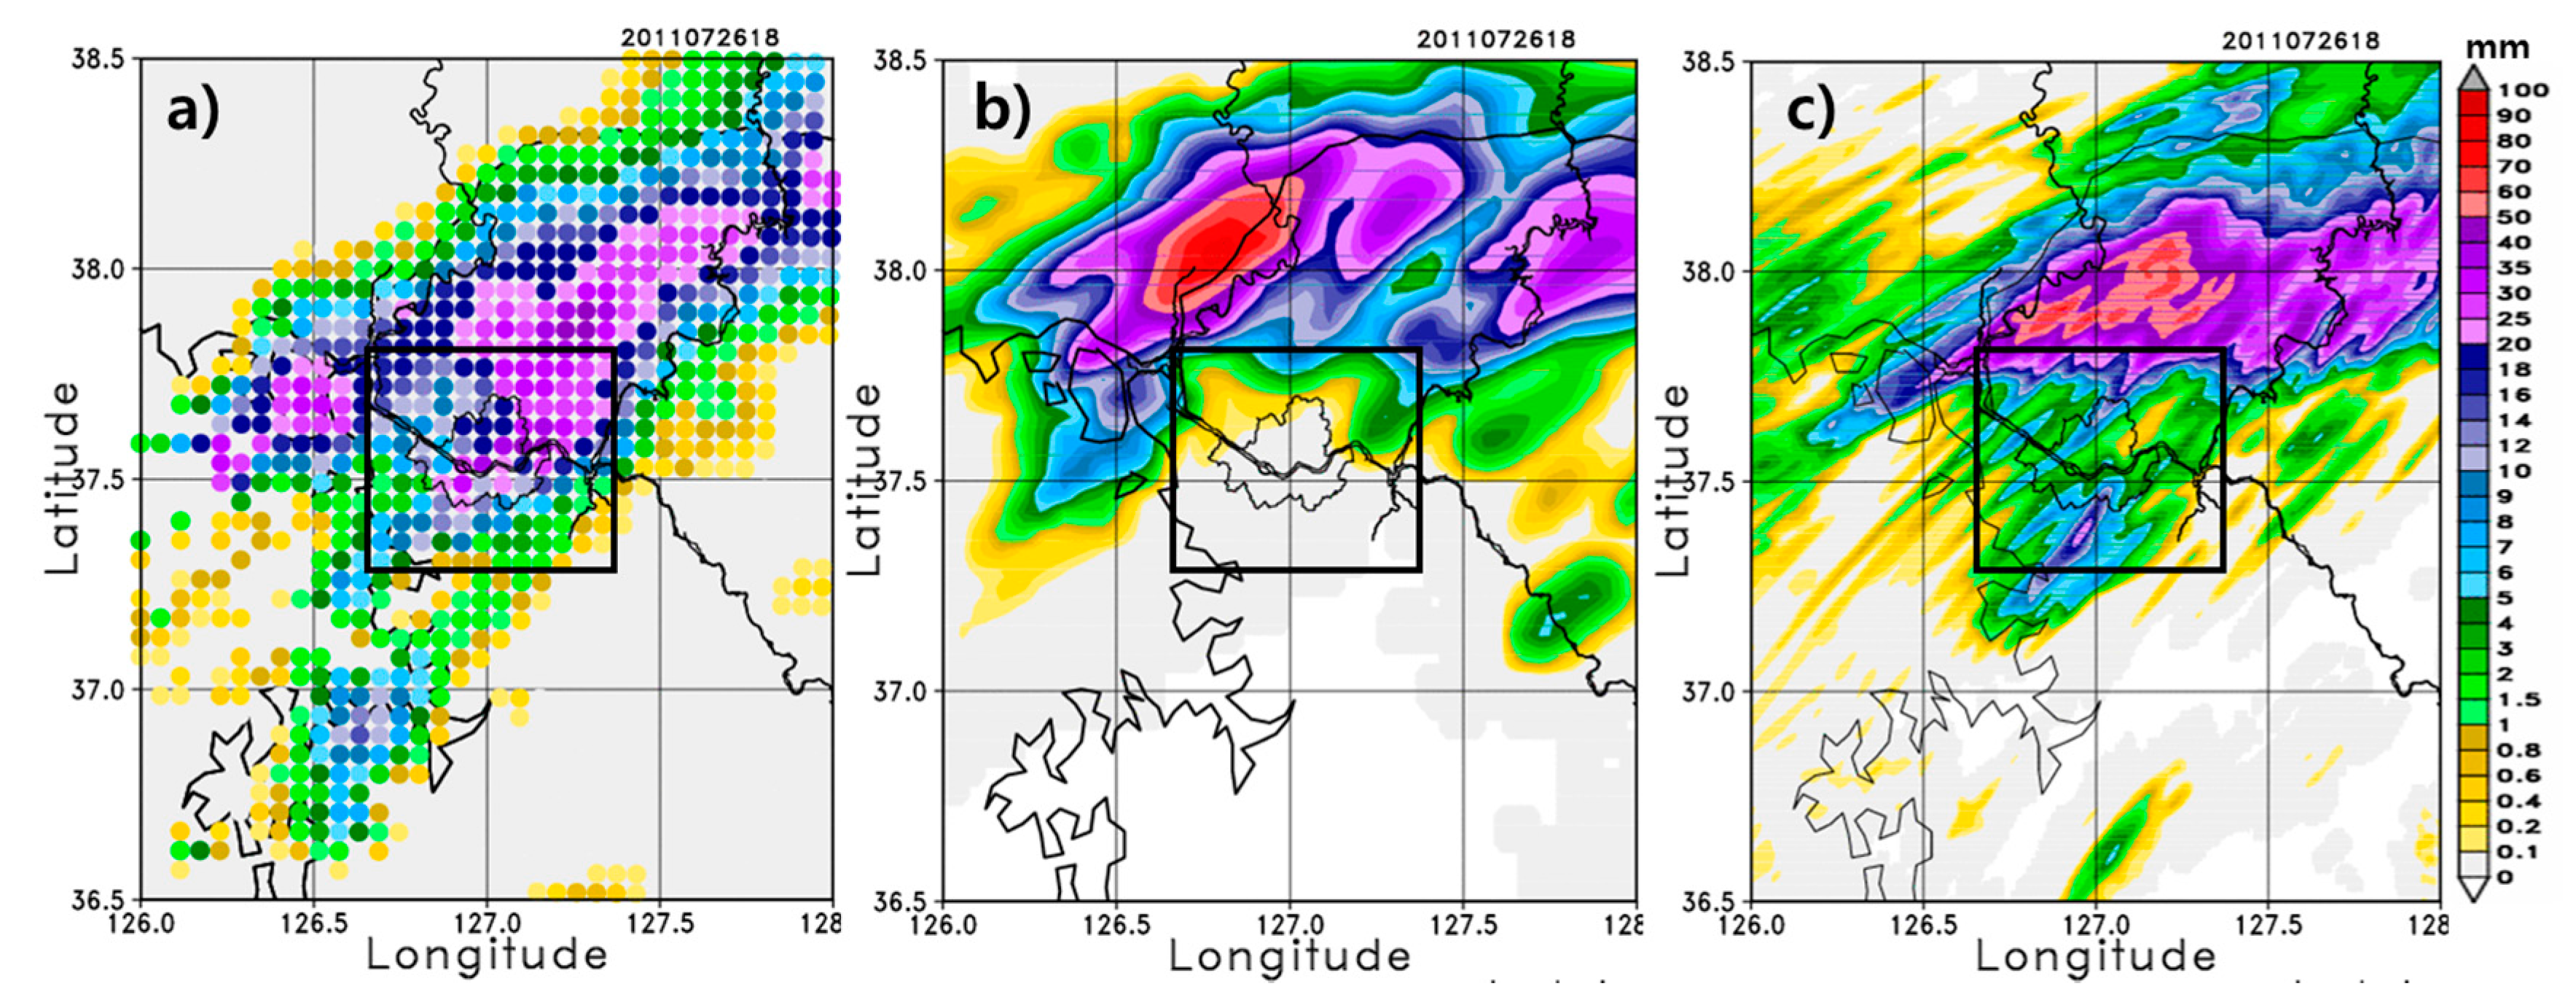
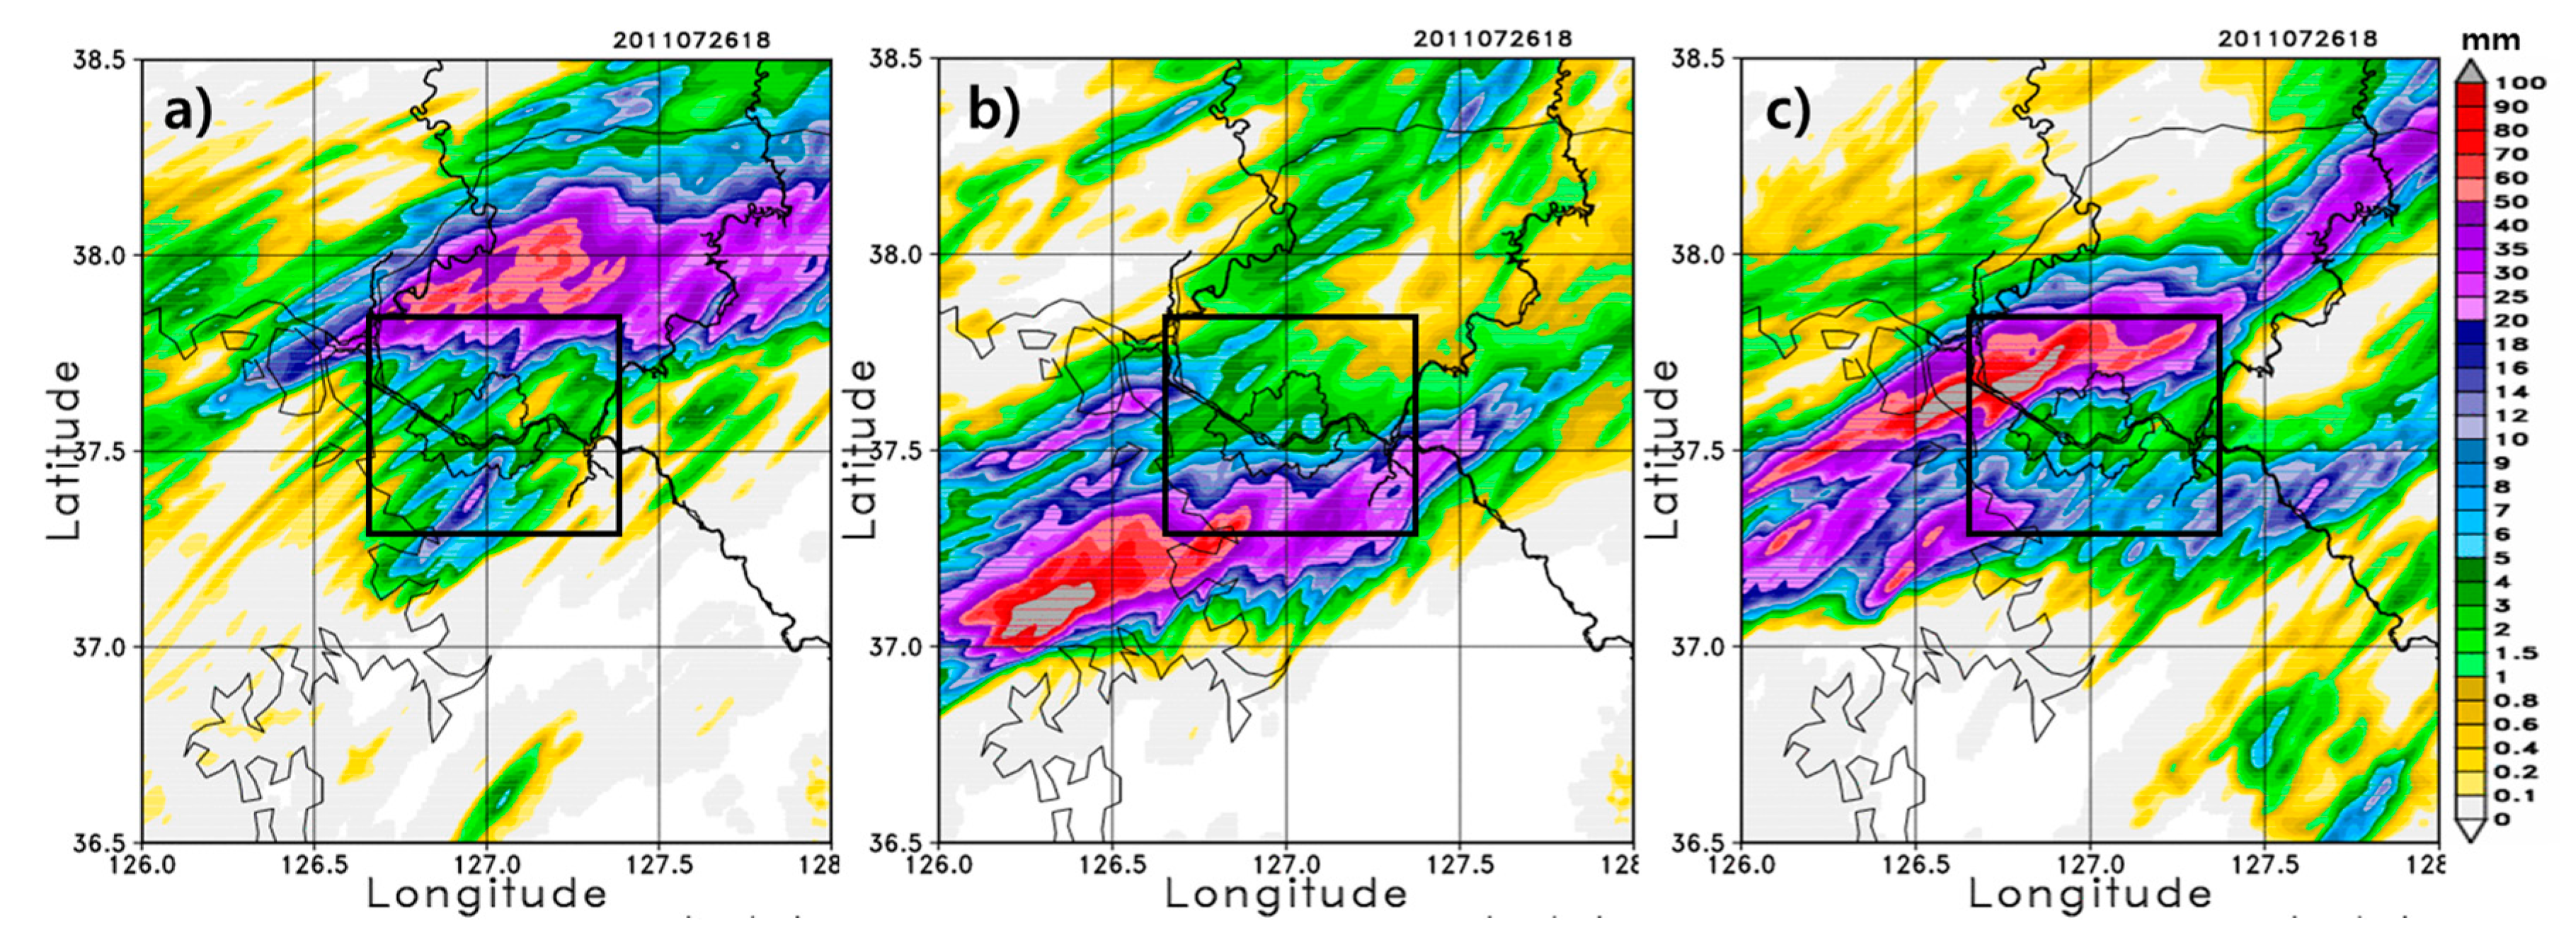
Figure 10 shows the hourly accumulated precipitation results at 18 UTC 26 July 2011 for the lead time effect experiment, which was initiated at 00 UTC (default option), 06 UTC, and 12 UTC 26 July 2011. In all simulations, heavy rainfall is predictable although biases still exist for the rainband location and magnitude of precipitation. Additionally, two initial conditions that are 6 h apart result in quite different rainband locations. With a lead time of +12 h, the rainband is located north of Seoul and subsequently dies out gradually. As the lead time decreased and became close to the target time of 18 UTC 26 July 2011, such as for the forecast model initiated at 12 UTC 26 July 2016, the result became more similar to the observations in
Figure 6a; the rainband was located over Seoul and the precipitation magnitude improved.
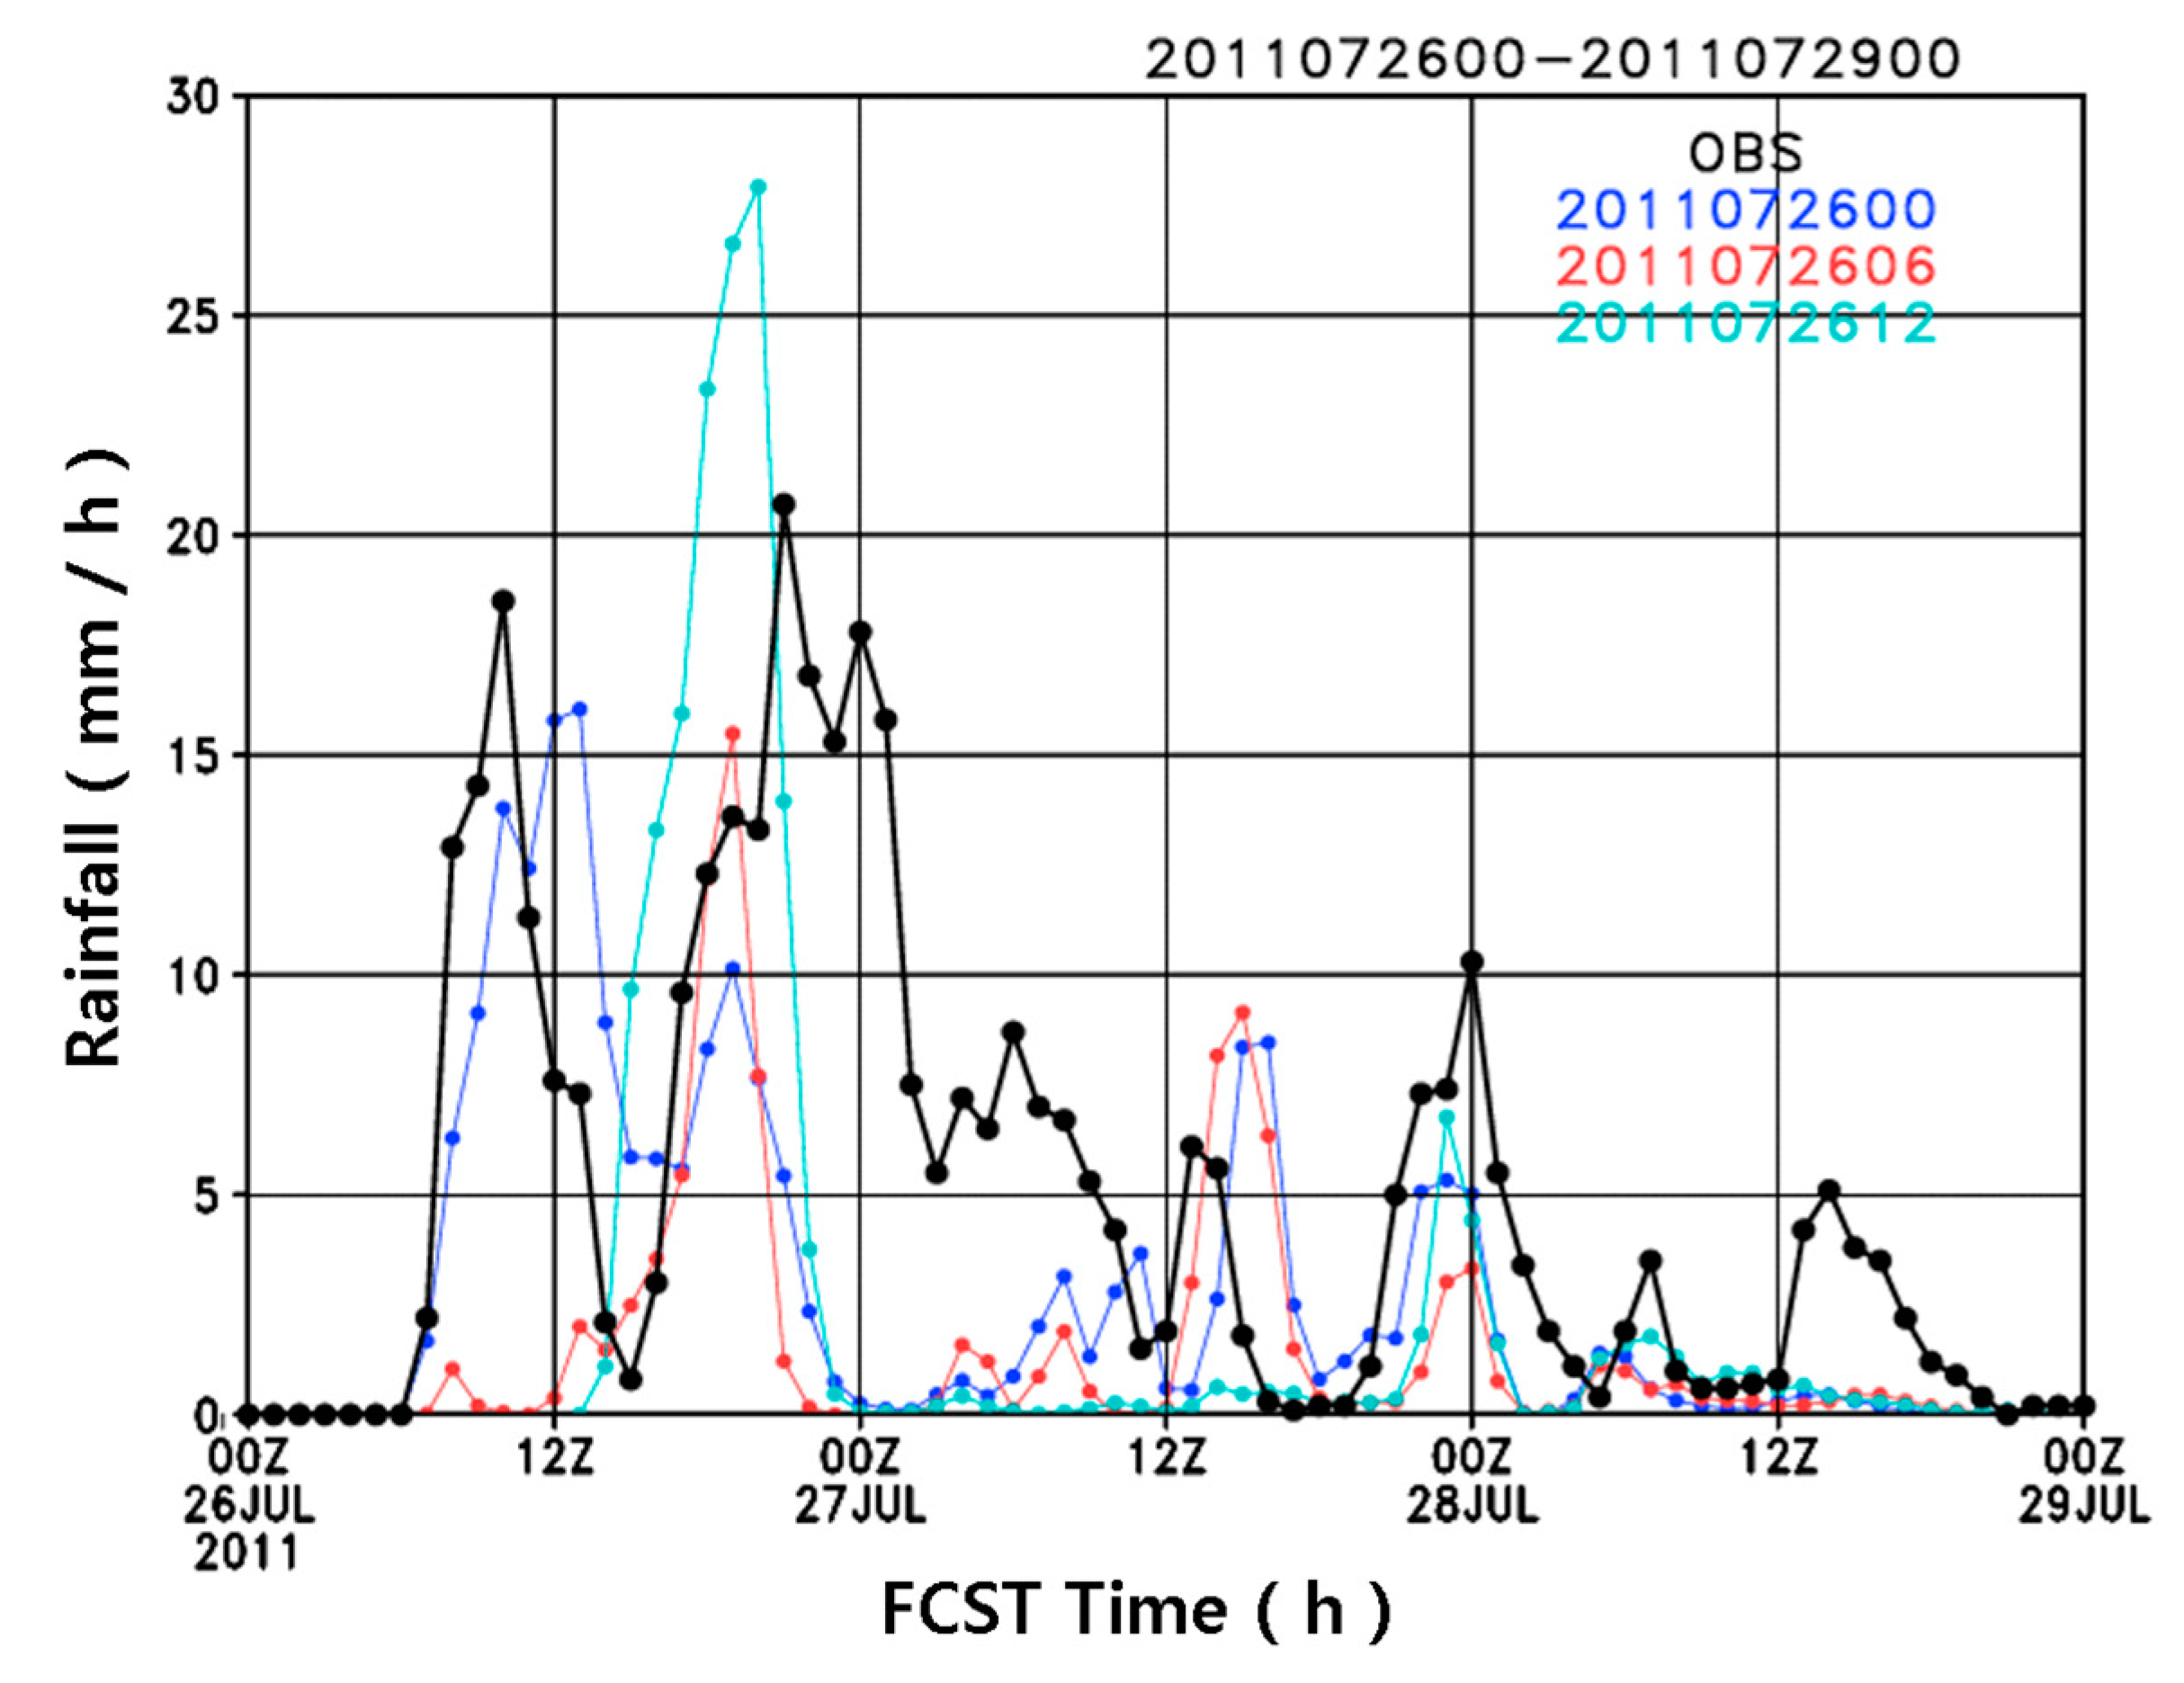
Figure 11 shows the time series of the spatially averaged hourly rainfall indicated by the boxes in
Figure 10 (37.3° N–37.8° N, 126.6° E–127.4° E). For the second onset of the rainfall, as the lead time is close to the target time (1800 UTC 26 July 2011), the maximum accumulated precipitation from the forecasting model gets larger, but the duration of precipitation is similar for all simulations. The lead time experiment for the high-resolution forecasting model in this study indicates that a lead time <6 h might be appropriate for very-short range numerical forecasting over the region of Seoul, Korea. It is worth noting that for the shorter than 3-h lead time precipitation forecast, the radar data extrapolation is usually more accurate than the numerical weather prediction.
3.5. Discussion
The sensitivity experimental results in this study show that the high-resolution forecasting model at 1-km resolution performed better than the coarse-resolution model at 5-km resolution for all simulations. Therefore, the dynamical downscaling method seems to be effective via the WRF nesting process. In addition, the sensitivity analysis suggests that for a given forecasting model, an appropriate outer domain size and lead time for a high-resolution model should be taken into consideration to optimize the WRF configuration for regional torrential rainfall events around Seoul and its suburban area. That is, given the default model results as a reference, the experiments with a relatively small outer domain and short lead time produced a more accurate distribution and intensity of precipitation than the other experiments. Larger domain sizes and longer lead times led to larger internal variabilities in the forecasting model, resulting in displacements of the rainfall band. More informative initial conditions are more useful than high resolution initial conditions for the performance of the forecasting model. Finally, SST experiments show negligible influence and do not capture short-term model variability.
Table 3 quantitatively confirms the results of the sensitivity experiments using indices of precipitation prediction evaluation, such as Probability of Detection (POD), False Alarm Ratio (FAR), and Equitable Threat Score (ETS). The POD, known as the hit rate, measures the fraction of observed events that were correctly forecast, FAR provides the fraction of forecast events that were observed as non-events, and ETS accounts for the hits that would occur purely due to random chance [
29]. Given the inner domain size for the 1-km resolution forecasting model, an appropriate outer domain size is an important factor in precipitation forecasting in Korea; these factors influence the correct location of the rainfall core and rainband in the high resolution model. In large outer domains, the rainfall bands are located too far north of the target area compared to those observed in the regional models [
24]. For the SST experiment, there are no significant differences in the indices between simulations, and the SST data do not impact the shorter lead time forecasts [
30]. SST could have more influence on forecasting precipitation by coupling the atmosphere model and ocean models. The experiments for both initial conditions and lead time showed large influences on the performance of precipitation forecasting of the very short-time high-resolution models. To make substantial improvements in short-range precipitation forecasting, we need to improve the initial conditions through data assimilation, and determine the appropriate outer domain sizes and effective lead times.
Table 4 shows a statistical summary of the sensitivity studies. To compare simulation results with observations, the 54 AWSs were used to calculate the correlation coefficient (CC), deviation (BIAS), and root mean square error (RMSE). The statistics shown in
Table 4 indicate the 2-m temperature (T2), 10-m wind speed (WS10), and relative humidity (Rh) variables. For each variable, the shading indicates the CC closest to one, lowest RMSE, and BIAS values closest to zero for each experiment. The statistical results indicate that the model results from the smaller outer domains and shorter lead times perform better statistically than those from larger domains and longer lead times. Goswami et al. [
13] investigated this issue using >10 km resolutions and the Fifth-generation Penn State/NCAR Mesoscale Model (MM5) simulations for three high-impact weather (heavy rainfall) events over the Tropics to establish the best model performance. Their results showed that domain size is as important as grid spacing and initial conditions in the simulating high-impact weather events. The results showed that, along with initial conditions and grid size, the domain size also significantly affects simulated quantities, such as total and maximum rain.
Overall, the sensitivity analyses of model performances have traditionally focused on model physics, initial conditions, and SST. Analyses associated with outer domain size and lead time are rarely considered. The results of the precipitation forecast illustrated by the statistical skill scores in
Table 3 and
Table 4 show that the impacts of the model outer domain and lead time are as large as those of the initial conditions. That is, the impacts of various model configurations, such as the outer domain size, initial conditions, and lead time, are greater than those of SST on the performance of precipitation forecasting from high-resolution models in short-time forecasts. It is worth noting that the resulting sensitivity exhibits case-by-case variability. For example, Wang et al. [
9] performed sensitivity studies for three different cases. They concluded that their precipitation forecasting was only slightly affected by initial conditions and model physics in the longer-time forecast, and, while they had similar properties, there was still case-by-case variability.
4. Summary and Remarks
Sensitivity analyses have traditionally focused on model physics and initial conditions, but the model uncertainty associated with domain size and model resolution has been rarely considered [
9]. This work performed a sensitivity study on high-resolution WRF precipitation forecasts for a heavy rainfall event over Seoul, the capital city of Korea, for 26 and 27 July 2011. WRF simulation results were analyzed with various configurations, including outer domain size, sea surface temperature, initial conditions, and lead time. The study indicates that the impacts of domain size and lead time on the precipitation forecasts were no less significant than those of initial field conditions and SST data.
As mentioned previously, the combination of optimal choices presented here may not be the optimal configuration for a given forecasting model, and fine-resolution input data generally, but not always, show good performance. Min et al. [
31] studied the effect of outer domain size on forecasting models and reported that the biggest outer domain initialized with the NCEP-FNL initial conditions produced a better performing forecasting model. The combination of initial conditions from NCEP-FNL and RTG-SST data yielded a similar result to those from UMR and OSTIA SST (figure not shown). That is, NCEP-FNL data are very coarse but still yield very good forecasting results in some cases. This is partly because the initial condition is a well data-assimilated analysis field and combines with an appropriate configuration. Jee and Kim [
16] also showed that topographical terrain data with a resolution higher than the model resolution results in significant improvement in the representation of topographical heights and land use, but did not produce a statistically significant improvement in model performance.
This study adopted the same configuration for the physical parameterizations as the Korean Local Analysis and Prediction System operational model that is run by KMA. For precipitation forecasting, the parameterization of microphysics and convective schemes is generally the most important consideration because these schemes have a direct effect on the generation, distribution, and intensity of precipitation. When the horizontal resolution is in the <10 km range, the precipitation behavior of a numerical model with and without those parameterized schemes should be explored systematically. Increasing the skill of forecasting precipitation with various parameterized schemes remains for further study [
32].
Furthermore, although the high-resolution forecasting model is optimized, the deterministic model might still have several problems to resolve, such as short range severe weather events, i.e., heavy precipitation. In such an environment, the predictability of the forecasting model could be improved by considering the probabilistic forecast. Ensemble prediction systems are more applicable to high-impact weather forecasting by adding some probabilistic values to the deterministic forecasting model. Additionally, although we would perform additional intensive sensitivity studies regarding the domain size, lead time, and so on for a vast majority of severe weather events, the optimized configuration for the high-resolution forecasting model might not be achieved. In such cases, sophisticated data assimilation techniques could be the alternative for improving the performance of the high-resolution forecasting model. We leave these experiments of high-resolution model forecasts for future studies.
