Article

Cryogenic Displacement and Accumulation of Biogenic Methane in Frozen Soils

1
Centre of Forest Ecology and Productivity, Russian Academy of Sciences, Moscow 117997, Russia
2
Department of Biogeochemical Processes, Max Planck Institute for Biogeochemistry, Jena 07745, Germany
3
Institute of Earth Sciences, Saint Petersburg State University, Saint Petersburg 199034, Russia
4
Nansen Centre, Saint Petersburg 199034, Russia
5
Geophysical Institute, University of Alaska Fairbanks, Fairbanks, AK 99775-9320, USA
6
Institute of Physicochemical and Biological Problems in Soil Science, Russian Academy of Sciences, Pushchino 142290, Russia
7
Faculty of Geology, Lomonosov Moscow State University, Moscow 119992, Russia
*
Author to whom correspondence should be addressed.
Atmosphere 2017, 8(6), 105; https://doi.org/10.3390/atmos8060105
Submission received: 28 March 2017 / Revised: 8 June 2017 / Accepted: 9 June 2017 / Published: 15 June 2017
(This article belongs to the Special Issue Atmospheric Methane)

Abstract

:
Evidences of highly localized methane fluxes are reported from the Arctic shelf, hot spots of methane emissions in thermokarst lakes, and are believed to evolve to features like Yamal crater on land. The origin of large methane outbursts is problematic. Here we show, that the biogenic methane (δ13C ≤ −71‰) which formed before and during soil freezing is presently held in the permafrost. Field and experimental observations show that methane tends to accumulate at the permafrost table or in the coarse-grained lithological pockets surrounded by the sediments less-permeable for gas. Our field observations, radiocarbon dating, laboratory tests and theory all suggest that depending on the soil structure and freezing dynamics, this methane may have been displaced downwards tens of meters during freezing and has accumulated in the lithological pockets. The initial flux of methane from the one pocket disclosed by drilling was at a rate of more than 2.5 kg C(CH4) m−2 h−1. The age of the methane was 8–18 thousand years younger than the age of the sediments, suggesting that it was displaced tens of meters during freezing. The theoretical background provided the insight on the cryogenic displacement of methane in support of the field and experimental data. Upon freezing of sediments, methane follows water migration and either dissipates in the freezing soils or concentrates at certain places controlled by the freezing rate, initial methane distribution and soil structure.

1. Introduction

Locally high rates of methane emission from thaw lakes [1,2,3] and the adjacent Arctic coastal shelf [4] are observed in northeastern Siberia. These emissions are thought to be either the result of the degradation of organic matter previously held in the permafrost [5,6,7,8] or may emanate from fault/fracture zones [3,9]. Consistently, the forecasts of methane emission resulting from permafrost degradation have been based on areal extrapolations of either average organic matter content and degradability [10,11] or the distribution of geological fracture zones [3,12], claiming permafrost as a time bomb fueled with methane for the future warming. Recently, the breaking news of the crater-like feature in permafrost in Yamal peninsula again drew attention to permafrost and methane [13,14]. Is it the local “permafrost methane bomb” detonation? Where shall we expect the same phenomena to occur?
Methane has been found in the permafrost profile in the form of gas filling the pores, dissolved gas and clathrate [15,16]. The measurements of methane concentration patterns in the Miocene to the Holocene permafrost of northeastern Siberia and Yamal peninsula show that methane trapped within the pores of frozen soils could reach concentrations of up to 400 cm3 per 1 kg of frozen soil [15,16]. The methane is unevenly distributed, with some geological strata having high concentrations while others only having patchy traces of methane. The overall contribution of methane trapped in permafrost was shown to be incomparable with the current biogeochemical methane production within the permafrost zone [17,18]. However, it might affect spatial and temporal patterns of methane emission with sudden blowouts when either mechanical disturbance or thawing reaches the methane-enriched zone in permafrost [19,20].
The uneven distribution of methane in permafrost results from the influence of biological, lithological and cryogenic factors. The evidence from stable isotopes of carbon (δ13C(CH4) = −68–99‰), as well as biogeochemical and microbiological studies [21,22,23,24] support the contention that methane found in permafrost has been formed in the site by microorganisms in porous soils mainly before [25] or at the time of freezing. High methane concentration in permafrost could point to a favorable habitat for methanogenesis in thawed soil and good conditions for the burial of the produced methane when the soil froze. There were few methanogens in the sediments containing rare traces of methane and abundant microbial fauna in the layers enriched with methane [26]. However, no agreements were found between the concentration of substrates for methanogenesis and the concentration of methane in permafrost [22].
Without evidence of higher substrate concentration or a favorable environment for microbial methanogenesis, the zones of high methane concentration must have had specific conditions for the preservation of methane. Based on the distribution of methane blowouts found during the drilling in Yamal and other locations in the permafrost zone, as well as advances in the gas-hydrate studies, the hypothesis of cryogenic methane displacement was put forward [16,19]. According to it, the freezing front displaced methane from the thawed soil when permafrost developed. It formed accumulations of methane and in some cases the gas-hydrate in lithological pockets represented by coarse-grained soils or other highly porous media, surrounded by less permeable soils (including permafrost). Similar processes of cryogenic displacement and accumulation of substances like oil contaminants or salt ions were reported earlier [27,28]. However, up to now, there have been very few facts pointing at the fate of freshly-formed methane in freezing soils, and neither direct evidence nor a physical basis were provided for methane displacement.
This study has collected natural and experimental evidence supporting the cryogenic displacement of methane in the freezing active layer and permafrost down to the depth of tens of meters. We aimed to provide the theoretical framework for the observed phenomena of methane transport and to find out the favorable conditions for the formation of the methane accumulations, the ones that may contribute to phenomena similar to the Yamal crater.

2. Materials and Methods

Field studies of methane concentrations in permafrost were associated with the localities of the exposures of the Quaternary permafrost in northeastern Siberia [15,22]. Here, we focus on the selected features: the distribution of methane in the upper permafrost and the detailed analysis of the dated section containing the methane-enriched zone. Studies of blowouts in Yamal were reported earlier [16,19]. However, we find it necessary to provide a summary of the findings in Yamal to improve understanding of the links between the observed phenomena.
The locations considered in northeastern Siberia are shown on the map (Figure 1 [29]). All points of the study were located in the tundra zone, and continuous permafrost first occurred in this area before 2.6 million years ago [30]. Alternating cold and warm periods and differentiated tectonics have created a layered section of permafrost with a thickness of about 600 m. The layers alternate between the strata deposited and frozen simultaneously (syngenetic permafrost) and the sediments deposited in the thawed state, which froze during the consequent cold period or under local changes of the surficial thermal regime (epigenetic permafrost). The latter includes the cessation of subaqueous sedimentation upon the drainage of a lake, or the meandering of a river, or sea regression, etc. Currently, water bodies freeze down to a depth of 1.4 m in the study area. The deeper water bottoms do not freeze, and the thaw bulbs where the thawed sediments exist on a year-round basis form locally in continuous permafrost. Under shallower waters and on land, the thawing of permafrost occurs during short summers (in June–October) down to a maximal depth of 0.3–1.2 m. The layer of seasonal thawing coincides with the active layer, the layer where biogeochemical activity takes place as opposed to permafrost, where it is limited. Active layer thicknesses used in this study were derived at the Circumpolar Active Layer Monitoring (CALM) plots closest to the sampling sites [31].
Active layer thickness grows after snow melting over the course of summer reaching the annual maximum in early autumn. Interannual variability of the maximum thawing depth is caused by weather conditions or changes in surficial heat and moisture exchange. During extremely hot summers or at some stages of succession (for example, after wildfire), the deeper soil layers adjoin the active layer. These rarely but recurrently thawing layers in transition between permafrost and the seasonally thawing layer constitute the transient layer with distinct structure and increased ice content [32].
A prominent type of sediment accumulated in the area is Yedoma. Yedoma is a regional geological stratum in northeastern Siberia, composed of ice-rich silty soils embedding the ice-wedges, accumulated during the Late Pleistocene (dates range from older than 50 to about 15 thousand years before present (BP)) similar to loess-like formations widespread in other Arctic plains [33,34,35,36]. There is no consensus on the genesis of the sediments based on the studies of different sections of Yedoma; however, it is a classical case of the syngenetic formation of permafrost, when freezing occurs simultaneously with accumulation of sediments. The thickness of Yedoma ranges widely from several to 30 m.
Between 15 and 9 thousand years BP [2], more than 50% of the Yedoma area had been redeposited by thermokarst: thawing of the ground ice, subsidence, formation of lakes, growing thaw bulbs, lake coastal abrasion and slope processes, triggered by changing environmental conditions [37]. It formed the widespread and often conjugating depressions. On the remaining hills where thermokarst had not initiated, most of the Yedoma section has outlasted the Holocene optimum. Only topmost layers lying within the thicker Holocene active layer have thawed and compacted. After the Holocene optimum, these sediments refroze, forming the regional geological stratum called the Cover Layer [34]. It is represented by the ice-rich layered silts with the gravimetric moisture content often exceeding 100%, usually 0.5–2.0 m thick, lying between the transient layer and Yedoma. Following the late-Holocene environmental cooling and/or lake drainage, thaw bulbs under former lakes in the thermokarst depression refroze or are still refreezing, forming the epigenetic permafrost.
Due to the similarities in formation by thawing and refreezing, the structure of the transient layer is very much similar to the Cover Layer and could hardly be recognized in cores. In this study, we consider the transient layer as any ice-rich layer on the bottom of the active layer (or upper permafrost), except for the Yedoma remnants, where the transient layer has been forming in the upper part of the Cover Layer and hence could not be separated without additional studies.
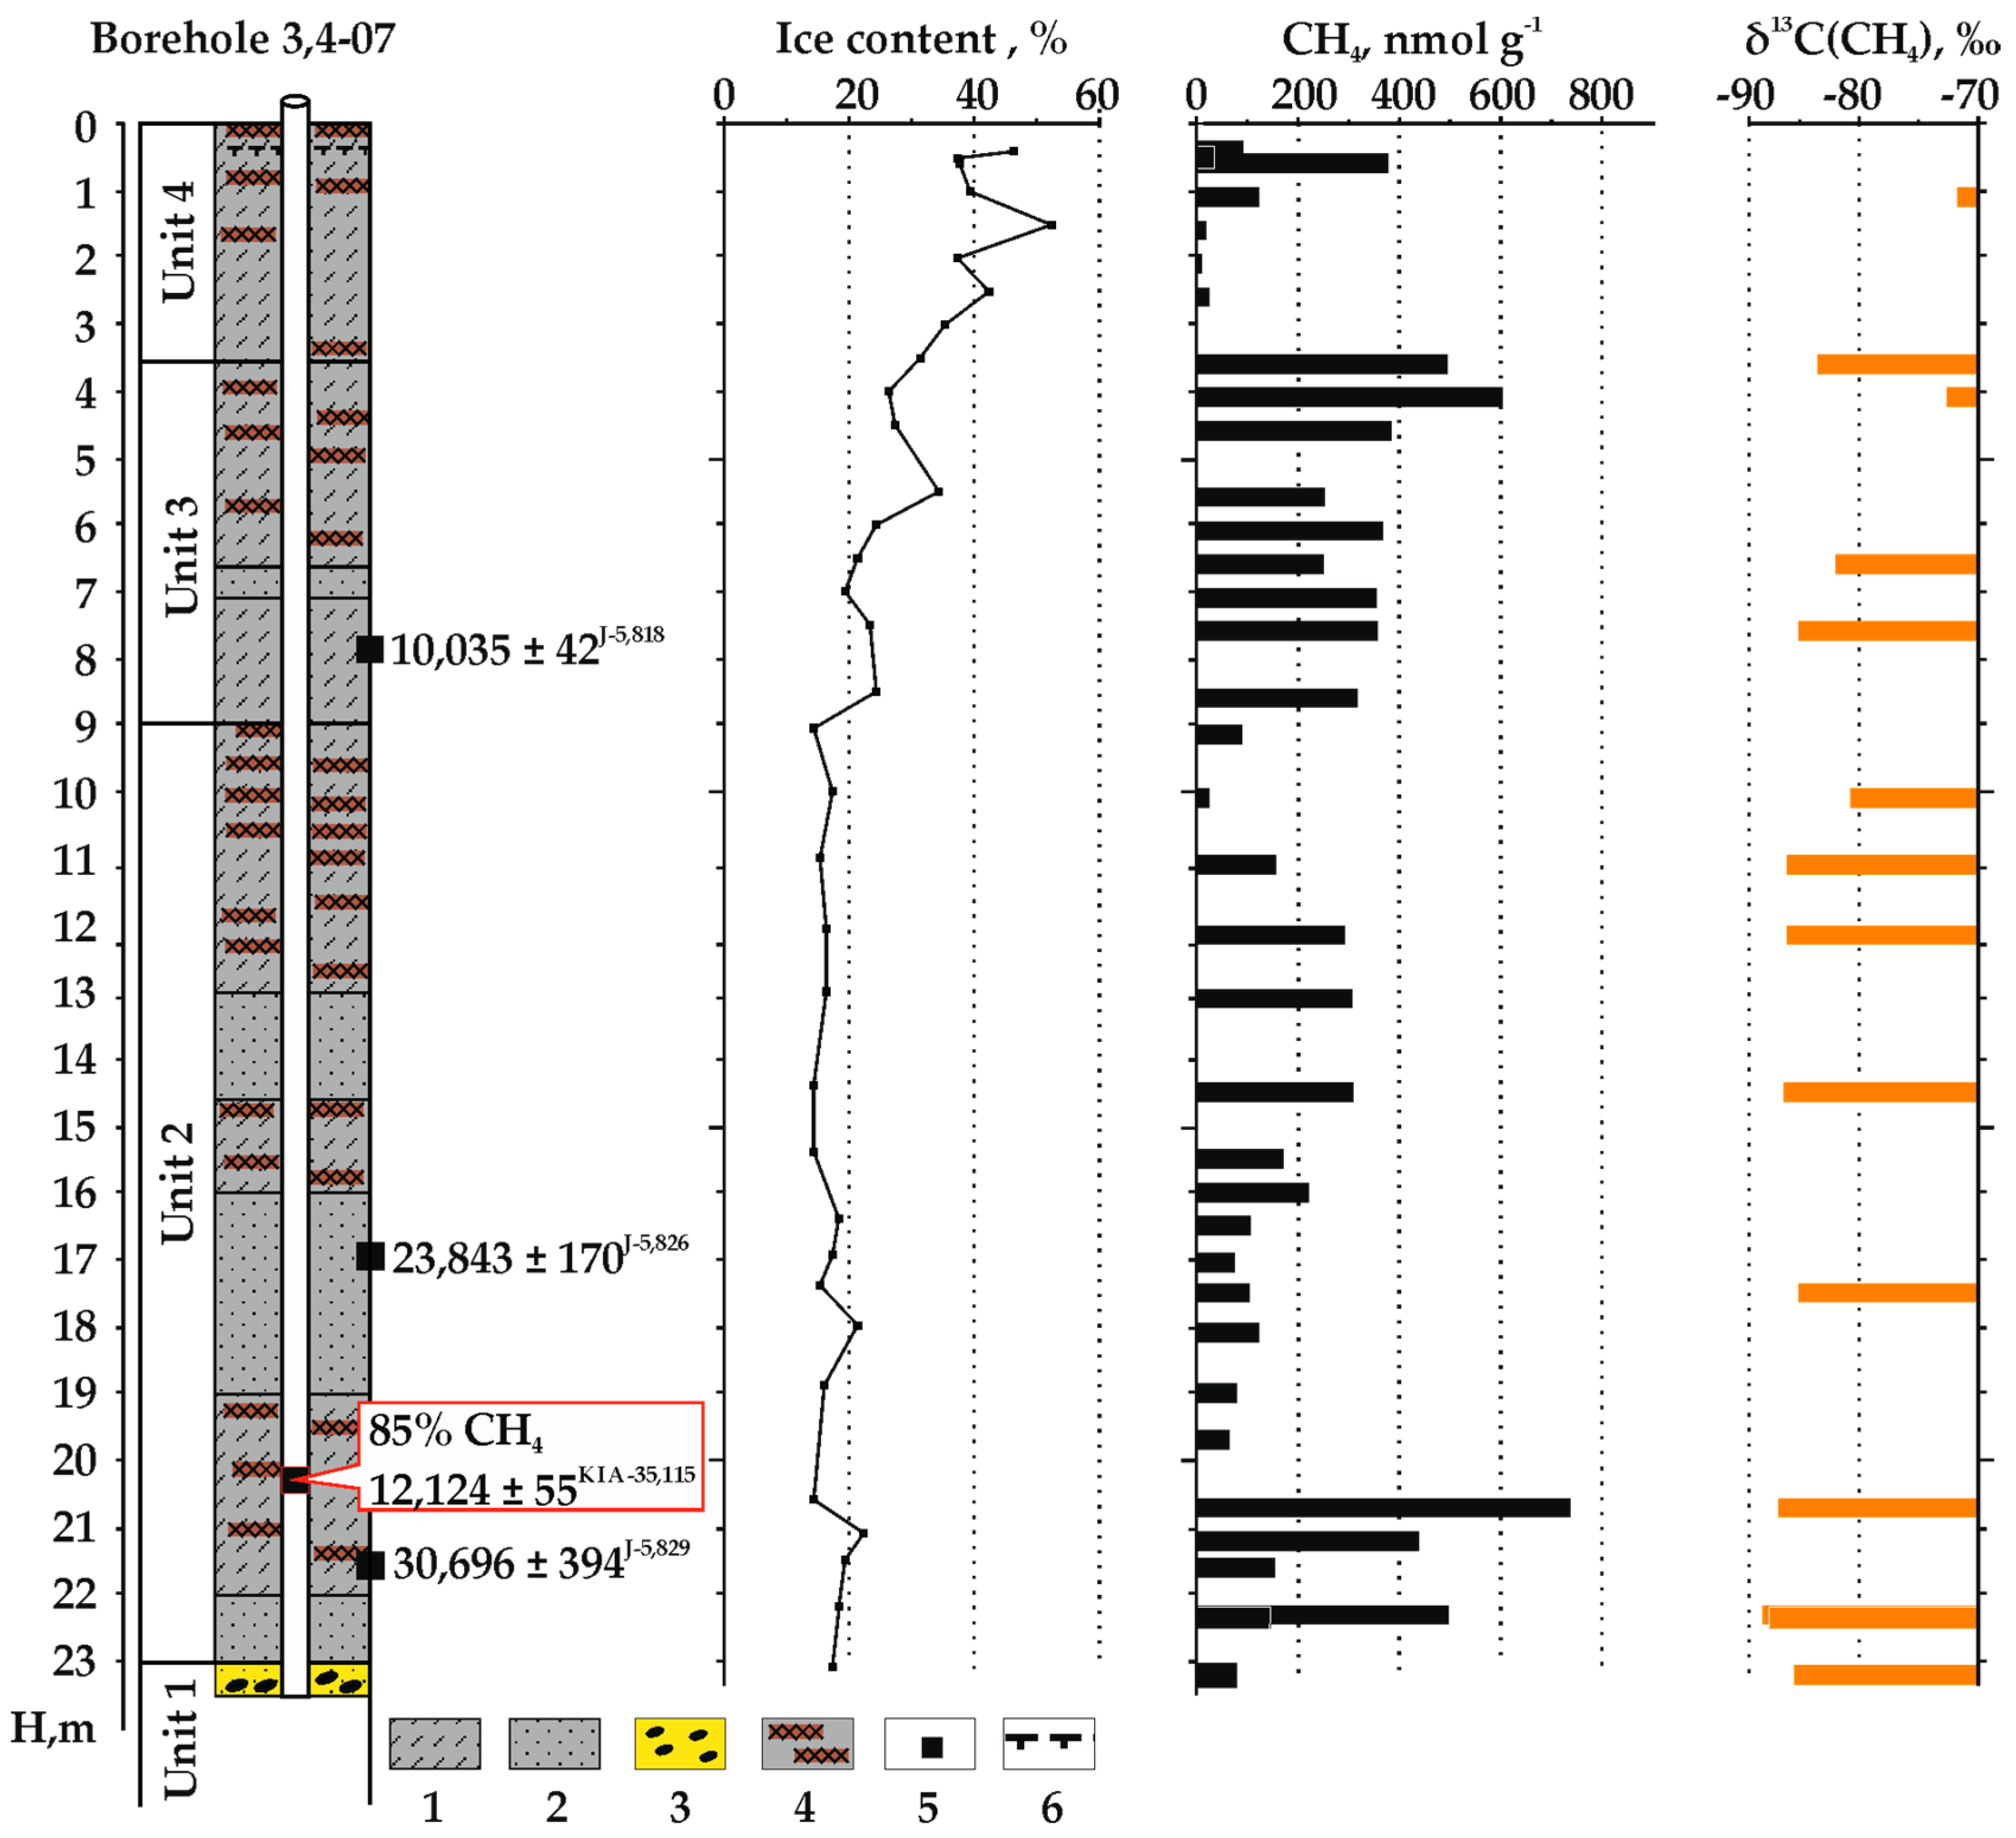
We also considered the sediments’ complex found in the river valleys. The section including several faces of alluvium was disclosed by the borehole 3,4-07 (23.5 m deep) in the Kolyma floodplain. It revealed four geological units; these could be differentiated based on the soil composition, the character of the ice inclusions and radiocarbon dating (Figure 2).
The alluvial section covers the basement layer (Profile-Unit 4, 23–23.5 m deep) composed of gravel filled with silt. Its age remained uncertain being more than 30 thousand years, so it might be either the riverbed facie or the gravel of the Begunovka formation of more than 2.6 million years BP, widespread in this area.
Alluvial strata (Profile-Units 2–3, 4–23 m deep) were composed of alternating silts and sand layers. They accumulated between about 30 and 10 thousand years BP. The Profile-Unit 3 (10–23 m) has thicker layers and coarser grain size than the younger Profile-Unit 2 (4–10 m). Organic inclusions and layered cryogenic structure were typical for the Profile-Unit 2. These represent the gradual change from the riverbed to oxbow-lake regime.
The topmost boggy lacustrine (Profile-Unit 1, 0–4 m deep) peaty silts and loams with abundant ice inclusions (Itot = 30–50%, iciness measured by soil moisture content in thawed soil) and the embedded polygonal ice wedges accumulated during the late Holocene (younger than 10 thousand years) point at the shift from oxbow lake to floodplain wetland regime and development of epigenetic permafrost within the whole section.
Rotary drilling was performed with the UKB-12/25 portable drilling machine (Vorovsky Factory, Russia) with the inner diameters of the core-extractor ranging from 10 cm (at the top) to 5 cm (at the bottom). The frozen soils from the active and transient layers were in some cases sampled from pits or exposures as indicated in Table A1. The gas was sampled both by degassing the frozen soils and by sampling the air in the borehole
The gas from the core was sampled by the improved technique of methane separation through the phase equilibration [38]. The gas samples were collected in the field by degassing 50-g sub-samples of frozen cores in a 150-mL syringe under a 99.999% nitrogen atmosphere. The gas mixture was then transferred through a needle to the rubber septa-sealed vials filled with saturated NaCl solution. At that point, brine was substituted by gas with the excess brine flowing out through a second needle. The gas samples had been kept in the vials until they were analyzed in the laboratory. CH4 concentrations were measured using a KhPM-4 gas chromatograph (Chromatek, Russia) equipped with a flame ionization detector. Hydrogen was used as the carrier gas. Chromatographic values of methane in ppm were recalculated to nmol per g of frozen soil because the phase state of methane in permafrost is unknown. The same samples of gas were analyzed for δ13C of methane using a GC Combustion Thermo Finnigan interface and Delta XL mass spectrometer (Thermo Fisher Scientific, Waltham, MA, USA).
The losses of methane prior to degasation were estimated from the geometry of the sub-sample, which we kept small enough to be able to put inside the syringe (38 mm). We assume that methane was equally distributed in every sub-sample and could only have escaped from the open pores in the layer of 1 mm near the surface of the sub-samples. The maximal surface area of the cylindric sub-sample that could fit the syringe was calculated from the sub-sample volumes measured. Thus, losses estimated as the ratio of the volumes of the 1 mm layer with the open pores on the sub-sample surface to the volume of the inner part of sample did not differ much between samples being 19.7 ± 4.3% of the measured methane concentration. We do not expect the open pore layer thickness to be more than 1 mm because the duration of high temperature contacts between hands or air and sub-sample did not exceed 2–3 min. Another source of losses of reported methane concentration is related to the method of phase equilibration. We did the phase equilibration only once. However, the second round of phase equilibration, as shown by our analysis of losses [18], has contributed up to 12% of total methane content in the sample as measured from the sum of the amounts of methane, degassed after each round of phase equilibration. Thus, we assume overall losses of methane from every degasation to be about 30%, which we did not correct for in the reported values. The uncertainties of the reported values are the sums of uncertainties of the amount of methane estimates taking into account the accuracy of measurements: of the permafrost sub-sample mass (accuracy of 0.1 g), the headspace volume in the syringe (1 mL) and chromatographic measurement (the absolute value in ppm of difference between height and area of methane peaks on the chromatogram).
Concentrations of methane in the active layer and upper permafrost are reported for relative depth, to indicate the location of the sample within the soil profile at different site locations. Active layer thickness used to calculate relative depth was the maximal among observations prior to the sampling year [31]. Depths of cover layer and transient layer bottoms were documented as part of the cores’ documentation. The samples were grouped by the rounded relative depths. Reported are individual measurements, means and maximums and minimums for the depth where there were 2 samples and also the standard error for depths where the number of samples exceeded 2.
The air of borehole No. 3,4-07 (23 m deep) and the one drilled 30 km east at the same floodplain in 2012 (15 m deep) was sampled from the bottom by the 150-mL syringe through a system of silica tubes, taking into account the tubes’ volume. The borehole air was also placed in a sealed bottle and transported to the laboratory for accelerator mass spectrometry dating.
To calculate the density of the flux through the borehole mouth, we found the volume of methane in the borehole by multiplying the volume of the borehole and the methane concentration. We assumed the gas flux to form due to the differences in the concentrations of methane in the borehole and the air and estimated it by dividing the volume of methane in the borehole by the area of the borehole mouth. The depth-weighted average diameter of the 7-cm core was used in the calculations of the methane flux from the drilling hole.
To find out the age of the embedding deposits and how it responds to the age of the methane, the samples of the frozen soils from four depths were dated in the laboratory. They were defrosted, fractionized, freeze-dried and separated into four diameter classes of dissolved organic matter (<1.5 µm, 1.5–36 µm, 36–63 µm and >63 µm). The 1.5–36 µm dating results (mean, standard error) were used in this paper.
The boreholes in Yamal were drilled nearby Bovanenkovo gas field. The permafrost thickness in the area reached 160 m. The occurrences of gas blowouts from the drilling wells in Yamal were documented in the drilling reports. Measurements of the gas flow from different intervals were undertaken at mouths of multiple boreholes. Blowout gas composition and isotopic composition of methane as a component of this gas were studied [16,19] in the samples taken from the borehole mouth at the time of gas release. The corrections for methane concentration in the air were made.
We carried out an axial freezing experiment of methane-enriched soil in the laboratory, to test the hypothesis of cryogenic displacement of methane. Both Yedoma silt and alluvial sand from Kolyma Lowland were tested. The axial freezing experiment was held under laboratory conditions, using the cryostat filled with ethylene glycol set for a temperature of −15 °C. A soil column of 13 cm thick was placed in a thermally-insulated container. The ethylene glycol from cryostat circulated in spiral tubes was placed atop the soil in the container. The soil was enriched with water until the volumetric moisture content was 30% and flushed with gaseous methane. The freezing had been ongoing for 1–2 days, until the temperature sensor at the bottom of the cylinder measured −1.5 °C. Two monoliths of the frozen soil were sampled from every 1.5–3 cm, further degassed, following the same procedures as in the field, and then, the methane content was measured chromatographically.

3. Results

3.1. Features of Methane in Permafrost and Temporarily-Frozen Soils

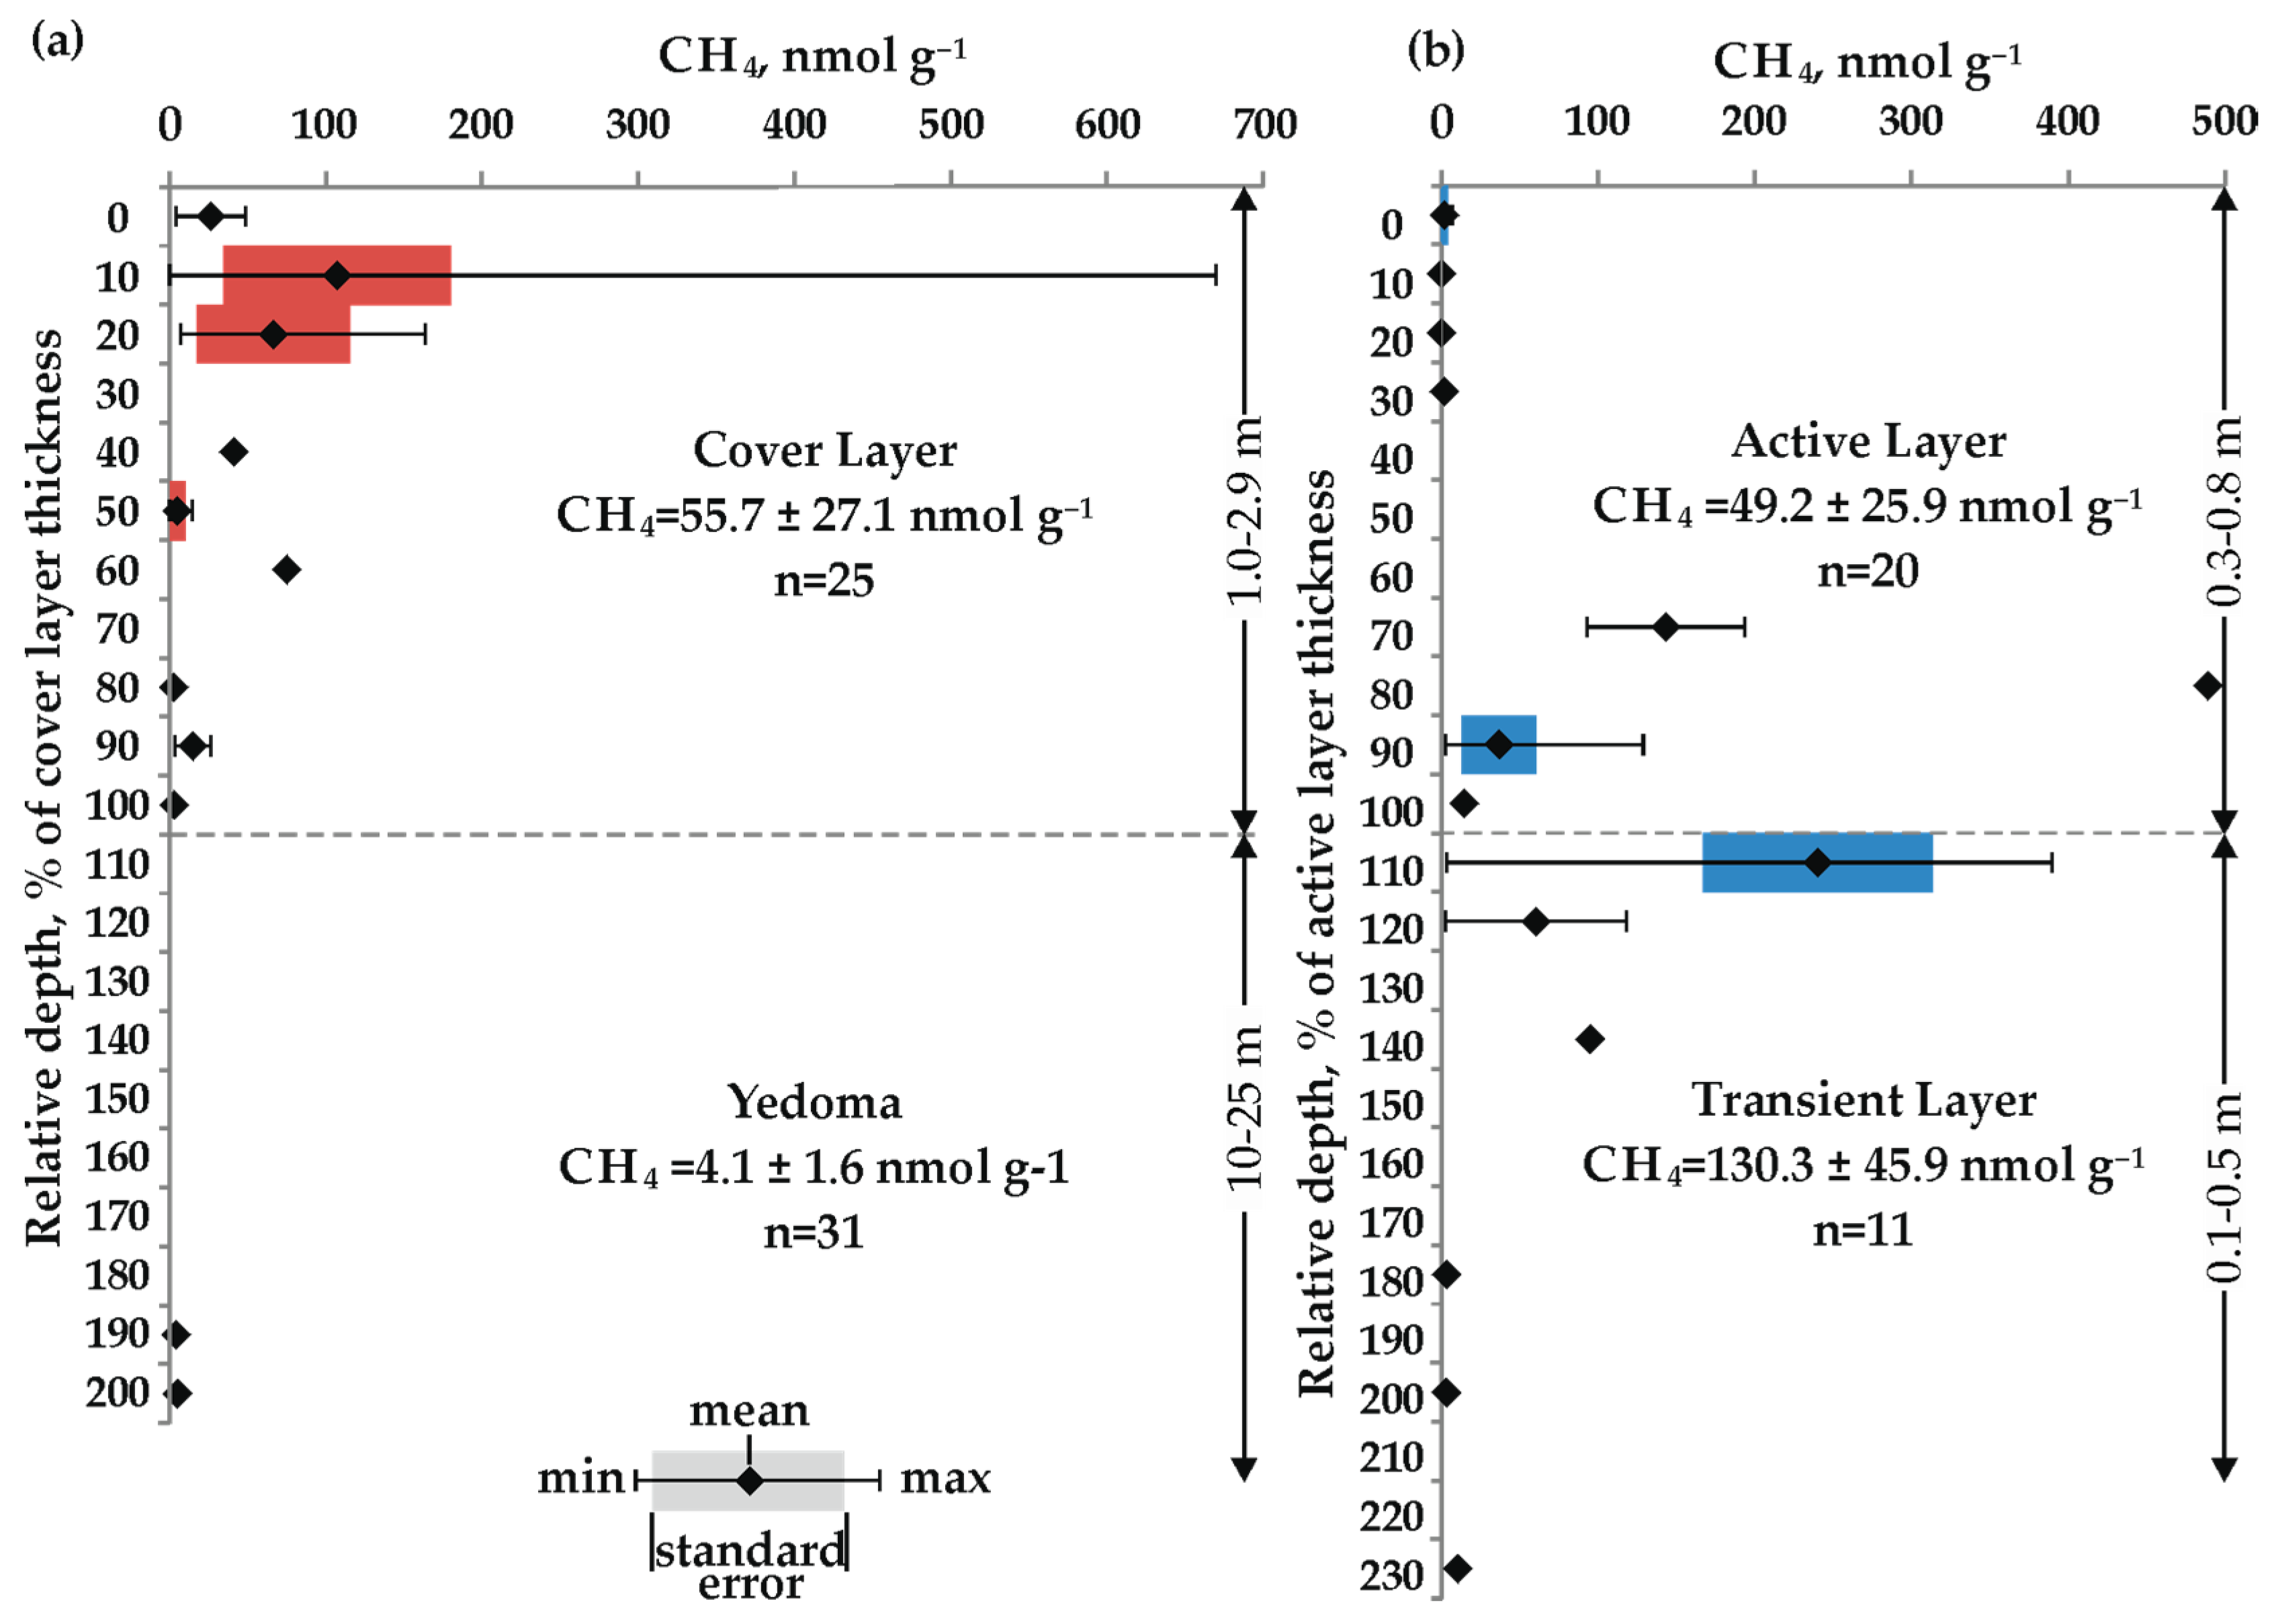
Only rare traces of methane were found in the upper layers of Yedoma in any of the 31 samples analyzed (Figure 3a). However, the samples from various parts of the Cover Layer indicated the presence of methane in concentrations of 55.7 ± 27.1 nmol g−1. The concentrations generally fell from the bottom of the active layer to the bottom of the Cover Layer, reaching the highest mean average of 107.6 nmol g−1 and the peak concentration of 669.6 nmol g−1 in its upper part (Figure 3a). A few samples from the bottom of the Cover Layer had higher methane concentration than the 3 nmol g−1 rarely found in Yedoma.
The methane had a higher average concentration of 130.3 ± 45.9 nmol g−1 in the transient layer outside the watersheds (Figure 3b). Most of the methane 140.6 ± 37.7 nmol g−1 was concentrated in the lower 0.1–0.25 m of the active layer and the upper 0.1–0.3 m of the transient layer. The late autumn fieldwork in 2005 allowed sampling methane from the frozen upper part of the active layer. There were only traces of methane lower than 6.5 nmol g−1 found in any of the three types of soil wehad tested.
The alluvial section disclosed by the borehole 3,4-07 had methane concentrations from 9.4–747.5 nmol g−1 as revealed from the core samples (Figure 2). The highest concentrations were found in the bottom of the Profile-Unit 3 sediments, in the upper half of the Profile-Unit 2 sediments and in the transient layer (upper three samples of Profile-Unit 1). We were unable to find any correlations between methane concentration and lithology or ice content. Links to the sediment genesis were also ambiguous. Following the gradient of anoxia, fluviolacustrine sediments of Profile-Unit 2 had higher concentration of 351.0 ± 44.7 nmol g−1 than the alluvial Profile-Unit 3 with its 212.4 ± 45.6 nmol g−1. The lowest methane concentrations of 43.7 ± 23.1 nmol g−1 were found in the peaty soils of Profile-Unit 1, deposited at the stage when the lake had turned to a wetland conventionally associated with the most favorable conditions for methanogenesis.
The δ13C of methane in the 3,4-07 section varied from −68–−87‰, which clearly points to biogenic methane (Table A1). Surprisingly low variation in the relative concentration of 13C of 84.1 ± 0.3‰ (n = 5) was observed in methane from the depth interval 11–21 m.
We revealed that the methane concentration in the borehole air was 85 vol%, while in the sediment, it did not exceed 747.5 nmol g−1 (volumetric gas content 2.8 vol% of permafrost soil) (Figure 2). The borehole drilled on the floodplain in 2012 had the same layer structure down to the bottom at 15 m; however, we did not find any methane in the borehole air.
The high methane concentration of the gas sample from the borehole allowed us to test its radiocarbon age. It was 12,124 ± 55 years (Sample No. KIA-35,115 taken from the 20-m depth in the borehole 3,4-07). In contrast, the radiocarbon age of the enclosing soils was slightly younger than 30,696 ± 394 years (J-5,829) (see Figure 2).
Stable carbon isotopes of the methane in the borehole air (δ13C = −85‰) were in the range of δ13C variations of the methane degassed from the sediments, suggesting biological origin of the gas [39]. Heavier methane homologues usually found in geological gaseous hydrocarbons [40] were not observed at this depth, supporting the contention that the methane in the air from the borehole was of microbial origin and coming from the permafrost sediment.
In Yamal [19], the section was composed of Pleistocene marine silts with no observable ice inclusions. Within the interval of 29–130 m, the sand bands occurred in the silts. The banded silts were covered by marine sands down to 10 m below the surface. All of the marine strata contained no visible ice inclusions and had ice content of about 35%. The upper part of the section was composed of alluvial silts with a high ice content. Most of the gas blowouts in Bovanenkovo were within the interval of 28–150 m. The rate of the gas flow varied from 50–14,000 m3 d−1. The gas contained more than 97% of CH4, in which the δ13C value varied from −70–−75‰, indicating the dominant biological genesis of methane. However, at one of the levels, the gas mixture contained heavier alkanes, which points to the contribution of deeper geogenic gas.

3.2. Experimental Findings

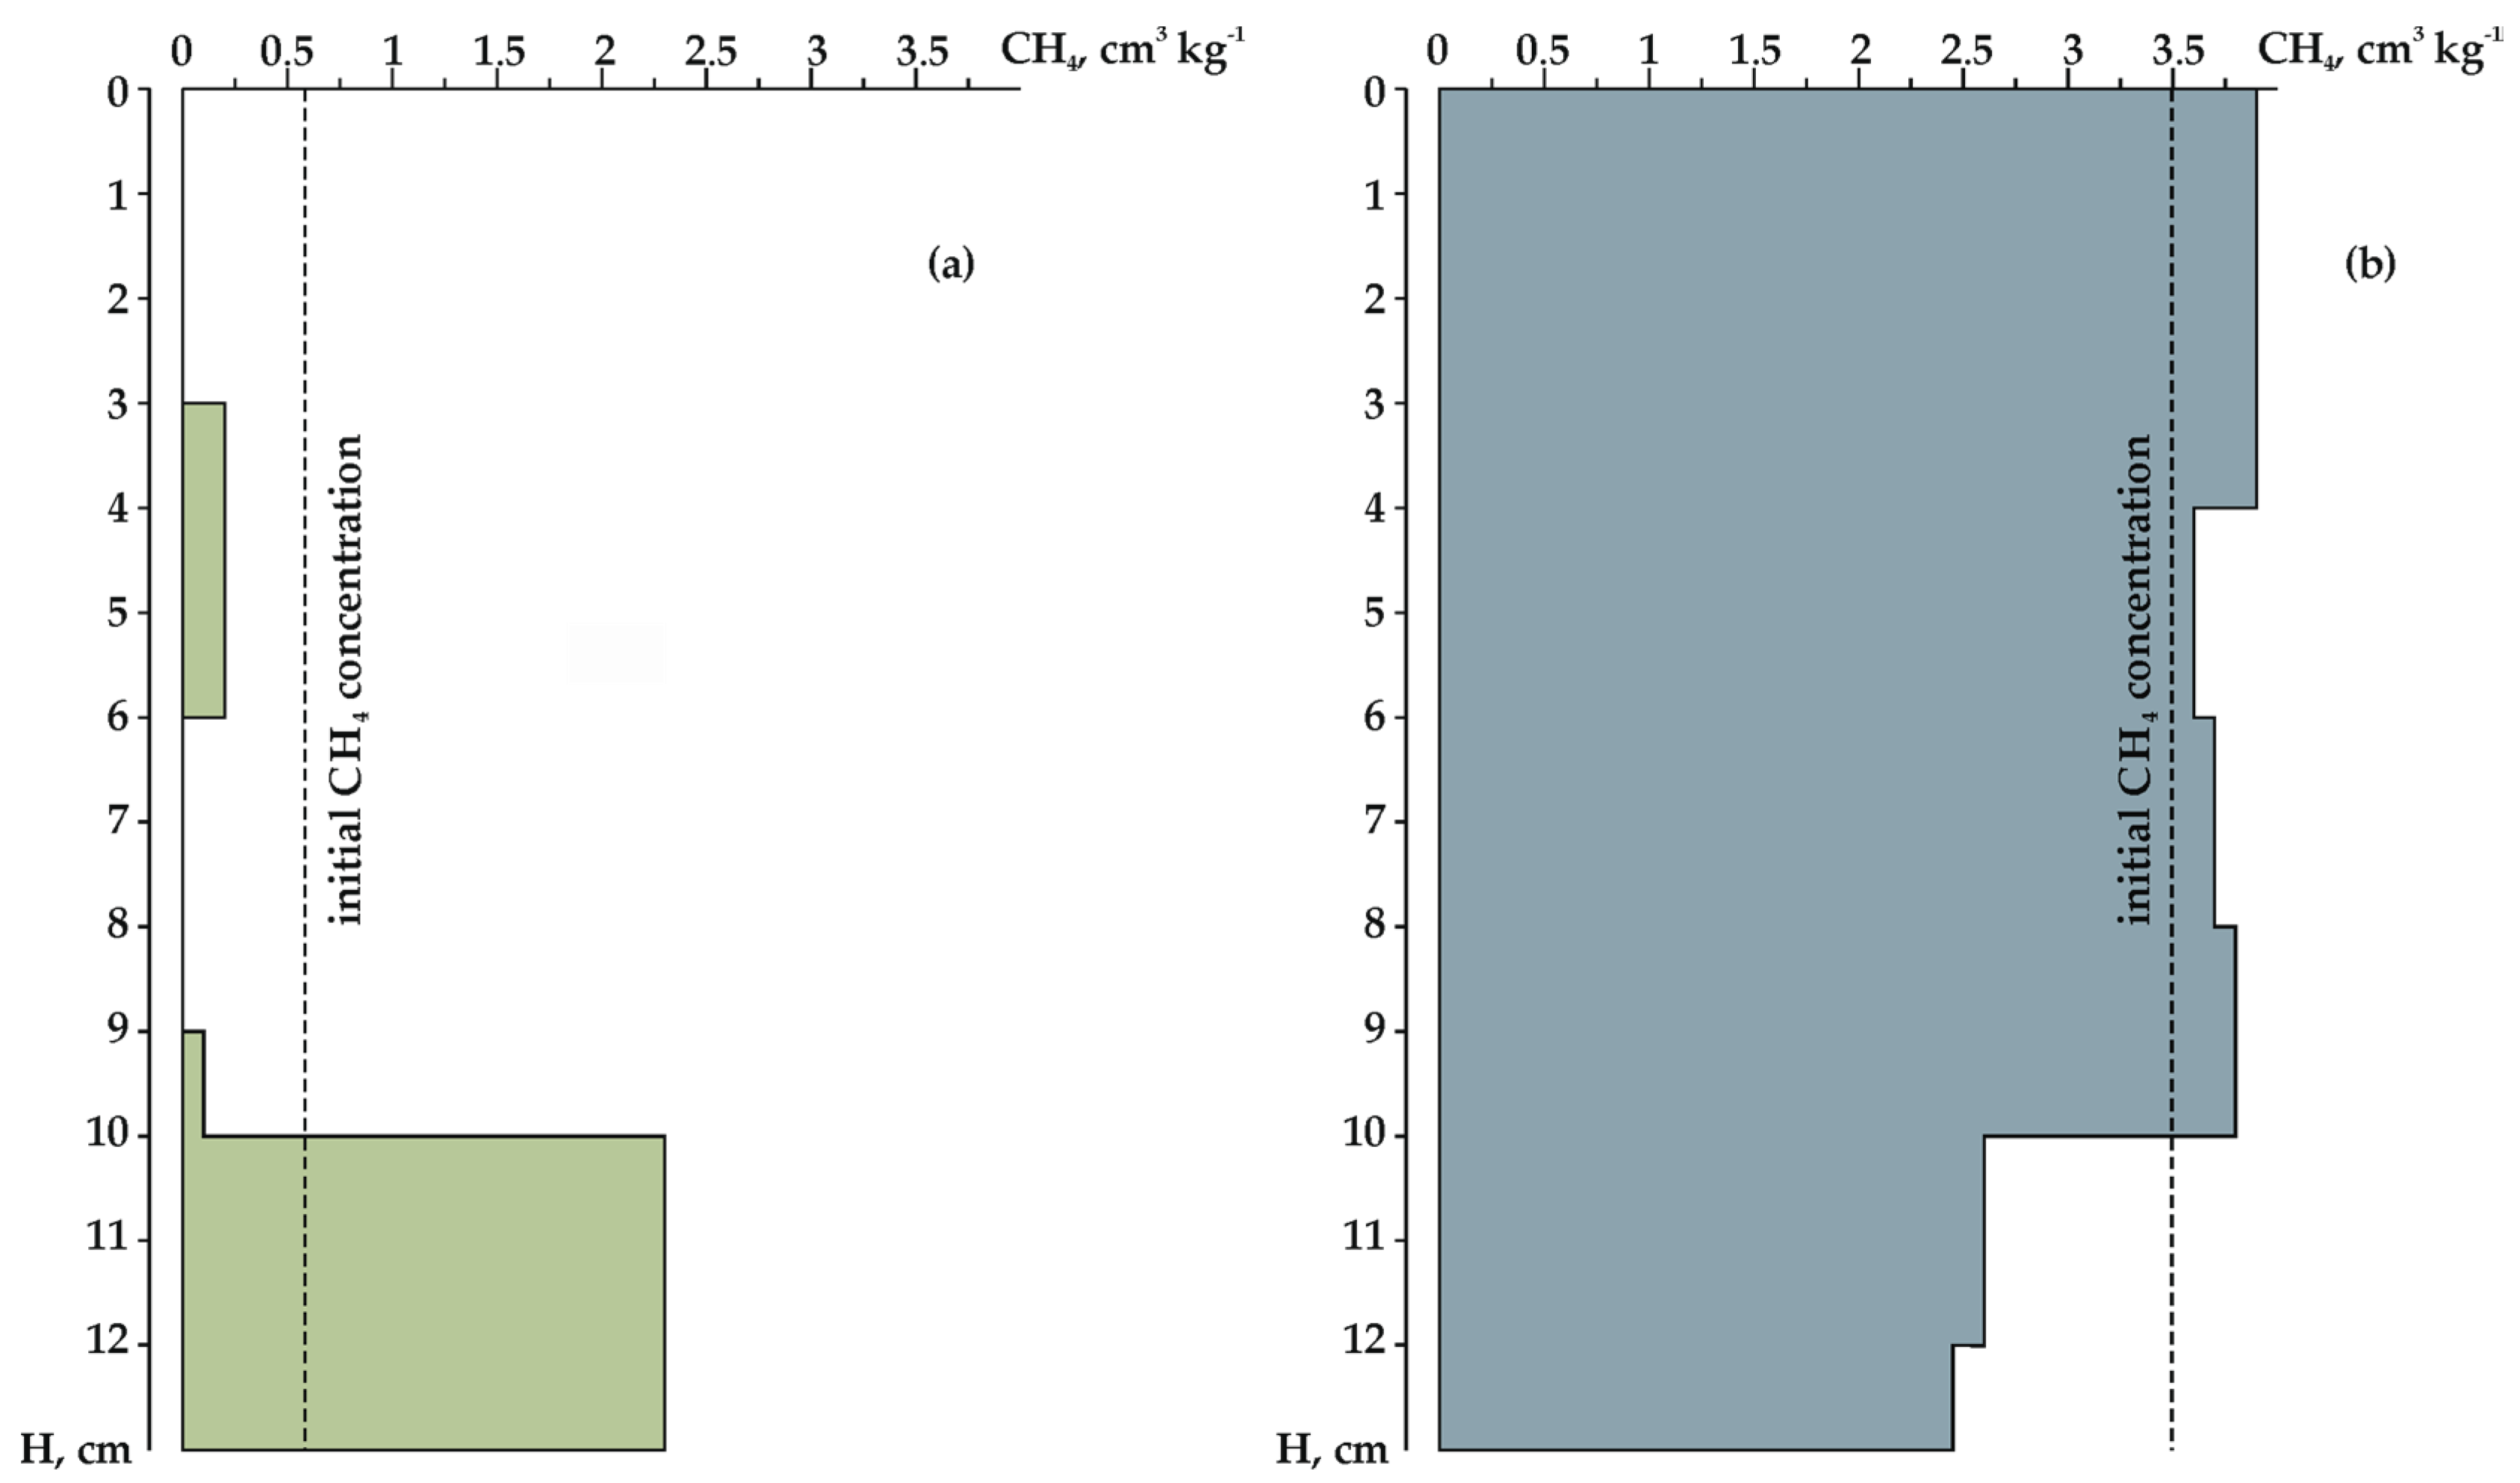
After freezing, the sand had a uniform cryogenic structure with no pronounced ice inclusions, while silt had 1–2 mm-thick periodic ice layers, indicating water migration. The sand contained 0–0.5 cm3 kg−1 of methane in the upper layers, but this increased to 2.3 cm3 kg−1 at the base of the monolith (Figure 4a). This contrasts with the silt (Figure 4b), where methane concentrations after freezing were higher (3.8 ± 0.2 cm3 kg−1) in the upper 10 cm and lower at the bottom (2.5 ± 0.1 cm3 kg−1).

4. Discussion

4.1. Evidence of Cryogenic Transport of Methane

The concentration of methane in the sediments of the former thaw bulb disclosed by the borehole 3,4-07 generally follows the genetic conditions more or less favorable for methanogenesis, except for the mire deposits of Profile-Unit 4 (Figure 2). The river alluvium (Profile-Unit 3) had lower methane concentration than the succeeding lacustrine sediments (Profile-Unit 2). Consequently, the methane fluxes in these two environments differ in the same way [41]. Given the average concentration in the core, the cylinder of permafrost of 1.1–1.4 m in diameter around the borehole should have thawed to fill its volume with methane to the concentration of 85 vol%, which our drilling team neither had observed, nor experienced. We suppose there was an additional source of methane: the methane accumulation in lithological or permafrost pocket, which was disclosed in the bottom of the borehole 3,4-07 at 23.0 m. The fact that the source was deeper than 15 m was supported by the lack of methane in the nearby shallower borehole drilled in 2012. The age of sediments on the depths 15–23 m, assuming the steady state of sedimentation, lies within 20–30 thousand years BP, as deduced from the radiocarbon dates (see Figure 2). The methane from the borehole was 8–18 thousanf years younger. Such a difference in the radiocarbon ages of the methane and the embedding sediments suggests downward displacement of younger carbon from the upper horizons. Either methane, or methane precursors like CO2, acetate, etc., should have migrated downwards through the soil before or during the freezing. The fact that methane filled the borehole soon after reaching Profile-Unit 4 suggests that it had been under pressure in the pores and cavities in the permafrost. This supports the hypothesis that the methane was displaced about 11 meters downwards in gaseous form during freezing of the soil. The redistribution of methane also explain nearly equal methane δ13C in this part of the section. No methane was found in the 2012 borehole, likely because we had not reached any layer composed of coarse-grained sediments that had stored the methane in the 3,4-07 borehole.
The distribution of ice inclusions across the section in Yamal points to the fact that marine sediments were deposited in the thawed state. The permafrost could not have started development before the sand bands started to accumulate, because they indicate the environment of a shallower sea. Freezing of marine deposits is a classical case of the forming of epigenetic permafrost. Biogenic methane disclosed by the borehole in these sediments tended to accumulate in the sandy layers, obviously having high permeability, and serving as the lithological trap during permafrost development [16,19]. We assume these accumulations are similar to our finding in the borehole 3,4-07. The fact that the methane in the accumulation at Kolyma Plain was younger than the bearing sediments is the first evidence of the fact that the freezing of methane-enriched soils contributed to the formation of methane accumulations in permafrost.
Combined with our experimental findings, the natural evidence point at the mechanism of redistribution of methane in freezing soils. Methanogenesis in the active layer is the ubiquitous feature of wet to moist permafrost-affected soils [42]. However, the upper part of the active layer, exposed to the lowest temperatures and thus the highest freezing rates since the onset of winter, had rare traces of methane after freezing. On the other hand, the bottom of the active layer and, right below it, the recurrently thawing soils of the transient layer or the upper parts of Cover Layer were enriched with methane (Figure 3a,b). The patterns of methane in the frozen soils remind of the experiment with the sands in which the gas was displaced down and accumulated, with the permafrost table acting as the gas-impermeable layer.
The process of pushing excess water upon fast freezing was paid little attention to in the literature. On the other hand, the displacement of salt ions and oil by the freezing front was described in earlier papers [27,28]. The theoretical basis was mostly concentrated on the opposite process of water migration towards the solid interface between frozen and thawed soil, known as the freezing front, which forms cryogenic structures in permafrost and causes heaving [43,44,45]. The water migration toward the freezing front might have contributed to the homogenic methane distribution in our experiment with silts. In the section below, we provide the theoretical background for the processes involved in the displacement of methane.

4.2. Conceptual Model of Methane Transport in Freezing Soils

The freezing front follows the temperature gradient from cooler to warmer locations. The temperature at the freezing front is below zero, and a cooling zone forms ahead of it. The fall of temperature in the cooling zone drives the pressure drop, creating the cryogenic suction, which forces water to flow to the cooling zone through the capillaries and pre-melted films on the surface of soil particles, forming a band of ice at the freezing front. The band grows until the pressure is equal or water is no longer delivered. Movement of the freezing front is determined by temperature and soil properties, including mineralogy, grain size and moisture content. However, when the freezing front moves faster than the water flows to it, the pressure of the ice penetrating into the pores pushes the excessive water out [46]. These processes are well described by the revised capillary theory [45].
The revised capillary theory is based on the Clapeyron equation [45] (Equation (1)) written for two phases [44], ice and water:
P f = P 0 ρ w L f T m ( T m T ) ( P 0 p i ) ρ w ρ i V × f ( T m T )
where P f is the pore pressure at a “water-ice lens” interface, P 0 the overburden pressure, constants: ρ w the water density, ρ i the ice density, p i the ice pressure, L f the latent heat of ice thawing; T m the temperature of water crystallization, T the temperature at the border of the ice lens, V the rate of water flow to the ice lens and f ( T m T ) the function describing the specificity of the water migration in pre-melted films [47]. The ( T m T ) term defines the level of supercooling.
For example, when the soil is composed of uniform platelets, the water flow to a growing ice lens will be as follows:
V = p r P 0 + ( P 0 p i ) ρ ρ i + ρ L m T m T T m μ h k + 3 φ μ p R 2 2 d 3 .
In Equation (2), the denominator represents the functional relationship of the water flow to a lens to supercooling, which is defined by capillary flow parameters: h the thickness of the supercooled zone, μ the dynamic viscosity of capillary water, k the hydraulic conductivity and water migration in pre-melted films: μ p the dynamic viscosity of water in the film, φ the share of contact area of the ice-lens/particle interface, d the thickness of pre-melted film and R the radius of a soil particle.
Water flow to an ice lens depends on the degree of supercooling below the freezing front and soil properties. The greater the supercooling, the lower the pressure drops on the ice lens surface, which forms the water flow when soil freezes (Figure 5a). When the soil particles are fine, low hydraulic conductivity hinders the water flow. If soil is coarse grained, then the large particle radius increases resistance in the pre-melted film, thus reducing the flow. This is why the highest rate of water suction is found in silts, while Equation (2) would be smaller in sands.
For every soil, there is a supercooling threshold, defined by Equation (3), at which the water suction is highest, which means the ice lens continues to grow.
P m = P R + 2 γ i w r p
where P R is pore water pressure, γ i w the surface energy at the ice-water interface and r p the effective radius of the pores (radius of the pore mouths). Once the supercooling level is higher than the threshold, the freezing front penetrates into the soil pores without water suction to an ice lens (Figure 5b). The more coarse-grained the soil, the less the P m and the earlier the ice enters the pores; in the sands, the ice penetrates the pores and stops water suction earlier than in silts.
To summarize, the water suction conditions exist in the pressure range between the pressure, defined by Equation (1) and the one, defined by Equation (3), within the supercooling range, defined by Equation (4):
ρ w ( P 0 p i ) ρ i P 0 ρ w L f ρ i V × f ( T m T ) > T m T T m 2 γ i w ρ w L f r p
when supercooling is high and Equation (4) takes place neither in the silts, nor in the sands, which is the case for a fast freezing soil, there is no water suction. At high supercooling, ice enters the water-filled pores of the soil with no additional water suction. When the soil is freezing, the ice pressure p i is slightly greater than the atmospheric pressure P 0 [46], which turns V in Equation (3) negative. As the ice freezes in the soil pores, it pushes away the excess water from the ice-water interface. Therefore, for every type of soil there are threshold freezing rates, forcing the water to migrate to the freezing front or forcing the water to be squeezed out of the freezing front.
The methane flux in soil is defined as:
q = k a C a μ a P 2 a P 1 a h + D C 2 C 1 h + V C a
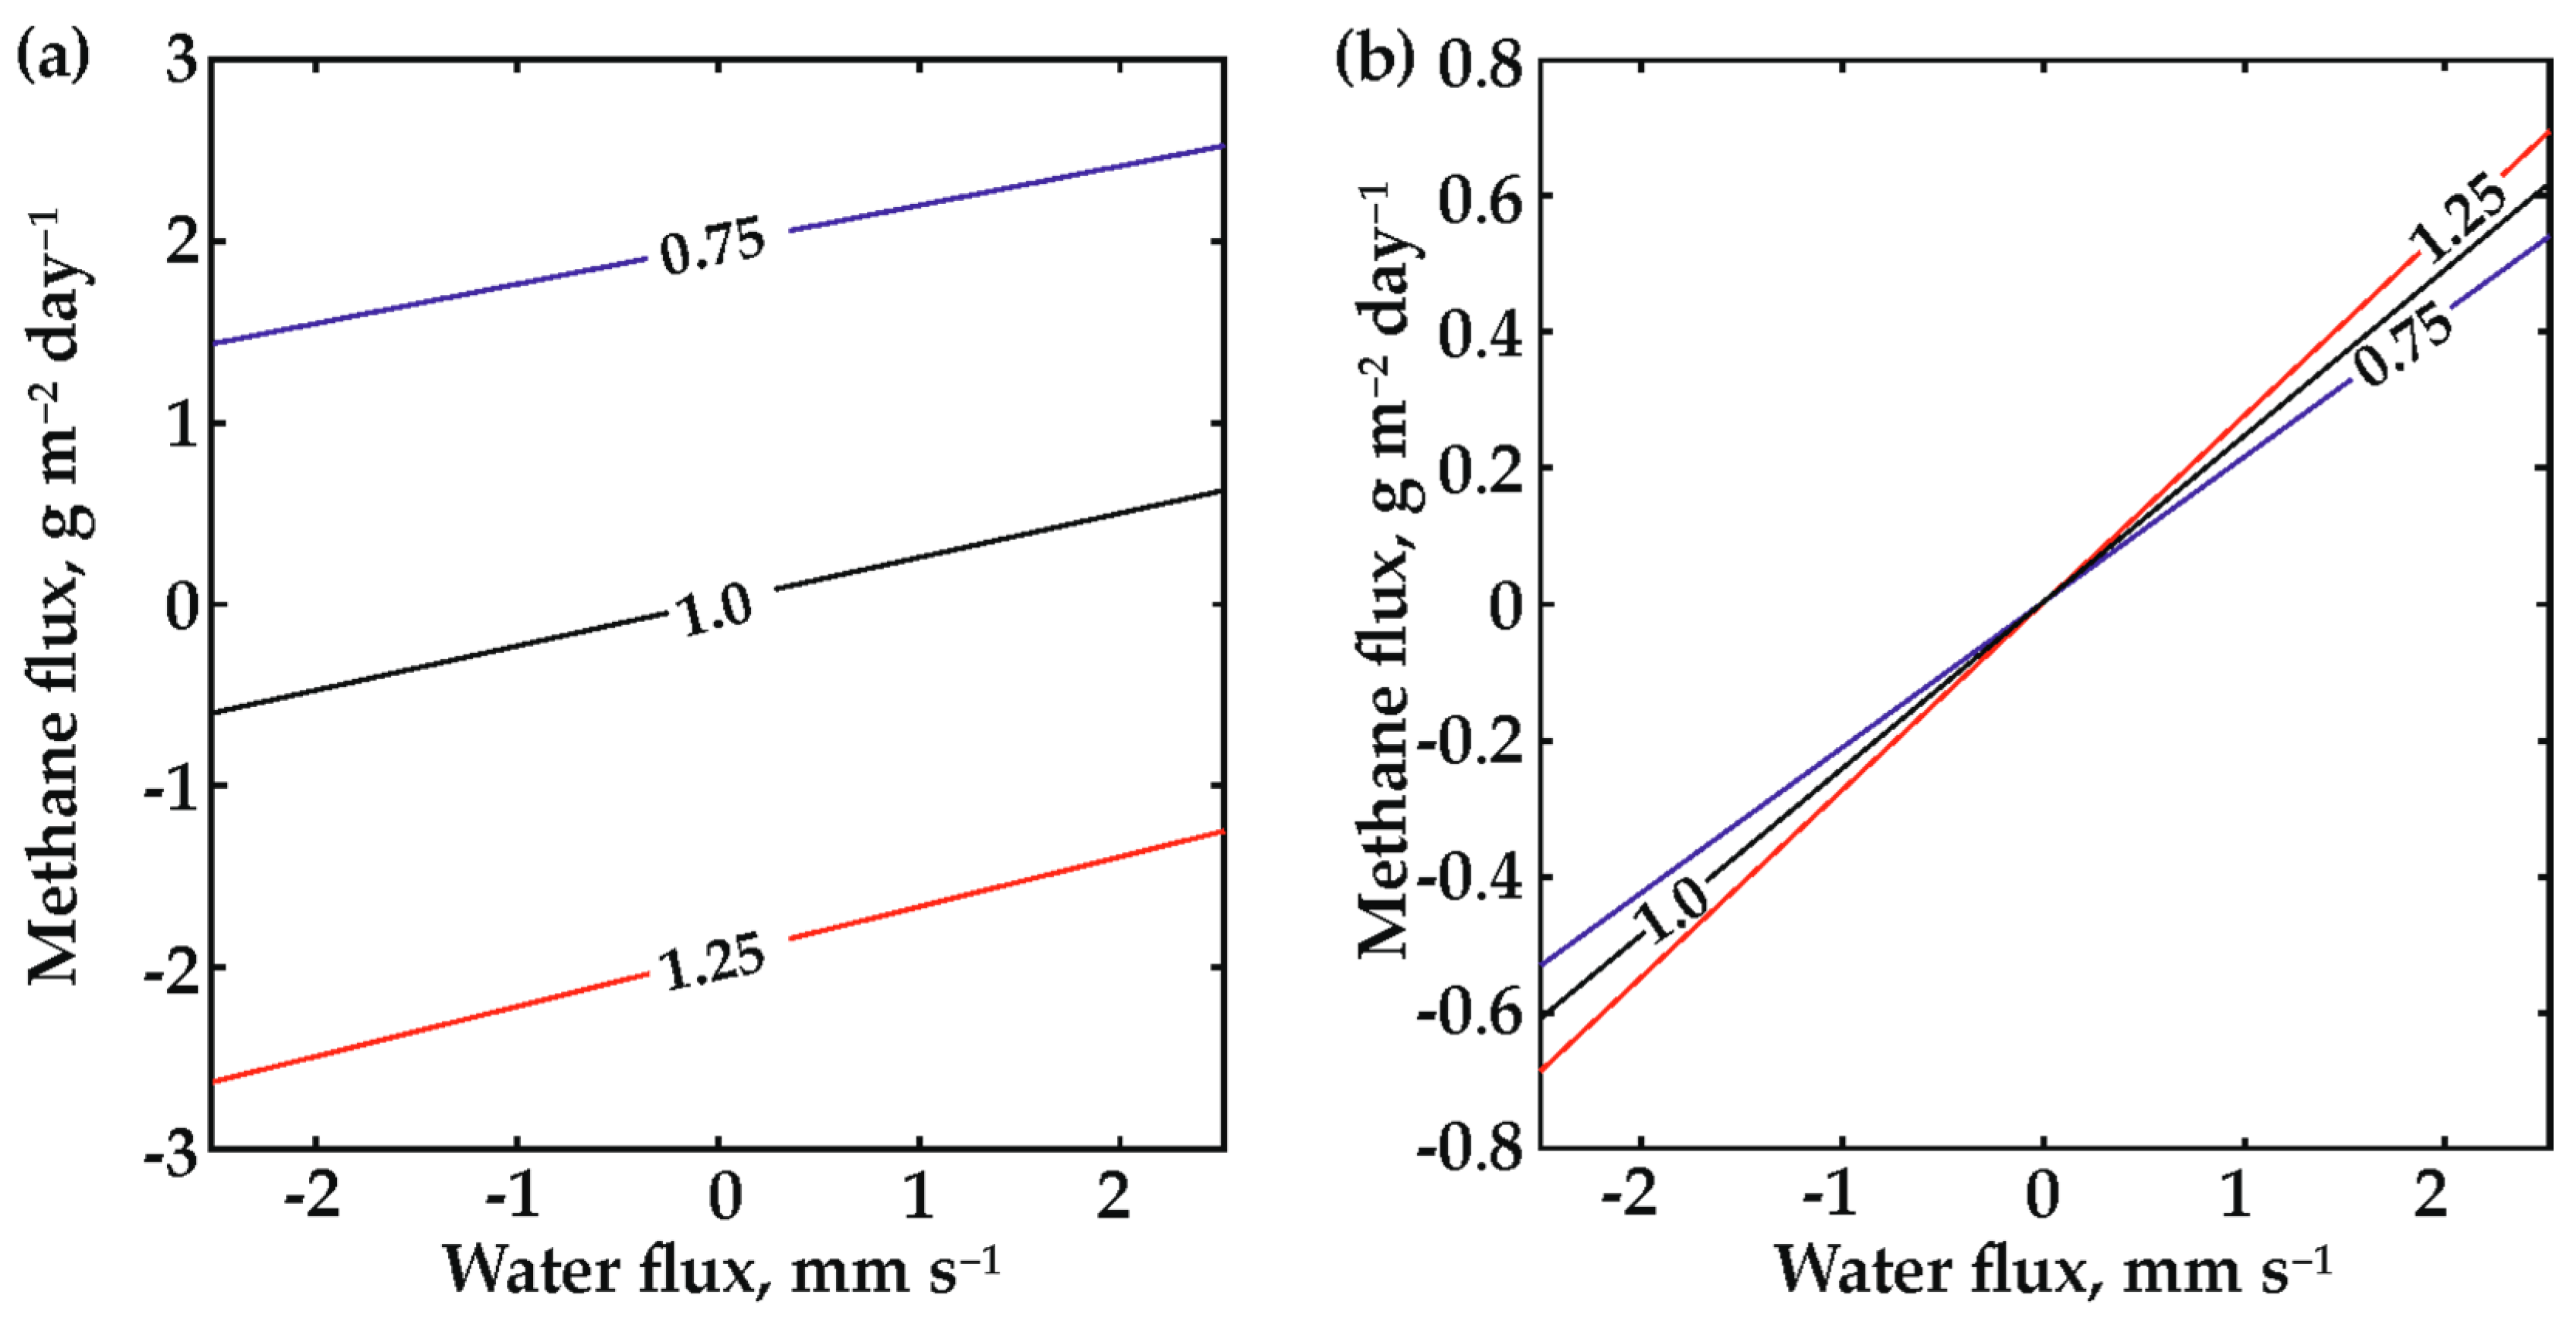
where the first term defines convection ( k a the thermal conductivity of air, μ a the viscosity of air and h the distance between the freezing front and soil water), the second term describes gas phase diffusion and the third term describes the advective flux. The ( C 2 C 1 ) term is the difference between methane concentrations in the freezing layer and deeper soil, and Ca is the average methane concentration. In unsaturated soils (Figure 6a), depending on the methane concentration difference ( C 2 C 1 )   the diffusive redistribution of methane in soil (second term) might dominate the role of the water flux (third term). If methane concentration in the soil is constant (C2 = C1), then redistribution takes place by convection and vertical advection with water flow. Both of these are governed by the pressure at the freezing front, forming either cryogenic suction, or pushing out the water and methane as the ice crystals grow. For saturated soil conditions, the first two terms turns to zero, and the methane flux follows the soil water flux. Depending on the concentration difference, the methane redistribution takes place by directed flux of methane to or from the freezing front (Figure 6b).
The theoretical framework outlines the cryogenic transport mechanism. It shows where and why the methane flux would be following the flow of migrating water in freezing soils. It could be used as a rough estimate of the methane transport process. However, we are unable to use it for precise modelling of the experimental results because it involves many microscopic parameters that have not been measured. The number of unidentified parameters rises when we consider the natural systems due to irregularities of soil texture, unknown freezing rates and methane distribution in the soil. The more effective way would be to set the experimental study to find the effect of the exact rates of freezing front movement in equigranular soils at various freezing gradients.

4.3. Implications for Methane Exchange between Permafrost and Atmosphere

According to the theory, controls for methane displacement through freezing soils are the same as for water migration, including soil properties and freezing temperature, as well as the initial methane concentration in the soil profile. Due to the rate of freezing being one of the main controls on the inclusion of gas bubbles in the freezing medium [47], the cryogenic transport acts for dissolved methane and likewise for bubbles of methane. However, variations in the grain size, inclusion of organic matter, fractures and cavities in soils, uneven layering and permafrost/bedrock topography, combined, result in unequal freezing rates, favoring the formation of lithological pockets, where methane could accumulate.
We consider that the methane in the lab experiment with silts has followed the water suction towards the freezing front. In sands, the volume expansion of ice during freezing forced water and methane away from the freezing front and created methane accumulation at the impermeable interface at the bottom. As the theory says, the same situation might have occurred in the silts at a different freezing rate.
According to the character of soils and ice inclusions in the studied cores, we may conclude that the borehole 3,4-07 site has gone through environmental changes, as shown in Figure 7. Organic decomposition in the lack of oxygen conditions during the lake existence and thaw bulb formation leads to methane formation and accumulation both in young lacustrine deposits and other deposits that compose the thaw bulb. Methanogenesis had been developing in the thawed sediments of the thaw bulb until it got frozen, even at low temperatures in the wide occurrence of methanogenic substrate, as shown in the laboratory analyses [25]. The freezing of the thaw bulb could have started at the final stages of Profile-Unit 2 accumulation, when the lake filled with sediments or started draining (or drying up). The closed freezing of the sediments took place after the lake drainage. It happened synchronously with the accumulation of the boggy sediments of Profile-Unit 1 (Figure 7b), earlier than 10 thousand years ago, according to the radiocarbon dating. The freezing might have first formed an impermeable layer of frozen ground in the Profile-Unit 1 sediments. Fast freezing of the silts right after their exposure at the bottom of the lake created a pressure gradient, and accumulation of water and methane in the upper part of the section: silty Profile-Units 1 and 2 (see Figure 2). Under the layer of frozen ground, the methanogenesis continued to develop in deeper soil layers, and driven by diffusion, methane accumulated and redistributed further (this is generally supported by the quasi-stable isotopic composition of methane in Profile-Unit 3). The freezing continued and pushed a large portion of methane down to the coarse-grained Profile-Unit 4, which, due to its low ice (or water) content, had a considerable volume of free pores. The methane accumulated in the pores (Figure 7c) and was stable until the borehole liberated it.
Thus, the freezing conditions define the type of distribution of methane in permafrost either as uniform or as locally concentrated in traps. Even if we take the maximal concentration found in the core to calculate the contribution of ancient methane from thawing permafrost, we will have a flux of only 15 g C(CH4) m−2 per 1 m of thawing. This is negligible compared to the fluxes from the decomposition of permafrost soil carbon [7], although the methane is more easily involved in biogeochemical processes. In contrast, the emission of solely methane from the pocket that filled the volume from the borehole 3,4-07 created a flux of at least 2673 g C(CH4) m−2 from the borehole mouth, which is high, but declining in time depending on the volume of the pocket.
As permafrost forms and degrades under environmental or climatic changes over the ranges from several to thousands years, the methane from the past accumulations can contribute to the current biogeochemical cycle in a discrete manner. The location of methane accumulations could be predicted from the conditions both favorable for methane production and freezing at rates favorable for cryogenic displacement of methane. Such conditions were found in refrozen thaw bulbs and under the active layer, although not regularly (see Table A2 and Table A3). Despite we might find similar conditions in other habitats, we cannot extrapolate the large fluxes locally observed from such pockets to the whole area of permafrost. The volume of methane stored in the pockets is finite, as there is no acting persistent source of it.
The occurrence of the pockets could be tracked by methane blowouts during drilling documented widely in the permafrost zone from Yamal to Chukotka [19] deeper than 28 m in disperse Quaternary sediments. We believe that deep sea or lake waters or modern exogenic processes form weakened thaw zones in permafrost that provide channels for such methane accumulations, entrapped in permafrost to escape.
It is generally accepted that the Yamal crater near Bovanenkovo developed due to a gas explosion under the pingo [13,14]. It remains unclear where the methane in permafrost had come from that site. Pingos are widely formed in the process of freezing of thaw bulbs under thawed lakes [48], and the mechanisms of cryogenic transport could create the methane accumulation during the freezing. We suggest that biogenic methane accumulated in the lithological trap after freezing of the thaw bulb, and the formation of pingo could have contributed to other sources of methane (including the gas from the gas field or deep methane coming through the fault zones into permafrost). The timing of freezing and the rate of biogenic methanogenesis have to be understood to define the share of the cryogenic displacement process in the formation of methane accumulations able to blow-up the unstable permafrost cover.
The high methane fluxes observed from thermokarst lakes and the East Siberian Arctic shelf may be attributed to the scattered lithological pockets. The storage of methane in these pockets could not be detected with surface methane emission measurements or by remote sensing. Cryogenic displacement of the trapped methane from the place of origin makes soil carbon content a poor indicator, as well. Surface geophysics works better at identifying the pockets underground, but the studies of the gas concentration in the pores are still required to identify the amounts and the form (gas or gas-hydrate) of the methane stored. To accurately predict the locations of the methane accumulations in permafrost and their blow-up susceptibility, paleoenvironmental studies are necessary.
The wide occurrence of the cryogenic displacement at lower scale (with lower methane concentrations) could be found during seasonal freezing. Findings of methane at the bottom of the active layer and deeper in the transient layer suggest that the freezing allows methane to be preserved during winter. At a shallower depth than in permafrost, it is exposed to lower temperatures and high freezing rates. This methane might participate in sudden winter fluxes observed widely when frost cracking or mud pot forming occurs [49,50,51]. During thawing of the active layer, this methane might enter the methane exchange between soil and atmosphere either forming the sudden flux or assimilated by the methanotrophs.

5. Conclusions

High methane fluxes observed in the places of permafrost degradation under thermokarst lakes, seawaters or the mechanical disturbance of permafrost deposits are not always associated with increased organic matter decomposition or fault/fracture zones. Biogenic methane fills the pores of permafrost and locally could form larger accumulations with the concentrations up to 400 cm3 dm−1. Methane concentration and the likelihood of the formation of such accumulations depend on how favorable the conditions for methanogenesis and for the burial of gaseous methane were. Freezing of thick strata of epigenetic permafrost, especially in thaw bulbs, could create the gas-impermeable systems with increasing pressure and continuous methane formation. Disclosure of such accumulations in Yamal showed the fluxes of up to 14,000 m3 day−1 of gas, and in Kolyma lowland, the flux density of more than 2500 g C(CH4) m−2 was observed.
Such accumulations were formed due to uneven freezing of the methane-enriched thawed strata via the mechanism of cryogenic displacement. It acts due to the uneven distribution of the freezing rate in heterogeneous soils, squeezing excess water and methane from the soil pores with penetrating ice. Cryogenic displacement transports methane through the freezing soils to distances from tens of centimeters, as shown in the lab experiment, to several meters, as proven by the radiocarbon dating of methane from Kolyma borehole. The methane tends to be trapped in the lithological pockets surrounded by the soils with low gas permeability. The coarse-grained inlets, bands of sand in the silt strata or the interface of thawed ground with the impermeable permafrost table tend to favor the methane accumulation.
The concentration of methane in freezing soil, the freezing conditions and the soil composition are the primary controls on the cryogenic displacement of methane and hence on methane accumulation formation. The prediction of high methane accumulations should thus rely on the studies of methane transport rates at different freezing rates, studies of soil properties in the whole geological section and permafrost development. These could give insight to the location of permafrost methane accumulations and their susceptibility to liberate upon any surficial changes, possibly forming features like the Yamal crater.
Addressing the questions of the permafrost methane as the time-bomb, we would say it depends on the spatial and temporal scale. It definitely has an instant explosive character, as seen in the case of Yamal crater. The fluxes of methane from the pockets are either oxidized when they explode or pass the oxidation when liberating to the air from the stressed conditions. On the other hand, this source of methane in permafrost is limited in time and space to create an effect large enough to significantly affect the greenhouse gas concentration in the atmosphere, but it changes timing of methane emissions.

Acknowledgments

The authors thank Axel Steinhof, Iris Kuhlmann and Lutz Schirrmeister for assistance with sample processing and Dmitry Fedorov-Davydov for his input to the methane sampling. The authors thank Susan Trumbore for the consultations during the manuscript preparation, two anonymous reviewers for their constructive comments, which helped improve the text, and Dina Kraeva and John Gash who significantly improved the language. Parts of this study were supported by the Max Planck Society grant to Gleb Kraev to promote scientific cooperation with foreign countries, the grant program of the Russian Foundation of Basic Research 12-05-01085, Russian Scientific Fund (14-14-01115), NSF awards (PLR-1304555, PLR-1417908) and the grant of the President of the Russian Federation (MK-9417.2016.5). The latter has provided funds for this open-access publication.

Author Contributions

G.K. and E.R. designed the study. G.K. collected field data. A.K. performed drilling in 2007 and 2012. G.K., E.-D.S. and E.R. carried out isotopic analyses. E.C. worked out the hypothesis of the cryogenic displacement of the gas. A.Y. and G.K. provided the mathematical description of the process. All co-authors contributed to the manuscript.

Conflicts of Interest

The authors declare no conflict of interest. The founding sponsors had no role in the design of the study; in the collection, analyses or interpretation of data; in the writing of the manuscript; nor in the decision to publish the results.

Appendix A. Data on the Properties and Distribution of Methane in Permafrost

Table A1. Methane concentration and isotopic composition in the sediments extracted from the core in Kolyma floodplain, Borehole 3,4-07.
Sedimentary Unit NumberSoil CompositionDepth, mItot 1CH4, nmol g−1CH4, cm3 kg−1δ13C(CH4), ‰
4Fine silty sandy loam, rusty1.10.55121.8 ± 6.32.7 ± 0.1−69.7
1.60.7818.9 ± 0.60.4 ± 0.0
2.10.569.4 ± 0.50.2 ± 0.0
2.60.5924.9 ± 1.10.6 ± 0.0
3Alternating fine and coarse sandy loam layers3.60.44499.7 ± 17.411.2 ± 0.4−81.5
4.10.37612.0 ± 42.713.7 ± 1.0−70.6
4.60.34387.2 ± 13.78.7 ± 0.3−68.1
5.60.45254.6 ± 9.05.7 ± 0.2
6.10.32370.3 ± 13.68.3 ± 0.3
6.60.27254.2 ± 10.75.7 ± 0.2−80.2
Thin silty sand7.10.24359.6 ± 13.48.1 ± 0.3
Fine silty sandy loam with detritus7.60.32362.1 ± 16.08.1 ± 0.4−83.1
8.60.33321.1 ± 8.37.2 ± 0.2
9.20.1989.5 ± 2.42.0 ± 0.1
2Coarse sandy loam10.10.2223.7 ± 0.80.5 ± 0.0−78.8
Coarse silty sandy loam11.10.19158.3 ± 5.53.6 ± 0.1−84.1
12.20.23295.1 ± 8.76.6 ± 0.2−84.1
Fine sand13.10.24310.3 ± 8.77.0 ± 0.2
14.50.26313.8 ± 8.47.0 ± 0.2−84.4
Coarse sandy loam15.50.19173.3 ± 5.13.9 ± 0.1
160.21224.0 ± 5.75.0 ± 0.1
Fine sand16.50.24107.8 ± 2.92.4 ± 0.1
17.10.2272.9 ± 3.01.6 ± 0.1
17.50.27105.8 ± 3.52.4 ± 0.1−83.1
18.10.29123.8 ± 4.42.8 ± 0.1
190.2179.5 ± 3.11.8 ± 0.1
Coarse sandy loam19.70.2364.9 ± 2.41.5 ± 0.1
20.70.25747.5 ± 51.116.7 ± 1.1−84.8
21.20.27442.9 ± 16.09.9 ± 0.4
21.60.23155.3 ± 4.63.5 ± 0.1
1Pebble filled with coarse sandy loam22.30.27502.8 ± 14.911.3 ± 0.3−86.2
22.40.23144.8 ± 4.93.2 ± 0.1−85.6
23.20.2279.0 ± 2.51.8 ± 0.1−83.5
1 Total ice content, unit mass fraction.
Table A2. Methane concentration in the active layer and periodically thawed layer of permafrost.
YearStudy SiteALT 1, mBorehole/PitLayerDepth, mCH4, nmol g−1CH4, cm3 kg−1
2005Plahinsky Yar0.81001Active layer03.5 ± 0.00.0 ± 0.0
0.0700
0.141.6 ± 0.10.0 ± 0.0
1002Active layer000
0.050.3 ± 0.20.0 ± 0.0
0.120.2 ± 0.00.0 ± 0.0
0.180.9 ± 0.00.0 ± 0.0
0.231.6 ± 0.40.0 ± 0.0
1003Active layer06.5 ± 2.00.2 ± 0.1
0.0500
0.1200
2006Old Allaiha0.445Transient layer0.83.1 ± 1.70.1 ± 0.0
0.93.3 ± 1.40.1 ± 0.0
110.4 ± 1.80.2 ± 0.0
Old Allaiha Floodplain0.44L1Transient layer0.4414.3 ± 1.90.3 ± 0.0
0.493.3 ± 1.40.1 ± 0.0
0.59118.2 ± 18.72.7 ± 0.4
Khaptashinsky Yar0.443Active layer0.43.5 ± 0.90.1 ± 0.0
0.444Active layer0.42.8 ± 0.50.1 ± 0.0
Khaptashinsky Yar, alas0.44A1Active layer0.37489.1 ± 33.111.0 ± 0.7
Transient layer0.47389.6 ± 28.38.7 ± 0.6
0.522.7 ± 0.70.1 ± 0.0
A2Active layer0.29193.7 ± 16.34.3 ± 0.4
0.3912.7 ± 1.10.3 ± 0.0
Transient layer0.49270.6 ± 48.26.1 ± 1.1
Khaptashinsky Yar, marine terrace0.32M3Transient layer0.37128.7 ± 20.42.9 ± 0.5
0.47155.8 ± 25.93.5 ± 0.6
0.5794.6 ± 15.62.1 ± 0.4
2007Kolyma Floodplain0.843,4Transient layer0.493.0 ± 4.52.1 ± 0.1
0.535.3 ± 1.90.8 ± 0.0
0.6381.9 ± 16.38.6±0.4
1 Active layer thickness.
Table A3. Methane concentration in Yedoma and the Holocene Cover Layer.
YearStudy SiteCLB 1, mALT 2, mBoreholeLayerDepth, mCH4, nmol g−1CH4, cm3 kg−1
1990Exposure 272.40.447Cover layer0.7669.6 ± 85.915.0 ± 1.9 *
2.326.8 ± 3.40.6 ± 0.1 *
Yedoma3.800 *
1992Volchy Log2.80.447Cover layer0.929.9 ± 3.80.7 ± 0.1 *
1.975.0 ± 9.61.7 ± 0.2 *
2004Old Allaiha3.70.395Cover layer0.800
1.300
1.641.1 ± 4.40.9 ± 0.1 **
1.900
2006Khaptashinsky Yar2.20.442Cover layer0.62.8 ± 1.90.1 ± 0.0
0.741.8 ± 8.10.9 ± 0.2
0.8163.4 ± 26.23.7 ± 0.6
Yedoma3.84.5 ± 1.40.1 ± 0.0
0.443Cover layer0.548.7 ± 8.61.1 ± 0.2
0.6155.4 ± 23.53.5 ± 0.5
0.783.8 ± 14.11.9 ± 0.3
0.444Cover layer0.54.7 ± 1.80.1 ± 0.0
0.65.0 ± 1.60.1 ± 0.0
2.13.7 ± 2.00.1 ± 0.1
Yedoma4.05.0 ± 2.50.1 ± 0.1
2007Ust’-Omolonsky Yar20.411Cover layer0.51.7 ± 0.10.0 ± 0.0
0.68.7 ± 0.30.2 ± 0.0
0.77.0 ± 0.40.2 ± 0.0
1.314.4 ± 0.70.3 ± 0.0
1.75.2 ± 0.30.1 ± 0.0
0.412Cover layer1.30.6 ± 0.10.0 ± 0.0
1.71.0 ± 0.20.0 ± 0.0
Yedoma2.200
2008Duvanny Yar1.50.411Cover layer1.53.0 ± 0.20.1 ± 0.0 **
1 Depth of Cover Layer bottom; 2 active layer thickness, based on CALM data; * uncertainty values recalculated from the average measured uncertainties in the subset; ** uncertainty associated with chromatographic measurements recalculated from the average measured chromatographic uncertainties in the subset.

References

  1. Zimov, S.A.; Voropaev, Y.V.; Semiletov, I.P.; Davidov, S.P.; Prosiannikov, S.F.; Chapin, F.S., III; Chapin, M.C.; Trumbore, S.; Tyler, S. North Siberian lakes: A methane source fueled by Pleistocene carbon. Science 1997, 277, 800–802. [Google Scholar] [CrossRef]
  2. Walter, K.M.; Edwards, M.E.; Grosse, G.; Zimov, S.A.; Chapin, F.S., III. Thermokarst lakes as a source of atmospheric CH4 during the last deglaciation. Science 2007, 318, 633–636. [Google Scholar] [CrossRef] [PubMed]
  3. Walter Anthony, K.M.; Anthony, P.; Grosse, G.; Chanton, J. Geologic methane seeps along boundaries of Arctic permafrost thaw and melting glaciers. Nat. Geosci. 2012, 5, 419–426. [Google Scholar] [CrossRef]
  4. Shakhova, N.; Semiletov, I.; Salyuk, A.; Yusupov, V.; Kosmach, D.; Gustafsson, Ö. Extensive methane venting to the atmosphere from sediments of the East Siberian Arctiс shelf. Science 2010, 327, 1246–1250. [Google Scholar] [CrossRef] [PubMed]
  5. Zimov, S.A.; Schuur, E.A.G.; Chapin, F.S., III. Permafrost and the global carbon budget. Science 2006, 312, 1612–1613. [Google Scholar] [CrossRef] [PubMed]
  6. Anisimov, O.A. Potential feedback of thawing permafrost to the global climate system through methane emission. Environ. Res. Lett. 2007, 2, 045016. [Google Scholar] [CrossRef]
  7. Schuur, E.A.G.; Bockheim, J.; Canadell, J.G.; Euskirchen, E.; Field, C.B.; Goryachkin, S.V.; Hagemann, S.; Kuhry, P.; Lafleur, P.M.; Lee, H.; et al. Vulnerability of permafrost carbon to climate change: Implications for the global carbon cycle. Bioscience 2008, 58, 701–714. [Google Scholar] [CrossRef]
  8. Tarnocai, C.C.; Canadell, J.G.; Schuur, E.A.G.; Kuhry, P.; Mazhitova, G.; Zimov, S. Soil organic carbon pools in the northern circumpolar permafrost region. Glob. Biogeochem. Cycles 2009, 23, GB2023. [Google Scholar] [CrossRef]
  9. Are, F.E. The problem of the emission of deep-buried gases into the atmosphere. In Permafrost Response on Economic Development, Environmental Security and Natural Resources; Paepe, R., Melnikov, V.P., van Overloop, E., Gorokhov, V.D., Eds.; Springer: Dordrecht, The Netherlands, 2001; pp. 497–509. [Google Scholar]
  10. Lawrence, D.M.; Slater, A.G.; Tomas, R.A.; Holland, M.M.; Deser, C. Accelerated Arctic land warming and permafrost degradation during rapid sea ice loss. Geophys. Res. Lett. 2008, 35, L11506. [Google Scholar] [CrossRef]
  11. Burke, E.J.; Jones, C.D.; Koven, C.D. Estimating the permafrost-carbon climate response in the CMIP5 climate models using a simplified approach. J. Clim. 2013, 26, 4897–4909. [Google Scholar] [CrossRef]
  12. Dmitrenko, I.A.; Kirillov, S.A.; Tremblay, L.B.; Kassens, H.; Anisimov, O.A.; Lavrov, S.A.; Razumov, S.O.; Grigoriev, M.N. Recent changes in shelf hydrography in the Siberian Arctic: Potential for subsea permafrost instability. J. Geophys. Res.-Oceans 2011, 116, C10027. [Google Scholar] [CrossRef]
  13. Bogoyavlensky, V. Gas blowouts on the Yamal and Gydan Peninsulas. GeoExPro 2015, 12, 74–78. [Google Scholar]
  14. Kizyakov, A.I.; Sonyushkin, A.V.; Leibman, M.O.; Zimin, M.V.; Khomutov, A.V. Geomorphological conditions of the gas-emission crater and its dynamics in Central Yamal. Earth’s Cryosphere 2015, 19, 15–25. [Google Scholar]
  15. Rivkina, E.M.; Gilichinsky, D.A. Methane as a paleoindicator of the dynamics of permafrost deposits. Lithol. Miner. Resour. 1996, 31, 396–399. [Google Scholar]
  16. Chuvilin, E.M.; Yakushev, V.S.; Perlova, E.V. Gas and possible gas hydrates in the permafrost of Bovanenkovo gas field, Yamal peninsula, West Siberia. Polarforschung 1998, 68, 215–219. [Google Scholar]
  17. Kraev, G.; Rivkina, E.; Gilichinsky, D. Is the Permafrost Pool of Greenhouse Gases Disastrous? In Proceedings of the EGU General Assembly, Vienna, Austria, 15–20 April 2007. [Google Scholar]
  18. Kraev, G.N. Regularities of Methane Distribution in Permafrost of North-Eastern Siberia and the Forecast of Its Emission to the Atmosphere. Ph.D. Thesis, Institute of Geography, Russian Academy of Sciences, Moscow, Russia, 28 May 2010. [Google Scholar]
  19. Yakushev, V.S.; Chuvilin, E.M. Natural gas and gas hydrate accumulations within permafrost in Russia. Cold Reg. Sci. Technol. 2000, 31, 189–197. [Google Scholar] [CrossRef]
  20. Kraev, G.N.; Schulze, E.D.; Rivkina, E.M. Cryogenesis as a factor of methane distribution in layers of permafrost. Dokl. Earth Sci. 2013, 451, 882–885. [Google Scholar] [CrossRef]
  21. Skorobogatov, V.A.; Yakushev, V.S.; Chuvilin, E.M. Sources of Natural Gas within Permafrost in North-West Siberia. In Proceedings of the 7th International Permafrost Conference, Yellowknife, NT, Canada, 23–27 June 1998. [Google Scholar]
  22. Rivkina, E.; Shcherbakova, V.; Laurinavichius, K.; Petrovskaya, L.; Krivushin, K.; Kraev, G.; Pecheritsina, S.; Gilichinsky, D. Biogeochemistry of methane and methanogenic archae in permafrost. FEMS Microbiol. Ecol. 2007, 61, 1–15. [Google Scholar] [CrossRef] [PubMed]
  23. Krivushin, K.V.; Shcherbakova, V.A.; Petrovskaya, L.E.; Rivkina, E.M. Methanobacterium veterum sp. nov., from ancient Siberian permafrost. Int. J. Syst. Evol. Microbiol. 2010, 60, 455–459. [Google Scholar] [CrossRef] [PubMed]
  24. Shcherbakova, V.; Rivkina, E.; Pecheritsyna, S.; Laurinavichius, K.; Suzina, N.; Gilichinsky, D. Methanobacterium arcticum sp. nov., a methanogenic archaeon from Holocene Arctic permafrost. Int. J. Syst. Evol. Microbiol. 2011, 61, 144–147. [Google Scholar] [CrossRef] [PubMed]
  25. Rivkina, E.; Laurinavichius, K.; McGrath, J.; Tiedje, J.; Shcherbakova, V.; Gilichinsky, D. Microbial life in permafrost. Adv. Space Res. 2004, 33, 1215–1221. [Google Scholar] [CrossRef] [PubMed]
  26. Rivkina, E.; Petrovskaya, L.; Vishnivetskaya, T.; Krivushin, K.; Shmakova, L.; Tutukina, M.; Meyers, A.; Kondrashov, F. Metagenomic analyses of the late Pleistocene permafrost—additional tools for reconstruction of environment conditions. Biogeosciences 2016, 13, 2207–2219. [Google Scholar] [CrossRef]
  27. Chuvilin, E.M. Migration of ions of chemical elements in freezing and frozen soils. Polar Rec. 1999, 35, 59–66. [Google Scholar] [CrossRef]
  28. Chuvilin, E.M.; Naletova, N.S.; Miklyaeva, E.C.; Kozlova, E.V. Factors affecting spreadability and transportation of oil in regions of frozen ground. Polar Rec. 2001, 37, 229–238. [Google Scholar] [CrossRef]
  29. Where is Frozen Ground? National Snow and Ice Data Center. Available online: https://nsidc.org/cryosphere/frozenground/whereis_fg.html (accessed on 15 June 2017).
  30. Sher, A.V. New data on late Cenozoic deposits of the Kolyma Lowland. Int. Geol. Rev. 1980, 22, 643–655. [Google Scholar] [CrossRef]
  31. Circumpolar Active Layer Monitoring Network. Available online: https://www2.gwu.edu/~calm/ (accessed on 7 June 2017).
  32. Shur, Y.; Hinkel, K.M.; Nelson, F.E. The transient layer: Implications for geocryology and climate-change science. Permafr. Periglac. Process. 2005, 16, 5–17. [Google Scholar] [CrossRef]
  33. Popov, A.I. Origin of the deposits of the Yedoma Suite on Primor’ye floodplain of northern Yakutia. Proceeding of the Permafrost Second International Conferenceon USSR Contribution, Yakutsk, Russia, 13–28 July 1973; Sanger, F.J., Hyde, P.J., Eds.; National Academy of Sciences: Washington, DC, USA, 1973; pp. 824–825. [Google Scholar]
  34. Schirrmeister, L.; Siegert, C.; Kunitsky, V.V.; Grootes, P.M.; Erlenkeuser, H. Late Quaternary ice-rich permafrost sequences as a paleoenvironmental archive for the Laptev Sea region of Northern Siberia. Int. J. Earth Sci. 2002, 91, 154–167. [Google Scholar] [CrossRef]
  35. Schirrmeister, L.; Kunitsky, V.; Grosse, G.; Wetterich, S.; Meyer, H.; Schwamborn, G.; Babiy, O.; Derevyagin, A.; Siegert, C. Sedimentary characteristics and origin of the Late Pleistocene Ice Complex on north-east Siberian Arctic coastal lowlands and islands—A review. Quat. Int. 2011, 241, 3–25. [Google Scholar] [CrossRef]
  36. Murton, J.G.; Goslar, T.; Edwards, M.E.; Bateman, M.D.; Danilov, P.P.; Savvinov, G.N.; Gubin, S.V.; Ghaleb, B.; Haile, J.; Kanevskiy, M.; et al. Palaeoenvironmental interpretation of Yedoma silt (Ice Complex) deposition as cold-climate loess, Duvanny Yar, Northeast Siberia. Permafrost Periglac. Process. 2015, 26, 208–288. [Google Scholar] [CrossRef]
  37. Veremeeva, A.; Gubin, S. Modern tundra landscapes of the Kolyma lowland and their evolution in the Holocene. Permafrost Periglac. Process. 2009, 20, 399–406. [Google Scholar] [CrossRef]
  38. McAuliffe, C. GC determination of solutes by multiple phase equilibration. Chemtechnology 1971, 1, 46–51. [Google Scholar]
  39. Whiticar, M.J. Carbon and hydrogen isotope systematics of bacterial formation and oxidation of methane. Chem. Geol. 1999, 161, 291–314. [Google Scholar] [CrossRef]
  40. Bernard, B.B.; Brooks, J.M.; Sackett, W.M. Natural gas seepage in the Gulf of Mexico. Earth Planet. Sci. Lett. 1976, 31, 48–54. [Google Scholar] [CrossRef]
  41. Bastviken, D.; Tranvik, L.J.; Downing, J.A.; Crill, P.M.; Enrich-Prast, A. Freshwater methane emissions offset the continental carbon sink. Science 2011, 331, 50. [Google Scholar] [CrossRef] [PubMed]
  42. Olefeldt, D.; Turetsky, M.D.; Crill, P.M.; McGuire, A.D. Environmental and physical controls on northern terrestrial methane emissions across permafrost zones. Glob. Chang. Biol. 2013, 19, 589–603. [Google Scholar] [CrossRef] [PubMed]
  43. Tyutyunov, I.A. Phase Transformation of Water in Soils and the Nature of Migration and Heaving. In Proceedings of the Permafrost International Conference, Lafayette, IN, USA, 11–15 November 1963; USA National Academy of Sciences: Washington, DC, USA, 1963; pp. 234–238. [Google Scholar]
  44. Konrad, J.M.; Duquennoi, C. A model for water transport and ice lensing in freezing soils. Water Resour. Res. 1993, 29, 3109–3124. [Google Scholar] [CrossRef]
  45. Peppin, S.S.L.; Style, R.W. The physics of frost heave and ice-lens growth. Vadose Zone J. 2013, 12. [Google Scholar] [CrossRef]
  46. Miller, R.D. Freezing and heaving of saturated and unsaturated soils. Highw. Res. Rec. 1972, 393, 1–11. [Google Scholar]
  47. Wei, P.S.; Hsiao, S.Y. Pore shape development from the bubble captured by solidification front. Int. J. Heat Mass Trans. 2012, 55, 8129–8138. [Google Scholar] [CrossRef]
  48. Mackay, J.R. Pingo growth and collapse, Tuktoyaktuk Peninsula Area, Western Arctic Coast, Canada: A long-term field study. Géogr. Phys. Quat. 1998, 52, 271–323. [Google Scholar] [CrossRef]
  49. Mastepanov, M.; Sigsgaard, C.; Dlugokencky, E.J.; Houweling, S.; Ström, L.; Tamstorf, M.P.; Christensen, T.R. Large tundra methane burst during onset of freezing. Nature 2008, 456, 628–630. [Google Scholar] [CrossRef] [PubMed]
  50. Tagesson, T.; Mölder, M.; Mastepanov, M.; Sigsgaard, C.; Tamstorf, M.P.; Lund, M.; Falk, J.M.; Lindroth, A.; Christensen, T.R.; Ström, L. Land-atmosphere exchange of methane from soil thawing to soil freezing in a high-Arctic wet tundra ecosystem. Glob. Chang. Biol. 2012, 18, 1928–1940. [Google Scholar] [CrossRef]
  51. Zona, D.; Gioli, B.; Commane, R.; Lindaas, J.; Wofsy, S.C.; Miller, C.E.; Dinardo, S.J.; Dengel, S.; Sweeney, C.; Karion, A.; et al. Cold season emissions dominate the Arctic tundra methane budget. PNAS 2015, 113, 40–45. [Google Scholar] [CrossRef] [PubMed]
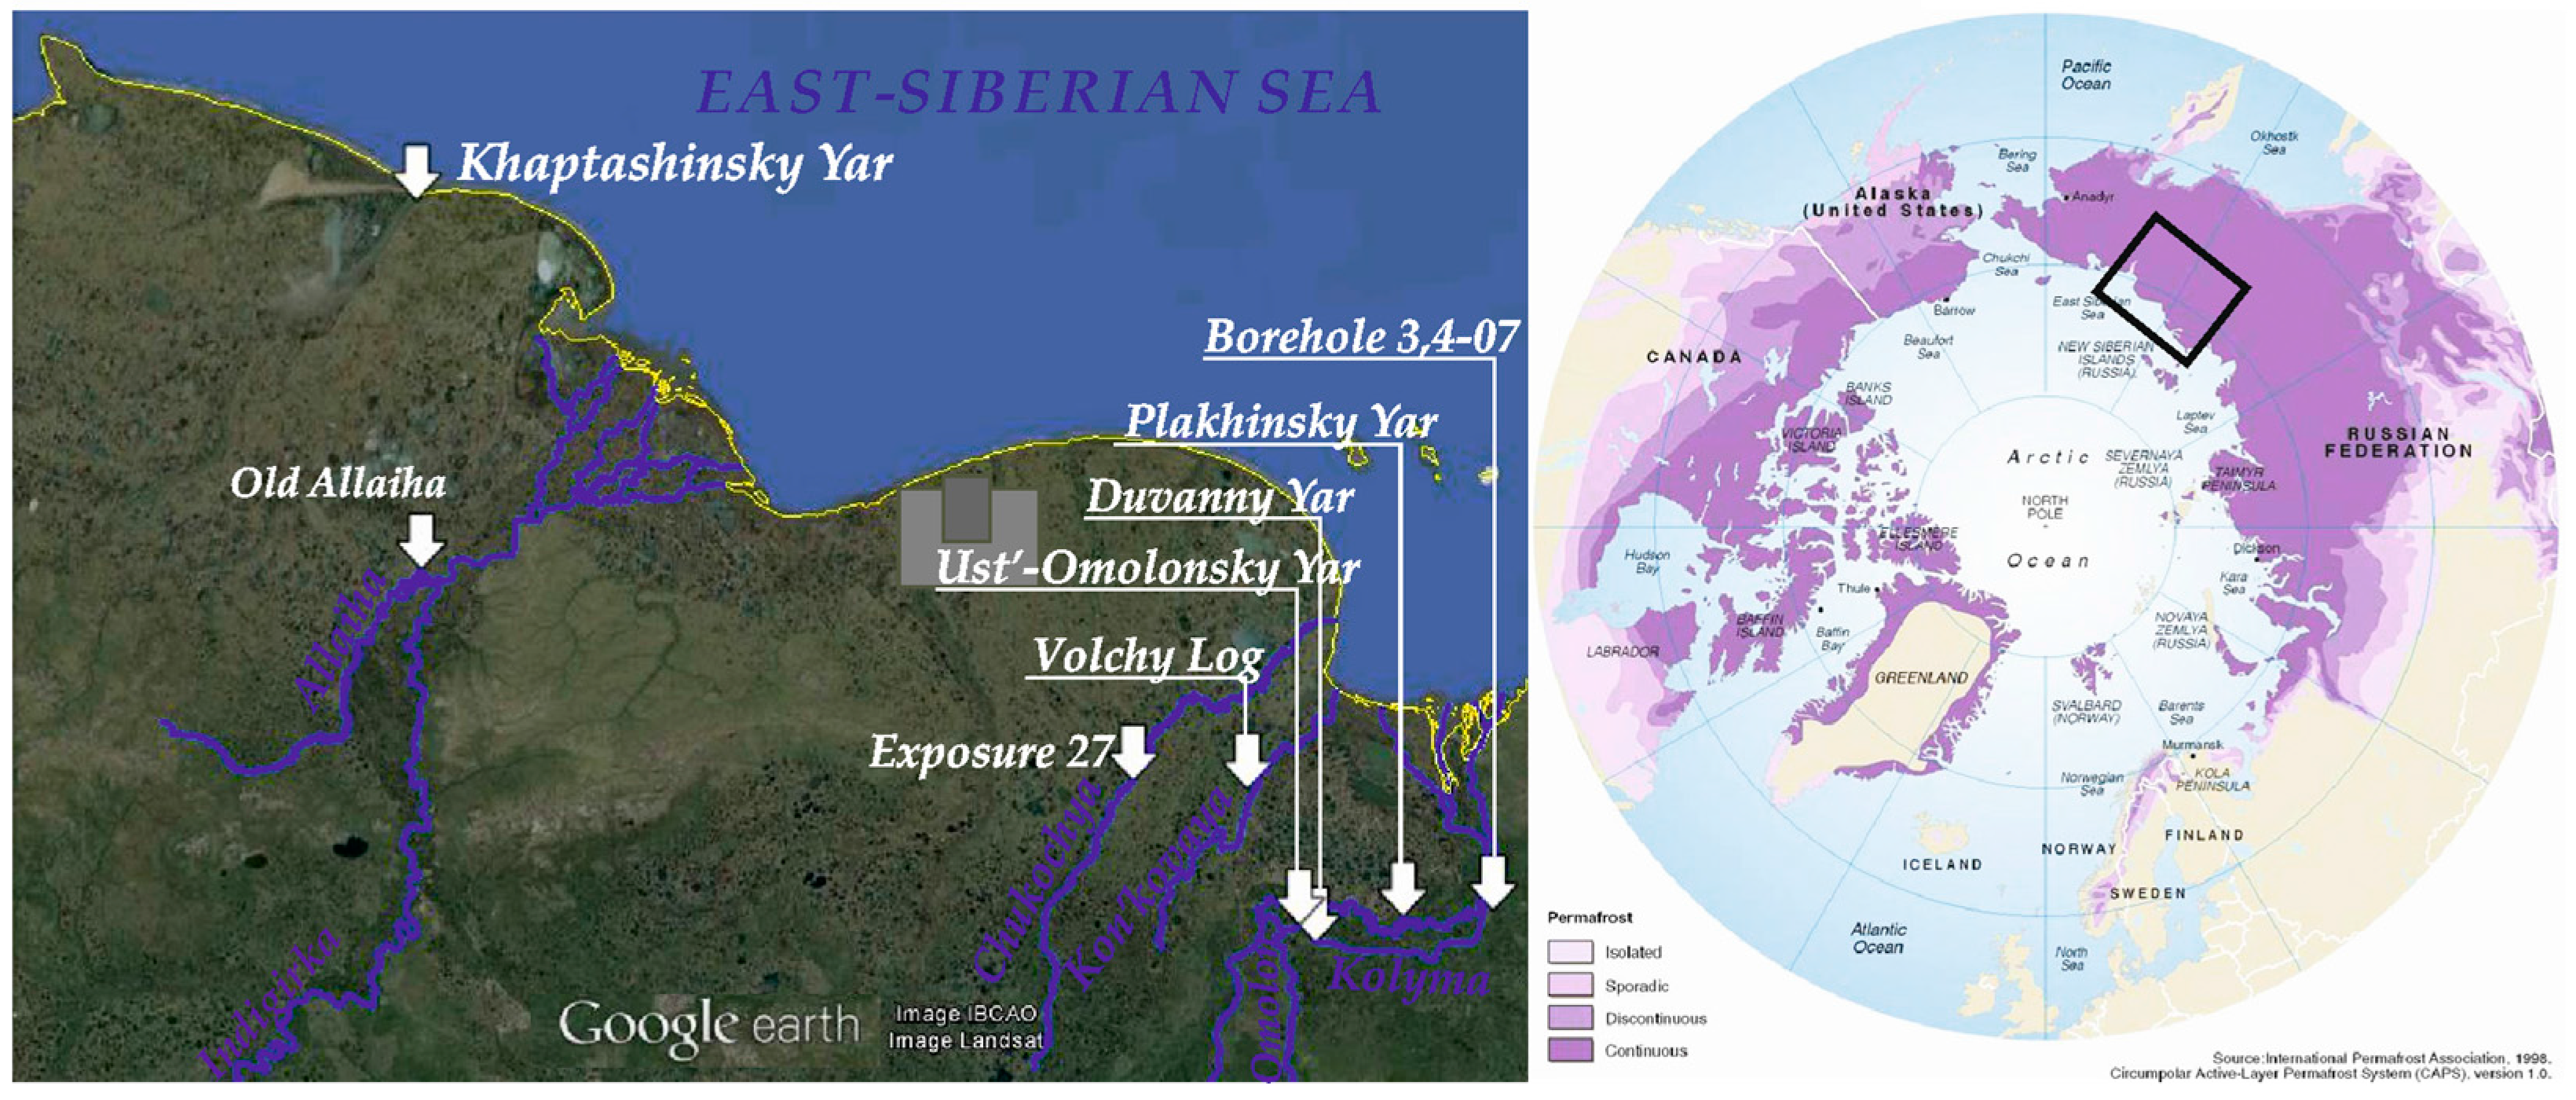
Figure 1. Location of the methane sampling sites in the northeastern Siberia; the area squared on the Circum-Arctic permafrost map [29]. Reproduced with permission from Philippe Rekacewicz, visionscarto.net.
Atmosphere 08 00105 g001
Figure 2. Soil composition, CH4 concentration (shown by bars) and stable carbon isotopes (shown by circles) of CH4, radiocarbon dates of dissolved organic matter and CH4 from the gas filling borehole 3,4-07. Key: 1, silts; 2, sands; 3, gravel; 4, peat; 5, radiocarbon dating samples; 6, permafrost table. Unit numbers define the geological layers, described in the text. Initial data are presented in Table A1.
Atmosphere 08 00105 g002
Figure 3. CH4 concentrations averaged by relative depth in the uppermost permafrost and active layer. (a) Yedoma and the Cover Layer (normalized by the Cover Layer thickness at the sampling sites). (b) Active layer and rarely thawed transient layer (normalized by the maximal annual thawing depth at the sampling sites). CH4 was sampled from the permafrost in northeastern Siberia in 2004–2008 (Table A2 and Table A3).
Atmosphere 08 00105 g003
Figure 4. Methane concentration patterns in sand (a) and silt (b) after the freezing of unsaturated (moisture content 30%) methane-enriched soils.
Atmosphere 08 00105 g004
Figure 5. Schematic representation of the water and methane flows in freezing soils. (a) Cryogenic suction case; (b) Ice penetration to pores with squeezing of the excess water and methane.
Atmosphere 08 00105 g005
Figure 6. Direction of methane flux and water flux. (a) In unsaturated soils; (b) In saturated soils. Line labels denote dimensionless C1/C2, showing the initial methane distribution in a 0.6 m thick sample soil column, with C2 = 178 mol, and equilibrium pressure. In saturated soils, methane flux always follows water flux.
Atmosphere 08 00105 g006
Figure 7. Paleoenvironmental reconstruction of the sequence at Kolyma floodplain disclosed by borehole 3,4-07. (a) Soils of the thaw bulb under the floodplain lake with potential methane production; (b) Freezing of the methane-enriched soils of a thaw bulb after the lake drainage; (c) Methane trapped in the pores and cavities of permafrost after complete freezing of the thaw bulb. Key: 1, floodplain wetland; 2, warm riverine and lacustrine waters; 3, riverine alluvium, gravel layer; 4, riverine alluvium, sand layer; 5, floodplain alluvium, silt layer; 6, lacustrine deposits, peaty silts; 7, permafrost table; 8, free methane; 9, trapped methane; 10, borehole.
Atmosphere 08 00105 g007