Article

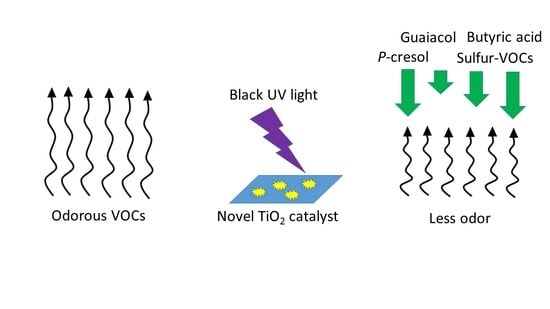
Mitigation of Livestock Odors Using Black Light and a New Titanium Dioxide-Based Catalyst: Proof-of-Concept

1
Interdepartmental Toxicology Program, Iowa State University, Ames, IA 50011, USA
2
Department of Agricultural and Biosystems Engineering, Iowa State University, Ames, IA 50011, USA
*
Author to whom correspondence should be addressed.
Atmosphere 2017, 8(6), 103; https://doi.org/10.3390/atmos8060103
Submission received: 13 May 2017 / Revised: 8 June 2017 / Accepted: 8 June 2017 / Published: 10 June 2017
(This article belongs to the Section Air Quality)

Abstract

:
Concentrated livestock feeding operations have become a source of odorous gas emissions that impact air quality. Comprehensive and practical technologies are needed for a sustainable mitigation of the emissions. In this study, we advance the concept of using a catalyst for barn walls and ceilings for odor mitigation. Two catalysts, a new TiO2-based catalyst, PureTi Clean, and a conventional Evonik (formerly Degussa, Evonik Industries, Essen, Germany) P25 (average particle size 25 nm) catalyst, were studied for use in reducing simulated odorous volatile organic compound (VOC) emissions on a laboratory scale. The UV source was black light. Dimethyl disulfide (DMDS), diethyl disulfide (DEDS), dimethyl trisulfide (DMTS), butyric acid, p-cresol, and guaiacol were selected as model odorants. The effects of the environmental parameters, the presence of swine dust covering the catalyst, the catalyst type and layer density, and the treatment time were tested. The performance of the PureTi catalyst at 10 µg/cm2 was comparable to that of P25 at 250 µg/cm2. The odorant reduction ranged from 100.0% ± 0.0% to 40.4% ± 24.8% at a treatment time of 200 s, simulating wintertime barn ventilation. At a treatment time of 40 s (simulating summertime barn ventilation), the reductions were lower (from 27.4% ± 8.3% to 62.2% ± 7.5%). The swine dust layer on the catalyst surface blocked 15.06% ± 5.30% of UV365 and did not have a significant impact (p > 0.23) on the catalyst performance. Significant effects of relative humidity and temperature were observed.

Graphical Abstract

1. Introduction

Meat, milk, and egg production is also associated with odor, gas, and particulate emissions to air. A holistic mitigation of the gaseous emissions from livestock and poultry is needed to address local and regional air quality issues. Specifically, by reducing the concomitant gaseous emissions of odorous volatile organic compounds (VOCs) without a significant increase in greenhouse gases (GHGs), ammonia (NH3), or hydrogen sulfide (H2S). Midwest Iowa is leading in US pork and egg production as well as other livestock, such as cattle and turkey, ranking top 10 nationwide [1]. Confined animal feeding operations present a unique challenge to mitigating emissions, while still providing an opportunity for the treatment of point source pollution from barns and manure storage.
Odor emission from livestock facilities has captured increasing attention as a source of air pollution. A complex mixture of VOCs in air emission was identified as the major contributor to odor nuisances [2,3,4,5,6,7]. Odor mitigation strategies fall into three major categories: dispersion enhancement, emission reduction, and odor generation reduction. Biofiltration [8,9,10,11] and air scrubbers [12] are two typical emission reduction techniques. A 70%–80% reduction of odor and over 80% of dust were reported when using a bioscrubber [13]. High reductions of odor were also observed with biofilters with different media materials [14]. However, the installation and maintenance of such devices add costs. An artificial windbreak wall [15] or a natural windbreak [16] were also proved to be effective in odor control. Sprinkling vegetable oil in the feed was found to suppress particulate matter emission [17]. Another effective emission reduction method is a diet modification with feed additives, which improves animal performance and reduces odors [18]. Setbacks for siting new facilities is also an odor control option [19]. Maurer et al. [20] reported that only approximately 25% of the technologies for the mitigation of all gases and particulate matter of concern were tested in field conditions. The number of field trials in swine operations is by far greater than those of poultry, dairy, and beef cattle.
Heterogeneous photocatalysis oxidation is an alternative pollution remediation technology that has been studied since the early 1970s. Some health risk concern on using titanium dioxide particles as photocatalytic material was brought up [21]. However, they have been widely used in paints, sunscreens, toothpastes, and foodstuffs. Titanium dioxide is a generally-recognized-as-safe (GRAS) material. The functional oxidant in TiO2 photocatalysis is the hydroxyl radical, which has a high potency and broad activity [22]. Hydrogen peroxide and superoxide radicals are also contributive oxidants in the photocatalysis process [23]. Its application is found in self-cleaning materials, air purification, water purification [22,24], and antibacterial products. Photocatalysis is also biologically active and has effects of detoxification [25] and pathogen destruction [26,27]. As summarized in Table 1, the application of a photocatalysis treatment in swine barns was reported to decrease indoor particulate matter (PM), odorous VOCs and gases [28,29,30], and bacteria [31]. An increase in swine production efficiency was also reported, due to the remediation of the indoor air quality [28].
Chromophores present in skin and eye tissues in humans and animals have a high absorbance of UV-B and UV-C (below 320 nm). The absorption of light energy leads to changes in these molecules, which eventually can result in a biological effect [32]. Black light (UV-A) is more visible than UV-B and UV-C and is more abundant in natural sunlight. It also has fewer side effects to human health. The black light tube is an inexpensive source of UV-A and is widely used in commercial products [33]. The mercury vapor in the black light tube collides with electrons and emits UV254 and UV185, which is absorbed by the phosphor layer on the inner wall of the tube. Fluorescent light is emitted from the phosphor layer, and the major output is UV-A after being filtered using a glass tube. Another, more expensive, UV-A source is the UV light-emitting diode (UVLED) that fits into miniaturized devices. For these reasons, black light is a more environmentally friendly and safer option for UV photocatalysis.
There is growing evidence that photocatalysis can improve the air quality in livestock barns (Table 1). Black light and photocatalysis are among the advanced oxidation mitigation strategies for odor, VOCs, NH3, and H2S. Researchers [27,34,35] have demonstrated up to 100% odor removal, up to 100% odorous VOCs removal, and up to 100% NH3 removal using photocatalysts (using a thin film of conventional P25 Evonik (formerly Degussa) TiO2) and mercury-based UV light. Others have recently demonstrated very promising results that include reductions in GHGs. For example, the work by Costa et al. [28] shows that the special photocatalytic coating and full spectrum light reduced CH4 by 27% (p < 0.05) and PM by 16% (p < 0.01) and improved the feed conversion ratio from 2.44 to 2.18 (p < 0.001) in swine nursery rooms, all without affecting the CO2 or N2O emissions. In addition to reducing GHGs, photocatalysis has the potential to improve the production performance by improving the feed conversion ratio and to reduce veterinary costs and increase global food security by inactivating airborne pathogens. A lab-scale system was built at Iowa State University’s Agricultural and Biosystems Engineering Department to test the effectiveness of black light to mitigate odor/VOCs. A new PureTi photocatalyst (special coating from PureTi, New York, NY, USA) was selected to test its photocatalysis efficiency in comparison with a conventional P25 TiO2 photocatalyst from Evonik (Evonik Industries, Essen, Germany). The effects of several key operating parameters that are important in livestock barn environments were tested. These included the photocatalyst dose, relative humidity (RH), temperature, and dust accumulation on active surfaces. The PureTi photocatalyst was compared with an Evonik P25 TiO2. The working hypothesis was that the PureTi coating could perform comparably well, using a much lower coating density.

2. Experiments

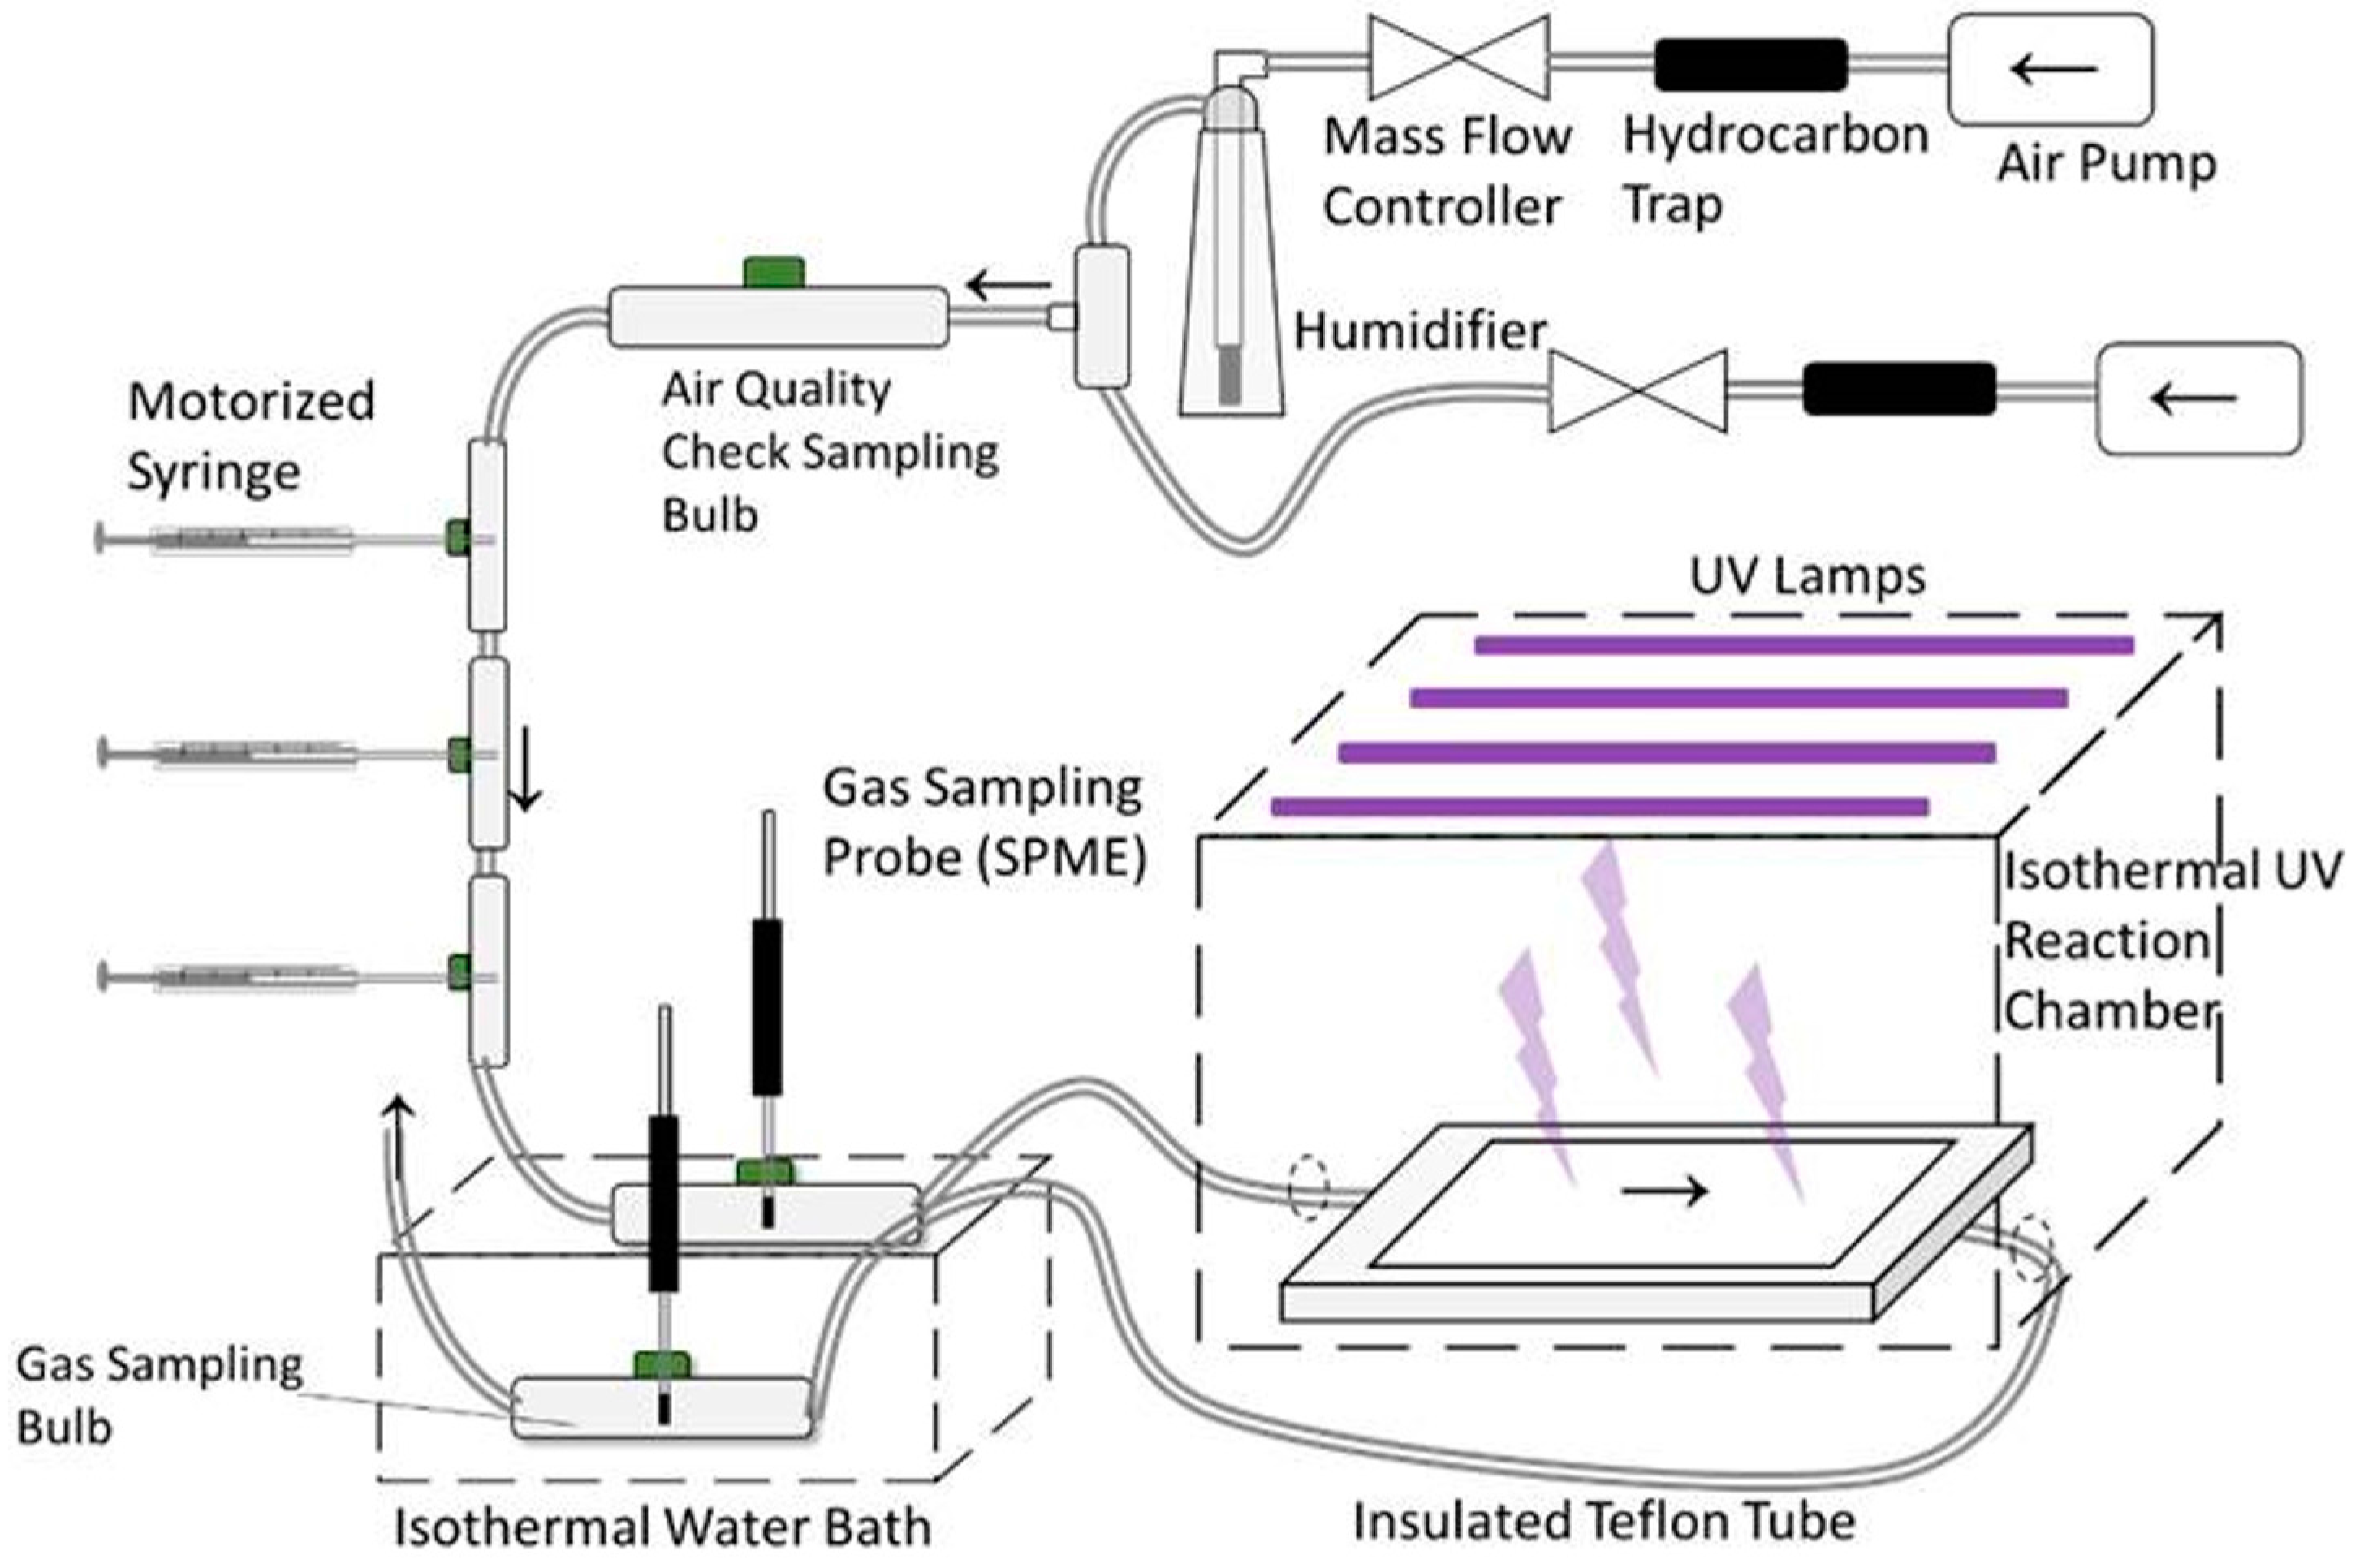
2.1. Standard Gas Generation and UV Treatment System

Standard odorant chemical solutions were prepared at known concentrations. The selection of target odorants was based on the reported chemical emissions from typical swine barns [37]. A special setup for generating a dynamic (moving) gas mixture was designed, assembled, and tested, using the procedure described by Koziel et al. [38] and by Akdeniz et al. [39]. The rationale for moving air was to simulate the conditions of a typical livestock barn. The standard odorous VOCs used for the preparation of the standard odorant chemical solutions were of 99% or higher purity. The standard odorant chemical solutions were injected using a syringe pump (KD Scientific Inc., Holliston, MA, USA) at a constant rate (1 µL/h) into constant air flow (300 or 60 mL/min). All of the six selected odorants were injected together at the same time to generate a standard gas with mixed odorants. The concentrations of odorant VOCs in the standard generated gases were calculated as a ratio of the standard mass injected for each compound and the airflow (Table 2). The resulting concentrations ranged from 4.32 to 888 ppb, i.e., they were within the range of concentrations measured inside livestock barns [37].
The photocatalysis treatment of the gaseous odorant VOCs took place in a 200-mL flow-through UV reaction chamber in a standard gas generation (SGG) system (Figure 1, Figure S1). The reaction was described by Yang et al. [40]. The top layer of the chamber was UV-transparent quartz glass. The reaction chamber was illuminated with four 15 W black light XX-15A UV-A lamps (Spectroline, Westbury, NY, USA) with a major output at 365 nm to perform the UV photocatalysis reaction. The effective dosage of UV365 in the reaction cassette was measured with an ILT 1700 radiometer (International Light Technologies, Peabody, MA, USA) equipped with a X-ray diffraction (XRD) 340B UV-A detector (International Light Technologies, Peabody, MA, USA). The effective dosage of UV365 was determined to be 0.061 mW/cm2 in all experiments of this study. The same black light lamps and radiometer were used in the test on the dust effect (details in 2.2).
The treatment time was calculated by dividing the reaction chamber volume with the gas flow rate:
T r e a t m e n t   T i m e = V c F
where, Vc is the volume of the reaction chamber and equals 200 mL, and F is the air flow rate.

2.2. Testing the Effects of Environmental Parameters and Coating

The tested parameters influential on photocatalysis efficiency were: environmental parameters (temperature and humidity), coating (coating type and loading density), and coatings fouled with dust.
A PureTi Clean coating was applied on glass plates by loading an aqueous PureTi anatase solution with electrostatic spray and then evaporating the water for 48 h at room temperature. The aqueous solution contained 0.1%–1.0% (weight %) of anatase and 0.1%–1.0% (weight %) of titanium peroxy complex. Four loading levels of aqueous anatase solution were tested, 10 g/m2, 1.0 g/m2, and 0.1 g/m2, and the corresponding PureTi coat loading densities were 10, 1.0, and 0.1 µg/cm2. The effective area of catalyst exposed to irradiation inside the reactor was 0.127 × 0.178 m (5” × 7”).
The effects of the RH and reaction temperature were also tested. The relative humidity was tested at 40%, 75%, and 90%, while the temperature was tested at 20 °C, 30 °C, and 40 °C. The flow rate of the standard generated gas was at 300 and 60 mL/min when performing UV treatment, and the corresponding treatment time of the standard generated gas in the UV reaction chamber was 40 s and 200 s. These environmental parameters are consistent with those observed in typical USA swine and poultry production barns [41].
An Evonik coating was applied on glass plates by loading the suspension solution of Evonik P25 in methanol (6.25 mg/mL) and then evaporating the methanol. Evonik P25 contains anatase and rutile in a ratio of 85:15. The density of the TiO2 P25 nanopowder was 250 µg/cm2, i.e., 250 to 25,000 times greater than the PureTi special coating. The effect of dust from the swine barn environment on photocatalysis was tested. The rationale was to test a working hypothesis that swine dust can occlude the active photocatalyst surface and reduce the treatment effectiveness. Clean glass plates (15.4 × 12.7 cm) in 3–4 replicates were hung on the wall of a swine finishing barn (AG Studies 450 Farm, Iowa State University) to allow dust to accumulate on the plates naturally. Barn curtains were dropped down or raised up according to the ambient temperature. Approximately 300 finisher pigs on a standard diet were raised in the room of dust collection. The glass plates were collected from the swine barn after 1, 2, 3, and 4 weeks to test the light absorption by the accumulated dust.
Glass plates (15.4 × 12.7 cm) coated with 10 µg/cm2 PureTi catalyst were hung on the wall of a finishing barn in two replicates to allow dust to accumulate on the plates naturally for 1–4 weeks. Then, the dusty catalyst coats were tested for photocatalysis efficiency.
The black light penetrating through the glass plate with dust was measured. Then, the dust layer was cleaned, and the light penetration through the clear glass plates was measured again. The light absorption by the dust layer was calculated as follows:
A = P g P d P g
where: A is the light absorption by the dust layer at 365 nm; Pg is the 365-nm UV light penetration through the clear glass; Pd is the 365-nm UV light penetration through the glass with dust.

2.3. Gas Sampling and Analysis

The target VOCs in the generated standard gas were measured using headspace solid phase microextraction (SPME), and the measurement was performed with 1 cm Carboxen–polydimethylsiloxane (CAR–PDMS) fiber (Supelco, Bellefonte, PA, USA). Before use, each fiber was conditioned at 270 °C for 5 min in a heated gas chromatography (GC) splitless injection port under helium flow. After conditioning, the SPME fiber was then quickly moved to the sampling port of the chamber of interest in the SGG system, and extractions were performed at the desired times. Once the extraction was completed, the SPME fiber was removed from the chamber and immediately inserted into the injection port of the GC for analysis. The desorption time of the SPME fiber was 5 min at 260 °C.
A GC mass spectrometer (GC–MS) (Agilent 6890N GC/5973 MS from Agilent, Wilmington, DE, USA) was used for the separation and quantification of the VOCs. A non-polar pre-column and a polar column were installed in series in the system. The conditions of the GC were as follows: the oven temperature started from 110 °C, was held for 3 min, raised to 180 °C at 5 °C/min and then raised to 240 °C at 20 °C/min. The MS detector was in the selected ion monitoring (SIM) mode. The selected ions were dimethyl disulfide (DMDS): 45, 79, 94; diethyl disulfide (DEDS): 66, 94, 122; dimethyl trisulfide (DMTS): 79, 111, 126; butyric acid: 60, 73, 88; guaiacol: 81, 109, 124; and p-cresol: 77, 90, 107, 108. Underlined are the quantification ions.

2.4. Data Analysis

The reduction of the odor compounds was expressed as % reduction (R). The calculation of R was carried out as follows:
R = A u A t A u
where: Au = peak area of the odor compound detected by GC-MS, sampled from untreated standard generated gas with SPME; At = peak area of the odor compound detected by GC-MS, sampled from UV treated standard generated gas with SPME.

2.5. Statistical Analysis

The effects of the environmental parameters and catalyst coating on the photocatalysis reduction of the odor compounds were analyzed with Analysis of Variance (ANOVA), using the R program (R-3.3.2). This statistical analysis generated p-values for judging whether a specific parameter/factor had a significant influence on the photocatalysis efficiency. A significant difference was defined for a p-value lower than 0.05 in this study.

3. Results

3.1. PureTi Coat Performance Variability

The reproducibility was tested at two treatment times (40 s and 200 s) separately, while other parameters remained the same: RH = 40%, T = 40 °C, and UV365 = 0.061 mW/cm2. The reproducibility of the PureTi coating was tested by comparing two replicates of 10 µg/cm2 PureTi coating (Table 3). The total relative standard deviation (RSD) of the reduction rate between two chambers was in the range of 12.0%–34.1% at a treatment time of 40 s and in the range of 0.0%–61.4% at a treatment time of 200 s (Table 3).

3.2. Effect of the Catalyst Loading Density

The effect of the PureTi coat loading density was tested at a treatment time of 200 s, while the other parameters were: RH = 40%, T= 40 °C, and UV365 = 0.061 mW/cm2. The highest reductions were achieved at the highest loading density of 10 µg/cm2. The reductions of butyric acid, DEDS, DMTS, and guaiacol at a treatment time of 200 s with a 10-µg/cm2 PureTi coating were significantly higher than other loading levels with p-values lower than 0.05 (Table 4). Butyric acid and p-cresol were the two major components in the standard generated gas with highest concentrations (Table 4). The reduction rates of butyric acid and p-cresol reached 86.9% ± 14.2% and 93.8% ± 1.8% at a treatment time of 200 s with a 10-µg/cm2 PureTi coating. An increase in DMDS was observed with a 1.0-µg/cm2 coating density. A possible reason for this is the generation of DMDS as a byproduct from the degradation of DEDS and/or DMTS.

3.3. Effect of Relative Humidity and Temperature

The water molecule is the source of hydroxyl radicals as the major oxidant in photocatalysis reaction. The presence of water is essential to photocatalysis treatment. However, an excessive amount of water would also compete with the odor pollutant for adsorption sites. The effect of the RH was tested at 40 °C. Significant differences were observed at different RH levels on the reductions of DMDS, guaiacol, and p-cresol, while the optimum RH levels were different (Table 5). The lowest reductions of DMDS, DEDS, and DMTS were observed at 90% humidity, which might result from the “competitive adsorption” between water vapor and DMDS. Yang et al. reported a random trend of photocatalysis efficiency in odorants with the increase in relative humidity [42].
Higher temperature enhances the kinetic reaction rate of pollutant degradation, while at the same time inhibiting the adsorption of odorants to the catalyst surface. An increase in DMDS was observed when photocatalysis treatment was performed at 20 °C. This might result from the generation of DMDS as a byproduct from the degradation of DEDS and/or DMTS. The significant difference was observed at different treatment temperatures (Table 6). However, the optimum temperatures were different for the selected odor compounds. For DMDS, DEDS, DMTS, and butyric acid degradation, the optimum temperature was 30 °C for the combined process of adsorption and kinetic reaction. The highest reductions of guaiacol and p-cresol were achieved at 20 °C. The optimum overall photocatalysis efficiency was achieved at 30 °C. Yang et al. [42] observed that the photocatalysis efficiency of the odor compounds changed randomly with the increase in temperature.

3.4. Effect of Swine Barn Dust

No linear increase in light absorption against dust accumulation time was observed. The light absorption seemed to stabilize at 15.06% ± 5.30% with dust accumulated for over 1 week (Table 7).
The deactivation of the photocatalyst is a common problem in the practical application, but is usually ignored in laboratory tests. In the swine barn environment, a heteroatom containing VOCs, such as sulfur-containing VOCs, indole, pyridine, and other N-containing VOCs, would result in the deposition of N or S on the surface of the catalyst [43]. A fouling of the PM on catalyst pores also results in catalyst deactivation [44]. The effect of the dust was tested at a treatment time of 200 s, with RH = 40%, T =40 °C, and UV365 = 0.061 mW/cm2. No significant difference was observed between photocatalysis efficiencies with clean or dusty catalysts (Table 8).

3.5. Comparison of PureTi Coating Performance with Evonik P25

The PureTi coating and the Evonik coating were compared at a treatment time of 200 s, while the other parameters were: RH = 40%, T= 40 °C, and UV365 = 0.061 mW/cm2. The photocatalysis efficiency of the 10-µg/cm2 PureTi coating was comparable to the 250-µg/cm2 Evonik coat according to the statistical analysis (p > 0.1, Table 9). The high reduction rates of the two major components, butyric acid and p-cresol, were achieved at a treatment time of 200 s. The reduction rates of butyric acid and p-cresol were 82.8% ± 16.2% and 93.9% ± 2.1%, respectively, with the 10-µg/cm2 PureTi coat, and 97.80% ± 12.18% and 90.38% ± 7.22%, respectively, with the 250 µg/cm2 Evonik coat.

4. Conclusions

The PureTi coating at 10 µg/cm2 yielded the highest reductions on selected odor compounds compared with lower catalyst loading densities. The reduction rates of butyric acid and p-cresol were 86.9% ± 14.2% and 93.8% ± 1.8%, respectively, with the 10-µg/cm2 PureTi coating at a treatment time of 200 s, and 62.2% ± 7.5% and 27.4% ± 8.3%, respectively, at a treatment time of 40 s. The reduction of DMDS was 40.4% ± 24.8%; of DEDS 81.0% ± 16.7%; of DMTS 76.3% ± 22.1%; and of guaiacol 100.0% ± 0.0%, at a treatment time of 200 s. After a treatment time of 40 s, the reduction of DMDS was 35.0% ± 6.0%; of DEDS 27.7% ± 9.4%; of DMTS 37.1% ± 11.7%; and of guaiacol, 37.4% ± 11.3%. The photocatalysis efficiency of the 10-µg/cm2 PureTi coating was comparable to the 250-µg/cm2 Evonik coating according to the statistical analysis (p > 0.1). Significant influences were observed on the relative humidity and temperature (p-value ranging from 0.0023 to 0.9630), while the optimum conditions were inconsistent for the selected odor compounds. The dust layer on the wall of the swine barn was found to block light transmission by 15.06% ± 5.30%. However, no significant decrease in photocatalysis efficiency was observed with the dust-covered PureTi coating (p > 0.1).

Supplementary Materials

The following supplementary materials are available online at www.mdpi.com/2073-4433/8/6/103/s1, Figure S1: Photo of the laboratory-scale set-up for testing the effects of light and special coatings on standard gas mixtures of volatile organic compounds (in this photo, the system is rolled outside of the walk-in fume hood. All tests were completed inside the hood). The bottom photo is a close-up of the standard gas mixture to air pumped through the system. (Iowa State University Air Quality Lab).

Acknowledgments

The authors would like to thank the Indiana Soybean Alliance for funding the “Comprehensive Evaluation of Wet Scrubber and Photocatalysis Technologies for Mitigation of Particulate Matter, Odor, Volatile Organic Compounds, Ammonia and Hydrogen Sulfide Emissions” project 2015–2017. Special thanks to PureTi (Glenn Finkel and Bikash Rajkarnikar) for their support and for providing PureTi special coatings.

Author Contributions

Jacek Koziel, Devin Maurer, and Wenda Zhu conceived and designed the experiments; Wenda Zhu performed the experiments and analyzed the data; Jacek Koziel contributed reagents/materials/analysis tools; Jacek Koziel, Devin Maurer, and Wenda Zhu wrote the paper.

Conflicts of Interest

The authors declare no conflict of interest.

References

  1. State agriculture overview, Iowa. National Agricultural Statistics Service, United States Department of Agriculture. Available online: https://www.nass.usda.gov/Quick_Stats/Ag_Overview/stateOverview.php?state=IOWA (accessed on 5 August 2016).
  2. Wright, D.; Eaton, D.; Nielsen, L.; Kuhrt, F.; Koziel, J.A.; Spinhirne, J.P.; Parker, D.B. Multidimensional GC-MS-olfactometry for identification and prioritization of malodors from confined animal feeding operations. J. Agric. Food Chem. 2005, 53, 8663–8672. [Google Scholar] [CrossRef] [PubMed]
  3. Bulliner, E.A.; Koziel, J.A.; Cai, L.; Wright, D. Characterization of livestock odors using steel plates, solid phase microextraction, and multidimensional—gas chromatography-mass spectrometry-olfactometry. J. Air Waste Manag. Assoc. 2006, 56, 1391–1403. [Google Scholar] [CrossRef]
  4. Cai, L.; Koziel, J.A.; Davis, J.; Lo, Y.C.; Xin, H. Characterization of VOCs and odors by in-vivo sampling of beef cattle rumen gas using SPME and GC-MS-olfactometry. Anal. Bioanal. Chem. 2006, 386, 1791–1802. [Google Scholar] [CrossRef] [PubMed]
  5. Cai, L.; Koziel, J.A.; Liang, Y.; Nguyen, A.T.; Xin, H. Evaluation of zeolite for control of odorants emissions from simulated poultry manure storage. J. Environ. Qual. 2007, 36, 184–193. [Google Scholar] [CrossRef] [PubMed]
  6. Koziel, J.A.; Lo, Y.M.; Cai, L.; Wright, D.W. Simultaneous characterization of VOCs and livestock odors using solid-phase microextraction—multidimensional gas chromatography-mass spectrometry-olfactometry. Chem. Eng. Trans. 2010, 23, 73–78. [Google Scholar]
  7. Lo, Y.C.; Koziel, J.A.; Cai, L.; Hoff, S.J.; Jenks, W.S.; Xin, H. Simultaneous chemical and sensory characterization of VOCs and semi-VOCs emitted from swine manure using SPME and multidimensional gas chromatography-mass spectrometry-olfactometry system. J. Environ. Qual. 2008, 37, 521–534. [Google Scholar] [CrossRef] [PubMed]
  8. Melse, R.W.; van der Werf, A.W. Biofiltration for mitigation of methane emission from animal husbandry. Environ. Sci. Technol. 2005, 39, 5460–5468. [Google Scholar] [CrossRef] [PubMed]
  9. Hoff, S.J.; Harmon, J.; Chen, L.; Janni, K.; Schmidt, D.; Nicolai, R.; Jacobson, L. Practical Partial Biofiltration of Swine Exhaust Ventilation Air. In Proceedings of the Mitigating Air Emissions from Animal Feeding Operations Conference, Des Moines, IA, USA, 19–21 May 2008; Iowa State University, College of Agriculture and Life Sciences: Ames, IA, USA, 2008; pp. 144–149. [Google Scholar]
  10. Nicolai, D.; Janni, J.; Schmidt, D. Biofiltration-Mitigating Odor and Gas Emissions from Animal Operations. In Proceedings of the Mitigating Air Emissions from Animal Feeding Operations Conference, Des Moines, IA, USA, 19–21 May 2008; Iowa State University, College of Agriculture and Life Sciences: Ames, IA, USA, 2008; pp. 150–154. [Google Scholar]
  11. Robert, R.; Treloar, R. Significant odor reduction from a highly efficient microecosystem based on Biofiltration. In Proceedings of the Mitigating Air Emissions from Animal Feeding Operations Conference, Des Moines, IA, USA, 19–21 May 2008; Iowa State University, College of Agriculture and Life Sciences: Ames, IA, USA, 2008; pp. 155–161. [Google Scholar]
  12. Melse, R.W.; Ogink, N.; Bosma, B. Mutli-pollutant scrubbers for removal of ammonia, odor and particulate matter from animal house exhaust air. In Proceedings of the Mitigating Air Emissions from Animal Feeding Operations Conference, Des Moines, IA, USA, 19–21 May 2008; Iowa State University, College of Agriculture and Life Sciences: Ames, IA, USA, 2008; pp. 162–168. [Google Scholar]
  13. Snell, H.G.J.; Schwarz, A. Development of an efficient bioscrubber system for the reduction of emissions. In Proceedings of the 2003 ASABE Annual Meeting, Las Vegas, NV, USA, 27–30 July 2003; American Society of Agricultural and Biological Engineers: St. Joseph, MI, USA, 2013. [Google Scholar]
  14. Ullman, J.L. Remedial activities to reduce atmospheric pollutants from animal feeding operations. Agric. Eng. Int. 2005. Invited Overview Paper No. 9. [Google Scholar]
  15. Ford, S.E.; Riskowski, G.L. Effect of windbreak wall location on ventilation fan performance. Appl. Eng. Agric. 2003, 19, 343–346. [Google Scholar]
  16. Sweeten, J.M. Odor and dust from livestock feedlots. Texas Agricultural Extension Service: College Station, TX, USA, 1991. [Google Scholar]
  17. Nonnenmann, M.W.; Donham, K.J.; Rautiainen, R.H.; O’Shaughnessy, P.T.; Burmeister, L.F.; Reynolds, S.J. Vegetable oil sprinkling as a dust reduction method in swine confinement. J. Agric. Saf. Health 2004, 10, 7–15. [Google Scholar] [CrossRef]
  18. Sutton, A.L.; Kephart, K.B.; Verstegen, M.W.; Canh, T.T.; Hobbs, P.J. Potential for reduction of odorous compounds in swine manure through diet modification. J. Anim. Sci. 1999, 77, 430–439. [Google Scholar] [CrossRef] [PubMed]
  19. Stowell, R.R.; Koppolu, L.; Schulte, D.D.; Koelsch, R.K. Applications of using the odor footprint tool. In Livestock Environment VII, Proceedings of the Seventh International Symposium, Beijing, China, 18–20 May 2005; American Society of Agricultural Engineers: St. Joseph, MI, USA, 2005; Number 701P0205. [Google Scholar]
  20. Maurer, D.; Koziel, J.A.; Harmon, J.D.; Hoff, S.J.; Rieck-Hinz, A.M.; Andersen, D.S. Summary of performance data for technologies to control gaseous, odor, and particulate emissions from livestock operations: Air Management Practices Assessment Tool (AMPAT). Data Brief. 2016, 7, 1413–1429. [Google Scholar] [CrossRef] [PubMed]
  21. Pichat, P. A brief survery of the potential health risks of TiO2 particles and TiO2-containing photocatalytic or non-photocatalytic materials. J. Adv. Oxid. Technol. 2010, 13, 238–246. [Google Scholar]
  22. Ollis, D.F. Photocatalysis purification and remediation of contaminated air and water. Acad. Sci. Paris Ser. IIc Chem. 2000, 3, 405–411. [Google Scholar]
  23. Scheider, J.; Matsuoka, M.; Takeuchi, M.; Zhang, J.; Horiuchi, Y.; Anpo, M.; Bahnemann, D.W. Understanding TiO2 photocatalysis: mechanisms and material. Chem. Rev. 2014, 114, 9919–9986. [Google Scholar] [CrossRef] [PubMed]
  24. Herrmann, J.M. Heterogeneous photocatalysis: state of the art and present applications. Top. Catal. 2005, 34, 49–65. [Google Scholar] [CrossRef]
  25. Sunada, K.; Kikuchi, Y.; Hashimoto, K.; Fujishima, A. Bactericidal and detoxification effects of TiO2 thin film photocatalysts. Environ. Sci. Technol. 1998, 32, 726–728. [Google Scholar] [CrossRef]
  26. Armon, R.; Narkis, N.; Neeman, I. Photocatalytic inactivation of different bacteria and bacteriophages in drinking water at different TiO2 concentration with or without exposure to O2. 2nd Int. TiO2 Conference on Photocatalytic Purification and Treatment of Water and Air, Cincinnati, OH. J. Adv. Oxid. Technol. 1998, 3, 145–150. [Google Scholar]
  27. Yang, X.; Koziel, J.A.; Cutler, T.; van Leeuwen, J.; Zhang, S.; Hoff, S.J.; Jenks, W.; Zimmerman, J. Treatment of livestock odor and pathogens with ultraviolet light. In Proceedings of the 2008 ASABE Annual Meeting, Rhode Island Convention Center, RI, USA, June 29 – July 2 2008; American Society of Agricultural and Biological Engineers: St. Joseph, MI, USA, 2008. Paper No. 085198. [Google Scholar]
  28. Costa, A.; Chiarello, G.L.; Selli, E.; Guarino, M. Effects of TiO2 based photocatalytic paint on concentrations and emissions of pollutants and on animal performance in a swine weaning unit. J. Environ. Manag. 2012, 96, 86–90. [Google Scholar] [CrossRef] [PubMed]
  29. Liu, Z.; Murphy, P.; Maghirang, R.; DeRouchey, J. Mitigation of air emissions from swine buildings through the photocatalytic technology using UV/TiO2. In Proceedings of the 2015 ASABE Annual Meeting, St. Joseph, MI, USA, 27 June 2008; American Society of Agricultural and Biological Engineers: St. Joseph, MI, USA, 2008. Paper No. 152189332. [Google Scholar]
  30. Guarino, M.; Costa, A.; Porro, M. Photocatalytic TiO2 coating to reduce ammonia and greenhouse gases concentration and emission from animal husbandries. Bioresour. Technol. 2008, 99, 2650–2658. [Google Scholar] [CrossRef] [PubMed]
  31. Alvarado, A.C.; Predicala, B.Z. Effect of nanoparticles on gas emissions and growth and transmission of microorganisms in swine production facilities. In Proceedings of the CSBE/SCGAB Annual International Meeting, Montreal, QC, Canada, 13–16 July 2014; American Society of Agricultural and Biological Engineers: St. Joseph, MI, USA, 2014. Paper No. 141913472. [Google Scholar]
  32. Longstreth, J.; de Gruijl, F.R.; Kripke, M.L.; Abseck, S.; Arnold, F.; Slaper, H.I.; Velders, G.; Takizawa, Y.; van der Leun, J.C. Health risks. J. Photochem. Photobiol. B. 1998, 46, 20–39. [Google Scholar] [CrossRef]
  33. Fujishima, A.; Zhang, X. Titanium dioxide photocatalysis: present situation and future approaches. C.R. Chim. 2006, 9, 750–760. [Google Scholar] [CrossRef]
  34. Yang, X.; Koziel, J.A.; Cai, L.; Hoff, S.J.; Harmon, J.D.; van Leeuwen, J.; Jenks, W.S.; Zimmerman, J.J.; Cutler, T.D. Novel treatment of odor and VOCs using photolysis. In Proceedings of the ASABE Annual Meeting, St. Joseph, MI, USA, 17–20 June 2007; American Society of Agricultural and Biological Engineers: St. Joseph, MI, USA, 2007. Paper No. 074139. [Google Scholar]
  35. Rockafellow, E.M.; Koziel, J.A.; Jenks, W.S. Laboratory-scale investigation of UV treatment of ammonia for livestock and poultry barn exhaust applications. J. Environ. Qual. 2012, 41, 281–288. [Google Scholar] [CrossRef] [PubMed]
  36. Yao, H.; Feilberg, A. Characterisation of photocatalytic degradation of odorous compounds associated with livestock facilities by means of PTR-MS. Chem. Eng. J. 2015, 277, 341–351. [Google Scholar] [CrossRef]
  37. Akdeniz, N.; Koziel, J.A.; Ahn, H.K.; Glanville, T.; Crawford, B.; Raman, R.D. Laboratory scale evaluation of VOC emissions as indication of swine carcass degradation inside biosecure composting units. Bioresour. Technol. 2010, 101, 71–78. [Google Scholar] [CrossRef] [PubMed]
  38. Yang, X.; Zhu, W.; Koziel, J.A.; Cai, L.; Jenks, W.S.; Laor, Y.; van Leeuwen, J.; Hoff, S.J. Improved quantification of livestock associated odorous volatile organic compounds in a standard flow-through system using solid phase microextraction and gas chromatography-mass spectrometry. J. Chromatogr. A. 2015, 1414, 31–40. [Google Scholar] [CrossRef] [PubMed]
  39. Bereznicki, S.D.; Heber, A.J.; Akdeniz, N.; Jacobson, L.D.; Hetchler, B.P.; Heathcote, K.Y.; Hoff, S.J.; Koziel, J.A.; Cai, L.; Zhang, S.; et al. Odor and odorous chemical emissions from animal buildings: Part 1–project overview, collection methods and quality control. Trans. ASABE 2012, 55, 2325–2334. [Google Scholar] [CrossRef]
  40. Peral, J.; Domènech, X.; Ollis, D.F. Heterogeneous photocatalysis for purification, decontamination and deodorization of air. J. Chem. Technol. Biotechnol. 1997, 70, 117–140. [Google Scholar] [CrossRef]
  41. Zhao, J.; Yang, X. Photocatalytic oxidation for indoor air purification: a literature review. Build. Environ. 2003, 38, 645–654. [Google Scholar] [CrossRef]
  42. Yang, X.; Koziel, J.A.; Laor, Y.; Zhu, W.; van Leeuwen, H.; Jenks, W.; Hoff, S.J.; Zimmerman, J.; Zhang, S.; Saadi, I.; et al. UV light treatment of gaseous emissions tested on synthetic and real livestock manure atmosphere. Atmos. Environ. 2017. in preparation. [Google Scholar]
  43. Cai, L.; Koziel, J.A.; Zhang, S.; Heber, A.J.; Cortus, E.L.; Parker, D.B.; Hoff, S.J.; Sun, G.; Heathcote, K.Y.; Jacobson, L.D.; et al. Odor and Odorous Chemical Emissions from Animal Buildings: Part 3–Chemical Emissions. Trans. ASABE 2015, 58, 1333–1347. [Google Scholar]
  44. Koziel, J.A.; Martos, P.; Pawliszyn, J. System for generation of standard gas mixtures of volatile and semivolatile organic compounds for calibrations of solid phase microextraction and other sampling devices. J. Chromatogr. A 2004, 1025, 3–9. [Google Scholar] [CrossRef] [PubMed]
Figure 1. Schematic of a UV treatment system (ISU Air Quality Lab).
Atmosphere 08 00103 g001
Table 1. Summary of the application of photocatalysis for swine barn emission mitigation.
ReferencesCatalyst/Support MaterialLight SourceReactantEnvironmentResultsComments
[29]Evonik P25 TiO2
5-stage honeycomb filter
UV-C (254 nm)H2S, NH3, CH4 in exhaust airTwo swine nursery houses at Kansas State Universities Segregated Early Wean Unit. Each house is 1.3 × 0.7 × 0.2 m, with 200 head capacityReduction of H2S at 5.3–22.8 ppb/sec; NH3 at 0.3–1.7 ppm/secTo achieve sufficient reduction rate, suggested solutions are: using 10-stage honeycomb with 1 m2 TiO2-coated filter; or locate the filter at low air velocity position; or modify geometry of honeycomb
[28]Active PPS TiO2
70 g/m2 on wall
Full-spectrum light (solar spectrum lamp)Particulate matter, NH3, greenhouse gases in barn indoor airTwo identical weaning units in northern Italy, with 391 pigs in each unitSignificant reduction of CH4 (27%, p < 0.05), PM10 (17%, p < 0.01)-
[30]Active PPS 70 g/m2 on wallUV-ANH3, CH4, CO2 in barn indoor airTwo identical farrowing rooms. Each room is 10.9 × 17.3 × 2.4 m, with 30 sows and 10 piglets with each sowSignificant reduction of NH3 (30.37%, p < 0.001), CH4 (15%, p < 0.001), CO2 (10.52%, p < 0.001), N2O (3.92%, p < 0.001)Ventilation rate has high impact on pollutant abatement
[31]ZnO nanoparticle
Ventilation air recirculation system
Not specifiedCH4, CO2, bioaerosol in exhaust airTwo identical chambers in Prairie Swine Center barn in Canada. Each chamber is 4.2 × 3.6 × 2.7 m, with 6 grower pigsNo significant impact on GHGs. Filter with ZnO effectively reduced bioaerosol at 5 days after installation, but increased after 5 days.No significant impact on swine production performance
[36]TiO2-coated ceramic filterUV-A (black light lamp)H2S, volatile organic compounds (VOCs)LaboratoryLow reduction of H2S
Above 80% removal of VOCs at low flow and low concentration; low reduction rates at high flow rates
Humidity has no impact on photocatalysis efficiency at 40–80%
[27]Evonik P25 TiO2UV-C (254 nm, 185 nm)VOCsLaboratoryComplete reduction of VOCs after 112 s photocatalysis reaction; over 50% reduction after 18.5 s reaction-
Table 2. Estimated standard gaseous concentration of odorant VOCs in treated flowing gas.
CompoundStandard Solution Concentration (mg/mL)Air Flow at 300 mL/min 40 s Treatment TimeAir Flow at 60 mL/min 200 s Treatment Time
Gas Concentration (ng/mL) *Gas Concentration (ppb) *Gas Concentration (ng/mL) *Gas Concentration (ppb) *
DMDS0.6780.0389.840.11329.3
DEDS0.2000.0114.320.03313.0
DMTS0.6780.0387.340.11321.8
Butyric acid19.21.0692963.208888
Guaiacol0.4440.0254.910.07414.5
p-cresol6.5980.36782.81.100248
* The gas concentration was estimated based on the injection rate (1 µL/h) of the standard solution and on the gas flow rate. DMDS: dimethyl disulfide; DEDS: diethyl disulfide; DMTS: dimethyl trisulfide.
Table 3. Comparison of the % reduction to remove odorous compounds between two replicates of 10-µg/cm2 PureTi coating.
Compound40 s Treatment Time200 s Treatment Time
Rep 1 RSDRep 2 RSDAverage % ReductionTotal RSDRep 1 RSDRep 2 RSDAverage % ReductionTotal RSD
DMDS21.6%8.6%35.0 ± 6.017.0%81.2%25.5%40.4 ± 24.861.4%
DEDS37.7%25.7%27.7 ± 9.434.1%24.7%1.9%81.0 ± 16.720.7%
DMTS34.3%24.2%37.1 ± 11.731.5%35.8%3.3%76.3 ± 22.129.0%
Butyric acid22.9%10.7%62.2 ± 7.512.0%19.6%0.7%86.9 ± 14.216.3%
Guaiacol47.6%36.7%37.4 ± 11.330.3%0.0%0.0%100.0 ± 0.00.0%
p-cresol42.7%34.0%27.4 ± 8.330.2%2.2%1.7%93.8 ± 1.81.9%
RSD: relative standard deviation; DMDS: dimethyl disulfide; DEDS: diethyl disulfide; DMTS: dimethyl trisulfide.
Table 4. Effect of PureTi coat loading densities on odor compounds. Reduction rate (%) at a treatment time of 200 s.
Compound10 µg/cm21.0 µg/cm20.1 µg/cm2p-value
DMDS33.9 ± 27.5−18.5 ± 2.45.7 ± 34.50.0518
DEDS75.8 ± 18.78.2 ± 5.712.1 ± 30.30.0011 *
DMTS69.8 ± 25.012.1 ± 3.310.7 ± 41.60.0148 *
Butyric acid82.8 ± 16.220.7 ± 3.320.1 ± 40.70.0035 *
Guaiacol100.0 ± 0.077.5 ± 3.932.3 ± 34.60.0008 *
p-cresol93.9 ± 2.170.3 ± 3.124.6 ± 17.40.0000 *
Note: DMDS: dimethyl disulfide; DEDS: diethyl disulfide; DMTS: dimethyl trisulfide. The content of TiO2 in PureTi Clean coating is 1%. * A significant difference, defined as p < 0.05.
Table 5. VOC reduction rate (%) at different relative humidity (RH) levels.
CompoundRH = 40%RH = 75%RH = 90%p-value
DMDS32.74 ± 9.0737.73 ± 18.44−0.91 ± 6.440.0174 *
DEDS28.17 ± 15.2028.41 ± 21.2125.26 ± 7.090.9630
DMTS49.79 ± 6.4833.26 ± 11.8329.85 ± 5.400.0557
Butyric acid56.57 ± 5.7627.35 ± 21.0143.09 ± 5.800.0864
Guaiacol41.63 ± 7.3523.26 ± 3.4650.45 ± 6.300.0171 *
p-cresol31.47 ± 7.1926.67 ± 3.4646.22 ± 2.070.0058 *
DMDS: dimethyl disulfide; DEDS: diethyl disulfide; DMTS: dimethyl trisulfide. * A significant difference exists, with p < 0.05.
Table 6. VOC reduction rate (%) at different reaction temperatures.
Compound20 °C30 °C40 °Cp-value
DMDS−17.26 ± 17.6139.48 ± 6.4732.74 ± 9.070.0023 *
DEDS17.05 ± 5.8651.75 ± 0.1728.17 ± 15.200.0106 *
DMTS30.91 ± 6.8254.55 ± 5.4349.79 ± 6.480.0081 *
Butyric acid66.91 ± 2.0171.26 ± 2.6856.57 ± 5.760.0088 *
Guaiacol66.34 ± 9.3155.65 ± 5.1441.63 ± 7.350.0188 *
p-cresol49.87 ± 5.7545.12 ± 2.0931.47 ± 7.190.0149 *
DMDS: dimethyl disulfide; DEDS: diethyl disulfide; DMTS: dimethyl trisulfide. *A significant difference exists, with p < 0.05.
Table 7. Light absorption at 365 nm by dust layer.
Dust Accumulation TimeAbsorptionRSD
1 week15.33 ± 2.33%15.18%
2 weeks15.05 ± 4.49%29.81%
3 weeks14.83 ± 10.88%73.39%
4 weeks15.01 ± 0.22%1.46%
Average15.06 ± 5.30%35.17%
The intensity of the black light was 0.061 mW/cm2 at 365 nm.
Table 8. Effect of swine dust cover on catalyst performance.
CompoundReduction Rate (%) at a Treatment Time of 200 s with a 10-µg/cm2 Coating
CleanDustyp-value
DMDS40.4 ± 24.835.0 ± 11.50.6270
DEDS81.0 ± 16.778.8 ± 8.30.7790
DMTS76.3 ± 22.180.7 ± 7.30.6480
Butyric acid86.9 ± 14.281.9 ± 10.30.4760
Guaiacol100.0 ± 0.0100.0 ± 0.00.4350
p-cresol93.8 ± 1.891.6 ± 5.00.2300
DMDS: dimethyl disulfide; DEDS: diethyl disulfide; DMTS: dimethyl trisulfide. The content of TiO2 in the PureTi Clean coating is 1%.
Table 9. Comparison of VOC removal rates using PureTi coating and Evonik coating.
Compound10 µg /cm2 TiO2 in PureTi Coating250 µg/cm2 TiO2 in Evonik Coatingp-Value
DMDS33.89 ± 27.52%42.88 ± 23.93%0.6460
DEDS75.80 ± 18.74%88.03 ± 5.20%0.3180
DMTS69.76 ± 24.97%93.99 ± 2.29%0.4190
butyric acid82.81 ± 16.20%97.82 ± 2.27%0.1660
guaiacol100.00 ± 0.00%94.09 ± 10.24%0.1700
p-cresol93.85 ± 2.07%90.23 ± 9.56%0.3750
DMDS: dimethyl disulfide; DEDS: diethyl disulfide; DMTS: dimethyl trisulfide. The content of TiO2 in PureTi Clean coating is 1%.

