Abstract
The ‘Hestia Project’ uses a bottom-up approach to quantify fossil fuel CO2 (FFCO2) emissions spatially at the building/street level and temporally at the hourly level. Hestia FFCO2 emissions are provided in the form of a group of sector-specific vector layers with point, line, and polygon sources to support carbon cycle science and climate policy. Application to carbon cycle science, in particular, requires regular gridded data in order to link surface carbon fluxes to atmospheric transport models. However, the heterogeneity and complexity of FFCO2 sources within regular grids is sensitive to spatial resolution. From the perspective of a data provider, we need to find a balance between resolution and data volume so that the gridded data product retains the maximum amount of information content while maintaining an efficient data volume. The Shannon entropy determines the minimum bits that are needed to encode an information source and can serve as a metric for the effective information content. In this paper, we present an analysis of the Shannon entropy of gridded FFCO2 emissions with varying resolutions in four Hestia study areas, and find: (1) the Shannon entropy increases with smaller grid resolution until it reaches a maximum value (the max-entropy resolution); (2) total emissions (the sum of several sector-specific emission fields) show a finer max-entropy resolution than each of the sector-specific fields; (3) the residential emissions show a finer max-entropy resolution than the commercial emissions; (4) the max-entropy resolution of the onroad emissions grid is closely correlated to the density of the road network. These findings suggest that the Shannon entropy can detect the information effectiveness of the spatial resolution of gridded FFCO2 emissions. Hence, the resolution-entropy relationship can be used to assist in determining an appropriate spatial resolution for urban CO2 flux studies. We conclude that the optimal spatial resolution for providing Hestia total FFCO2 emissions products is centered around 100 m, at which the FFCO2 emissions data can not only fully meet the requirement of urban flux integration, but also be effectively used in understanding the relationships between FFCO2 emissions and various social-economic variables at the U.S. census block group level.
1. Background Introduction
1.1. Urban-Scale FFCO2 Emissions
Anthropogenic carbon dioxide (CO2) emissions, primarily from the combustion of fossil fuels, are the largest net annual flux of CO2 to the atmosphere and represent the dominant source of greenhouse gas forcing []. Quantification of the fossil fuel CO2 (FFCO2) component of total anthropogenic CO2 emissions is an important element in efforts to both understand the global carbon cycle and enable effective decisionmaking on greenhouse gas emissions mitigation and verification. Urban areas constitute an increasing majority of FFCO2 emissions, with urban areas accounting for roughly 70% of global FFCO2 emissions in recent years []. This share of the global total is expected to increase, in alignment with the projected increase in global urban population and spatial extent [].
The importance of urban areas within the global carbon cycle is reflected in recent research efforts focused on understanding and quantifying FFCO2 fluxes in urban areas [,,,]. Many of these efforts attempt to quantify fluxes with spatial and functional detail in order to provide a variety of policy-relevant information []. For example, FFCO2 fluxes that resolve neighborhoods, roadways, and industrial facilities can offer urban decisionmakers a prioritization of emission reduction options, leading to efficient outcomes. Additionally, ongoing quantification can provide verification that emission reduction efforts have met their stated goals.
A number of research efforts aimed at quantitatively understanding urban FFCO2 fluxes are ongoing in many large urban areas such as Paris [], Los Angeles [], Indianapolis [], and Salt Lake City []. These research endeavors combine multiple observing and modeling techniques. Among these are ground-level atmospheric concentration measurement, satellite measurement of columnar concentration, inverse modeling, combustion flux monitoring, and urban socioeconomic modeling [,,,,].
Regulating FFCO2 emissions to contain climate change cannot be achieved at the nation-state level without engaging with the activity of sub-national and local action. Multi-level governance of emissions reduction requires knowledge of spatial-temporal distribution of carbon emissions at different spatial scales and administrative levels []. Bottom-up estimation of carbon emissions has been conducted at spatial scales from global to local. Rayner et al. [] and Asefi-Najafabady et al. [] developed a gridded 1 km global FFCO2. Gurney et al. [] quantified FFCO2 emissions for the entire U.S. The U.S. Environmental Protection Agency constructed a sector-specific national emissions inventory at the state and county level []. Emissions quantification efforts at much finer scales have also been made in support of localized attribution of responsibility and mitigation policymaking [,,,,]. Jones and Kammen [] developed a consumption-based greenhouse gas inventory of all census block groups in the San Francisco Bay Area. VandeWeghe and Kennedy [] provided an estimation of the residential emissions in the Toronto Census Metropolitan Area. Recently, an online building energy consumption data service, the LA Energy Atlas, was developed to improve data availability to analyze spatial and temporal trends in urban energy consumption across the Los Angeles County []. The ‘Hestia Project’ uses a bottom-up approach to quantify fossil fuel FFCO2 emissions spatially at the building/street level and temporally at the hourly level [].
1.2. Urban Flux Integration
In spite of the recent dramatic increase in urban scale greenhouse gas flux estimation research, integration of the many methodological approaches used remains a key challenge. For example, integration of socioeconomic modeling of surface fluxes with atmospheric concentrations requires simulation of atmospheric mixing such that an emitted mass of CO2 is mixed and advected to an observing location. In addition to the biases and uncertainties associated with socioeconomic flux estimation are the inherent uncertainties associated with atmospheric transport and representation of mixing ratio measurements within the model framework [].
Important among the many uncertainties in the urban FFCO2 flux integration problem are questions associated with the representation of spatial scale and spatial resolution. For example, socioeconomic-based estimation of FFCO2 fluxes are often derived from data sources for which spatial representation aligns with buildings, roads, and industrial facilities. Atmospheric measurements, by contrast, represent varying convolutions of upwind emitting sources and their transport via advection and mixing. In order to formally link surface fluxes to atmospheric concentration measurements, atmospheric transport modeling is best utilized. In these modeling frameworks, the spatial domains are discretized into regular-sized grid cells.
Hence, integration of surface fluxes to atmospheric concentration measurements involves reconciliation of different representations of spatial scale and resolution for which there are competing costs and trade-offs. Meteorological data, necessary to support simulation of atmospheric transport, is limited at scales below the spatial extent of a typical urban area. Indeed, in the United States, the highest-resolution reanalyzed meteorological information is provided in regular discretized grid cells of 1 km resolution []. Atmospheric transport simulation below these scales relies to a greater degree on model assumptions and approximations. Similarly, there are characteristic representations of scale and resolution for socioeconomic modeling approaches to quantifying FFCO2 emissions. Recent high-resolution “bottom-up” FFCO2 flux estimation efforts attempt to resolve FFCO2 emissions at the scale of individual buildings, industrial facilities, and street segments which represent fluxes in irregular spatial entities (points, lines, and polygons) at scales varying from 10–100 m. Aggregation to scales that avoid increasing error in atmospheric transport begins to lose the information content useful to urban decisionmakers aiming to guide and verify emission reductions.
1.3. Grid Scale Optimization
Hestia FFCO2 emissions are created by allocating county-level fuel statistics and other related data sources over space using advanced Geographic Information System (GIS) techniques. Emission sources in Hestia are represented in the form of points, lines, and polygons. Each point, line, or polygon in Hestia FFCO2 emissions is linked to an hourly-resolved time profile consisting of an 8760 set fractions of the total emissions []. A standardized desktop GIS, such as ArcGIS or QGIS, however, does not normally offer sufficient support for processing and analyzing the temporally-resolved Hestia FFCO2 emissions. By gridding Hestia FFCO2 emissions, not only can the data be more easily integrated into GIS for spatial analysis and modeling, but it also available to a wider audience who do not have a working knowledge of GIS.
Extensive work has been performed on the spatial aggregation and disaggregation methods [,,,]. In information theory, the Shannon entropy of an information source is the average amount of information contained in each message received from the source []. As the generic entropy measure does not explicitly account for spatial structures, Batty [] introduced a modified form of Shannon entropy, i.e., spatial entropy, to optimize spatial aggregation and disaggregation.
Little attention, by contrast, has been afforded to resolution optimization strategies for evenly-divided grids. Moeckel and Donnelly [] proposed a gradually-refined quadtree grid for use in statewide transportation modeling. Information theory has been applied in optimizing spatial resolution for gridded representation of land use/land cover types [], ecological indices [], and hydrological processes []. However, the recent high-resolution urban FFCO2 emissions estimation natively take the form of a mix of point-, polyline-, and polygon-shaped emitting sources, which make it more complicated to determine a maximum spatial resolution at which the inherent spatial heterogeneity can be well-preserved.
In addition to Hestia, quantification of FFCO2 emissions has been conducted at various spatial scales ranging from county [], sub-county [], census tract [], zip code [], and census block [] down to utility billing account []. Yet there has not been a deterministic method for recommending an optimized spatial resolution for gridded representation of FFCO2 emissions. This paper attempts to explore the tradeoffs associated with integrating differing representations of spatial scale and resolution in urban FFCO2 emissions quantification through the use of a spatial entropy metric. Specifically, we attempt to answer: what is the relationship between regularized spatial resolution and the information content of urban FFCO2 emissions? What FFCO2 information is lost when one constrains estimation to the resolution of current atmospheric modeling frameworks?
In Section 2, we describe methods used to analyze the entropy in urban FFCO2 fluxes as a function of domain and spatial resolution. Section 3 provides results from multiple urban domains in the United States, Section 4 discusses the implications of these results for understanding and quantifying urban FFCO2 fluxes in the context of carbon science and climate decisionmaking, and Section 5 summarizes our conclusions.
2. Methods
2.1. Application of the Shannon Entropy
The entropy of a discrete set of messages is defined by:
where P(Xi) is the probability of the message Xi, n is the number of messages, b is the base of the logarithm used. When b = 2, the units of entropy are bits and therefore the underlying meaning of entropy is the average minimum number of bits required to encode a message []. The Shannon entropy of an information source is maximized when all messages occur with equal probability 1/n. The Shannon entropy becomes zero when one of the messages occur with probability 1. The Shannon entropy determines the minimum bits that are needed to encode an information source and can serve as a metric for the effective information content. The Shannon entropy is a reflection of the diversity in information and serves as an important diversity index in ecology []. It can also provide additional information on the complexity and changes of climate time-series [].
In applying the Shannon entropy to urban FFCO2 emissions, we use a regular grid of FFCO2 emission values as the information source for which each unique grid cell emission value is equivalent to the message in Equation (1). As this is a proof-of-concept study, time is not being considered for simplicity. Hence, the grid cell values represent annual emissions in units of kilograms of carbon per year. The gridded FFCO2 emission is a continuous variable in that it has an infinite number of possible values. Discretization is needed to calculate the Shannon entropy of a continuous variable. In discretizing the variable for calculation of the Shannon entropy [], a binning approach is used under the assumption that the uncertainty of the Hestia FFCO2 emissions is more than one order of magnitude larger than one kilogram, so the grid cell values are rounded to the nearest integer to avoid bringing in excessive data source uncertainty-related noise. This binning approach has two implications: (1) the FFCO2 emissions are transformed from a continuous to a discrete variable represented by a set of one-kilogram bins so that the Shannon entropy can be quantified; (2) it serves as an implicit constraint on the desired grid resolution. Constrained by the distribution range of the gridded values which cannot exceed the total urban emissions, the probability of a bin receiving more than one grid cell increases with smaller cell size, so the entropy variable is expected to increase toward a maximum value initially and then decline toward zero.
Starting with a grid cell size considerably larger than the average footprint area of the emitting sources (e.g., a building or road segment), the diversity of emission values will hypothetically increase as the resolution is gradually increased towards the average footprint area and then decrease as the grid cell size becomes significantly smaller than the average footprint area. Figure 1 provides a theoretical example of Equation (1) applied to gridded FFCO2 emission values. The grid domain encompasses 63 cells with 28 unique emission values. The probability of emission value 226 is 0.27 (17/63) while the probability of emission value 93 is 0.016 (1/63). In this example, the small cell size results in a large number of redundant cells inside the footprint area, and these redundant values will reduce the diversity of the grid values and therefore may lead to a decrease in entropy. From the perspective of information effectiveness and data redundancy, we assume that the optimal spatial resolution occurs at the point when entropy is maximized. We call this resolution the maximum-entropy resolution (max-entropy resolution).
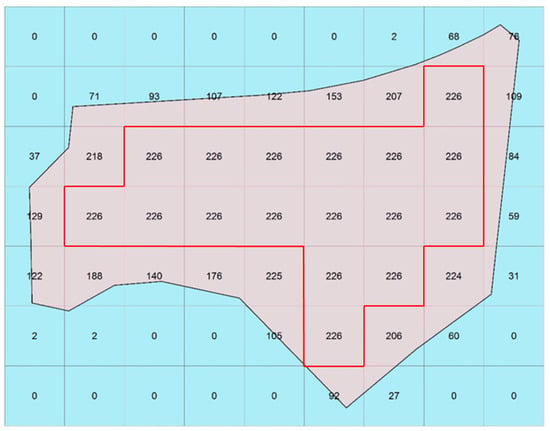
Figure 1.
A commercial non-point emitting entity gridded at 39-m resolution for calculation of Shannon entropy (the numeric labels indicate the emission values of the cells).
2.2. FFCO2 Data
For application to actual FFCO2 emissions, we use the results of the Hestia Project, a research effort that quantified urban FFCO2 emissions to sub-city spatial scales and temporal scales of one hour [,]. Begun in the mid-2000s, the Hestia Project has now made high-resolution FFCO2 estimates for Los Angeles [], Indianapolis [], Salt Lake City [], and Baltimore. These four Hestia urban areas are used in the following analysis. Figure 2 shows the gridded total emissions at different spatial resolutions in Baltimore.
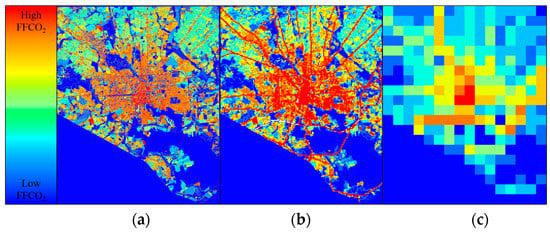
Figure 2.
Gridded total fossil fuel CO2 (FFCO2) emissions for the city of Baltimore at resolutions of (a) 10 m; (b) 100 m; (c) 1000 m.
Hestia uses a large collection of data and modeling techniques including regulated air pollution flux reporting, socioeconomic data, CO2 flux monitoring, building energy simulation, and traffic monitoring. Hestia quantifies emissions at the spatial scale of individual emission stacks, buildings, land parcels, and roadways. Hence, it represents these emitting entities as points, polylines, and polygons. For the purpose of representing these emissions in regular grids required by the Shannon entropy calculation, we take into account only polyline- and polygon-shaped emission sources, which have an explicit spatial footprint and are presumably more sensitive to gridding granularity. Point sources are normally sparsely distributed and can be well represented at coarser resolutions. For representing building emissions, three of the cities analyzed here used land parcels as the spatial dimension of building emissions while one case, Indianapolis, represented the spatial dimension of building emissions to the building footprint.
The Hestia FFCO2 emissions are also categorized by economic sector (e.g., residential, commercial, onroad, etc.) and the spatial representation and sector are coupled. For example, the onroad FFCO2 emissions are represented on polyline segments while the commercial, residential, and industrial sector emissions are represented as polygon-shaped sources (indicative of parcels of land or individual buildings).
Residential buildings/parcels usually make up the majority of parcels by number. In Baltimore, for example, the building FFCO2 emissions consist of 195,820 (93.88%) residential, 12,097 (5.80%) commercial, and 665 (0.32%) industrial buildings/parcels. However, commercial and industrial buildings/parcels normally have a larger spatial footprint than residential buildings/parcels.
3. Results
Urban areas are places dominated by the built environment including all non-vegetative, human-constructed elements, such as roads, buildings, and runways []. There has been a variety of globally consistently urban extent products developed primarily using remote sensing data sources [,,,]. In making the MODIS imagery-based global 500 m urban extent map, Schneider et al. [] defined an urban landscape unit as a pixel that has a greater than 50% built-up coverage. We intersected the Hestia FFCO2 emissions vector layers with the MODIS 500 m urban extent map to extract the urban FFCO2 emissions (Figure 3). This resulted in FFCO2 emissions for four urban areas: Los Angeles County, Salt Lake City, Indianapolis, and Baltimore. The area of these four urban areas are 3300, 789, 1002, and 233 km2, respectively.
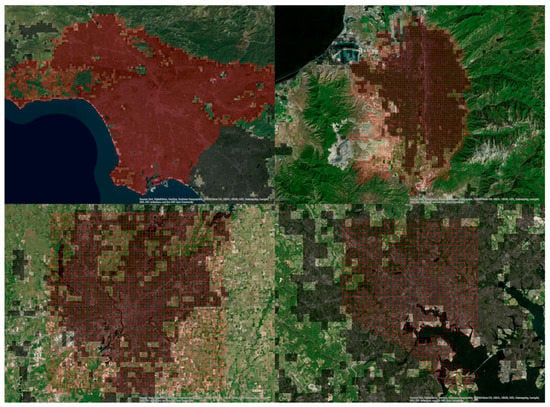
Figure 3.
Hestia-based urban maps (red grids) overlaid on MODIS 500 m global urban maps (in dark shade) and ArcGIS online satellite imagery.
Shannon entropy was calculated for the total, residential building, commercial building, and onroad FFCO2 emissions within each of the four urban domains at different spatial resolutions (Figure 4, Figure 5, Figure 6 and Figure 7). Industrial building FFCO2 emissions were ignored because of the relatively small proportion of industrial buildings present. Across the four cities, the Shannon entropy as a function of spatial resolution has a similar shape characterized by a peak, a sharp slope to the left, and a gentle slope to the right. This is best exemplified by the total emissions (Figure 4).
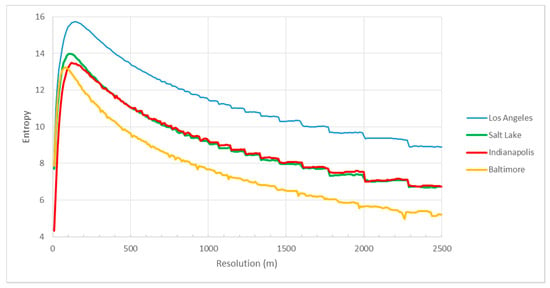
Figure 4.
Shannon entropy values of total FFCO2 emissions (y-axis) versus grid resolution (x-axis) across the four cities.
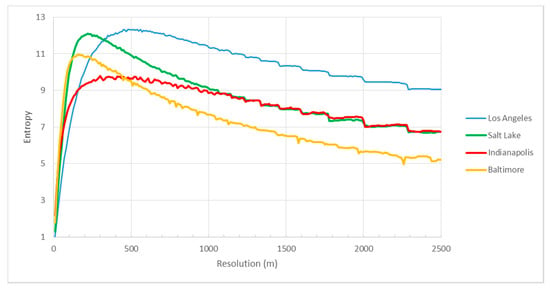
Figure 5.
Shannon entropy values of onroad FFCO2 emissions versus grid resolution (x-axis) across the four cities.
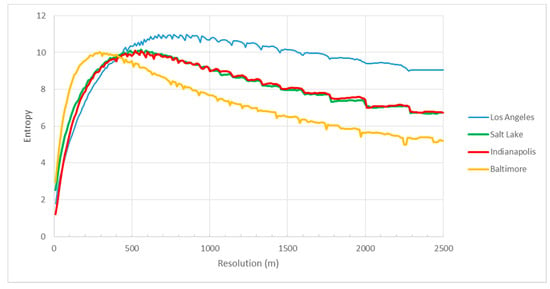
Figure 6.
Shannon entropy values of commercial FFCO2 emissions versus grid resolution (x-axis) across the four cities.
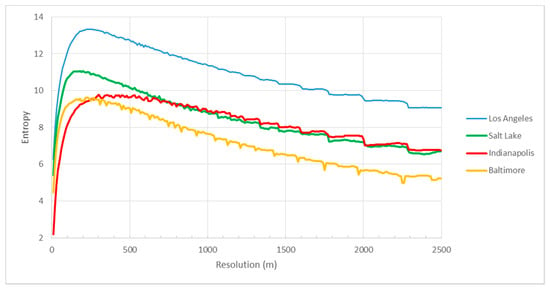
Figure 7.
Shannon entropy values of residential FFCO2 emissions versus grid resolution (x-axis) across the four cities.
The entropy-resolution relationships show a distinctive inflection point (Figure 4, Figure 5, Figure 6 and Figure 7). When the grid cell resolution is increased from an initial coarse 2500 m resolution, the entropy value gradually increases. After reaching the maximum value ranging from 80 to 700 m, the entropy declines rapidly as the grid resolution becomes significantly smaller than the average spatial dimensions of the road segments or buildings/parcels, leading to increasingly redundant information. The maximum entropy value of these curves differs both within a sector (across the four cities) and within a city (across the sectors) as does the resolution at which they reach those maximum values.
According to the Shannon entropy, when the probability of one message or the aggregate probability of a few messages approach one, the entropy approaches zero. This occurs in the onroad sector as the grid resolution becomes increasingly smaller than the average road spacing. The result is that the percentage of empty grid cells approaches a maximum and thus, the entropy approaches zero.
The commercial sector relationships exhibit a more gradual entropy value increase and a less dramatic decline in comparison to the residential sectors. This is possibly attributable to the difference in the size of the shapes between the two sectors. The commercial buildings/parcels have a larger average polygon footprint area. This means in the commercial FFCO2 emissions, a larger proportion of the grid cells are significantly smaller than the building/parcel in which they are contained and result in identical emission values, which cancel out the increase in entropy with smaller grid resolution.
As shown in Figure 4, the entropy-resolution relationships of the total emissions resemble those of the residential emissions and are also similar to those of the onroad emissions to some extent, however, they exhibit a steeper rise and decline as well as a sharper maximum, which usually occurs at a much smaller resolution. Presumably, two reasons may have contributed to the attributes of these relationships: (1) a majority of the spatial heterogeneity present in the total emissions can be attributed to the residential and on-road emissions, which are representative of the dominant sectors; (2) the merging of several sectors into one not only creates a more compact space, which may be closely related to the sharper curve shape, but also brings together a larger number of polygons and polylines that have smaller footprints, which may lead to the shift in the peak toward finer resolutions.
Among the four urban areas, Baltimore has the smallest maximum-entropy resolution value (80 m) for the total and sector-specific FFCO2 emissions, except for the residential sector where Salt Lake City has a slightly smaller maximum-entropy resolution value (Table 1). Baltimore is a dense metropolitan area with relatively large spatial FFCO2 heterogeneity, which can be seen from the spatial distribution of the buildings/parcels. Higher spatial resolution is needed to capture the FFCO2 gradients in this more intensively built-up city. When grid resolution is increased beyond this point, however, an increase in data volume results with little additional gain in effective information. We conclude that the grid cell resolution at the maximum entropy value represents the optimal resolution for the given heterogeneity of the underlying FFCO2 emissions distribution.

Table 1.
Maximum-entropy grid resolution (m) for the total, residential, commercial, and onroad FFCO2 emissions.
Among the three sectors, the general pattern is that the residential and onroad sectors have a significantly smaller maximum-entropy resolution value than the commercial sector. The large values in the commercial sector are likely caused by the relatively larger polygon footprints when compared to the residential sector and the average size of road segments in the onroad sector. The average polygon footprint area of commercial polygons is 27,320 ft2, 94,581 ft2, 7518 ft2, and 40,807 ft2 in Los Angeles, Salt Lake City, Indianapolis, and Baltimore, respectively. By contrast, the average polygon footprint area of residential polygons is 9551 ft2, 10,920 ft2, 1377 ft2, and 3102 ft2, respectively.
To better understand the variation of the max-entropy resolution across the four cities and sectors, we explore how the maximum entropy values relate to urban form metrics. Cross-city comparison was performed only for onroad emissions, because the data sources used in creating the onroad emissions products were relatively uniform in type, structure, and quality across the four cities.
Figure 8 compares the onroad maximum-entropy values in each of the four cities to urban road density (linear road distance/land area: km/km2). The urban areas with greater mean road density have smaller maximum-entropy resolution values, suggesting that as the road density increases, the grid size necessary to capture the information becomes smaller. This means the Shannon entropy can capture the information effectiveness associated with the spatial resolution of gridded FFCO2 emissions across cities.
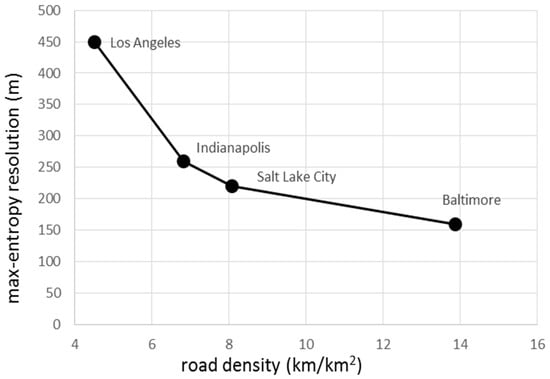
Figure 8.
Onroad maximum-entropy resolution (m, y axis) versus the road density metric across the four urban areas (km/km2, x axis).
4. Analysis and Discussion
An important application of Hestia is to assist community-level mitigation policymaking. To find out the driving factors of urban FFCO2 growth, one needs to understand the relationships between FFCO2 and various social-economic variables such as population, income, housing density, and education []. The finest geographic level at which these social-economic data are available in the U.S. is the U.S. census block group (BG). To avoid confusion, the block group is referred to hereafter as the BG census area. Both the U.S. Decennial Census and American Community Survey provide free access to social-economic statistics at the BG census area level. Hence, the grid resolution of the Hestia FFCO2 data products should better be commensurate with the scale of the BG census area so that the information can be effectively used in studying the relationships between FFCO2 and these social-economic variables.
Baltimore is used as an example to evaluate the extent to which the BG census area-level information can be preserved in the total FFCO2 gridded emissions of different spatial resolutions. First, we integrated the total FFCO2 emissions in the raw Hestia format, represented in point, line, and polygon sources, into the BG census areas by performing geometric intersection and area-weighted allocation in ArcGIS, which we term exact allocation in this context. In performing the exact allocation, we intersected the emissions shapes with the BG census areas and then allocated the emissions to each intersected BG census geography in proportion to the overlapped area (Figure 9A). We then aggregated the gridded emissions at different spatial resolutions (Figure 9B,C) into the BG census areas. In aggregating the gridded emissions into the BG census areas, we simply used the grid cell center to determine whether a grid cell falls into a BG census area.
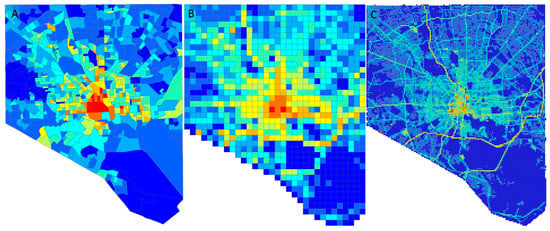
Figure 9.
FFCO2 emissions aggregated at the block group (BG) census area level and in gridded forms in Baltimore: (A) FFCO2 emissions at the BG census area level obtained by exact allocation; (B) Gridded FFCO2 emissions at 500 m; (C) Gridded FFCO2 emissions at 100 m.
We then calculated the correlation coefficient (Figure 10) between the BG census area-level emissions obtained by exact allocation and that by aggregating gridded emissions at different spatial resolutions. The correlation coefficient measures the extent to which the BG census area-level information is preserved in the gridded emissions. Figure 11 shows the correlation coefficient increases rapidly from 1000 m to 100 m and then increases very slowly from 100 m to 10 m. From 100 m to 10 m, the correlation coefficient only changes from 0.992 to 0.999 (Figure 10), which means the BG census area-level information is nearly fully preserved in the gridded emissions below the grid scale of 100 m. This finding is consistent with maximum-entropy grid resolution for the total FFCO2 emissions in Baltimore (Table 1).
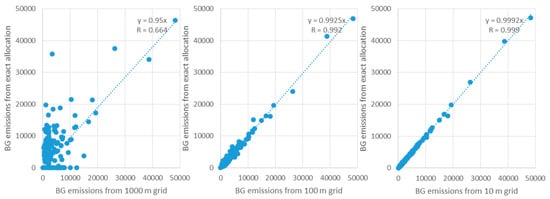
Figure 10.
Correlation coefficient (R) between the BG census area-level emissions from exact allocation and that from 1000 m, 100 m, and 10 m grids (all emissions are in units of metric tons of carbon/year).
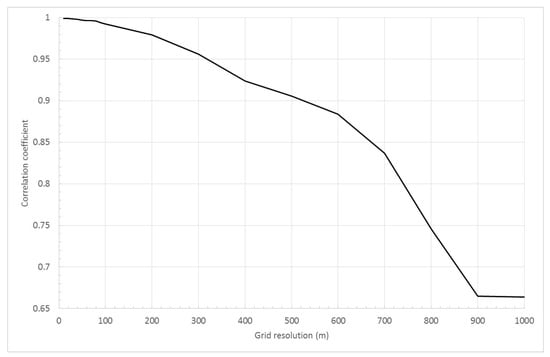
Figure 11.
Correlation coefficient between the BG census area-level emissions obtained by exact allocation and that by aggregating gridded emissions at different spatial resolutions.
In making gridded annual and hourly-resolved FFCO2 emissions products for urban flux integration, the resolution is also an important parameter to determine. An overly small grid resolution guarantees that the effective information of emission vector layers will be well preserved, yet it may lead to an inefficient data volume, especially with hourly-resolved FFCO2 emissions that have a time dimension of 8760. When the cell size gets smaller than the max-entropy resolution, the increased information likely carries more redundancy than effective signals. Additionally, current urban CO2 emissions inversion systems may not be able to accommodate spatial resolutions significantly smaller than 1 km, for example, 100 m. On the contrary, an overly large grid resolution minimizes the data volume and the redundancy, but sacrifices the effective information of the emission vector layers. Therefore, the entropy-resolution relationship can be utilized to assist in determining an appropriate resolution for supporting policy-related analysis and urban flux integration.
In Figure 12, the normalized percentage of maximum entropy (Permax) is plotted against grid resolution across the four Hestia cities. Permax is obtained by dividing the entropy at the starting resolution of 2500 m by the maximum entropy and then normalized to the entropy range. At the max-entropy resolution, Permax is 100%, the information content of the FFCO2 emissions is fully preserved. Though the absolute magnitude of the relationship between grid resolution and the entropy value varied across the four cities (Figure 4), when viewed as proportion to the maximum entropy value, the max-entropy resolution relationship is surprisingly consistent (Figure 12).
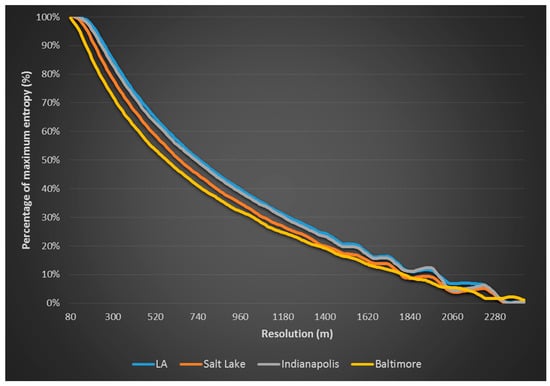
Figure 12.
Percentage of maximum entropy (Permax) across the four cities.
In a recent study that used the Hestia FFCO2 emissions as prior information to an atmospheric CO2 inversion [] the Hestia FFCO2 emissions were rasterized into 1 km grid cells without knowing how much of the heterogeneity in the prior spatial structure was lost. As the inversion relies on the prior emissions information, information loss can have significant effects on the inverted results. The 1000 m resolution used in that study results in Permax of 37%, implying a loss of 63% of the potential information content in the urban FFCO2 emissions. If the attempt was to maintain 50% of the information content, a resolution of 700 m would be required; maintaining 80% would require a 320 m resolution. Although it is difficult to use a 320 m resolution with the present inversion models due to computational limitations and the lack of high-resolution data for other variables, the relationships investigated here provide a quantitative assessment of the information content possible relative to the ideal. This may assist in prioritizing model development and/or additional data gathering in order to run flux inversion studies at higher resolutions.
A number of gridded FFCO2 emissions products, such as Hestia Indianapolis [], Hestia Salt Lake City [], Vulcan [], DARTE [], ODIAC [], and FFDAS [,], have been developed by downscaling inventories using various spatial proxies. The grid resolutions at which these products were created, however, were empirically determined, and they have not been quantitatively assessed to answer questions such as to what extent the underlying information content can be preserved. In the foreseeable future, more and more FFCO2 emissions products will be developed to support multi-level governance of emissions mitigation. One potential application of the proposed method would be to assist in determining an appropriate grid resolution for disseminating these products so the information can be more effectively and efficiently communicated between FFCO2 product developers, urban planners, policymakers, geographers, and atmospheric scientists.
5. Conclusions
By observing and analyzing how the Shannon entropy varies with the FFCO2 emissions in different sectors and cities, we find: (1) the Shannon entropy increases with smaller grid resolution until it reaches a maximum value; (2) total emissions (the sum of several sector-specific emission fields) requires a finer grid cell resolution than each of the sector-specific fields; (3) the residential emissions field requires a finer grid cell resolution than the commercial emissions field; (4) the optimal resolution of the onroad emissions grid is largely dependent on the density of the road network.
These findings suggest that there is a consistent relationship between the Shannon entropy and the underlying information content within the FFCO2 emissions. This means the entropy-resolution relationship can be used to determine an appropriate resolution for urban flux integration. More specifically, one can use the percentage of maximum entropy metric to construct a lookup table, and then atmospheric modelers can find out how much of the prior heterogeneity can be preserved with a specific resolution by looking up the table.
We conclude that the optimal spatial resolution for providing Hestia total FFCO2 emissions products is centered around 100 m, at which information effectiveness becomes maximized and BG census area-level information can nearly be fully preserved. FFCO2 emissions data at a spatial resolution of 100 m can not only fully meet the requirement of urban flux integration, but can also be effectively used in understanding the relationships between FFCO2 emissions and various social-economic variables at the BG census area level.
Acknowledgments
This work was funded in part by the National Institute of Standards and Technology (NIST) under grant #70NANB14H321.
Author Contributions
Jianming Liang conceived and designed the experiments; Jianming Liang implemented the methods; Jianming Liang and Kevin Gurney analyzed the data; all the other authors participated in developing the Hestia emissions products.
Conflicts of Interest
The authors declare no conflict of interest.
References
- Hansen, J.E. Sir John Houghton: Global Warming: The Complete Briefing, 2nd edition. J. Atmos. Chem. 1998, 30, 409–412. [Google Scholar] [CrossRef]
- Gurney, K.R.; Romero-Lankao, P.; Seto, K.C.; Hutyra, L.R.; Duren, R.; Kennedy, C.; Grimm, N.B.; Ehleringer, J.R.; Marcotullio, P.; Hughes, S.; et al. Climate change: Track urban emissions on a human scale. Nature 2015, 525, 179–181. [Google Scholar] [CrossRef] [PubMed]
- Seto, K.C.; Güneralp, B.; Hutyra, L.R. Global forecasts of urban expansion to 2030 and direct impacts on biodiversity and carbon pools. Proc. Natl. Acad. Sci. USA 2012, 109, 16083–16088. [Google Scholar] [CrossRef] [PubMed]
- Romero-Lankao, P.; Gurney, K.R.; Seto, K.C.; Chester, M.; Duren, R.M.; Hughes, S.; Hutyra, L.R.; Marcotullio, P.; Baker, L.; Grimm, N.B.; et al. A critical knowledge pathway to low-carbon, sustainable futures: Integrated understanding of urbanization, urban areas, and carbon. Earth’s Future 2014, 2, 515–532. [Google Scholar] [CrossRef]
- Chester, M.V.; Sperling, J.; Stokes, E.; Allenby, B.; Kockelman, K.; Kennedy, C.; Baker, L.A.; Keirstead, J.; Hendrickson, C.T. Positioning infrastructure and technologies for low-carbon urbanization. Earth’s Future 2014, 2, 533–547. [Google Scholar] [CrossRef]
- Marcotullio, P.J.; Hughes, S.; Sarzynski, A.; Pincetl, S.; Sanchez Peña, L.; Romero-Lankao, P.; Runfola, D.; Seto, K.C. Urbanization and the carbon cycle: Contributions from social science. Earth’s Future 2014, 2, 496–514. [Google Scholar] [CrossRef]
- Hutyra, L.R.; Duren, R.; Gurney, K.R.; Grimm, N.; Kort, E.A.; Larson, E.; Shrestha, G. Urbanization and the carbon cycle: Current capabilities and research outlook from the natural sciences perspective. Earth’s Future 2014, 2, 473–495. [Google Scholar] [CrossRef]
- Bréon, F.M.; Broquet, G.; Puygrenier, V.; Chevallier, F.; Xueref-Remy, I.; Ramonet, M.; Dieudonné, E.; Lopez, M.; Schmidt, M.; Perrussel, O.; et al. An attempt at estimating Paris area CO2 emissions from atmospheric concentration measurements. Atmos. Chem. Phys. 2015, 15, 1707–1724. [Google Scholar] [CrossRef]
- Brioude, J.; Angevine, W.M.; Ahmadov, R.; Kim, S.-W.; Evan, S.; McKeen, S.A.; Hsie, E.-Y.; Frost, G.J.; Neuman, J.A.; Pollack, I.B.; et al. Top-down estimate of surface flux in the Los Angeles Basin using a mesoscale inverse modeling technique: Assessing anthropogenic emissions of CO, NOx and CO2 and their impacts. Atmos. Chem. Phys. 2013, 13, 3661–3677. [Google Scholar] [CrossRef]
- Gurney, K.R.; Razlivanov, I.; Song, Y.; Zhou, Y.; Benes, B.; Abdul-Massih, M. Quantification of fossil fuel CO2 emissions on the building/street scale for a large US city. Environ. Sci. Technol. 2012, 46, 12194–12202. [Google Scholar] [CrossRef] [PubMed]
- Patarasuk, R.; Gurney, K.R.; O’Keeffe, D.; Song, Y.; Huang, J.; Rao, P.; Buchert, M.; Lin, J.C.; Mendoza, D.; Ehleringer, J.R. Urban high-resolution fossil fuel CO2 emissions quantification and exploration of emission drivers for potential policy applications. Urban Ecosyst. 2016, 19, 1013–1039. [Google Scholar] [CrossRef]
- Cambaliza, M.O.L.; Shepson, P.B.; Caulton, D.R.; Stirm, B.; Samarov, D.; Gurney, K.R.; Turnbull, J.; Davis, K.J.; Possolo, A.; Karion, A.; et al. Assessment of uncertainties of an aircraft-based mass balance approach for quantifying urban greenhouse gas emissions. Atmos. Chem. Phys. 2014, 14, 9029–9050. [Google Scholar] [CrossRef]
- Turnbull, J.C.; Keller, E.D.; Baisden, T.; Brailsford, G.; Bromley, T.; Norris, M.; Zondervan, A. Atmospheric measurement of point source fossil CO2 emissions. Atmos. Chem. Phys. 2014, 14, 5001–5014. [Google Scholar] [CrossRef]
- Lauvaux, T.; Miles, N.L.; Deng, A.; Richardson, S.J.; Cambaliza, M.O.; Davis, K.J.; Gaudet, B.; Gurney, K.R.; Huang, J.; O’Keefe, D.; et al. High-resolution atmospheric inversion of urban CO2 emissions during the dormant season of the Indianapolis Flux Experiment (INFLUX). J. Geophys. Res. Atmos. 2016, 121, 5213–5236. [Google Scholar] [CrossRef]
- McKain, K.; Wofsy, S.C.; Nehrkorn, T.; Eluszkiewicz, J.; Ehleringer, J.R.; Stephens, B.B. Assessment of ground-based atmospheric observations for verification of greenhouse gas emissions from an urban region. Proc. Natl. Acad. Sci. USA 2012, 109, 8423–8428. [Google Scholar] [CrossRef] [PubMed]
- Betsill, M.M.; Bulkeley, H. Cities and the multilevel governance of global climate change. Glob. Gov. 2006, 12, 141–159. [Google Scholar]
- Rayner, P.J.; Raupach, M.R.; Paget, M.; Peylin, P.; Koffi, E. A new global gridded data set of CO2 emissions from fossil fuel combustion: Methodology and evaluation. J. Geophys. Res. Atmos. 2010, 115. [Google Scholar] [CrossRef]
- Asefi-Najafabady, S.; Rayner, P.J.; Gurney, K.R.; McRobert, A.; Song, Y.; Coltin, K.; Huang, J.; Elvidge, C.; Baugh, K. A multiyear, global gridded fossil fuel CO2 emission data product: Evaluation and analysis of results. J. Geophys. Res. Atmos. 2014, 119, 10213–10231. [Google Scholar] [CrossRef]
- Gurney, K.R.; Mendoza, D.L.; Zhou, Y.; Fischer, M.L.; Miller, C.C.; Geethakumar, S.; de la Rue du Can, S. High resolution fossil fuel combustion CO2 emission fluxes for the United States. Environ. Sci. Technol. 2009, 43, 5535–5541. [Google Scholar] [CrossRef] [PubMed]
- National Emissions Inventory (NEI). 2011. Available online: https://www.epa.gov/air-emissions-inventories/2011-national-emissions-inventory-nei-data (accessed on 10 February 2017).
- Jones, C.; Kammen, D.M. Spatial distribution of US household carbon footprints reveals suburbanization undermines greenhouse gas benefits of urban population density. Environ. Sci. Technol. 2014, 48, 895–902. [Google Scholar] [CrossRef] [PubMed]
- Jones, C.M.; Kammen, D.M. A Consumption-Based Greenhouse Gas Inventory of San Francisco Bay Area Neighborhoods, Cities and Counties: Prioritizing Climate Action for Different Locations. Bay Area Air Quality Management District. UC Berkeley 2015. Available online: https://escholarship.org/uc/item/2sn7m83z (accessed on 1 January 2017).
- VandeWeghe, J.R.; Kennedy, C.A. A Spatial Analysis of Residential Greenhouse Gas Emissions in the Toronto Census Metropolitan Area. J. Ind. Ecol. 2007, 11, 133–144. [Google Scholar] [CrossRef]
- Zhao, T.; Horner, M.W.; Sulik, J. A geographic approach to sectoral carbon inventory: Examining the balance between consumption-based emissions and land-use carbon sequestration in Florida. Ann. Assoc. Am. Geogr. 2011, 101, 752–763. [Google Scholar] [CrossRef]
- Porse, E.; Derenski, J.; Gustafson, H.; Elizabeth, Z.; Pincetl, S. Structural, geographic, and social factors in urban building energy use: Analysis of aggregated account-level consumption data in a megacity. Energy Policy 2016, 96, 179–192. [Google Scholar] [CrossRef]
- Lauvaux, T.; Pannekoucke, O.; Sarrat, C.; Chevallier, F.; Ciais, P.; Noilhan, J.; Rayner, P.J. Structure of the transport uncertainty in mesoscale inversions of CO2 sources and sinks using ensemble model simulations. Biogeosciences 2009, 6, 1089–1102. [Google Scholar] [CrossRef]
- Thornton, P.E.; Running, S.W.; White, M.A. Generating surfaces of daily meteorological variables over large regions of complex terrain. J. Hydrol. 1997, 190, 204–251. [Google Scholar] [CrossRef]
- Openshaw, S. A geographical solution to scale and aggregation problems in region-building, partitioning and spatial modelling. Trans. Inst. Br. Geogr. 1977, 4, 459–472. [Google Scholar] [CrossRef]
- Openshaw, S.; Rao, L. Algorithms for Reengineering 1991 Census Geography. Environ. Plan. A 1995, 27, 425–446. [Google Scholar] [CrossRef] [PubMed]
- Cockings, S.; Harfoot, A.; Martin, D.; Hornby, D. Maintaining existing zoning systems using automated zone-design techniques: Methods for creating the 2011 Census output geographies for England and Wales. Environ. Plan. A 2011, 43, 2399–2418. [Google Scholar] [CrossRef]
- Batty, M. Spatial entropy. Geogr. Anal. 1974, 6, 1–31. [Google Scholar] [CrossRef]
- Shannon, C.E. A Mathematical Theory of Communication; ACM SIGMOBILE Mobile Computing and Communications Review: New York, NY, USA, 2001; Volume 5, pp. 3–55. [Google Scholar]
- Moeckel, R.; Donnelly, R. Gradual rasterization: Redefining spatial resolution in transport modelling. Environ. Plan. B 2015, 42, 888–903. [Google Scholar] [CrossRef]
- Zhao, J.; Chen, X.; Bao, A.; Zhang, C.; Shi, W. A method for choice of optimum scale on land use monitoring in Tarim River Basin. J. Geogr. Sci. 2009, 19, 340–350. [Google Scholar] [CrossRef]
- Stoy, P.C.; Williams, M.; Spadavecchia, L.; Bell, R.A.; Prieto-Blanco, A.; Evans, J.G.; Van Wijk, M.T. Using information theory to determine optimum pixel size and shape for ecological studies: Aggregating land surface characteristics in Arctic ecosystems. Ecosystems 2009, 12, 574–589. [Google Scholar] [CrossRef]
- Schumann, A.H.; Geyer, J. GIS-based ways for considering spatial heterogeneity of catchment characteristics. Phys. Chem. Earth Part B 2000, 25, 691–694. [Google Scholar] [CrossRef]
- Singh, V.P. Entropy Theory and Its Application in Environmental and Water Engineering; John Wiley & Sons: New York, NY, USA, 2013. [Google Scholar]
- Jost, L. Entropy and diversity. Oikos 2006, 113, 363–375. [Google Scholar] [CrossRef]
- Balzter, H.; Tate, N.J.; Kaduk, J.; Harper, D.; Page, S.; Morrison, R.; Muskulus, M.; Jones, P. Multi-Scale Entropy Analysis as a Method for Time-Series Analysis of Climate Data. Climate 2015, 3, 227–240. [Google Scholar] [CrossRef]
- Schneider, A.; Friedl, M.A.; Potere, D. A new map of global urban extent from MODIS satellite data. Environ. Res. Lett. 2009, 4, 044003. [Google Scholar] [CrossRef]
- Bartholomé, E.; Belward, A.S. GLC2000: A new approach to global land cover mapping from Earth observation data. Int. J. Remote Sens. 2005, 26, 1959–1977. [Google Scholar] [CrossRef]
- Balk, D.L.; Deichmann, U.; Yetman, G.; Pozzi, F.; Hay, S.I.; Nelson, A. Determining global population distribution: Methods, applications and data. Adv. Parasitol. 2006, 62, 119–156. [Google Scholar] [PubMed]
- Zhou, Y.; Smith, S.J.; Elvidge, C.D.; Zhao, K.; Thomson, A.; Imhoff, M. A cluster-based method to map urban area from DMSP/OLS nightlights. Remote Sens. Environ. 2014, 147, 173–185. [Google Scholar] [CrossRef]
- Gately, C.K.; Hutyra, L.R.; Wing, I.S. Cities, traffic, and CO2: A multidecadal assessment of trends, drivers, and scaling relationships. Proc. Natl. Acad. Sci. USA 2015, 112, 4999–5004. [Google Scholar] [CrossRef] [PubMed]
- Oda, T.; Maksyutov, S. A very high-resolution (1 km × 1 km) global fossil fuel CO2 emission inventory derived using a point source database and satellite observations of nighttime lights. Atmos. Chem. Phys. 2011, 11, 543–556. [Google Scholar] [CrossRef]
© 2017 by the authors. Licensee MDPI, Basel, Switzerland. This article is an open access article distributed under the terms and conditions of the Creative Commons Attribution (CC BY) license (http://creativecommons.org/licenses/by/4.0/).