Article

Concentrations and Size Distributions of Bacteria-Containing Particles over Oceans from China to the Arctic Ocean

1
Anhui Province Key Laboratory of Polar Environment and Global Change, School of Earth and Space Sciences, University of Science and Technology of China, Hefei 230026, China
2
State Key Laboratory of Loess and Quaternary Geology, Institute of Earth Environment, Chinese Academy of Sciences, Xi’an 710075, China
3
Department of Earth and Atmospheric Sciences, City College of New York, New York, NY 10031, USA
*
Author to whom correspondence should be addressed.
Atmosphere 2017, 8(5), 82; https://doi.org/10.3390/atmos8050082
Submission received: 15 February 2017 / Revised: 9 April 2017 / Accepted: 24 April 2017 / Published: 2 May 2017
(This article belongs to the Special Issue Biological Particles in Atmosphere)

Abstract

:
During the third China Arctic Research Expedition (July–September 2008), size-resolved measurements of bacteria-containing particles (BCPs) in the marine boundary layer (MBL) air were conducted during a cruise through the East China Sea, the Yellow Sea, the Japan Sea, the Okhotsk Sea, the Bering Sea, the Chukchi Sea, and the Arctic Ocean. The concentrations of total airborne BCPs (TBCPs), non-salt tolerant airborne BCPs (NSBCPs), and salt tolerant airborne BCPs (SBCPs) varied from 29 to 955 CFU m−3 (CFU = Colony Forming Unit), 16 to 919 CFU m−3, and 4 to 276 CFU m−3, with an average value of 275, 182, and 92 CFU m−3, respectively. Although the SBCP concentrations were less than the NSBCP concentrations when averaged over all measurements, there are several cases where the reverse is true (e.g., in the high Arctic Ocean). During the cruise, the TBCP sizes were dominated by the diameter >4.7 μm fraction (accounted for 46.3% on average), while the fine fraction (diameter <2.1 μm) accounted for 27.8%. For NSBCPs and SBCPs, the coarse fraction also was the dominant fraction over most regions. The influence of local meteorological conditions on the abundance, size distributions, and species of airborne bacteria is discussed. Notably, in the atmosphere over the Arctic Ocean the abundance of airborne bacteria was apparently related to the distribution of sea ice. As cultivation based methodologies may underestimate the environmental bacterial communities, it is expected that the abundance of bacteria in the ambient air would be higher than that observed in this study. In order to distinguish different species of bacteria, molecular biological techniques (e.g., 16S rDNA analysis) are required for identification in future investigations.

1. Introduction

Airborne bacteria are ubiquitous and play an important role in public health [1,2]. Moreover, airborne bacteria may potentially influence the formation of clouds and precipitation by serving as biogenic nuclei of water droplets and ice crystals [2,3,4,5]. At present, however, the concentrations and size distributions of airborne bacteria in different regions of the Earth are not well characterized [2]. Most studies on the concentrations of airborne bacteria have been carried out in continental areas, with a handful in coastal regions [6,7,8,9,10,11]. There are only a few studies measuring bacterial concentrations in marine air, and even fewer over polar waters [12,13].
In recent decades, several studies [8,14] have been carried out to characterize the abundance of airborne bacteria at continental sites of various landscape types (mostly in short measurement campaigns of up to a few weeks in duration). For example, mean spring concentrations in aerosols were found to be 1.1 × 10⁴ CFU m−3 (CFU = Colony Forming Unit) [7] and 1.6 × 10⁴ CFU m−3 [15] at rural sites in Austria and England, respectively. Lighthart and Shaffer [16] reported a mean cultivable bacteria concentration of 609 CFU m−3 at a forest site. In some urban sites, the concentrations of airborne bacteria ranged from 0 to 7220 CFU m−3 [17,18].
Background concentrations of airborne bacteria in clean continental air observed at Mt. Rex, Austria were about 1.1 × 10⁴ CFU m−3 [7]. However, the concentrations of atmospheric bacteria of some coastal regions were lower than the concentrations over land atmosphere. For example, concentrations of atmospheric bacteria collected from marine air arriving at a coastal, cliff-top site in Barbados were about 2–3 orders of magnitude lower than those over land [19]. Concentrations of total bioaerosols ranged from 8.5 × 10⁴ to 1.7 × 10⁵ cells m−3 in the Qingdao coastal region [10] and from 580 to 778 CFU m−3in an embayment adjacent to the East River in western Long Island Sound [11]. Bacterial concentrations in the marine atmosphere are even lower, e.g., a few to ~100 CFU m−3 over the open Baltic Sea [20].
As to the sources of bacteria in marine air, it has been suggested that bacteria and other primary biological particles can be released into the atmosphere from the sea-surface micro-layer (SML) by the bursting of bubbles in breaking waves, a process that occurs both during wave-breaking at the coasts, and in whitecaps on wind-driven waves in the open ocean [3,21]. Bacterial concentrations in sea spray aerosols can be significantly enriched relative to concentrations in the SML, which in turn are enriched relative to concentrations in the bulk water. Such enrichment has been observed both in laboratory-generated aerosols [3] and in marine aerosols relative to underlying waters [22]. Some studies have shown indirect evidence that some bacteria collected in marine air may originate from a marine source, for instance by demonstrating genetic similarity between some strains of marine bacteria and airborne bacteria [23,24,25]. In addition, atmospheric turbulence can lead to the transmission of biological aerosols between different regions [26,27], so airborne bacteria over oceans may be derived from other sources and carried to the environment through long-range transport processes. Burrows et al. [2,28] simulated large-scale atmospheric transport of 1µm particles emitted from different ecosystems including coastal, deserts, forests, urban, seas, grasslands, and so on. The results demonstrated that bacteria from other ecosystems could also contribute significantly to the concentrations of bacteria over oceans.
The measurement of airborne bacterial concentrations is in general conducted in two steps: aerosol collection in the field and analysis in the laboratory. Filtration and impaction are the two most widely used collection methods, which are followed by cultivation techniques or epi-fluorescence microscopy to determine the concentrations of bacteria-containing particles [2].
During the third China Arctic Research Expedition (July–September 2008), bacteria-containing particles (BCPs) were investigated using a six-stage air sampler with cultivation. The cruise path covered many regions including the Eastern China Sea, the Yellow Sea, the Japan Sea, the Okhotsk Sea, the Bering Sea, and the Arctic Ocean (38°36′ N to 85°25′ N). The project provides an opportunity to understand the sources and changes in concentrations of airborne BCPs in the marine boundary layer from low to high latitudes. Here we report the abundance and size distributions of BCPs measured during the expedition. The potential impacts of meteorological variables on the spatial distribution of airborne bacteria are also discussed.

2. Experimental Methods

2.1. Sampling Data

Samples were collected in the marine boundary layer along a cruise path from Shanghai, China to the Arctic Ocean during the third China Arctic Research Expedition (11 July–24 September 2008). The sampling details are given in Table 1. The procedure for sample collection and bacteria cultivation was based on the method described by a previous report [10]. Briefly, the bioaerosol samples were collected using a six-stage cultivable microorganism FA-1 multi-orifice cascade impactor (Applied Technical Institute of Liaoyang, Liaoyang, China) with a flow rate of 28.3 L min−1. No cyclone inlet was installed, thus total suspended particles were collected and separated according to their individual sizes on the different stages of the sampler. The particle sizes were fractionated into six size ranges: >7.0 μm (stage 1), 4.7–7.0 μm (stage 2), 3.3–4.7 μm (stage 3), 2.1–3.3 μm (stage 4), 1.1–2.1 μm (stage 5), 0.65–1.1 µm (stage 6). Two samplers with a 50-cm Teflon inlet each were installed on the front deck of the ship 0.5 m away from each other and about 30 m above sea level to avoid ship contamination. The cultivable microorganism samples were collected on 9.0-cmPetri dishes containing an agar medium. The collection duration for each sample ranged from 10 min to 20 min (Table 1). Two groups of samples were collected at each of the 20 sites. As the sampler has six stages, the total number of samples in each group was 120. To control the collection process in both sampling devices blanks were taken routinely at every site. Agar plates were mounted into the sampler and removed directly without turning the pump on. Blanks were made and treated as the real samples. Since the FA-1 cascade impactor collects the airborne particles, the individual colonies formed on the culture medium may be formed by the presence of multiple bacteria contained in the particle, so in this study we use the number of bacteria-containing particles instead of cultivable bacteria.

2.2. Bacterial Cultivation

As soon as the sample was collected on the culture medium, it was immediately carried to the laboratory on the ship and cultivated. As in the previous research [10], two different kinds of agar were used for the cultivation of bacteria: beef extract-peptone medium (3 g beef extract, 10 g peptone, 5 g NaCl, 16 g agar, 1 L distilled H2O, pH 7.2–7.6) and 2216E medium (5 g peptone, 1 g yeast extract, 0.1 g FePO4, 15 g agar, 400 mL distilled H2O, and 600 mL aging seawater, pH 7.2–7.6). Both agars had 50 mg/L cycloheximide to suppress fungal growth. In addition, 2216E medium yielded 3.2% NaCl to reflect the salty environment in oceans [29,30,31]. The difference between these two media is that the bacteria cultured on the 2216E medium are more resistant to salt, as the 2216E medium is usually used to culture marine bacteria [10,32]. The 2216E medium was used here because the marine atmosphere may contain more salt-tolerant bacteria. Here, the bacteria incubated on the beef extract-peptone medium are named non-salt tolerant airborne BCPs (NSBCPs), and the bacteria cultivate on the 2216E medium are named salt tolerant airborne BCPs (SBCPs). The incubation time for both media was 48 h and was chosen in a way that the bacterial colonies could grow large enough to be visible. The incubation temperature, however, was different between the two media. The NSBCP samples were incubated at 37 °C, as suggested by the literature, whereas the SBCP samples were incubated at RT (Room Temperature, approximately 28 °C) [10]. As the room had air conditioning, the temperature did not vary much during the cruise.

2.3. Ancillary Data

The meteorological data were recorded simultaneously, including information on the temperature, relative humidity, atmospheric pressure, wind direction, and wind speed. Ice data were obtained from the NASA (National Aeronautics and Space Administration) Earth Observations website (https://neo.sci.gsfc.nasa.gov/view.php?datasetId=NISE_D).

3. Results and Discussion

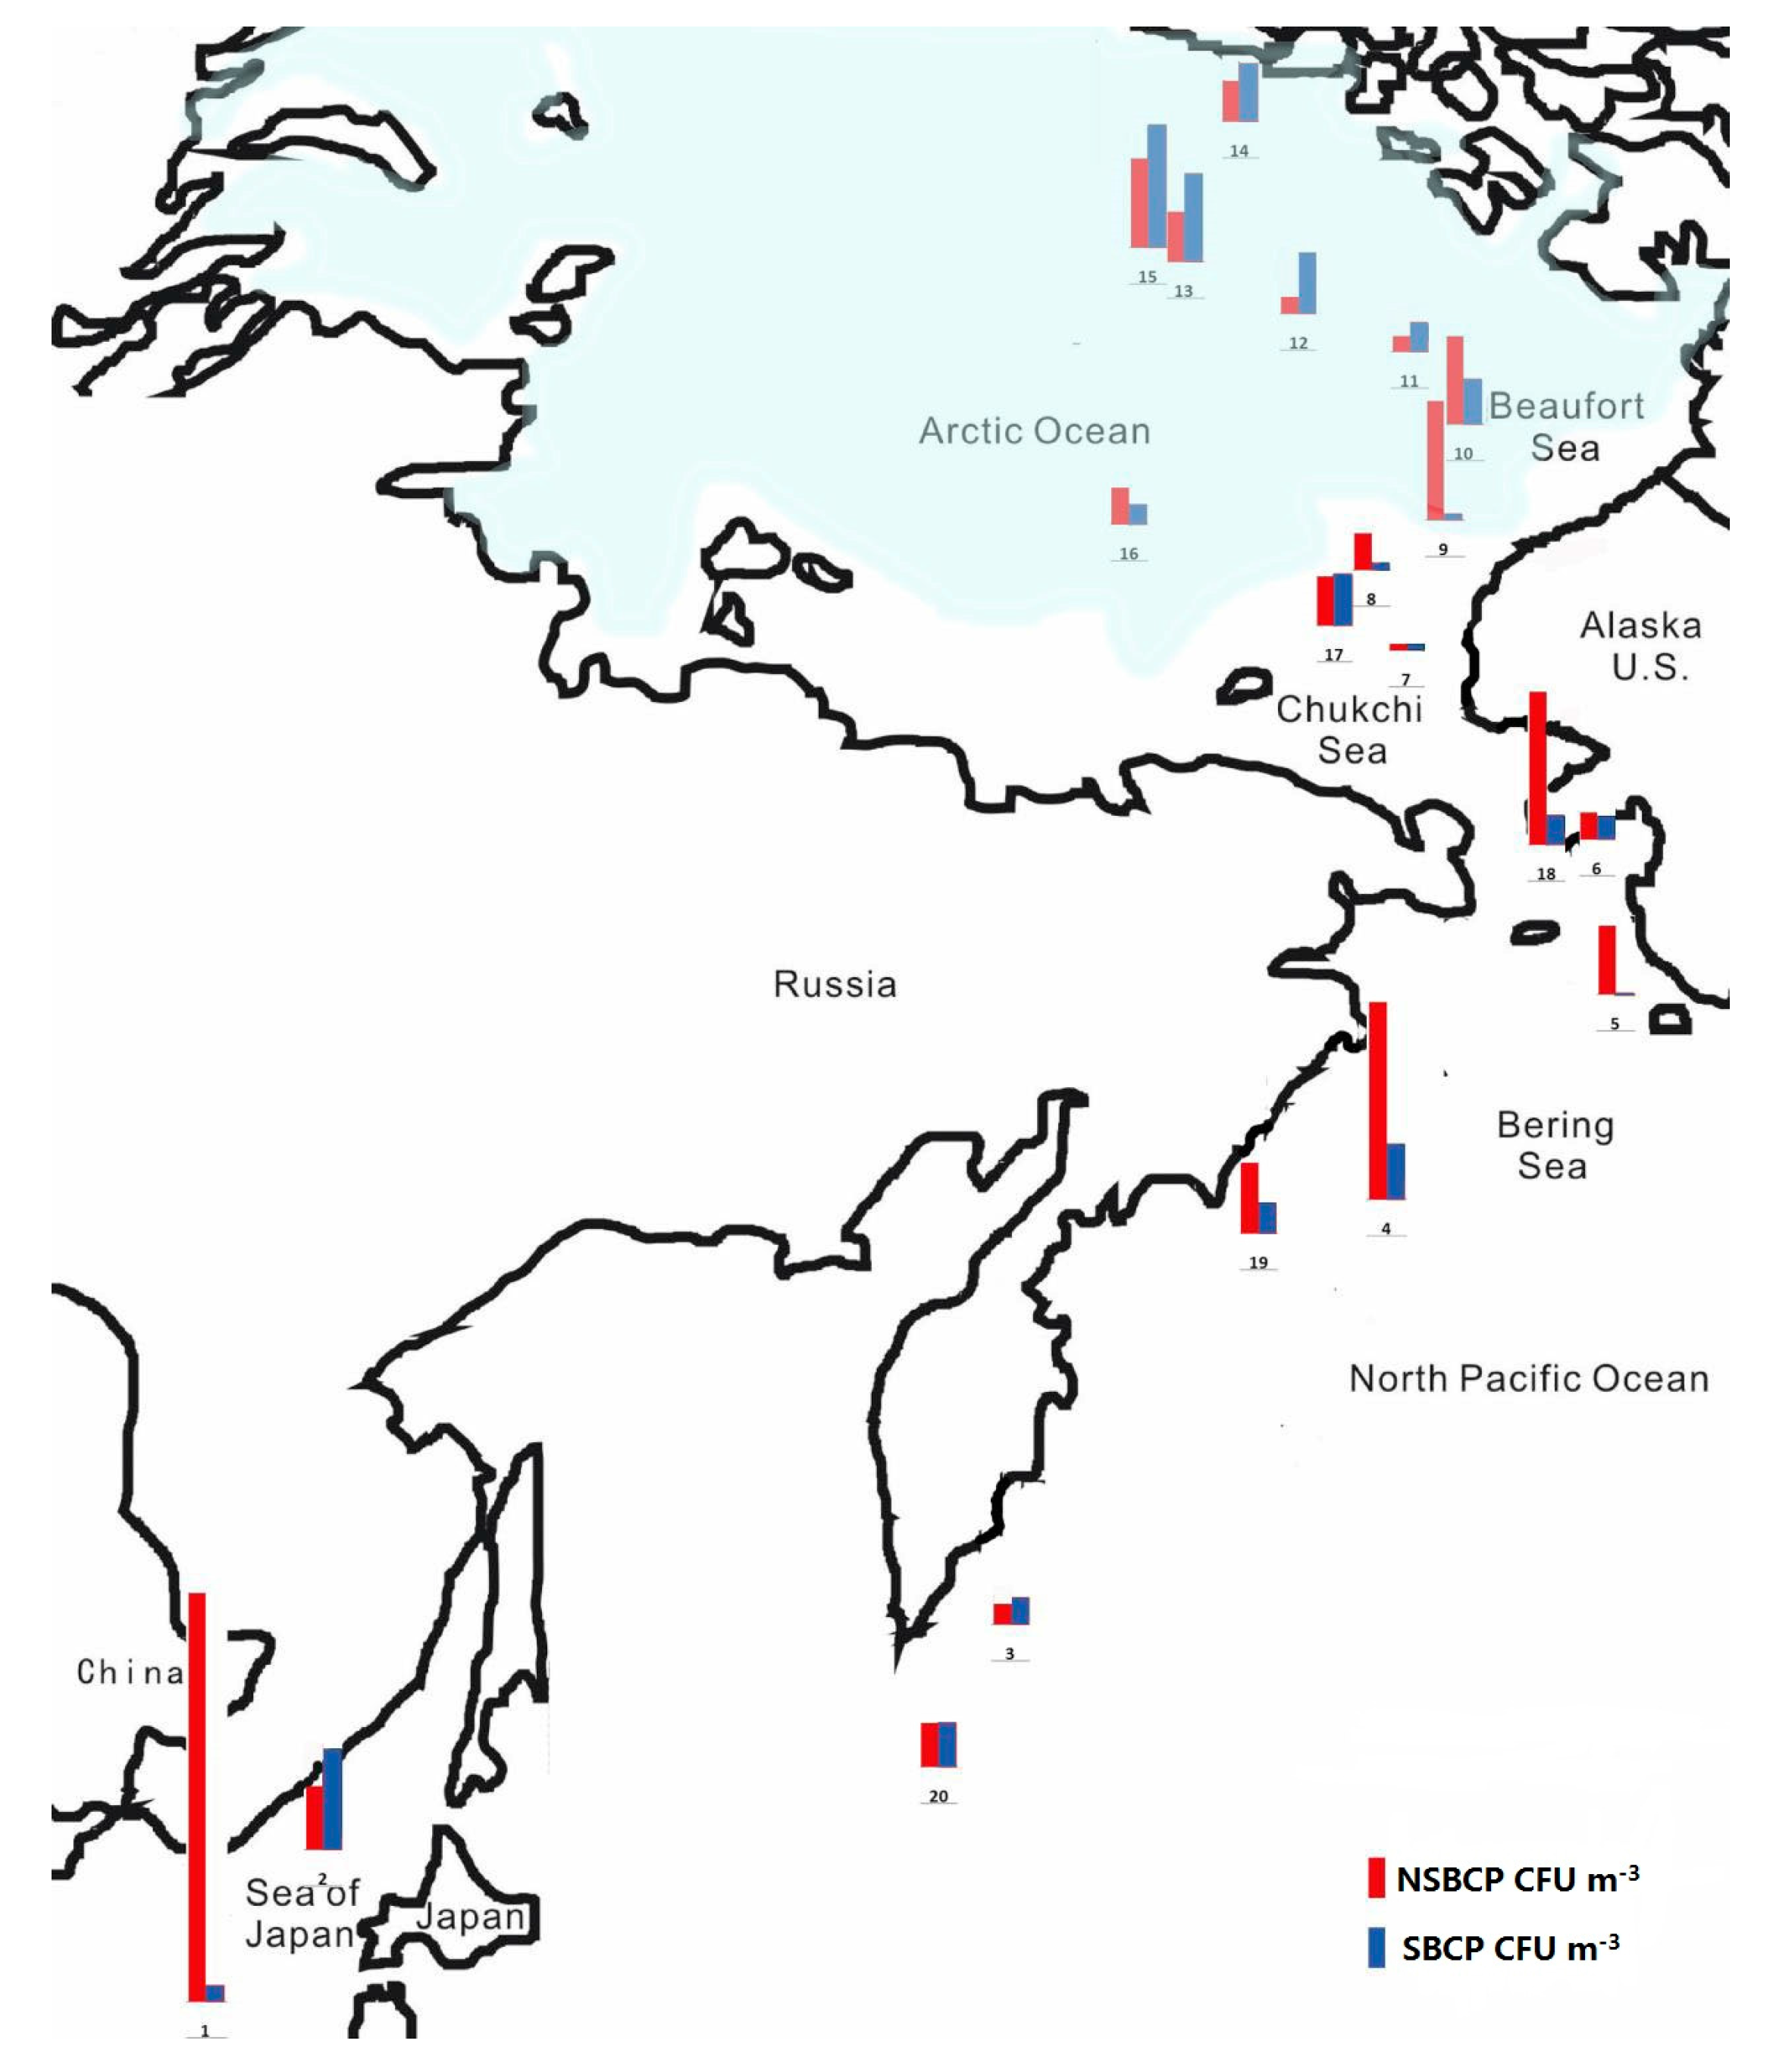
3.1. Concentrations of Bacteria-Containing Particles

The atmospheric concentrations of bacteria-containing particles (BCPs) can be calculated from the colony counts and the total volume of air sampled. The concentrations of BCPs for each sampling site are shown in Figure 1. All controls were negative.
During the entire sampling period, the total BCP (TBCP) concentrations (including all six stages, non-salt tolerance and salt tolerance) ranged from 29 CFU m−3 (site 7) to 955 CFU m−3 (site 1), with an average concentration of 275 CFU m−3 and coefficient of variation of 76.7%. Most of the high TBCP concentrations were found near coast areas (e.g., site 1, 2, 4, 18). The concentrations of NSBCPs of all six stages ranged from 16 CFU m−3 (site 7) to 919 CFU m−3 (site 1), with a mean of 182 CFU m−3 and coefficient of variation of 112.0%. Many of the high concentrations were found in the coast regions, e.g., site 1 (919 CFU m−3, 133° E 38° N), site 4 (445 CFU m−3, 179° E 59° N) and site 18 (346 CFU m−3, 165° W 64° N), but some high concentrations were also observed in the Arctic Ocean (site 9, 10, and 15). The large number of NSBCPs in the marine boundary layer may be influenced by the continental bacteria. As latitude increases, the concentrations of NSBCPs decreased (R = −0.473, p < 0.05). The concentrations of SBCPs varied considerably, ranging from 4 CFU m−3 (site 5, 165° W 64° N) to 276 CFU m−3 (site 15, 148° W 84° N) with an average value of 92 CFU m−3 and coefficient of variation of 80.3%. Although the SBCP concentration on average was lower than that of NSBCPs (92 vs. 182 CFU m−3), the former could be occasionally higher than the latter, e.g., in the high Arctic Ocean. This was consistent with earlier observations [33,34] and model predictions [2] that bacteria are abundant in marine air in this region, where continental outflow contributes significantly to the atmospheric aerosols.
Sampling locations were separated into three geographic groups for further analysis: Group I: the East China Sea, the Japan Sea, and the Northwest Pacific (sites 1–4, 19, 20); Group II: the Bering Sea and the Chukchi Sea (sites 5–8, 17, 18); Group III: the western Arctic Ocean (sites 9–16). Geographically, the concentrations of TBCPs ranged from 89 to 955 CFU m−3 with an average of 401 ± 317 CFU m−3, 29–412 with an average of 177 ± 132 CFU m−3, and 104–478 CFU m−3 with an average of 253 ± 117 CFU m−3 in Group I, Group II, and Group III, respectively. The average concentrations of NSBCPs varied from 298 CFU m−3 in Group I (coefficient of variation 112.6%), 133 CFU m−3 in Group III (coefficient of variation 86.1%), to 133 CFU m−3 in Group II (coefficient of variation 63.3%). The spatial distribution of SBCPs appeared to differ from that of NSBCPs: observed concentrations of SBCPs were 103 CFU m−3 in Group I (coefficient of variation 66.4%), 44 CFU m−3 in Group II (coefficient of variation 95.3%), and 120 CFU m−3 in Group III (coefficient of variation 71.1%). In the Group I area, the ratios of NSBCPs and SBCPs to TBCPs were 61% and 39%, respectively. In Group II and Group III areas, NSBCPs and SBCPs accounted for 72% and 28%, and 51% and 49% of TBCPs, respectively. The results showed that there are more salt tolerant bacteria in the Arctic Ocean.

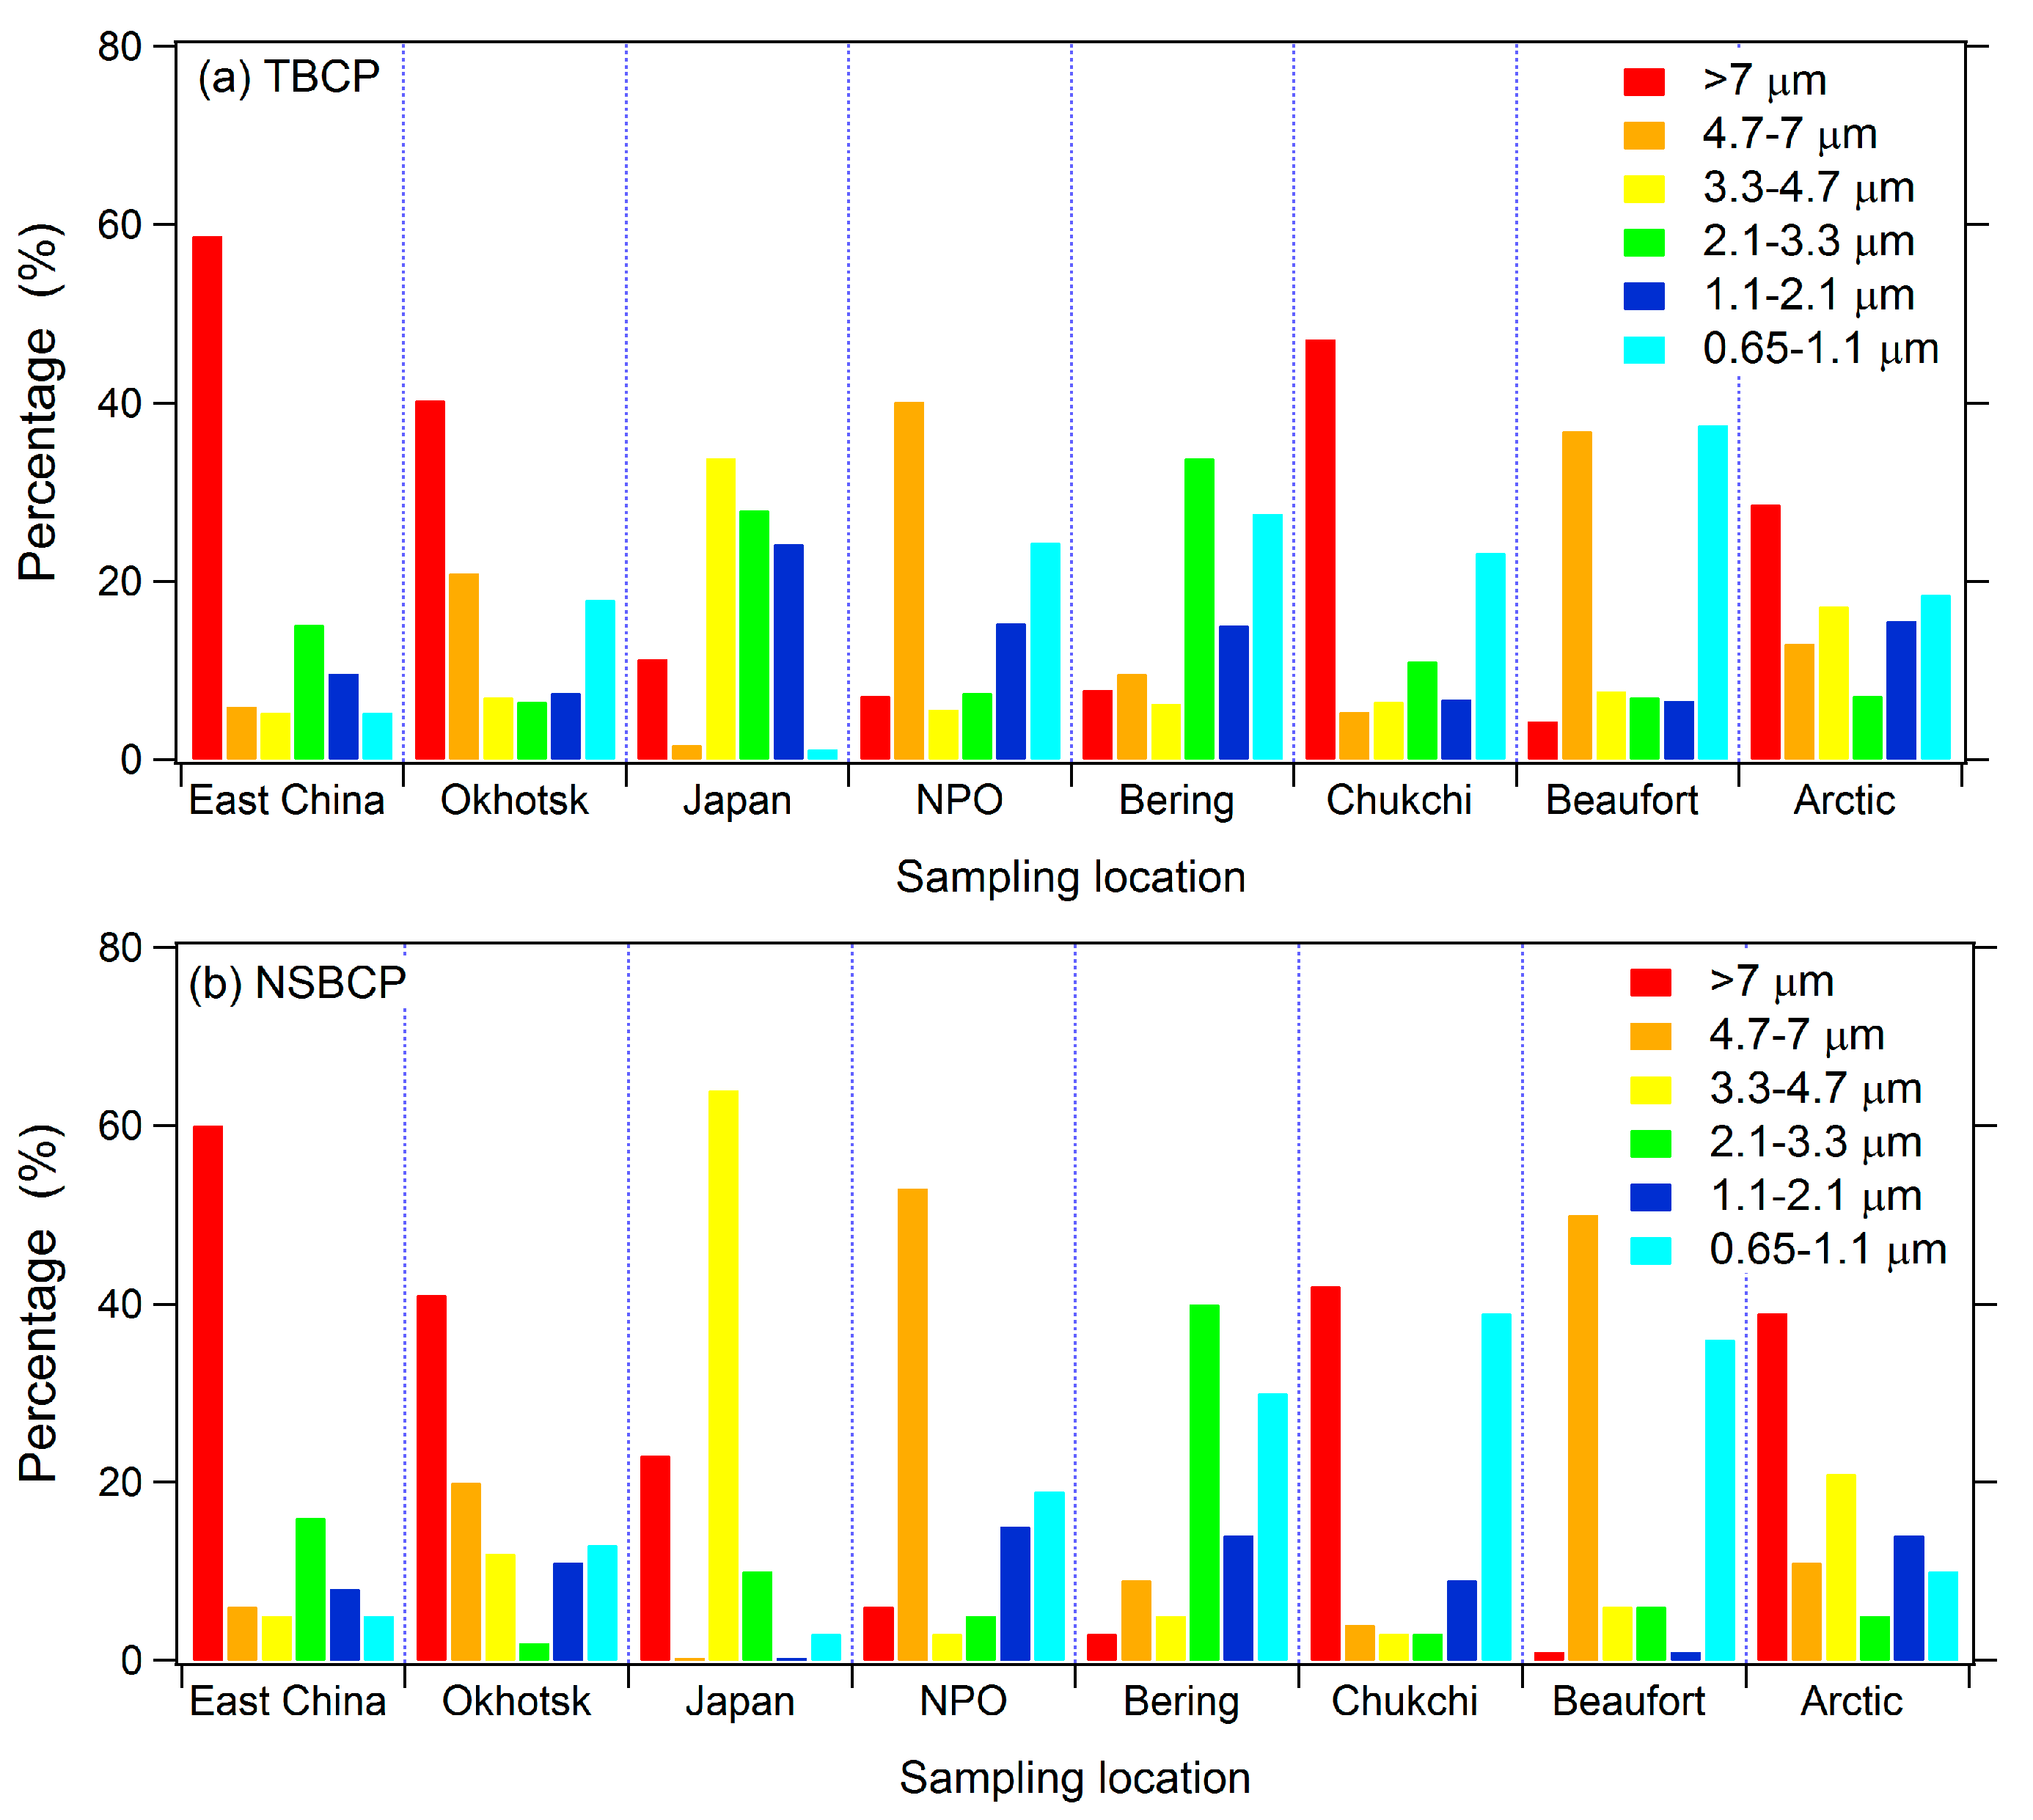
3.2. Size Distributions

The size-resolved bacteria fraction at different locations is shown in Figure 2. Figure 2a presents the percentages of each stage’s BCP to TBCPs of each sampling site. The average concentrations of TBCPs over different regions by size were 108 CFU m−3 (stage 1), 49 CFU m−3 (stage 2), 36 CFU m−3 (stage 3), 52 CFU m−3 (stage 4), 43 CFU m−3 (stage 5), and 52 CFU m−3 (stage 6), respectively. The coarse fraction (>4.7 µm, the sum of stage 1 and stage 2) was the dominant size fraction for most sampling locations. In contrast, over the Japan Sea and the Bering Sea, the dominant sizes were 2.1–4.7 µm and 0.65–3.3 µm (62% and 76%, respectively). In the Arctic Sea, the BCP concentrations of each stage did not show big differences.
Figure 2b shows the percentages of each stage’s NSBCPs to the total NSBCPs at each site, and Figure 2c presents the percentages of each stage’s SBCPs to the total SBCPs at each site. The average concentrations of NSBCPs by size were 55 CFU m−3 (stage 1), 33 CFU m−3 (stage 2), 20 CFU m−3 (stage 3), 24 CFU m−3 (stage 4), 21 CFU m−3 (stage 5), and 30 CFU m−3 (stage 6), respectively. For most of the samples, NSBCPs in the coarse fraction (sum of stage 1 and stage 2) show comparable levels to the fine fraction (sum of stage 5 and stage 6). On average, the amount of coarse fraction and fine fraction accounted for 42% and 31% of the total NSBCPs during the whole cruise, respectively.
On average, the amount of SBCPs with respect to the particle size was 19 CFU m−3 (stage 1), 11 CFU m−3 (stage 2), 12 CFU m−3 (stage 3), 13 CFU m−3 (stage 4), 17 CFU m−3 (stage 5), and 21 CFU m−3 (stage 6) (Figure 2b). The coarse and fine fractions contributed to about 33% and 36% of the SBCP concentrations, respectively. There were occasionally higher proportions of SBCPs in the fine fraction in the Arctic region. For example, at sites 10, 11, 15, and 16, fine SBCPs were several times higher than coarse SBCPs.

3.3. Comparison with Literature Data

From previously reported values in different ecosystems, lower concentrations of bacteria were found in marine air than in continental air. A model simulation by Burrows et al. [28] predicted the presence of continental bacteria, exported from the continents, in air over the Northern Hemisphere Ocean. However, no observations of bacterial concentrations in high-latitude marine air were available to constrain the model.
To date, there are few reports of airborne bacterial abundance over the Arctic Ocean and Northwest Pacific Ocean in one cruise. This study thus provides the first direct observation over these regions. Overall, the concentrations of TBCPs in this study ranged from 29 to 955 CFU m−3. At one measurement site in the remote ocean (a drilling station near the Mid-Atlantic ridge), the concentration of cultivable bacteria was 16 CFU m−3 [35]. Higher concentrations were observed at coastal sites, e.g., up to about 8 × 10⁴ CFU m−3 [15]. This is likely due to the strong influence of continental sources. Prospero et al. [19] found that NSBCP concentrations were 2–3 orders of magnitude lower in selectively sampled marine air than those sampled at an island only a short distance inland. Montero et al. [11] reported that the offshore and onshore total culturable microbial counts were 778 CFU m−3 and 580 CFU m−3, respectively. Because different sources can cause microbial composition to be different and marine bacteria grow selectively on saline growth media, these previous reports may not meaningfully account for bacteria from ocean waters.

3.4. Potential Meteorological Factors Influencing the Variation of Concentrations of Airborne Bacteria

3.4.1. Temperature

Some previous studies have observed a correlation between ambient air temperature and the concentrations of continental cultivable airborne bacteria [36]. Likewise, in observations over the Northwestern Pacific Ocean, airborne microorganism concentrations were also found to be correlated with air temperature [37]. Temperature directly affects the rate of bacterial metabolism and reproduction, as well as cultivability [2]. Temperature is also correlated with a number of other important meteorological and climatological variables that may affect bacterial concentrations in air, such as boundary layer turbulence, time of day, and season. In this study, the sampling cruise covered the regions from Shanghai through the mid-latitudes to the Arctic Ocean, and the temperature ranged from 22.7 °C to −4.7 °C. The average temperature of Group I, Group II, and Group III was 13.95 °C, 4.48 °C, and −1.09 °C, respectively. As latitude increases, the temperature decreases (R = −0.95, p < 0.01). The abundance of TBCPs was significantly correlated with ambient air temperature at the time of sampling (R = 0.516, p < 0.05). The correlation was even stronger for the subset of six samples collected over the Group II area (Chukchi Sea and Bering Sea, R = 0.878, p < 0.05). Over this region, the temperature ranged from 0 to 5.5 °C during the sampling period. The same correlation with temperature was also found for NSBCPs during the whole cruise (R = 0.564, p < 0.01) and over the Group II area (R = 0.980, p < 0.01). There was no correlation found between SBCP concentrations and temperature.

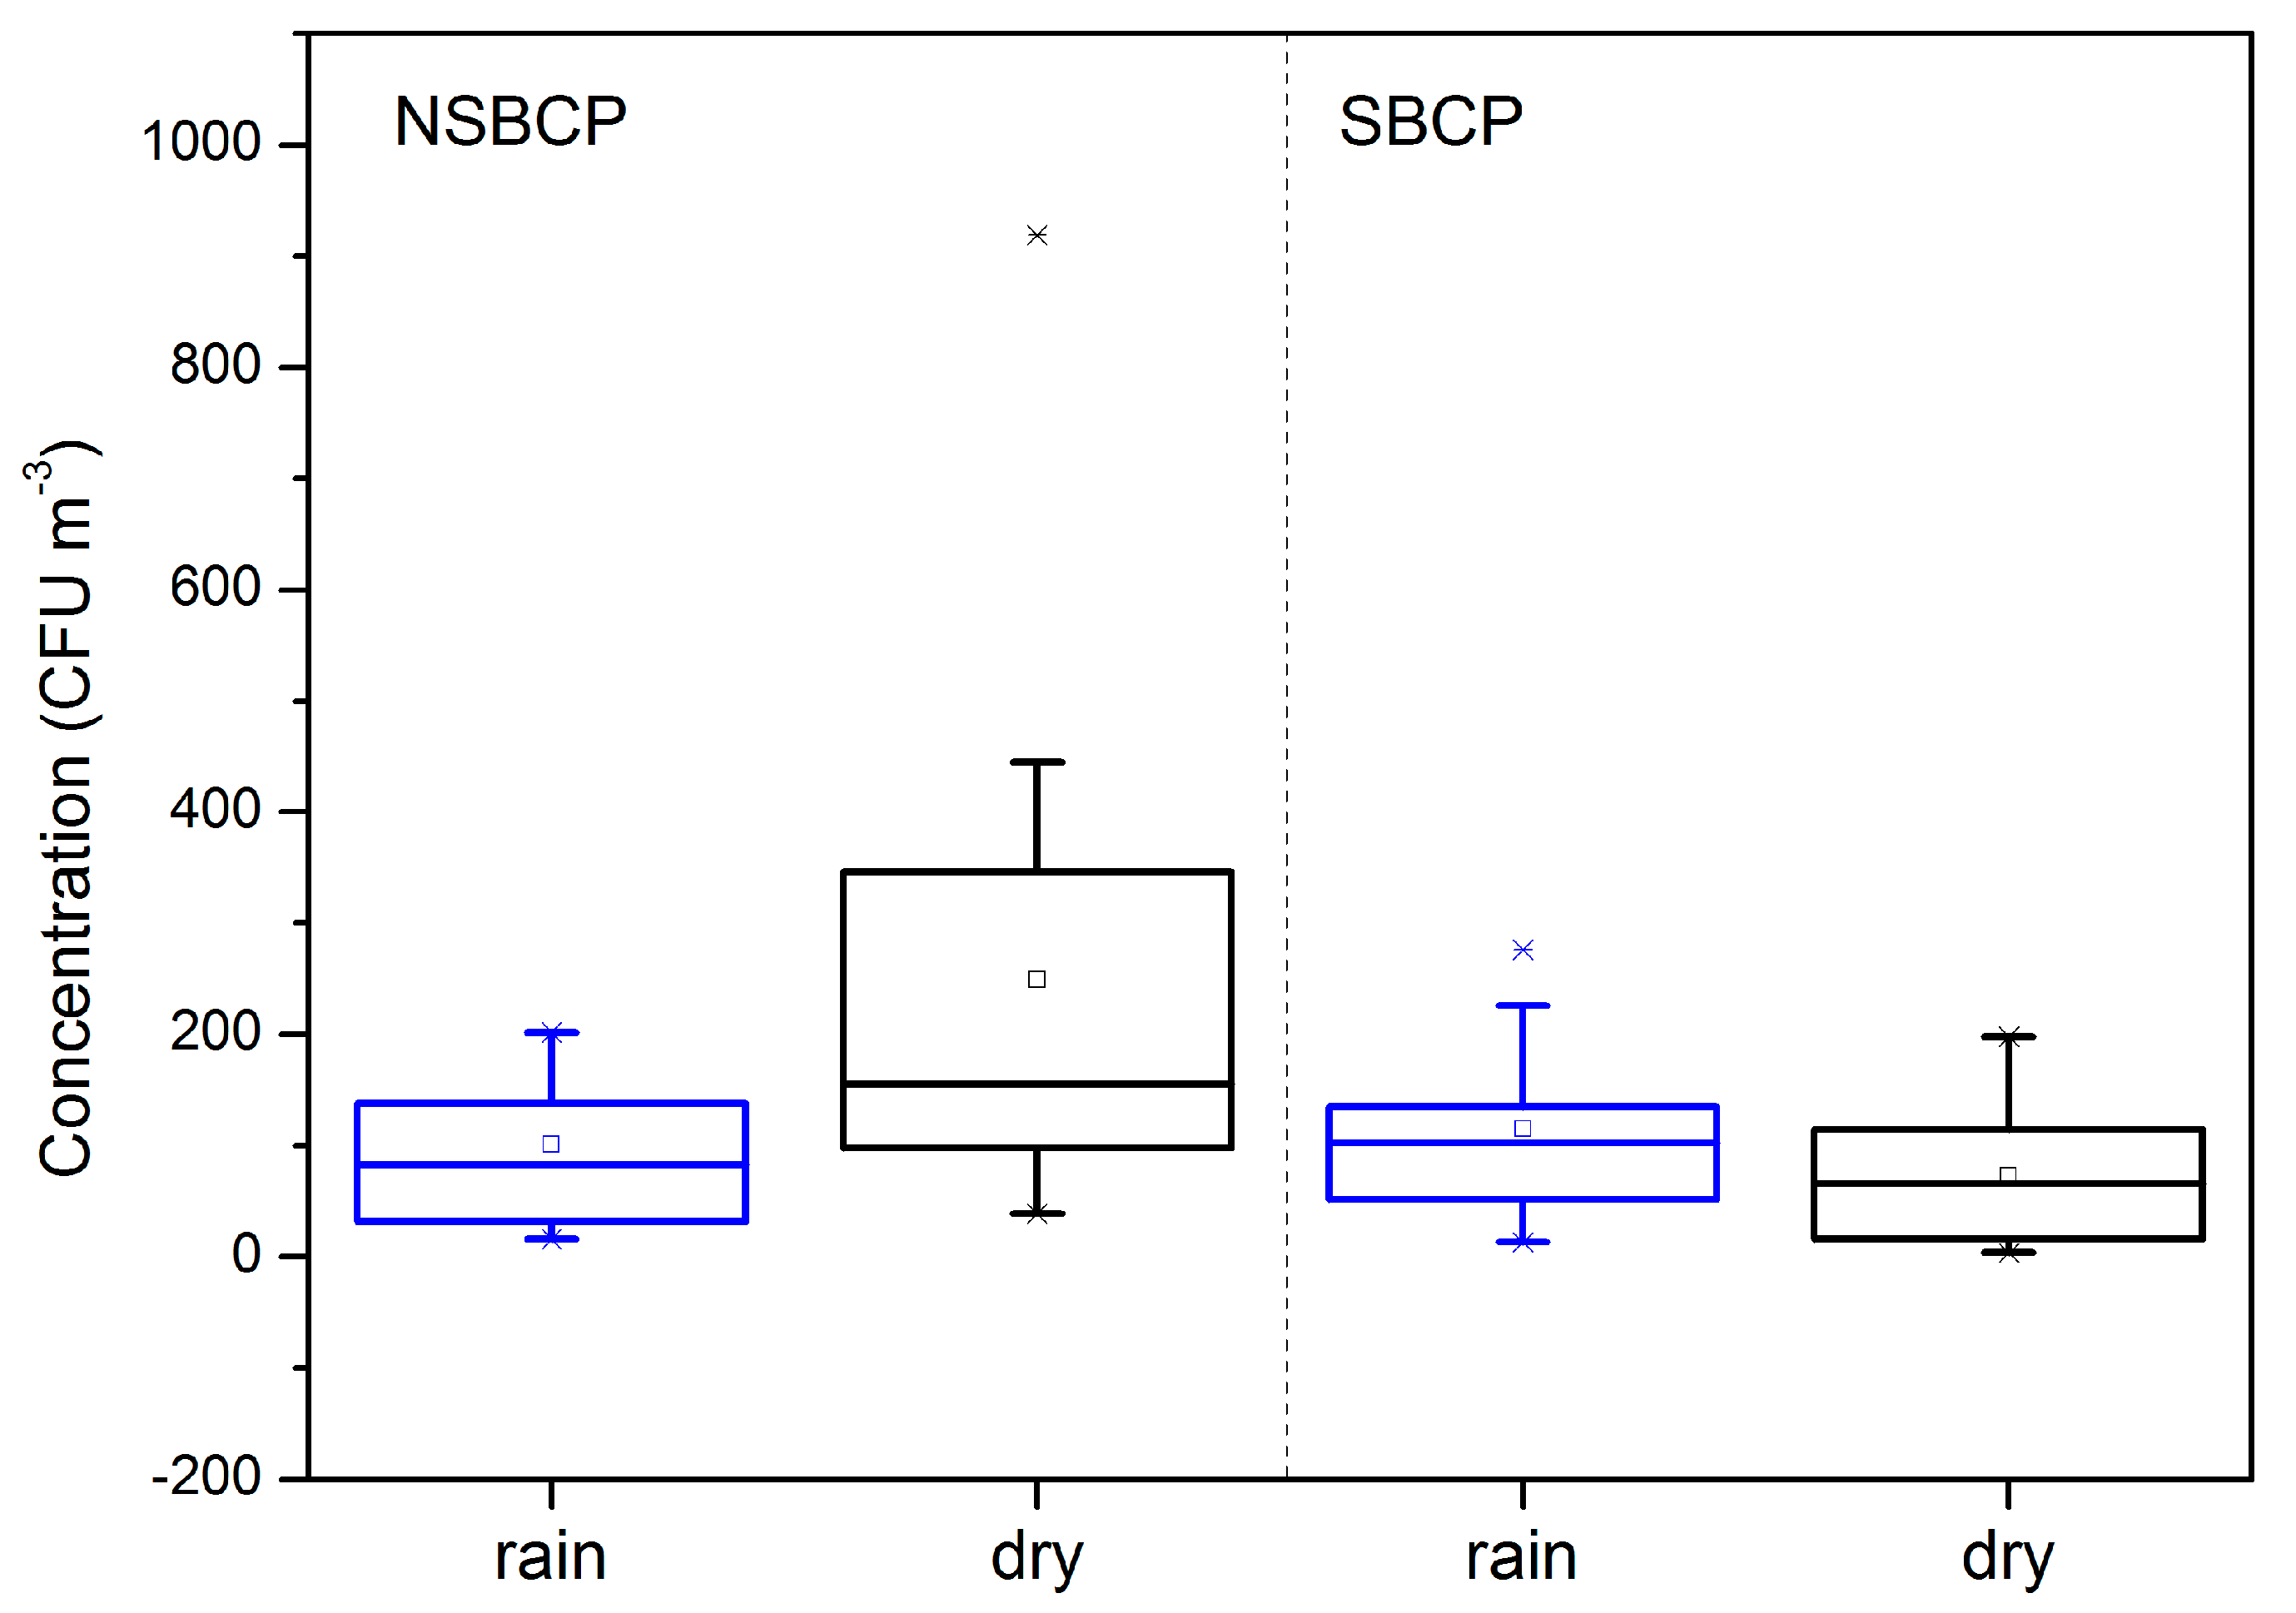
3.4.2. Relative Humidity and Precipitation

Although some studies have shown positive correlations between relative humidity (RH) and ambient bacterial concentrations [38], this study found negative correlations between TBCPs and RH as well as NSBCPs with RH over the Group II area (Table 2). No correlation was found between SBCP concentrations and RH.
Bauer et al. [7] and Morris et al. [39] reported that the presence of clouds and precipitation, e.g., clear skies, rain, snow or fog, may affect the deposition of airborne bacteria. During the sampling period, weather was rainy at nine sampling sites including sampling sites 2, 3, 6, 7, 10, 12, 14, 15, and 16. As shown in Figure 3, the average concentration of NSBCPs during rainy days (101 ± 70 CFU m−3) was lower than that during the dry days (249 ± 254 CFU m−3). In contrast, the average concentration of SBCPs during rainy days (115 ± 88 CFU m−3) was slightly higher than that during the dry days (73 ± 58 CFU m−3), albeit the difference is not statistically different. It might be that some airborne bacteria deposit as cloud condensation nucleus by rain in rainy days, and the precipitation caused the splashing of more sea water, bringing the bacteria into the atmosphere. As such, the concentration of NSBCPs looks higher in rainy days more than in dry days but there is no difference for SBCPs.

3.4.3. Wind Speed

Many previous studies have found relationships between the concentrations of airborne cultivable or microscopically observed bacteria and wind speed [40,41,42,43]. While particle sources from the surface are typically stronger under windier conditions, stronger winds are also associated with greater boundary-layer turbulence and dilution, leading to a reduction in boundary-layer concentrations. For these reasons, we measured wind speed (Table 1) concurrently with particle sampling, however, no relationship between wind speed and bacteria concentrations was found in the data collected in this study (as shown Table 2).

3.5. The Role of Sea Ice in the Arctic Ocean

Bacteria have been found to live and metabolize in sea ice and snow [44]. At the South Pole, Carpenter et al. [45] found a population of about 200 to 5000 cells per mL of melted surface snow. Elevated concentrations of SBCPs were observed in the Arctic Ocean in the presence of seasonal ice. During the sampling time, ice concentrations ranged from 0 to 20% and 0 to 91% over Group II and Group III, respectively. In the Bering Sea and the Chukchi Sea where average sea ice concentration was 3.3% during the cruise (almost open water during the cruise), the average concentrations of TBCPs, SBCPs, and NSBCPs were 176, 44, and 133 CFU m−3, respectively. In the area of 75° N to 85° N, the so-called “floating sea ice region” covered by seasonal ice [46] with an average ice concentration of 57.4% during the cruise, the average TBCP, SBCP, and NSBCP concentrations of the Arctic Ocean were 253, 120, and 133 CFU m−3, respectively. The result showed that the concentrations of TBCPs and SBCPs over the floating sea ice region were higher than those found over the open sea areas. Moreover, there is a positive correlation between ice concentration and SBCPs (R = 0.612, p < 0.05),indicating a potential relationship between the presence of seasonal sea ice and the source of SBCPs [47]. In contrast, the NSBCPs showed no difference between these two areas.
It is known that precipitation in the form of snow results in the accumulation of airborne bacteria in the seasonal snowpack and sea ice (50 to over 40,000 cells mL−1) [48,49]. Resuspension of snow containing accumulated bacteria may thus be one potential source. According to the data of the National Snow and Ice Data Center (NSIDC), the monthly ice extent in August 2008 was the second-lowest recorded during the period from 1979 to 2008.
Another possible explanation is that bacteria could collect on the ice in “frost flowers”, and then be aerosolized [50]. Also, there area lot of biological activities around the sea ice, which contains nutrients. During summer, ice melt lead increases can cause increases in biological activities [12]. Leck and Bigg [51] suggested that spray production from leads may be an important source of bacteria to the Arctic atmosphere. In summer, marine gel also plays an important role in the cloud condensation nuclei in the high Arctic (north of 80° N) [13]. Therefore, in the high Arctic region, marine source bacteria probably are a big contribution to atmospheric aerosols.

4. Conclusions

The abundance and size distributions of airborne bacteria in the marine boundary layer were investigated during the third China Arctic Research Expedition (July–September, 2008). To our knowledge, this is the first quantitative study of airborne bacterial concentrations in the Arctic. The concentrations of NSBCPs and SBCPs varied considerably over the whole sampling period (NSBCPs 16–919 CFU m−3; SBCPs 4–276 CFU m−3). These concentrations are much higher than those reported earlier using non-saline agar at a mid-Atlantic marine site and in marine background air at Barbados. NSBCPs were also observed in the high Arctic Ocean. The NSBCPs and SBCPs presented in both the coarse and fine aerosols. Concentrations of TBCPs and NSBCPs correlated with air temperature. Changes in sea ice in the Arctic Ocean were also found to influence the distribution of bacteria. Higher concentrations of SBCPs were observed in the presence of seasonal Arctic sea ice, suggesting a possible sea-ice related source, probably from biological activities in the leads, re-blowing of snow, or frost flower formation on the seasonal ice pack.
Since culture methods may underestimate the environmental bacterial communities, it is expected that the abundance in the ambient air would be even higher than those observed in this study. Future investigations should apply molecular biological techniques (e.g., 16S rDNA analysis) to distinguish species between different bacteria.

Acknowledgments

This research was supported by grants from the National Natural Science Foundation of China (Project No. 41676173), the Chinese Arctic and Antarctic Administration (Projects No. CHINARE2012-2017 and IC201202), and the External Cooperation Program of BIC, CAS (Project No.211134KYSB20130012). We thank Hang Su and Susannah Burrows for their valuable contributions to study related discussions.

Author Contributions

Z.Q.X. conceived and designed the experiments; L.M. and H.K. performed the experiments; L.M., X.W.Y., Z.Q.X. and P. Z. analyzed the data; L.M., X.W.Y. and Z.Q.X. wrote the paper. All of the authors contributed to the discussion and revise the manuscript.

Conflicts of Interest

The authors declare no conflict of interest.

References

  1. Després, V.R.; Huffman, J.A.; Burrows, S.M.; Hoose, C.; Safatov, A.S.; Buryak, G.; Fröhlich-Nowoisky, J.; Elbert, W.; Andreae, M.O.; Pöschl, U.; et al. Primary biological aerosol particles in the atmosphere: A review. Tullus B 2012, 64, 15598. [Google Scholar] [CrossRef]
  2. Burrows, S.M.; Butler, T.; Jöckel, P.; Tost, H.; Kerkweg, A.; Pöschl, U.; Lawrence, M.G. Bacteria in the global atmosphere—Part 2: Modeling of emissions and transport between different ecosystems. Atmos. Chem. Phys. 2009, 9, 9281–9297. [Google Scholar] [CrossRef]
  3. Blanchard, D.C. The ejection of drops from the sea and their enrichment with bacteria and other materials: A review. Estuaries 1989, 12, 127–137. [Google Scholar] [CrossRef]
  4. Christner, B.C.; Morris, C.E.; Foreman, C.M.; Cai, R.; Sands, D.C. Ubiquity of biological ice nucleators in snowfall. Science 2008, 319, 1214. [Google Scholar] [CrossRef] [PubMed]
  5. Pöschl, U.; Martin, S.; Sinha, B.; Chen, Q.; Gunthe, S.; Huffman, J.; Borrmann, S.; Farmer, D.; Garland, R.; Helas, G. Rainforest aerosols as biogenic nuclei of clouds and precipitation in the amazon. Science 2010, 329, 1513–1516. [Google Scholar] [CrossRef] [PubMed]
  6. Lighthart, B. The ecology of bacteria in the alfresco atmosphere. FEMS Microbiol. Ecol. 1997, 23, 263–274. [Google Scholar] [CrossRef]
  7. Bauer, H.; Kasper-Giebl, A.; Löflund, M.; Giebl, H.; Hitzenberger, R.; Zibuschka, F.; Puxbaum, H. The contribution of bacteria and fungal spores to the organic carbon content of cloud water, precipitation and aerosols. Atmos. Res. 2002, 64, 109–119. [Google Scholar] [CrossRef]
  8. Amato, P.; Ménager, M.; Sancelme, M.; Laj, P.; Mailhot, G.; Delort, A.-M. Microbial population in cloud water at the puy de dôme: Implications for the chemistry of clouds. Atmos. Environ. 2005, 39, 4143–4153. [Google Scholar] [CrossRef]
  9. Dueker, M.E.; Weathers, K.C.; O’Mullan, G.D.; Juhl, A.R.; Uriarte, M. Environmental controls on coastal coarse aerosols: Implications for microbial content and deposition in the near-shore environment. Environ. Sci. Technol. 2011, 45, 3386–3392. [Google Scholar] [CrossRef] [PubMed]
  10. Li, M.; Qi, J.; Zhang, H.; Huang, S.; Li, L.; Gao, D. Concentration and size distribution of bioaerosols in an outdoor environment in the qingdao coastal region. Sci. Total Environ. 2011, 409, 3812–3819. [Google Scholar] [CrossRef] [PubMed]
  11. Montero, A.; Dueker, M.E.; O’Mullan, G.D. Culturable bioaerosols along an urban waterfront are primarily associated with coarse particles. PeerJ 2016, 4, e2827. [Google Scholar] [CrossRef] [PubMed]
  12. Matrai, P.A.; Tranvik, L.; Leck, C.; Knulst, J.C. Are high arctic surface microlayers a potential source of aerosol organic precursors? Mar. Chem. 2008, 108, 109–122. [Google Scholar] [CrossRef]
  13. Orellana, M.V.; Matrai, P.A.; Leck, C.; Rauschenberg, C.D.; Lee, A.M.; Coz, E. Marine microgels as a source of cloud condensation nuclei in the high arctic. PNAS 2011, 108, 13612–13617. [Google Scholar] [CrossRef] [PubMed]
  14. Zuraimi, M.S.; Fang, L.; Tan, T.K.; Chew, F.T.; Tham, K.W. Airborne fungi in low and high allergic prevalence child care centers. Atmos. Environ. 2009, 43, 2391–2400. [Google Scholar] [CrossRef]
  15. Harrison, R.M.; Jones, A.M.; Biggins, P.D.E.; Pomeroy, N.; Cox, C.S.; Kidd, S.P.; Hobman, J.L.; Brown, N.L.; Beswick, A. Climate factors influencing bacterial count in background air samples. Int. J. Biometeorol. 2005, 49, 167–178. [Google Scholar] [CrossRef] [PubMed]
  16. Shaffer, B.T.; Lighthart, B. Survey of culturable airborne bacteria at four diverse locations in oregon: Urban, rural, forest, and coastal. Microb. Ecol. 1997, 34, 167–177. [Google Scholar] [CrossRef] [PubMed]
  17. Vladavets, V.; Mats, L. The influence of meteorological factors on the microflora. Microbiologya 1958, 59, 539–544. [Google Scholar]
  18. Kelly, C.D.; Pady, S.M. Microbiological studies of air masses over montreal during 1950 and 1951. Can. J. Bot. 1954, 32, 591–600. [Google Scholar] [CrossRef]
  19. Prospero, J.M.; Blades, E.; Mathison, G.; Naidu, R. Interhemispheric transport of viable fungi and bacteria from africa to the caribbean with soil dust. Aerobiologia 2005, 21, 1–19. [Google Scholar] [CrossRef]
  20. Marks, R.; Kruczalak, K.; Jankowska, K.; Michalska, M. Bacteria and fungi in air over the gulf of gdańsk and baltic sea. J. Aerosol Sci. 2001, 32, 237–250. [Google Scholar] [CrossRef]
  21. Baylor, E.; Baylor, M.; Blanchard, D.; Syzdek, L.; Appel, C. Virus transfer from surf to wind. Science 1977, 198, 575–580. [Google Scholar] [CrossRef] [PubMed]
  22. Aller, J.Y.; Kuznetsova, M.R.; Jahns, C.J.; Kemp, P.F. The sea surface microlayer as a source of viral and bacterial enrichment in marine aerosols. J. Aerosol Sci. 2005, 36, 801–812. [Google Scholar] [CrossRef]
  23. Cho, B.C.; Hwang, C.Y. Prokaryotic abundance and 16s rrna gene sequences detected in marine aerosols on the east sea (Korea). FEMS Microbiol. Ecol. 2011, 76, 327–341. [Google Scholar] [CrossRef] [PubMed]
  24. Dueker, M.E.; O‘Mullan, G.D.; Weathers, K.C.; Juhl, A.R.; Uriarte, M. Coupling of fog and marine microbial content in the near-shore coastal environment. Biogeosciences 2012, 9, 803–813. [Google Scholar] [CrossRef]
  25. Urbano, R.; Palenik, B.; Gaston, C.; Prather, K. Detection and phylogenetic analysis of coastal bioaerosols using culture dependent and independent techniques. Biogeosciences 2011, 8, 301. [Google Scholar] [CrossRef]
  26. Griffin, D.W. Atmospheric movement of microorganisms in clouds of desert dust and implications for human health. Clin. Microbiol. Rev. 2007, 20, 459–477. [Google Scholar] [CrossRef] [PubMed]
  27. Hallar, A.; Chirokova, G.; McCubbin, I.; Painter, T.H.; Wiedinmyer, C.; Dodson, C. Atmospheric bioaerosols transported via dust storms in the western united states. Geophys. Res. Lett. 2011. [Google Scholar] [CrossRef]
  28. Burrows, S.M.; Elbert, W.; Lawrence, M.G.; Pöschl, U. Bacteria in the global atmosphere—Part 1: Review and synthesis of literature data for different ecosystems. Atmos. Chem. Phys. 2009, 9, 9263–9280. [Google Scholar] [CrossRef]
  29. Clark, S.; Rylander, R.; Larsson, L. Airborne bacteria, endotoxin and fungi in dust in poultry and swine confinement buildings. Am. Ind. Hyg. Assoc. J. 1983, 44, 537–541. [Google Scholar] [CrossRef] [PubMed]
  30. Liu, Y.; Han, J.-X.; Huang, H.-Y.; Zhu, B. Development and evaluation of 16s rdna microarray for detecting bacterial pathogens in cerebrospinal fluid. Exp. Biol. Med. 2005, 230, 587–591. [Google Scholar] [CrossRef]
  31. Slabova, O.I.; Nikitin, D.I. Influence of the incubation temperature on the reaction of oligotrophic bacteria to stress. Microbiology 2004, 73, 650–653. [Google Scholar] [CrossRef]
  32. Li, E.; Wu, J.; Wang, P.; Zhang, D. D-Phenylalanine inhibits biofilm development of a marine microbe, Pseudoalteromonas sp. SC2014. FEMS Microbiol. Lett. 2016, 363, fnw198. [Google Scholar] [CrossRef] [PubMed]
  33. Boreson, J.; Dillner, A.M.; Peccia, J. Correlating bioaerosol load with PM2.5 and PM10cf concentrations: A comparison between natural desert and urban-fringe aerosols. Atmos. Environ. 2004, 38, 6029–6041. [Google Scholar] [CrossRef]
  34. Kuske, C.R.; Barns, S.M.; Grow, C.C.; Merrill, L.; Dunbar, J. Environmental survey for four pathogenic bacteria and closely related species using phylogenetic and functional genes. J. Forensic Sci. 2006, 51, 548–558. [Google Scholar] [CrossRef] [PubMed]
  35. Griffin, D.W.; Westphal, D.L.; Gray, M.A. Airborne microorganisms in the african desert dust corridor over the mid-atlantic ridge, Ocean Drilling Program, Leg 209. Aerobiologia 2006, 22, 211–226. [Google Scholar] [CrossRef]
  36. Sobek, A.; Olli, K.; Gustafsson, Ö. On the relative significance of bacteria for the distribution of polychlorinated biphenyls in arctic ocean surface waters. Environ. Sci. Technol. 2006, 40, 2586–2593. [Google Scholar] [CrossRef] [PubMed]
  37. Deguillaume, L.; Leriche, M.; Amato, P.; Ariya, P.A.; Delort, A.M.; Pöschl, U.; Chaumerliac, N.; Bauer, H.; Flossmann, A.I.; Morris, C.E. Microbiology and atmospheric processes: Chemical interactions of primary biological aerosols. Biogeosciences 2008, 5, 1073–1084. [Google Scholar] [CrossRef]
  38. Lighthart, B.; Shaffer, B.T. Bacterial flux from chaparral into the atmosphere in mid-summer at a high desert location. Atmos. Environ. 1994, 28, 1267–1274. [Google Scholar] [CrossRef]
  39. Morris, C.; Georgakopoulos, D.; Sands, D. Ice nucleation active bacteria and their potential role in precipitation. J. Phys. 2004, 121, 87–103. [Google Scholar] [CrossRef]
  40. Jones, A.M.; Harrison, R.M. The effects of meteorological factors on atmospheric bioaerosol concentrations—A review. Sci. Total Environ. 2004, 326, 151–180. [Google Scholar] [CrossRef] [PubMed]
  41. Lindemann, J.; Upper, C.D. Aerial dispersal of epiphytic bacteria over bean plants. Appl. Environ. Microbiol. 1985, 50, 1229–1232. [Google Scholar] [PubMed]
  42. Mouli, P.; Mohan, S.; Reddy, S. Assessment of microbial(bacteria) concentrations of ambient air at semi-arid urban region: Influence of meteorological factors. Appl. Ecol. Environ. Res. 2005, 3, 139–149. [Google Scholar] [CrossRef]
  43. Tong, Y.; Lighthart, B. Diurnal distribution of total and culturable atmospheric bacteria at a rural site. Aerosol Sci. Technol. 1999, 30, 246–254. [Google Scholar] [CrossRef]
  44. Arrigo, K.R.; Thomas, D.N. Large scale importance of sea ice biology in the southern ocean. Antarct. Sci. 2004, 16, 471–486. [Google Scholar] [CrossRef]
  45. Carpenter, E.J.; Lin, S.; Capone, D.G. Bacterial activity in south pole snow. Appl. Environ. Microbiol. 2000, 66, 4514–4517. [Google Scholar] [CrossRef] [PubMed]
  46. Lu, P.; Li, Z.; Cheng, B.; Lei, R.; Zhang, R. Sea ice surface features in arctic summer 2008: Aerial observations. Remote Sens. Environ. 2010, 114, 693–699. [Google Scholar] [CrossRef]
  47. Harding, T.; Jungblut, A.D.; Lovejoy, C.; Vincent, W.F. Microbes in high arctic snow and implications for the cold biosphere. Appl. Environ. Microbiol. 2011, 77, 3234–3243. [Google Scholar] [CrossRef] [PubMed]
  48. Ariya, P.A.; Domine, F.; Kos, G.; Amyot, M.; Côté, V.; Vali, H.; Lauzier, T.; Kuhs, W.F.; Techmer, K.; Heinrichs, T.; et al. Snow–A photobiochemical exchange platform for volatile and semi-volatile organic compounds with the atmosphere. Environ. Chem. 2011, 8, 62–73. [Google Scholar] [CrossRef]
  49. Møller, A.K.; Barkay, T.; Al-Soud, W.A.; Sorensen, S.J.; Skov, H.; Kroer, N. Diversity and characterization of mercury-resistant bacteria in snow, freshwater and sea-ice brine from the high arctic. FEMS Microbiol. Ecol. 2011, 75, 390–401. [Google Scholar] [CrossRef] [PubMed]
  50. Bowman, J.; Deming, J. Elevated bacterial abundance and exopolymers in saline frost flowers and implications for atmospheric chemistry and microbial dispersal. Geophys. Res. Lett. 2010. [Google Scholar] [CrossRef]
  51. Leck, C.; Bigg, E.K. Biogenic particles in the surface microlayer and overlaying atmosphere in the central arctic ocean during summer. Tellus B 2005, 57, 305–316. [Google Scholar] [CrossRef]
Figure 1. Bacterial concentrations along the cruise path for the R/V Xuelong during the third China Arctic Research Expedition. The concentrations of airborne non-salt tolerant bacteria-containing particles (NSBCPs) and airborne salt tolerant bacteria-containing particles (SBCPs) are shown by red and blue columns, respectively (unit: CFU m−3). The blue shaded area represents sea ice.
Atmosphere 08 00082 g001
Figure 2. Distribution plot for (a) total airborne bacteria-containing particles (TBCPs); (b) non-salt tolerant airborne bacteria-containing particles (NSBCPs); and (c) salt tolerant bacteria-containing particles (SBCPs) fraction over each region.
Atmosphere 08 00082 g002aAtmosphere 08 00082 g002b
Figure 3. The concentration of NSBCPs and SBCPs during rainy days and dry days.
Atmosphere 08 00082 g003
Table 1. Sampling location, date, and meteorological conditions during the third China Arctic Research Expedition, 2008.
SiteDateUTC TimeSampling Duration (min)CoordinateLocationWind Speed (m/s)Wind Direction (°)RH (%)T (°C)
114 July1:4010133° E 38° NEast China Sea13368922.7
217 July23:3010139° E 45° NSea of Japan11.3669917.5
322 July22:3015161° E 51° NNorth Pacific Ocean41959911.2
425 July22:3015179° E 59° NNorth Pacific Ocean14282907
531 July1:0015169° W 62° NBering Sea15.1131865.5
62 August23:0015165° W 64° NBering Sea5.62371001.2
75 August21:3018168° W 72° NChukchi Sea7.8128990
88 August21:3018157° W 73° NChukchi Sea3.3245943.5
911 August21:3020152° W 75° NArctic Ocean10.17890.2
1014 August21:3020147° W 76° NBeaufort Sea18.42981000.8
1117 August21:3020147° W 81° NArctic Ocean9329920.2
1221 August22:0020144° W 84° NArctic Ocean1176990.6
1326 August22:0020147° W 85° NArctic Ocean14.42898−0.5
1427 August22:4020102° W 85° NArctic Ocean11.6125100−1.7
1531 August21:4020148° W 84° NArctic Ocean0.9203100−3.6
162 September21:4020170° W 80° NArctic Ocean247100−4.7
176 September21:5020169° W 73° NChukchi Sea15.5131971.7
189 September22:1020165° W 64° NBering Sea6.3476315
1912 September22:0020170° E 59° NNorth Pacific Ocean9.92169112.5
2015 September23:1020151° E 44° NSea of Okhotsk42229212.8
UTC: Coordinated Universal Time; RH: Relative humidity.
Table 2. Correlation of bacteria-containing particles (BCPs) with wind speed (WS), relative humidity (RH), and temperature (T).
SpeciesWhole CruiseGroup IGroup IIGroup III
WSRHTWSRHTWSRHTWSRHT
TBCPPearson Correlation296−291516 *−063−171−365101−858 *878 *028236−242
Sig. (2-tailed)205214020906746477848029022947574563
N202020666666888
NSBCPPearson Correlation312−414564 **112−322−212006−965 **976 **216−240−099
Sig. (2-tailed)180069010832534686991002001607568816
N202020666666888
SBCPPearson Correlation−019316−087−180−653−660302−083115−174559−234
Sig. (2-tailed)937175714732160153561875829680150577
N202020666666888
** Correlation is significant at the 0.01 level (2-tailed); * Correlation is significant at the 0.05 level (2-tailed).TBCP: total airborne bacteria-containing particles; NSBCP: non-salt tolerant airborne bacteria-containing particles; SBCP: salt tolerant airborne bacteria-containing particles.

