Article

Modeling CH4 Emissions from Natural Wetlands on the Tibetan Plateau over the Past 60 Years: Influence of Climate Change and Wetland Loss

1
LAPC, Institute of Atmospheric Physics, Chinese Academy of Sciences, Beijing 100029, China
2
School of Atmospheric Sciences, Chengdu University of Information Technology, Chengdu 610225, China
3
Sichuan Climate Centre, Chengdu 610071, China
*
Authors to whom correspondence should be addressed.
These authors contributed equally to this work.
Atmosphere 2016, 7(7), 90; https://doi.org/10.3390/atmos7070090
Submission received: 22 April 2016 / Revised: 2 July 2016 / Accepted: 6 July 2016 / Published: 8 July 2016

Abstract

:
The natural wetlands of the Tibetan Plateau (TP) are considered to be an important natural source of methane (CH4) to the atmosphere. The long-term variation in CH4 associated with climate change and wetland loss is still largely unknown. From 1950 to 2010, CH4 emissions over the TP were analyzed using a model framework that integrates CH4MODwetland, TOPMODEL, and TEM models. Our simulation revealed a total increase of 15% in CH4 fluxes, from 6.1 g m−2 year−1 to 7.0 g m−2 year−1. This change was primarily induced by increases in temperature and precipitation. Although climate change has accelerated CH4 fluxes, the total amount of regional CH4 emissions decreased by approximately 20% (0.06 Tg—i.e., from 0.28 Tg in the 1950s to 0.22 Tg in the 2000s), due to the loss of 1.41 million ha of wetland. Spatially, both CH4 fluxes and regional CH4 emissions showed a decreasing trend from the southeast to the northwest of the study area. Lower CH4 emissions occurred in the northwestern Plateau, while the highest emissions occurred in the eastern edge. Overall, our results highlighted the fact that wetland loss decreased the CH4 emissions by approximately 20%, even though climate change has accelerated the overall CH4 emission rates over the last six decades.

Graphical Abstract

1. Introduction

Wetlands play an important role in the global carbon cycle and global climate change. Although wetlands cover only 5%–8% of the land surface [1,2,3], they comprise a carbon pool of 202–535 Pg [4,5,6] and account for 20%–25% of the global soil carbon storage [6]. In addition, wetlands are the largest natural source of atmospheric CH4—they contribute 20%–25% of the total global CH4 emissions [7,8].
The atmospheric CH4 concentration reached 1803.2 ppb in 2011, which was 150% greater than pre-1750 concentrations [9]. The rate of CH4 increase has been sustained over the past three decades, albeit with a temporary slowing to a near constant rate from 1999 to 2006 [10]. Evidence suggests that the renewed increases in atmospheric CH4 observed during 2007 and 2008 arose primarily from increased natural wetland emissions as a result of anomalously high temperatures in the Arctic and greater than average precipitation in the tropics [11,12]. Compared with anthropogenic CH4 sources, natural wetland sources are more variable, ranging from 115 Tg CH4 year−1 [13] to 237 Tg CH4 year−1 [14] at a global scale.
China has 304,849 km2 of natural wetlands, accounting for 10% of the world–s wetlands by area [15], and contributes 1.2%–3.2% to global wetland CH4 emissions [16]. Over one third of Chinese wetlands are situated on the Tibetan Plateau (TP) [17]. Over the past 60 years, wetland loss has been reported on the TP. This wetland loss has been caused by global warming, leading to increased evaporation, subsequent increases in snow melting, and increased water outflow, as well as the draining and reclamation of the land as farmland [15]. Large uncertainties exist in the estimation of wetland CH4 emissions from the TP, ranging from 0.22 Tg year−1 [17] to 1.25 Tg year−1 [16]. Most of the above estimations were based on the extrapolation of site-specific measurements of CH4 fluxes to a regional scale [17,18,19,20]. CH4 emissions exhibit extreme spatial heterogeneity due to differences in climate, soil, topography, and vegetation throughout the TP. For example, the CH4 emissions observed in the southeastern Plateau [21] were approximately five times greater than in the northwestern Plateau [17]. Thus, the extrapolation approach may introduce uncertainties to regional estimations.
Compared with site-specific extrapolation methods, process-based models account for complexities in estimates of CH4 emissions and are integrated with other processes, although site-specific parameters should be calibrated in order to give the model estimates regional reliability [22]. In addition, process-based models can be used to estimate long-term historical CH4 emissions, which were strongly influenced by climate change. For example, higher temperatures can increase the activity of methanogens and promote CH4 production [23]. Similarly, increased precipitation may result in a higher water table and subsequent acceleration in CH4 flux [24,25]. Moreover, alpine wetlands on the Tibetan Plateau are permafrost wetlands, which are quite sensitive to global climate change [26,27,28]. However, less attention has been given to the evolution of regional CH4 emissions from the TP in relation to climate change.
Recognizing the significance of climate change impacts on regional CH4 budgets, this study focuses on quantifying the variation in CH4 emissions from the TP via a process-based model. The objectives of this study are to estimate the change in regional CH4 emissions from the wetlands on TP associated with climate change over the period from 1950 to 2010.

2. Methods and Materials

2.1. Model Framework

The model framework utilizes a biogeophysical, process-based model called CH4MODwetland, which was developed for modeling CH4 emissions from natural wetlands [29]. The model adopted the hypothesis of the CH4MOD model [30,31], developed to simulate CH4 emissions from rice paddies, with modifications based on the supply of methanogenic substrates in natural wetlands, which differ significantly from that of rice paddies. In CH4MODwetland, methane production rates are calculated by the availability of methanogenic substrates and the parameterized influences of environmental factors—e.g., soil temperature, soil texture, and soil redox potential. The methanogenic substrates are derived from the root exudation of wetland plants and the decomposition of plant litter and soil organic matter. CH4 transportation occurs via diffusion, ebullition, and plant transportation. Oxidation occurs when CH4 diffuses to the atmosphere or is transported through the plant aerenchyma. Model inputs include daily soil temperature, water table depth, the annual above-ground net primary productivity (ANPP), and soil texture. The outputs are daily and annual CH4 production and emissions. More details about CH4MODwetland are well-documented in previous studies [29,32].
In previous studies [29,32], we calibrated the model parameters based on the observation of CH4 emissions from wetlands on the Sanjiang Plain of northeast China. The main parameters that should be calibrated included vegetation index (VI), the fraction of CH4 oxidized during plant-mediated transport (Pox), and the fraction of plant mediated transport available (Tveg). In this study, we used the same calibration values for the main parameters as described in our previous studies. Table 1 shows the main input and parameter values at the study sites.
In order to obtain the ANPP on a regional scale, we used the outputs of the TEM model. TEM is a process-based ecosystem model that simulates the biogeochemical cycles of C and N between terrestrial ecosystems and the atmosphere [38,39]. This model has been widely used to investigate regional and global NPP (e.g., [40,41,42]). The TEM model also outputs soil temperature data, which is used as an input for CH4MODwetland.
Regional water table depth was obtained from the TOPMODEL. This is a popular method used to simulate regional water table depth in natural wetlands. This method is based on the topographic wetness index (TWI), with k i = ln ( α i / tan β i ) representing the spatially distributed water table depth for a 1 km sub-grid within a grid of 0.5°, where α i   is the contributing area upslope from point i, and tan β i is the local surface slope at that point. The central equation of TOPMODEL is:
z i = z m × ( k i λ )
where zi is the local water table depth in a 1 km pixel, z is the average water table depth in a 0.5° grid, m is the scaling parameter, ki is the local topographic wetness index (TWI) in the 1 km pixel, and λ is the average of ki over the 0.5° grid cell. The value of z is calculated by the soil moisture content in a 0.5° grid cell. More details about this method are given in previous studies [43,44,45,46,47].

2.2. Data Sources

The data sources included site-specific observations for model validation, the gridded input data sets for developing the model framework, and the wetland area. We first validated the CH4MODwetland at two wetland sites to test its ability to simulate CH4 emissions from the TP; one site was located on the Zoige Plateau (32°47′N, 102°32′E; 3470 m above sea level), and the other was located on the Haibei alpine wetland (37°29′N, 101°12′E, 3250 m above sea level) (Figure 1). Site-specific observations were obtained from the literature.
The Zoige Plateau has the largest peatland in China. The dominant plant species are Carex meyeriana (CME) and Carex muliensis (CMU). Methane emissions at this site were measured from May to September of 2001 using static chambers and gas chromatography techniques [48]. Synchronous measurements of the climate and water table depth were also taken during the experiment. More details about these measurements were described in previously published work [49].
At the site located in the Haibei alpine wetland, in the northeast part of the Qinghai-TP (Figure 1), the primary species of vegetation are Carex allivescers (CAL) and Hippuris vulgaris (HVU). Methane flux was measured by the same method of as on the Zoige Plateau every two weeks from early July to mid-September 2002. Synchronous measurements of the climate and water table depth, as well as the plant biomass, were also taken during the experiment. More details about these measurements can be found in previously published work [35].
The gridded input data sets for the model framework are related to climate, soil, vegetation, and hydrology. For the TEM model, climate datasets from 1950 to 2010 were developed using the latest monthly air temperature, precipitation, vapor pressure, and cloudiness datasets from the Climatic Research Unit (CRU TS 3.10) of the University of East Anglia in the United Kingdom [50]. The soil texture data, used to assign texture-specific parameters to each grid cell in the TEM model, were derived from the soil map of the Food and Agriculture Organization of the United Nations [51]. The IGBP vegetation map was referenced to specify the vegetation parameters for TEM. The map was derived from the IGBP Data and Information System (DIS) DISCover Database [52,53].
For the TOPMODEL, monthly soil moisture data from 1950 to 2010 were obtained from [54]. The topographic wetness index data were obtained from the HYDRO1k Elevation Derivative Database, which was developed by the U.S. Geological Survey Earth Resources, Observation and Science (EROS) Center [55].
For CH4MODwetland, the monthly soil temperature data and the ANPP were obtained from the TEM model. The monthly water table depth data were obtained from the TOPMODEL. We used linear interpolation to develop the daily soil temperature and daily water table depth from 1950 to 2010. The soil sand fraction data were obtained from the Food and Agriculture Organization of the United Nations [51]. The soil organic carbon content and the reference bulk density in wetland soils were from the Harmonized World Soil Database (HWSD) [56].
In this study, we used the definition of wetlands given by the US National Research Council (NRC) [57]. For the purposes of this work, a wetland was defined as “an ecosystem that depends on constant or recurrent, shallow inundation or saturation at or near the surface of the substrate. The minimum essential characteristics of a wetland are recurrent, sustained inundation or saturation at or near the surface and the presence of physical, chemical, and biological features reflective of recurrent, sustained inundation or saturation. Common diagnostic features of wetlands are hydric soils and hydrophytic vegetation. These features will be present except where specific physiochemical, biotic, or anthropogenic factors have removed them or prevented their development”. This definition is considered to be a relatively “narrow definition” of wetlands, as it does not include lakes and rivers. We used the remote sensing data of Niu, who developed gridded wetland maps for 1978, 1990, 2000, and 2008 with a resolution of 1 km × 1 km [15]. The initial gridded wetland map for 1950 was estimated based on remote sensing data from 1978 [15] and the census data [58]. The wetland maps for other years were developed using the linear interpolation between the existing wetland between consecutive years.

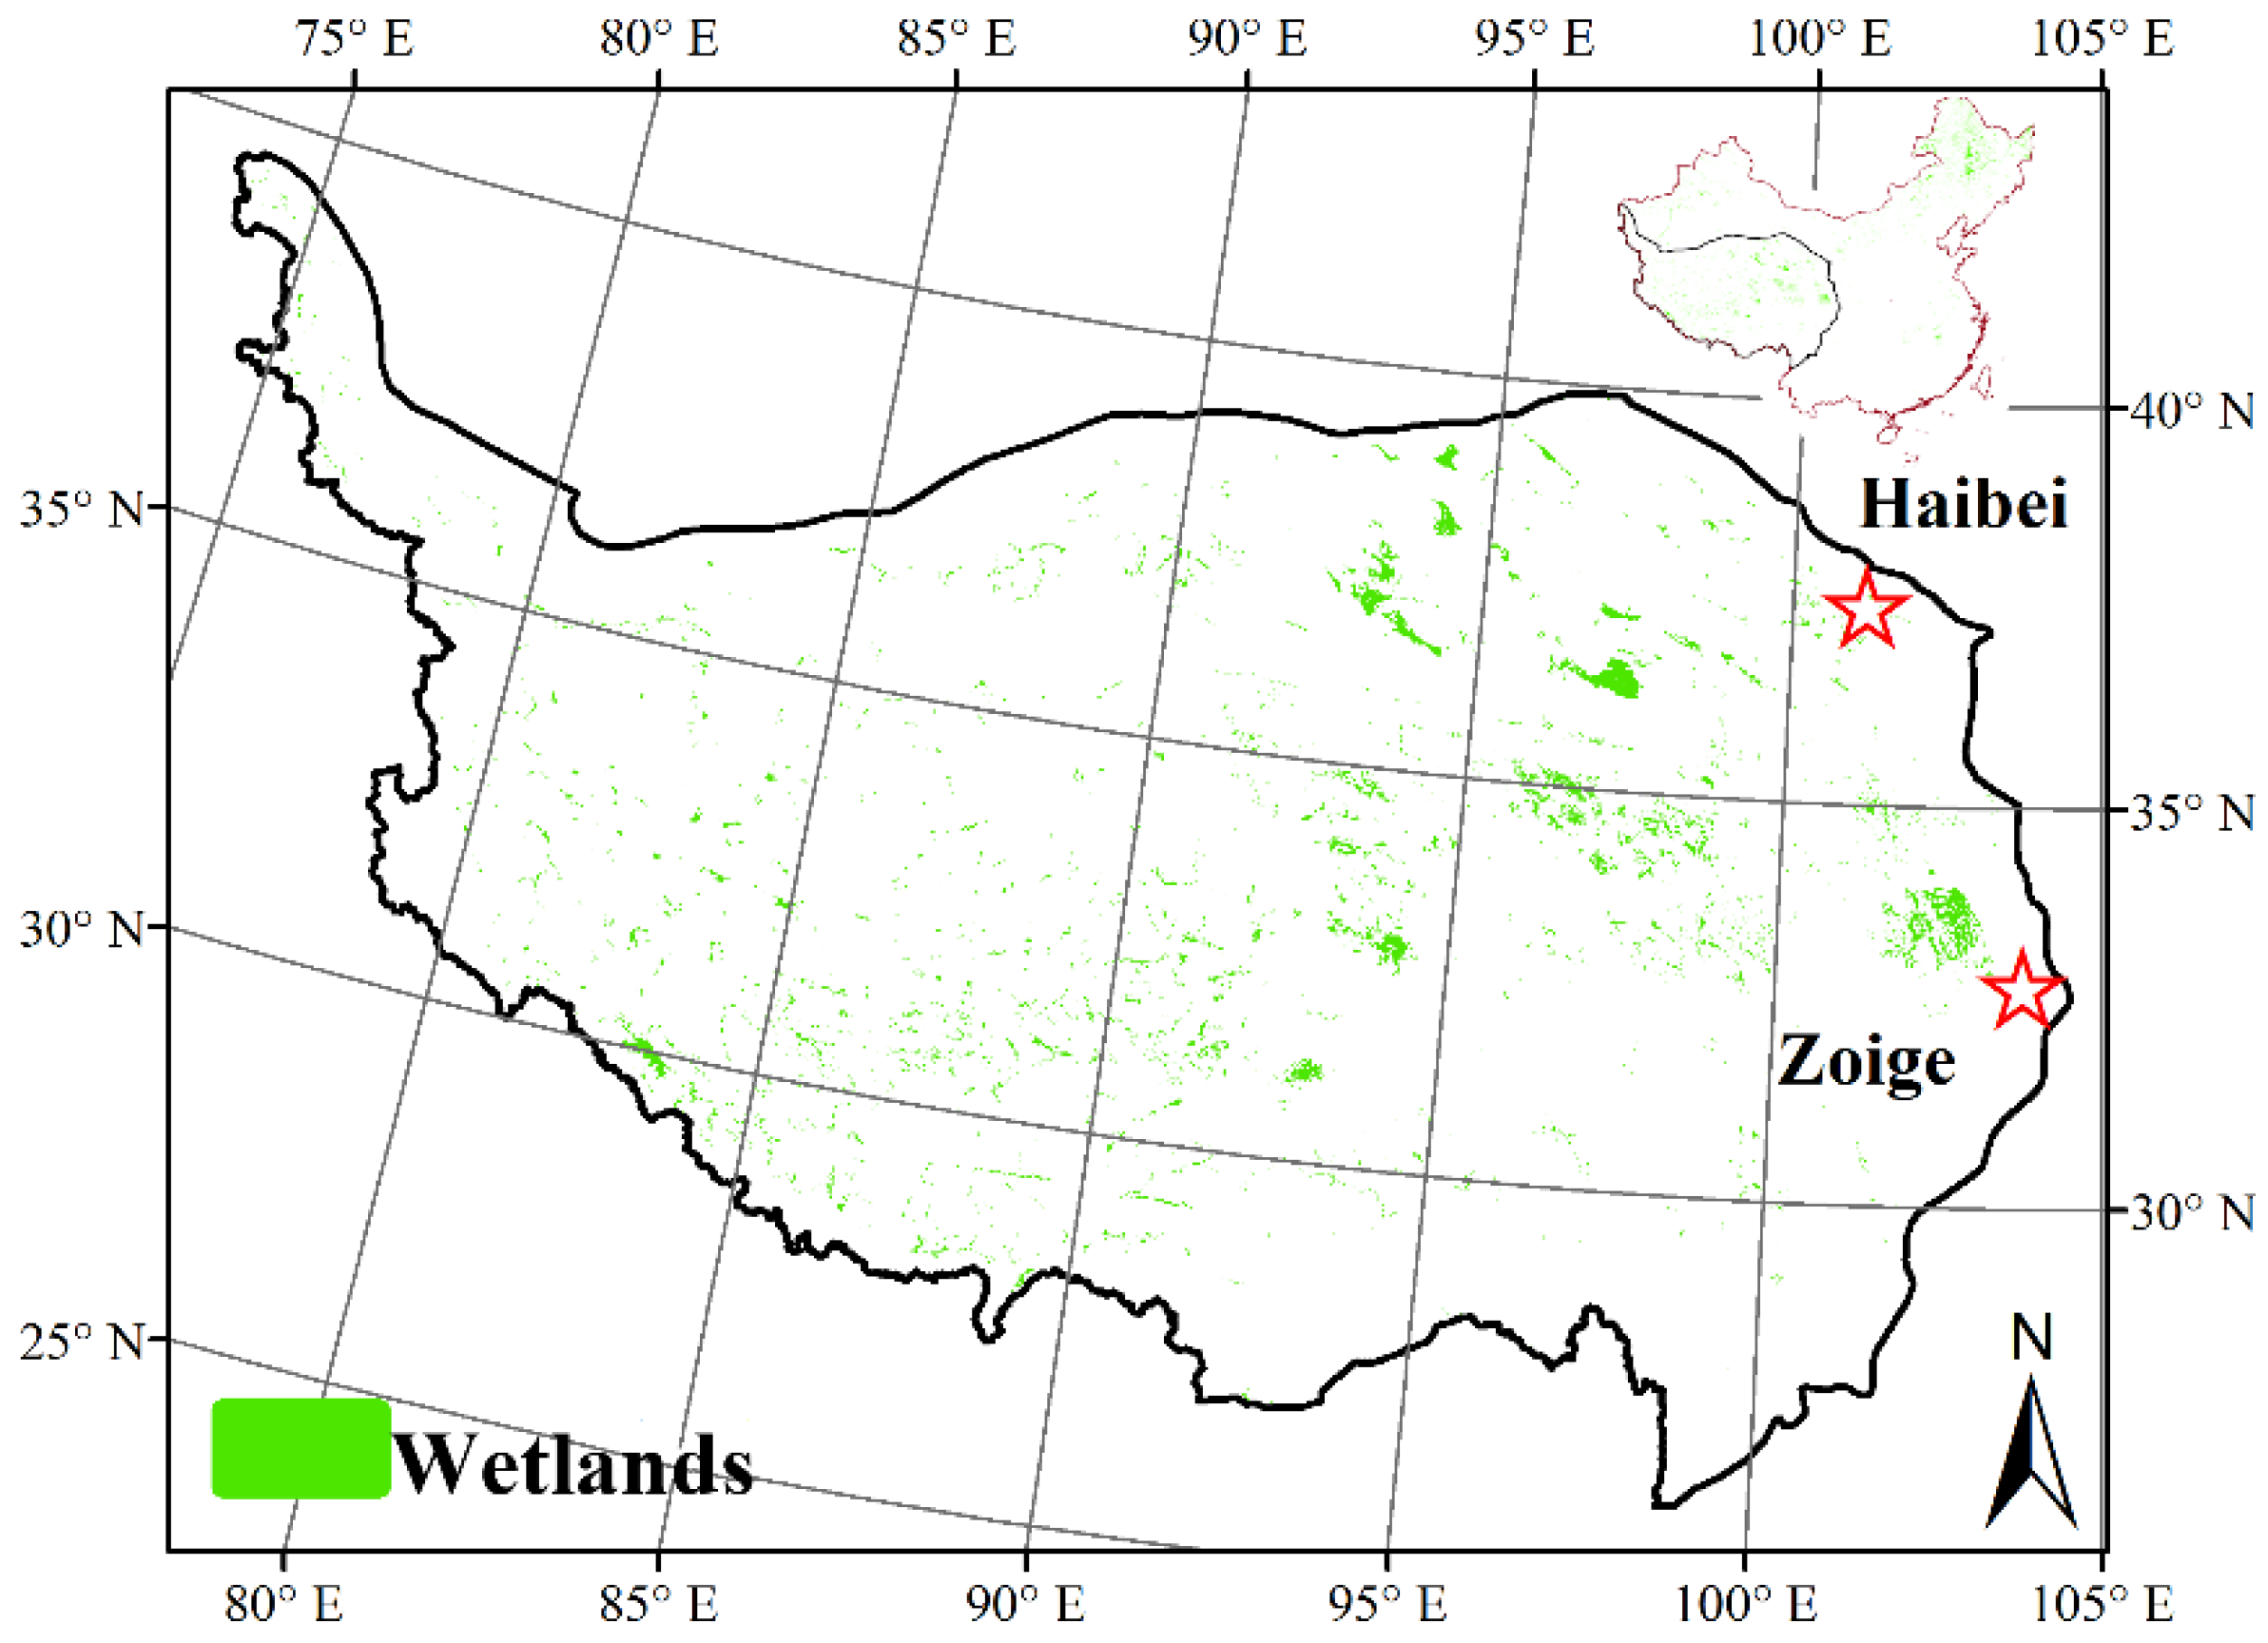
2.3. Model Extrapolation to the TP

We established gridded (1 km × 1 km) and geo-referenced time-series input data sets of climate and soil data to drive the model described above and make spatiotemporal estimates of CH4 fluxes from the wetlands on the TP. The gridded wetland maps, the topographic wetness index data and water table depths were created with a resolution of 1 km × 1 km. For the data set with coarse resolution (0.5° × 0.5°), we interpolated variables—e.g., climate, soil texture, and vegetation—over 1 km × 1 km using the nearest neighbor approach. We ran the model in each grid for the grid level CH4 fluxes. The total CH4 emissions from the inland and coastal wetlands in each grid cell were calculated as the product of the CH4 fluxes and the gridded wetland area.

3. Results

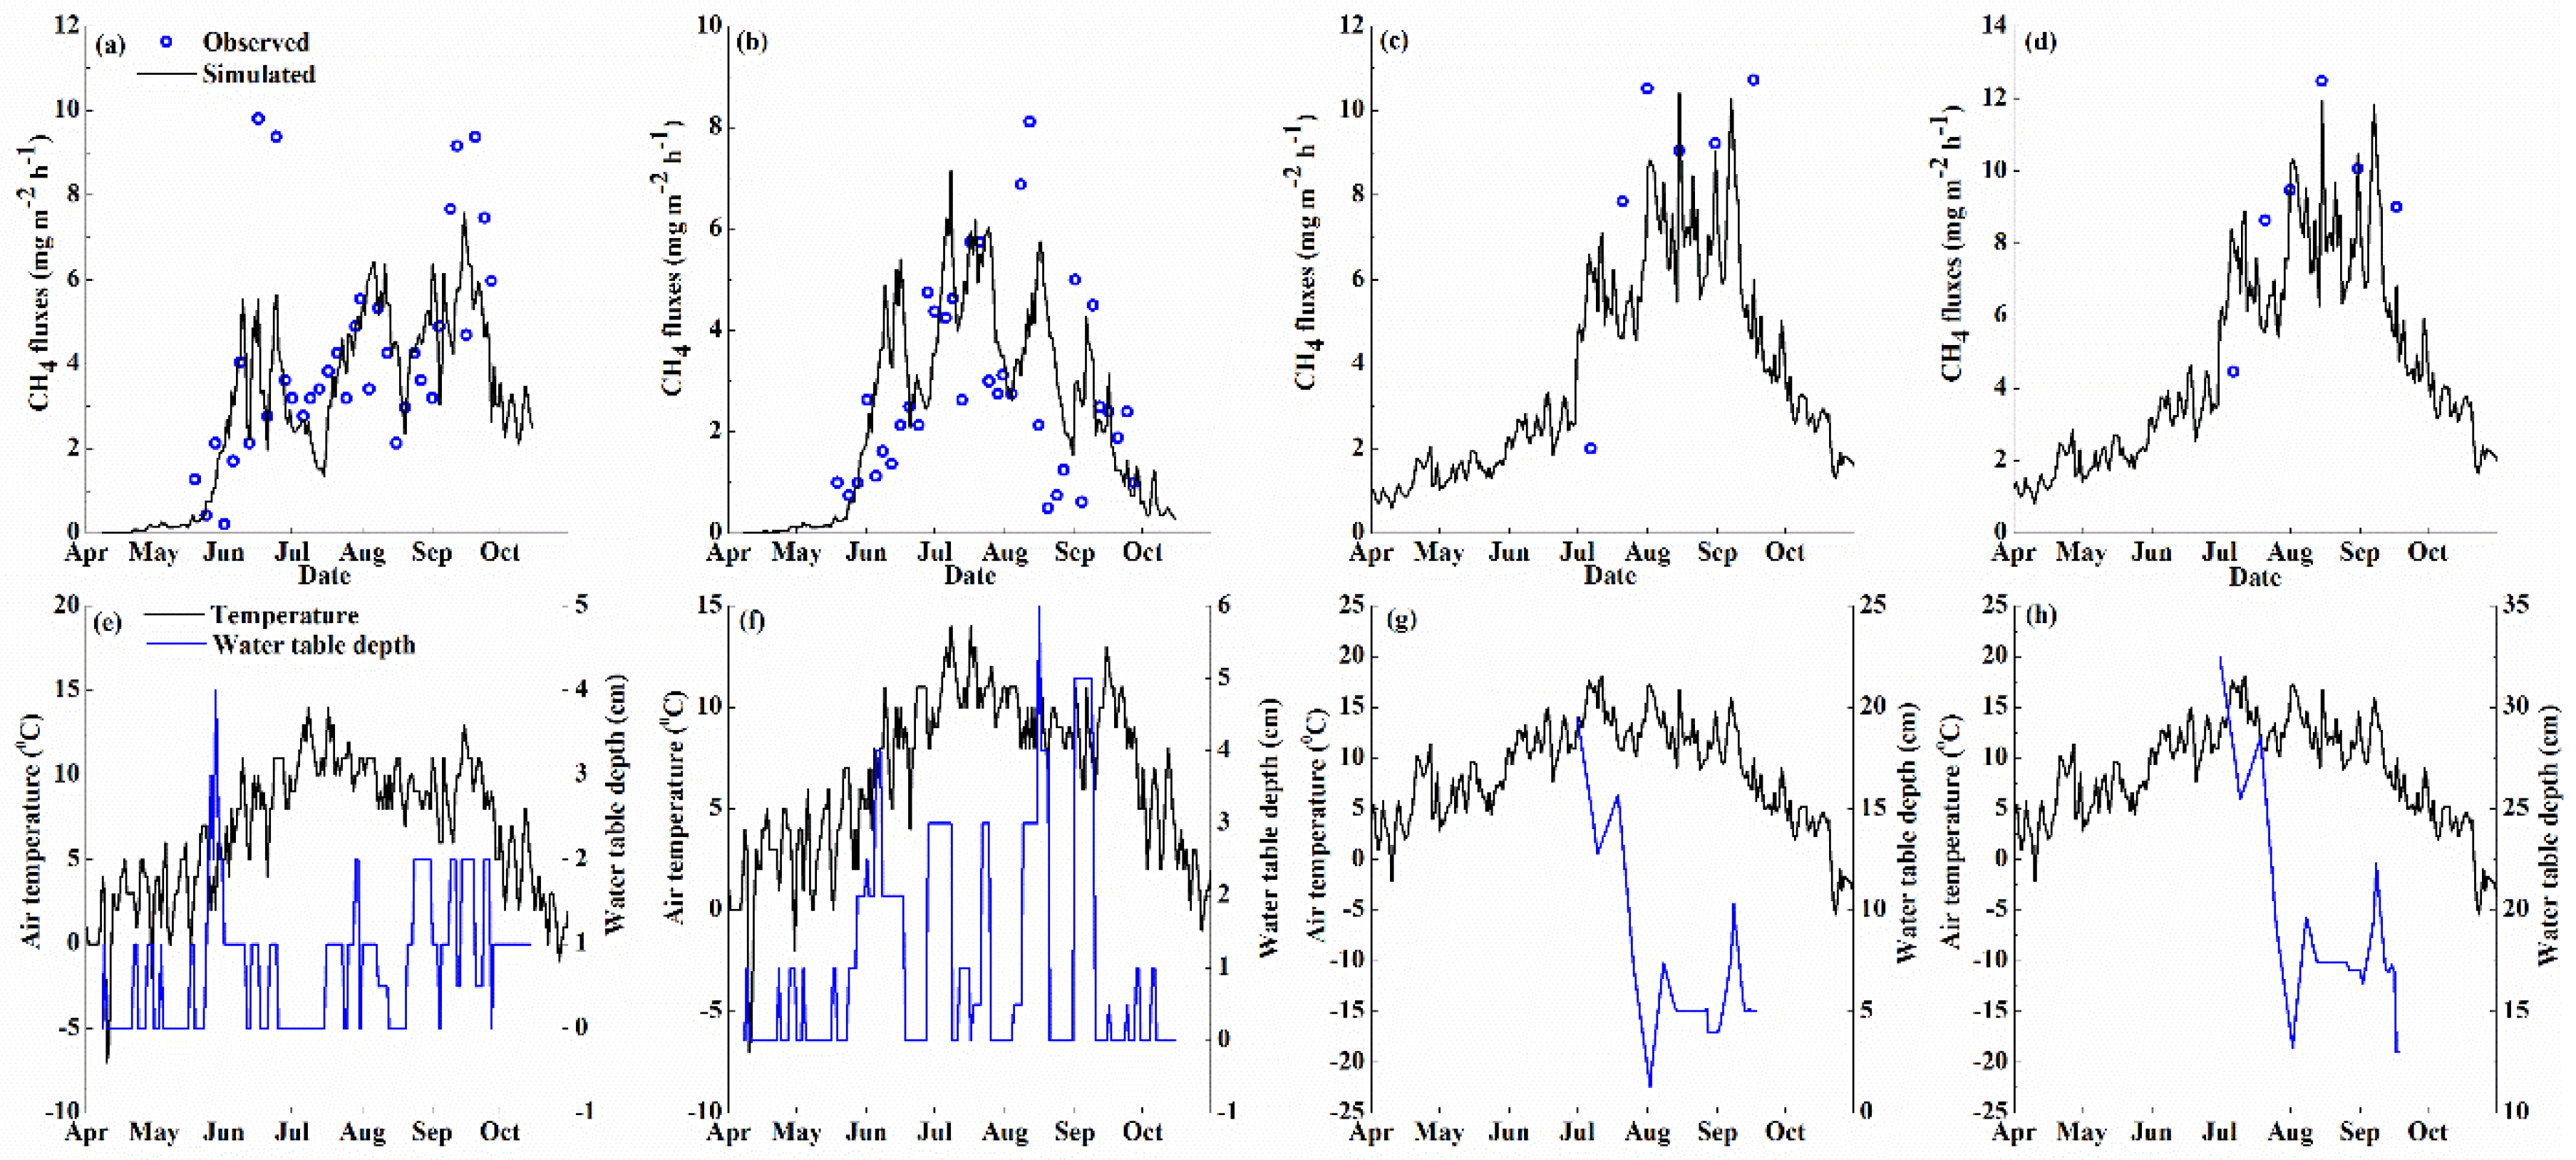
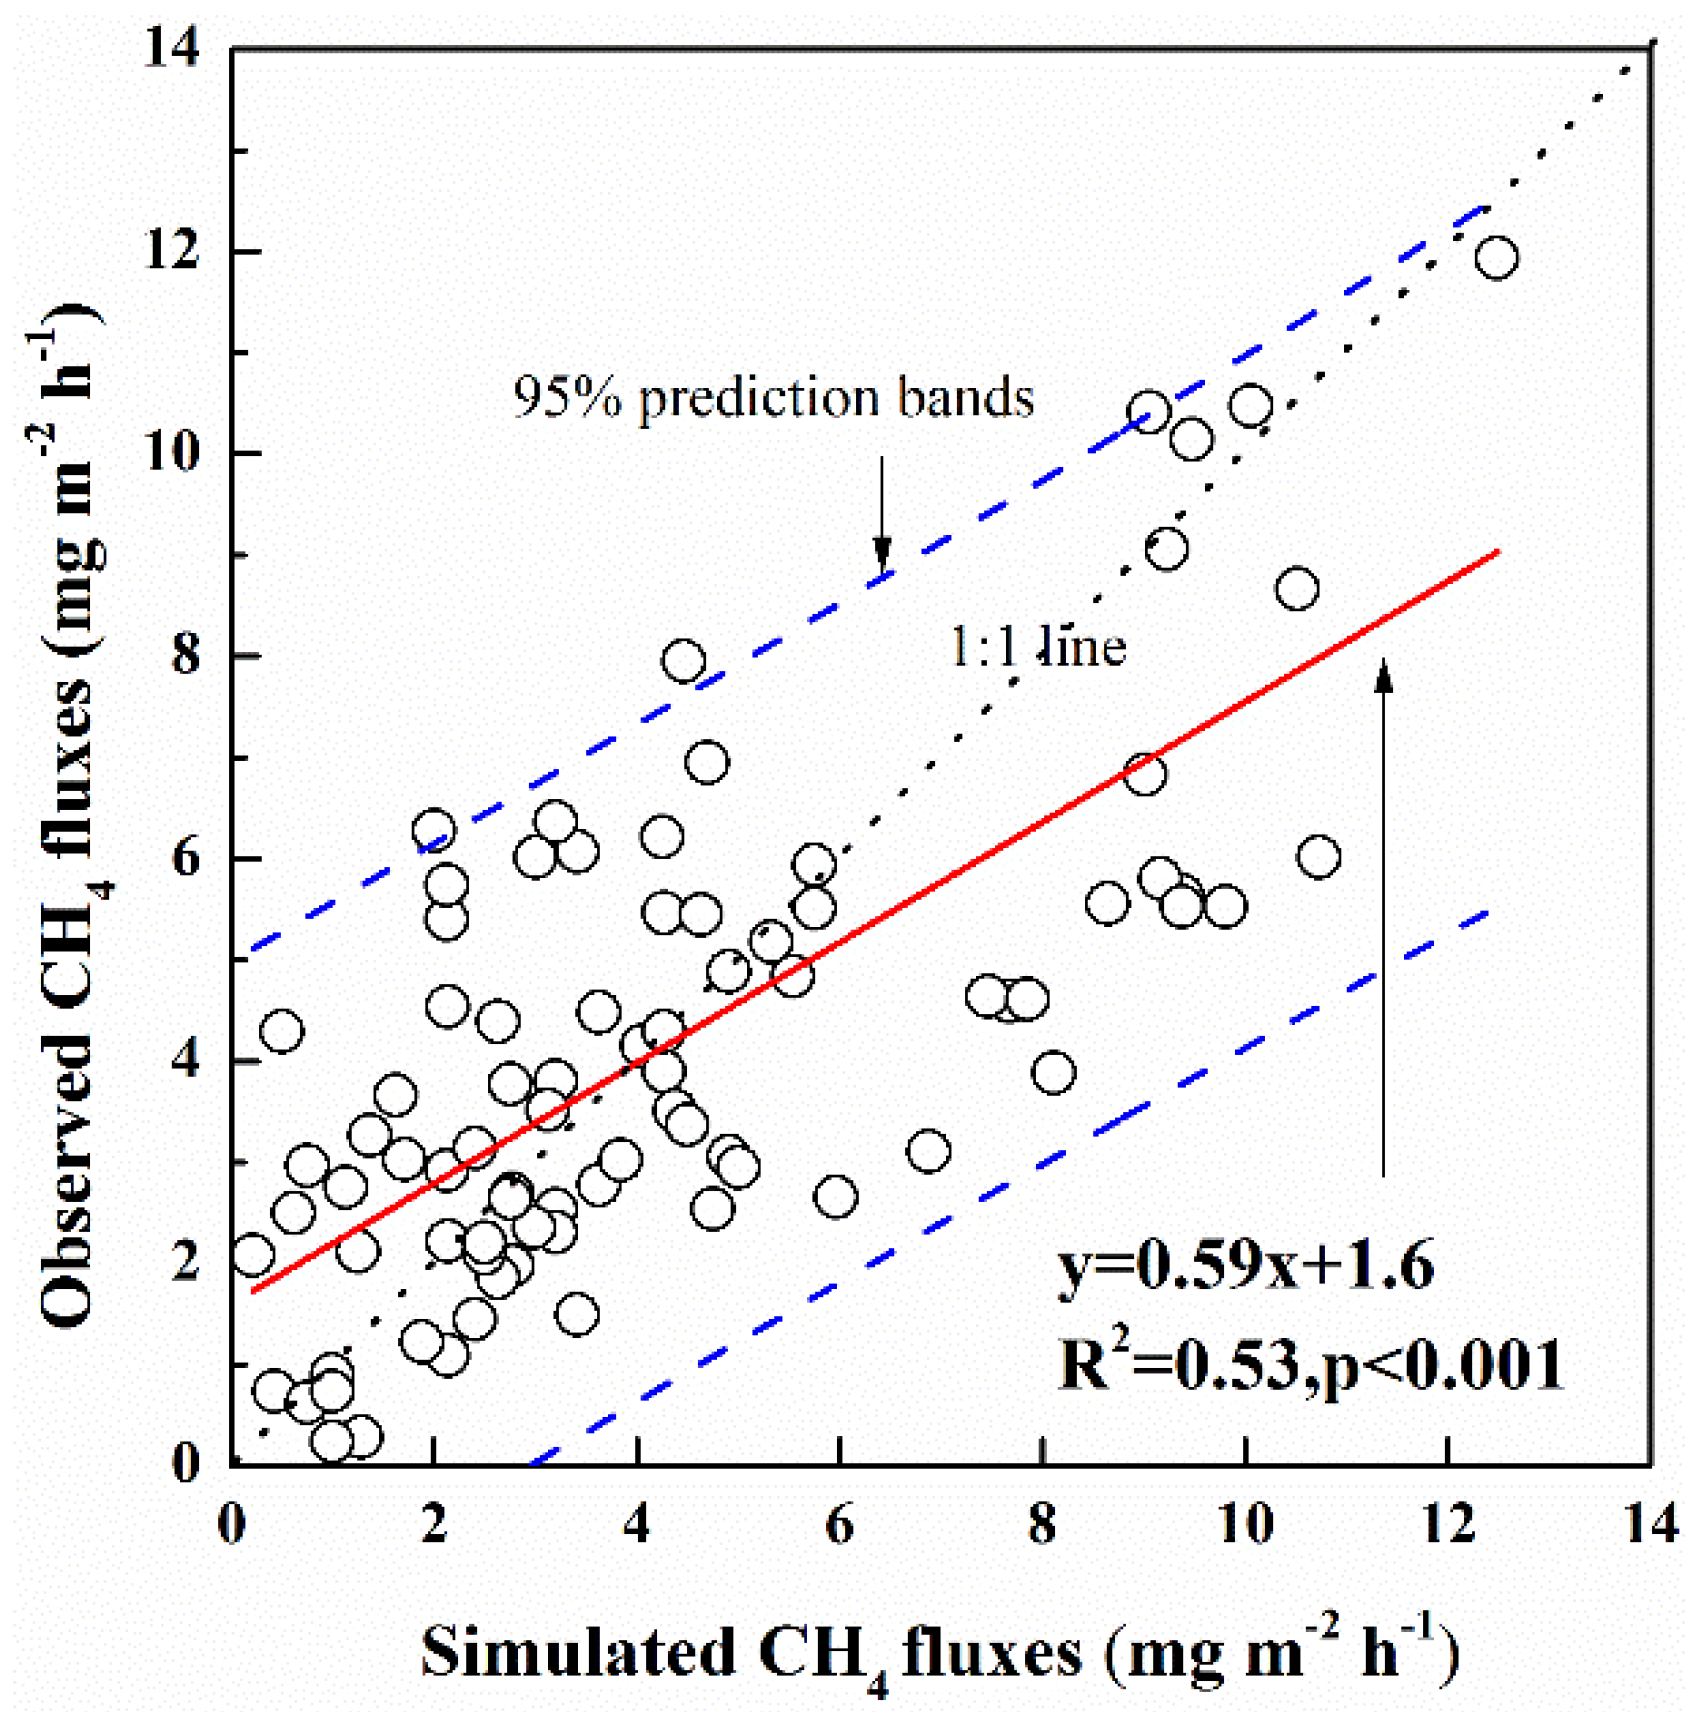
3.1. Model Validation

In this study, we used independent measurements of CH4 fluxes to validate the model prior to extrapolation to the TP. Figure 2 shows the simulated and observed seasonal variations in CH4 emissions from the Zoige and Haibei sites. In general, the model simulation was similar to the seasonal changes in CH4 emissions from both sites (Figure 2a–d). However, there were some discrepancies between the simulated and observed CH4 fluxes. For example, the model did not capture the higher CH4 emissions from the Zoige CME site during June and September 2001 (Figure 2a). A systematic positive discrepancy between modeled and observed CH4 emissions from the Zoige CMU site also occurred during the period from June to August 2001 (Figure 2b). For the Haibei alpine wetlands, the model overestimated CH4 fluxes in early July and underestimated CH4 fluxes in late July at both the CAL and HVU sites (Figure 2c,d). A regression of computed versus observed CH4 emissions resulted in an R2 of 0.53, with a slope of 0.59 and an intercept of 1.6 mg m−2 h−1 (n = 82, p < 0.001, Figure 3).
The total amount of seasonal CH4 emissions at the two sites was determined as the summation of the daily values. The absence of CH4 emission measurements between consecutive days (Figure 2a–d) was linearly interpolated. The simulated seasonal CH4 emissions were approximately 8% higher than the observed values for the Zoige wetland, but were approximately 21% lower than the observed value for the Haibei wetland (Table 2). The model simulated the CH4 emissions from Zoige and Haibei wetlands with a model efficiency of 0.52. However, there was some bias between the simulated and observed values, with a RMSE value of 47.4% and a RMD value of −4.3%.

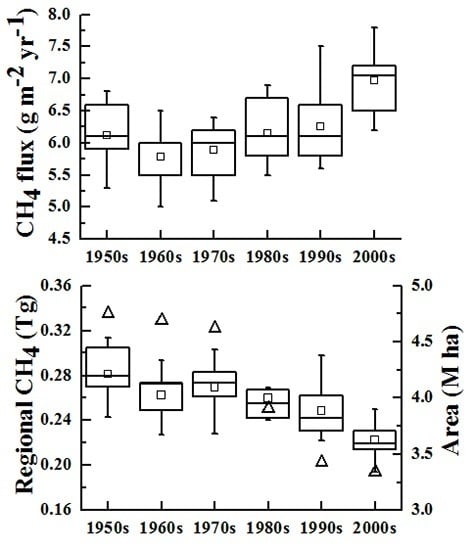
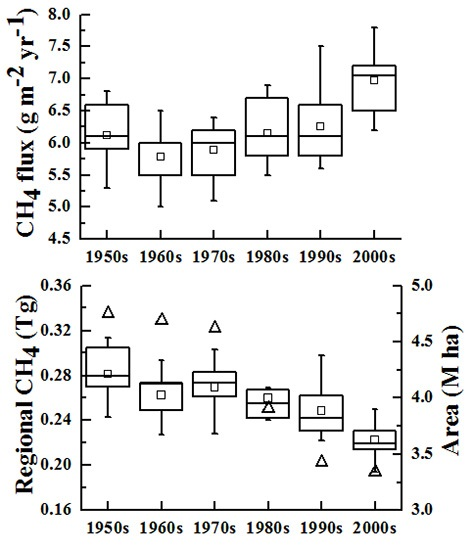
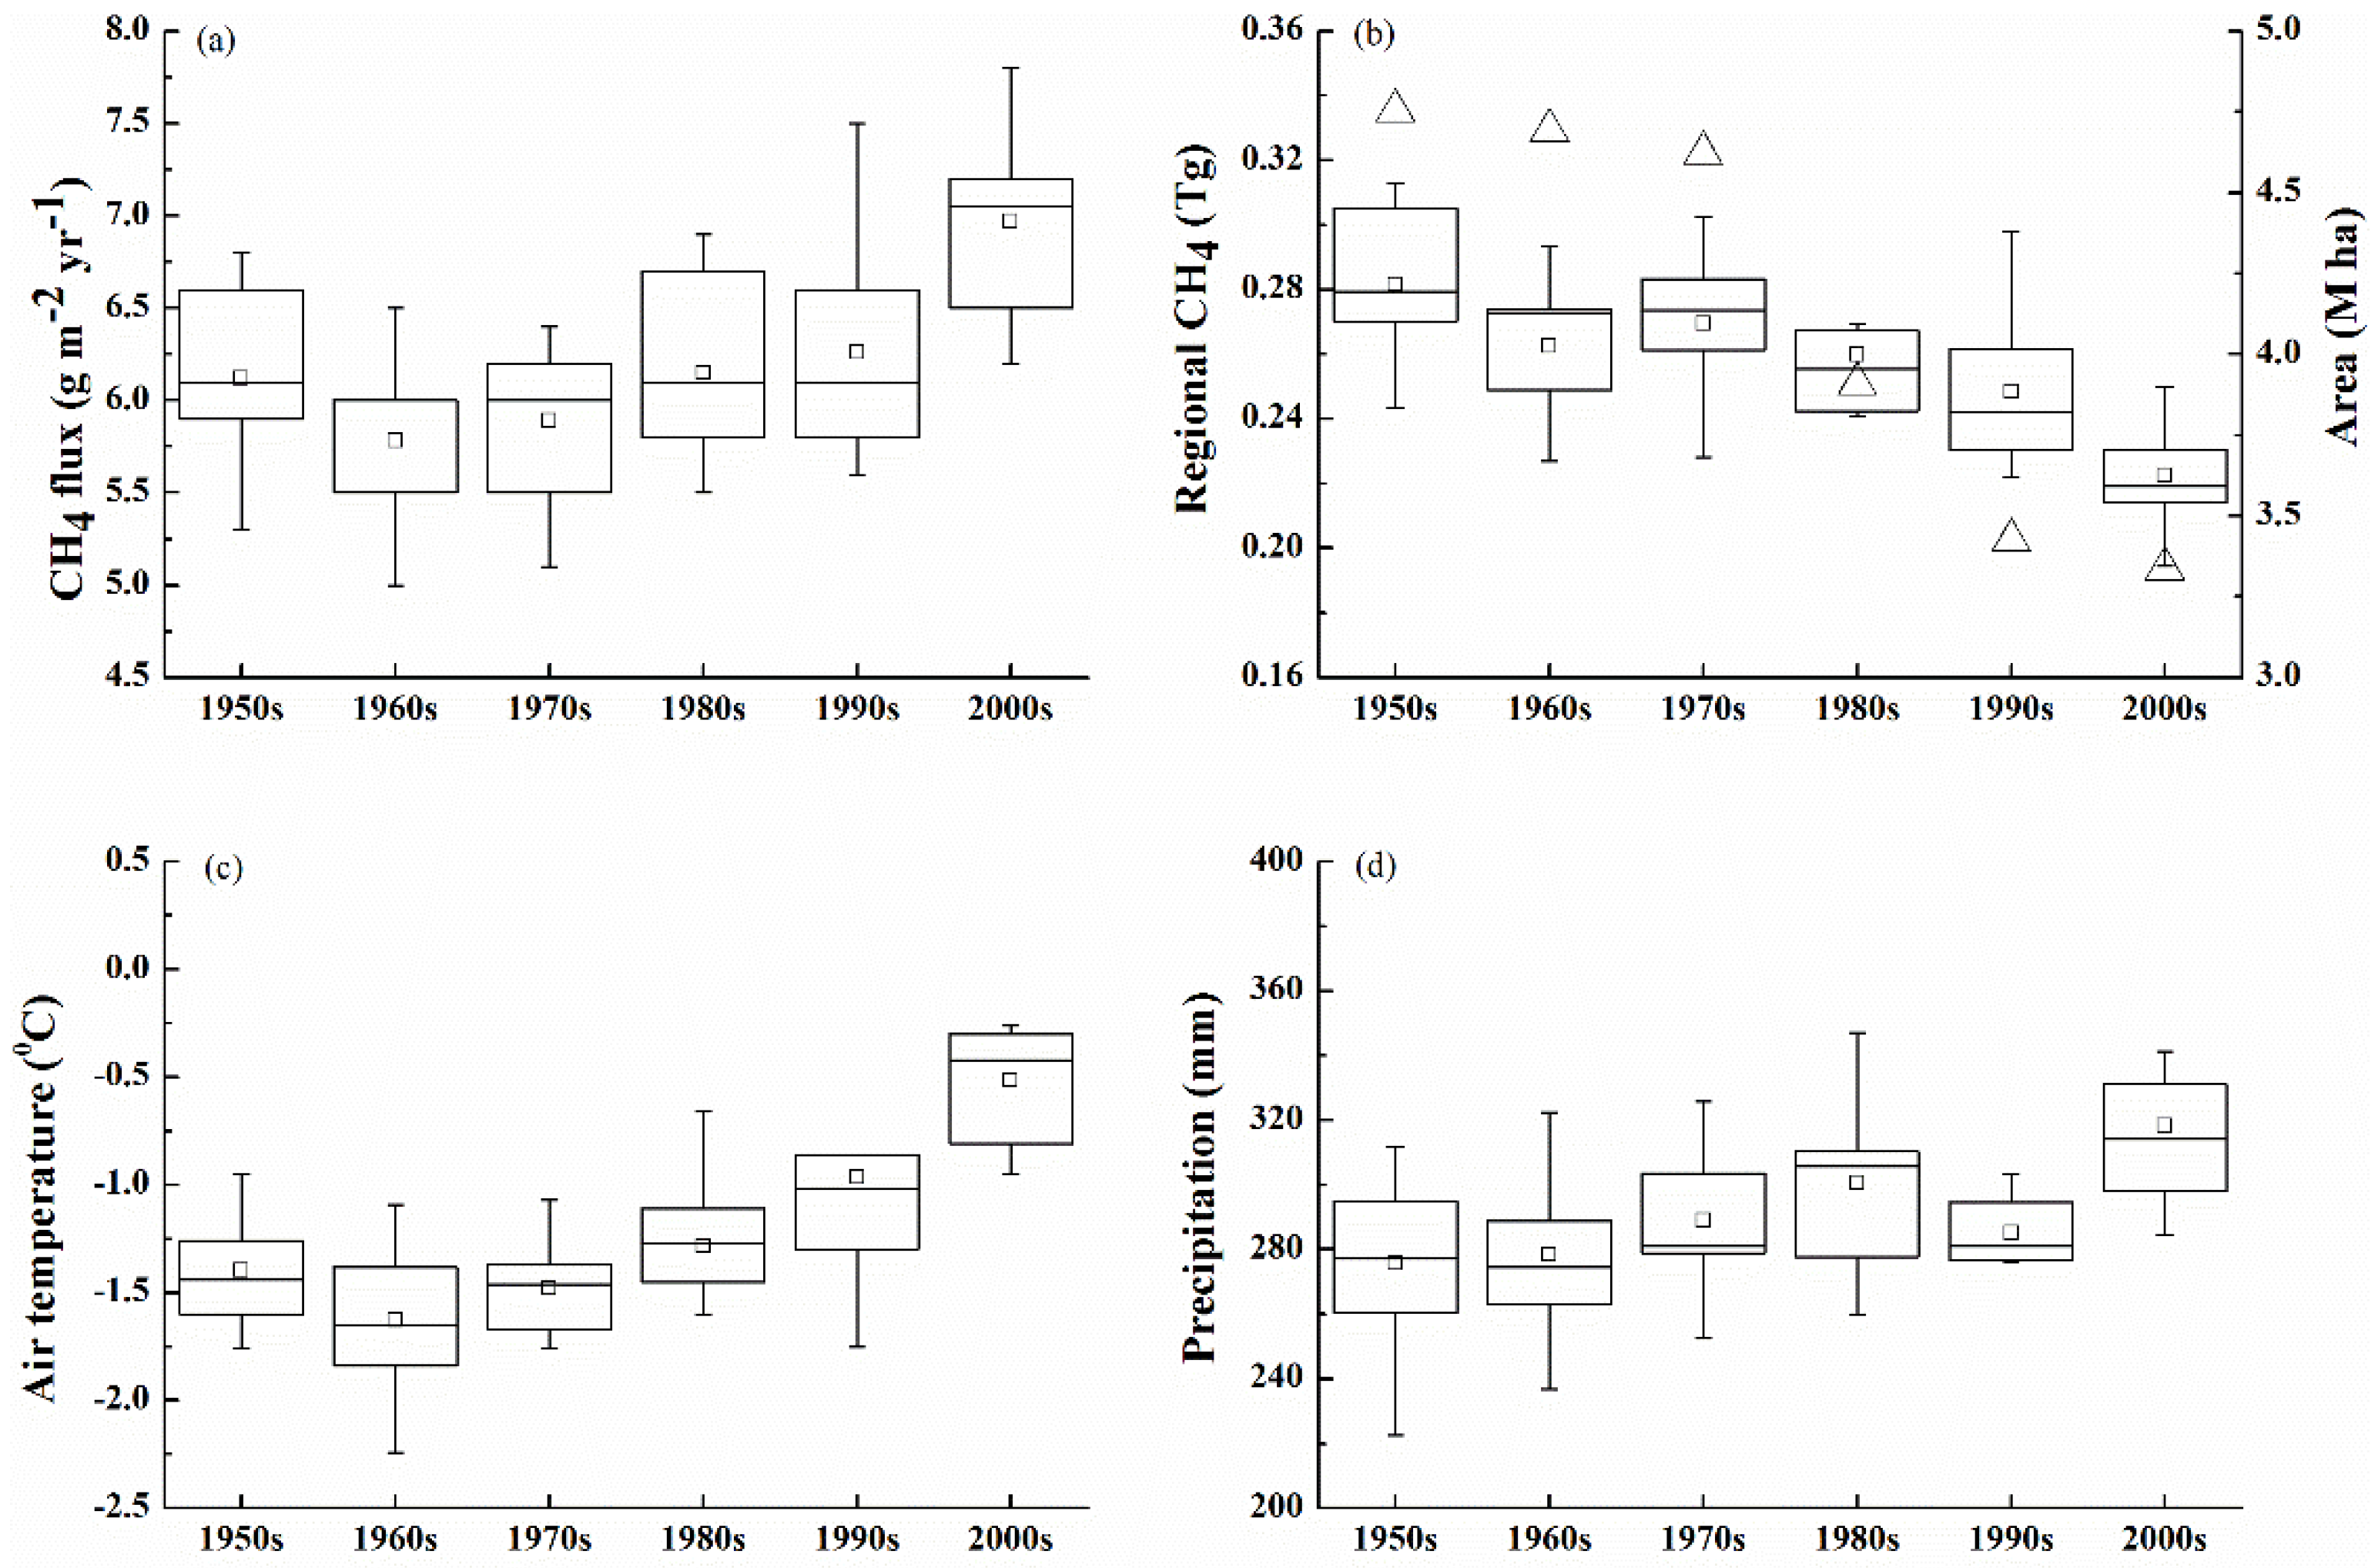
3.2. Temporal Variation in CH4 Emissions on the TP

Temporal variation in CH4 fluxes and the total amount of regional CH4 emissions are shown in Figure 4. The decadal mean area-weighted CH4 fluxes increased significantly from the 1950s to the 2000s (Figure 4a). The decadal mean CH4 flux was 6.1 g m−2 year−1 and increased to 7.0 g m−2 year−1, with a total increase of 15% (Figure 4a). During the first 30 years of the modeled data, the decadal mean CH4 fluxes showed a decreasing trend. The lowest CH4 fluxes occurred in the 1960s, with a value of 5.8 g m−2 year−1 (Figure 4a). The rate of increase in CH4 fluxes increased significantly from the 1980s, with a maximum value in the 2000s (Figure 4a).
The temporal variation in CH4 fluxes was strongly influenced by climate change during the 60 years examined. The increase in decadal mean air temperature from −1.4 °C in the 1950s to −0.51 °C in the 2000s promoted CH4 fluxes (Figure 4c). The lowest CH4 fluxes occurred in the 1960s (Figure 4a), which corresponded to the lowest temperatures (Figure 4c) and precipitation (Figure 4d). The highest temperatures (Figure 4c) and precipitation (Figure 4d) resulted in the high CH4 fluxes of the 2000s (Figure 4a). A significant positive correlation was found between the annual mean CH4 flux and temperature (Figure 5a), as well as between CH4 flux and annual precipitation (Figure 5b). This result suggests that a warmer, wetter climate accelerated CH4 fluxes from the wetlands on the TP over the past 60 years.
Although CH4 fluxes showed an increasing trend (Figure 4a), CH4 emissions decreased on a regional scale during the past 60 years (Figure 4b). This decrease was driven by wetland loss. A total of 4.75 M ha of wetland existed in the 1950s, but that area decreased to 3.34 M ha in the 2000s (Figure 4b). As a result, the total amount of CH4 emissions decreased from 0.28 Tg in the 1950s to 0.22 Tg in the 2000s, a decrease of approximately 21% (Figure 4b).

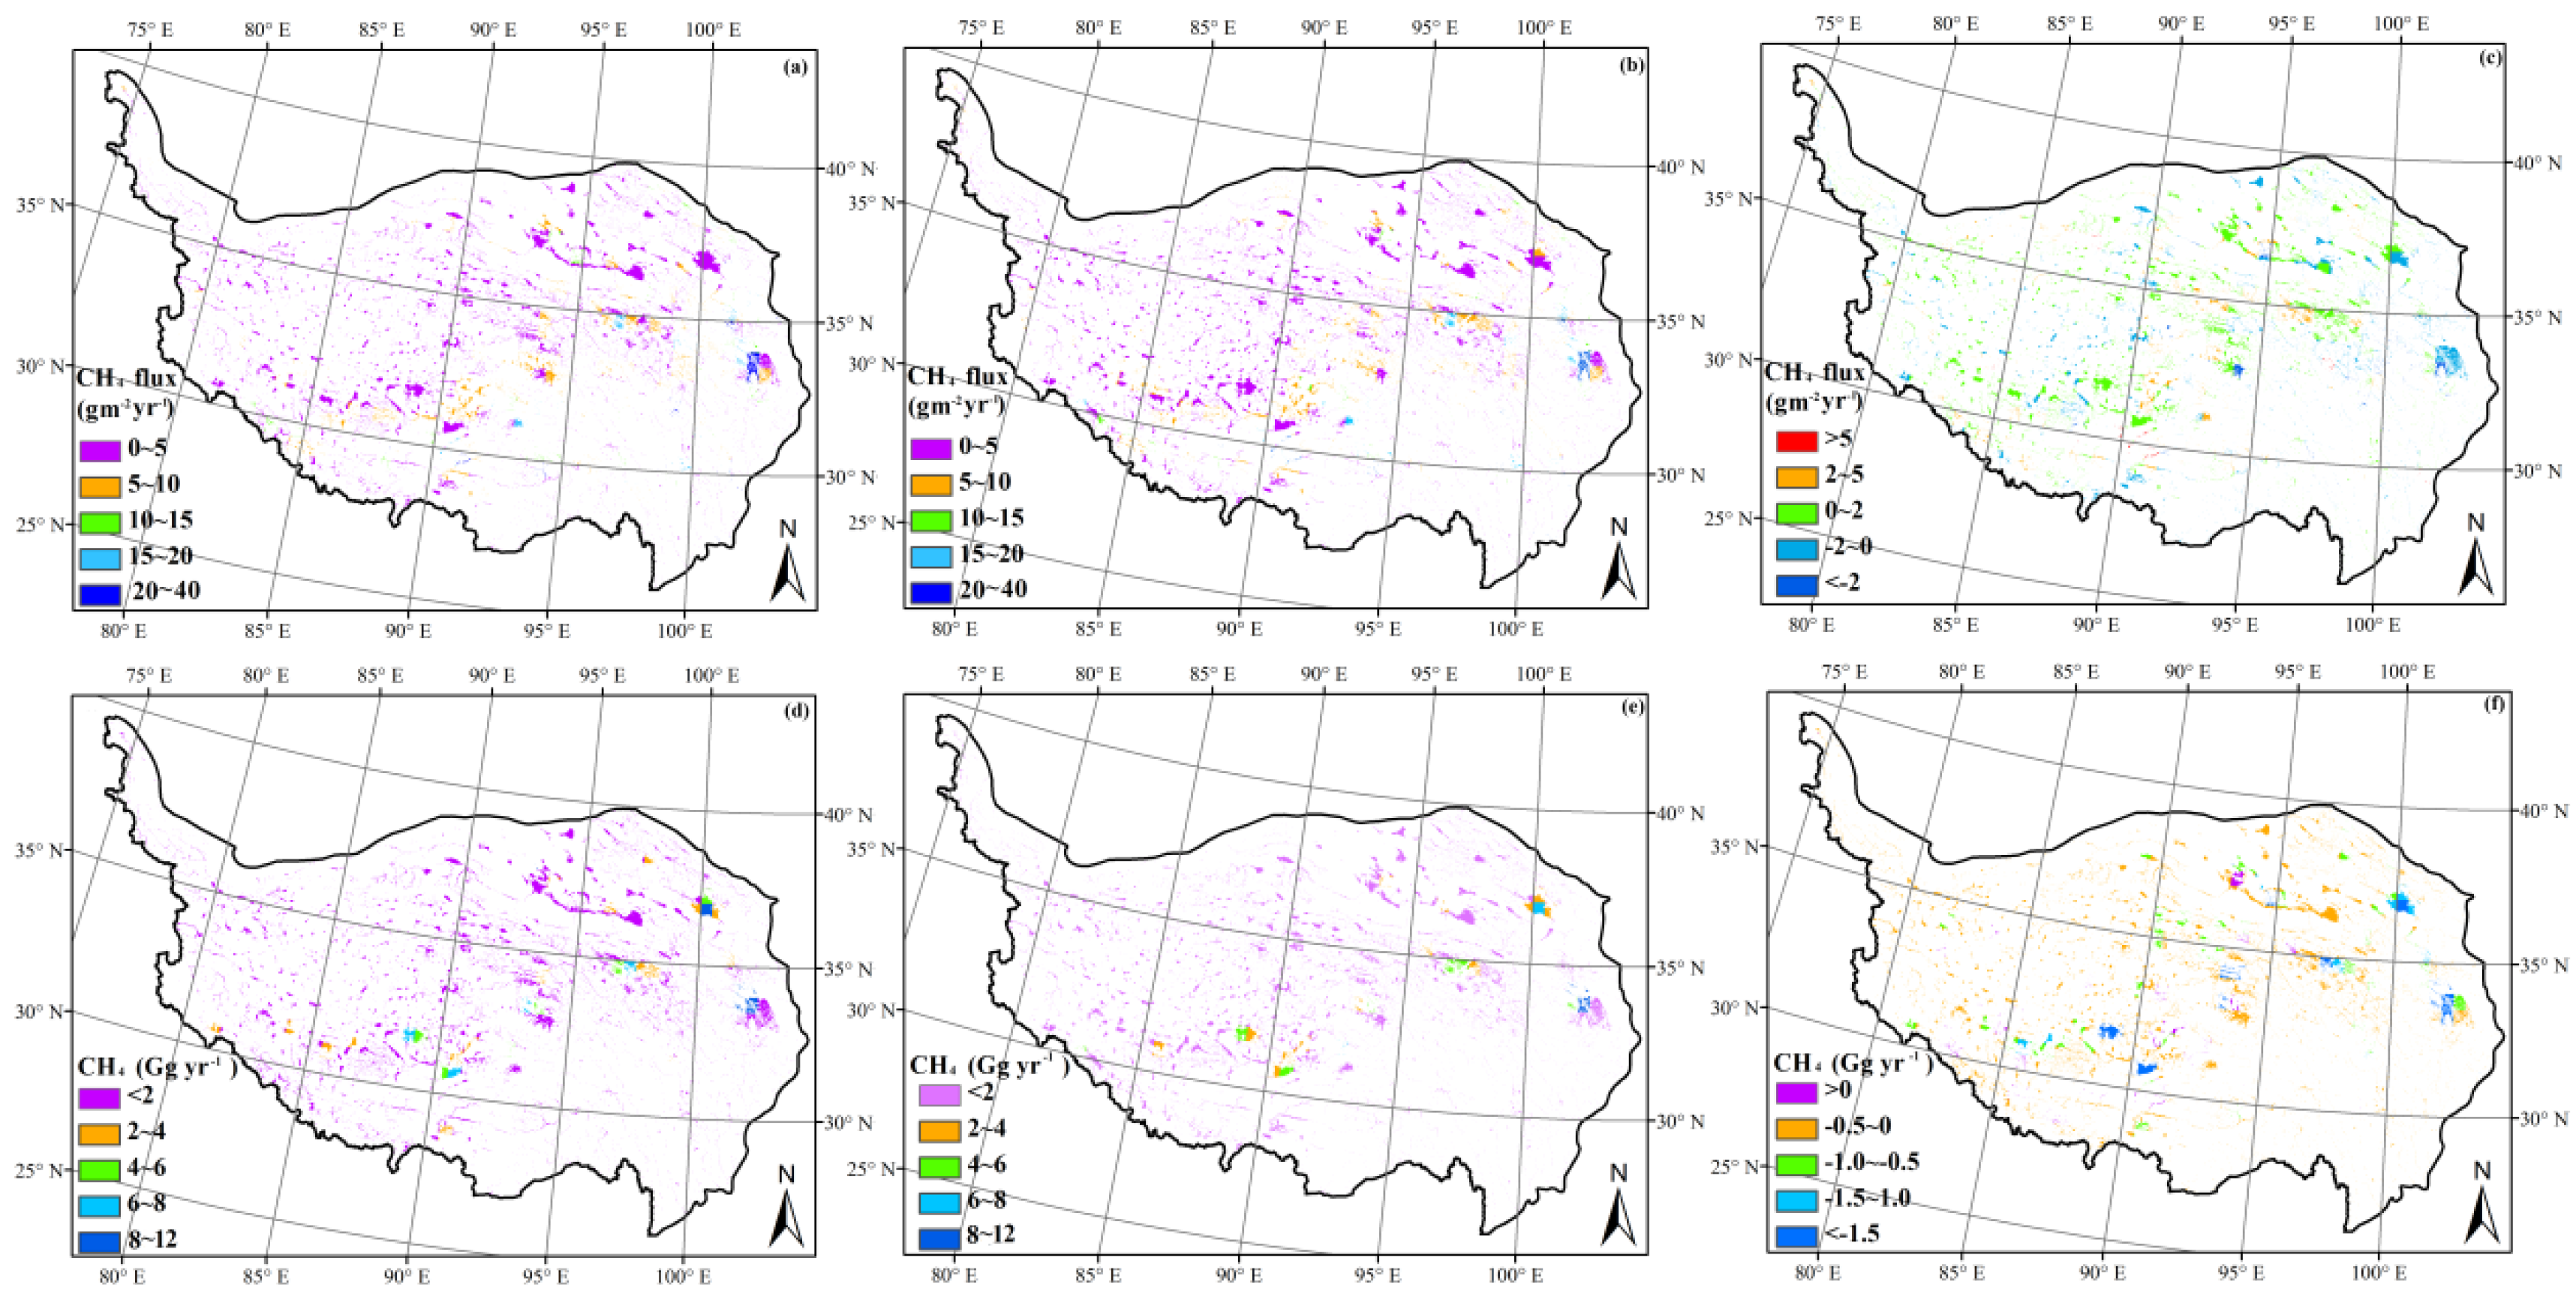
3.3. Spatial Variation in CH4 Emissions from the TP

Spatial variation in CH4 emissions from the TP are shown in Figure 6. The highest CH4 fluxes occurred at the eastern edge of the Plateau, with peak fluxes as high as 40 g m−2 year−1 (Figure 6a,b). CH4 fluxes showed a decreasing trend from the southeast to the northwest, with the lowest CH4 fluxes of 5 g m−2 year−1 occurring in the northwestern Plateau (Figure 6a,b). Compared with the early 1950s, a widespread enhancement of 0–2 g m−2 year−1 became apparent in the 2000s from the wetlands of the TP (Figure 6c). In some wetlands of the central Plateau, this enhancement was as high as 2–5 g m−2 year−1 (Figure 6c). Decreases in CH4 fluxes were shown at the northeastern edge of the Plateau, with values of 0–2 g m−2 year−1 (Figure 6c).
The grid-level regional emissions showed similar spatial patterns to that of CH4 fluxes (Figure 6d,e). The highest emissions occurred at the eastern edge of the Plateau, with values higher than 8 Gg year−1. The northwestern Plateau had the lowest emissions at 2 Gg year−1 (Figure 6d,e). Unlike the CH4 fluxes (Figure 6c), a widespread decrease of approximately 0.5 Gg occurred in the 2000s compared with the 1950s (Figure 6f). The greatest decrease occurred in the eastern and northeastern Plateau, with changes as high as approximately 1.5 Gg year−1 (Figure 6f).

4. Discussion

4.1. Uncertainties in Model Validation

Model validation is important prior to extrapolation to a regional scale. A validation should use independent observed data that is not also used to calibrate the model [59]. Previous studies demonstrated a better model performance than that shown here when simulating CH4 emissions from the Haibei wetland in the TP—e.g., Jin’s study [60]. However, as reported by Jin, the same dataset was used to both calibrate and validate the model. Here, we calibrated the model based on CH4 observations from the Sanjiang Plain obtained from previous studies [29,32]. The parameters were unchanged for the validation of CH4 emissions from the TP. The model obtained estimates using different datasets for calibration and validation purposes, usually resulting in more accurate greenhouse gas flux predictions.
The uncertainties in model validation were induced in part by the variable water table depth, which is one of the environmental factors most sensitive to CH4 emissions [24,61]. In the Zoige wetland, water table depth generally changed quickly and presented as patches from July to August 2001 [49]. The rapid changes were difficult to capture, which may have resulted in discrepancies between the observed and simulated CH4 fluxes (Figure 2a,b). In addition, a negative bias occurred between the simulated and observed seasonal CH4 emissions from the Haibei wetland (Table 2), which may be explained in part by the sparse observations from this area. The proportions of observed CH4 fluxes extrapolated for the seasonal fluxes from the Haibei and Zoige wetlands were 27% and 8%, respectively. The linear interpolation used to fill gaps between consecutive observed values in order to calculate the seasonal CH4 emissions may disregard non-linear variations between dates.

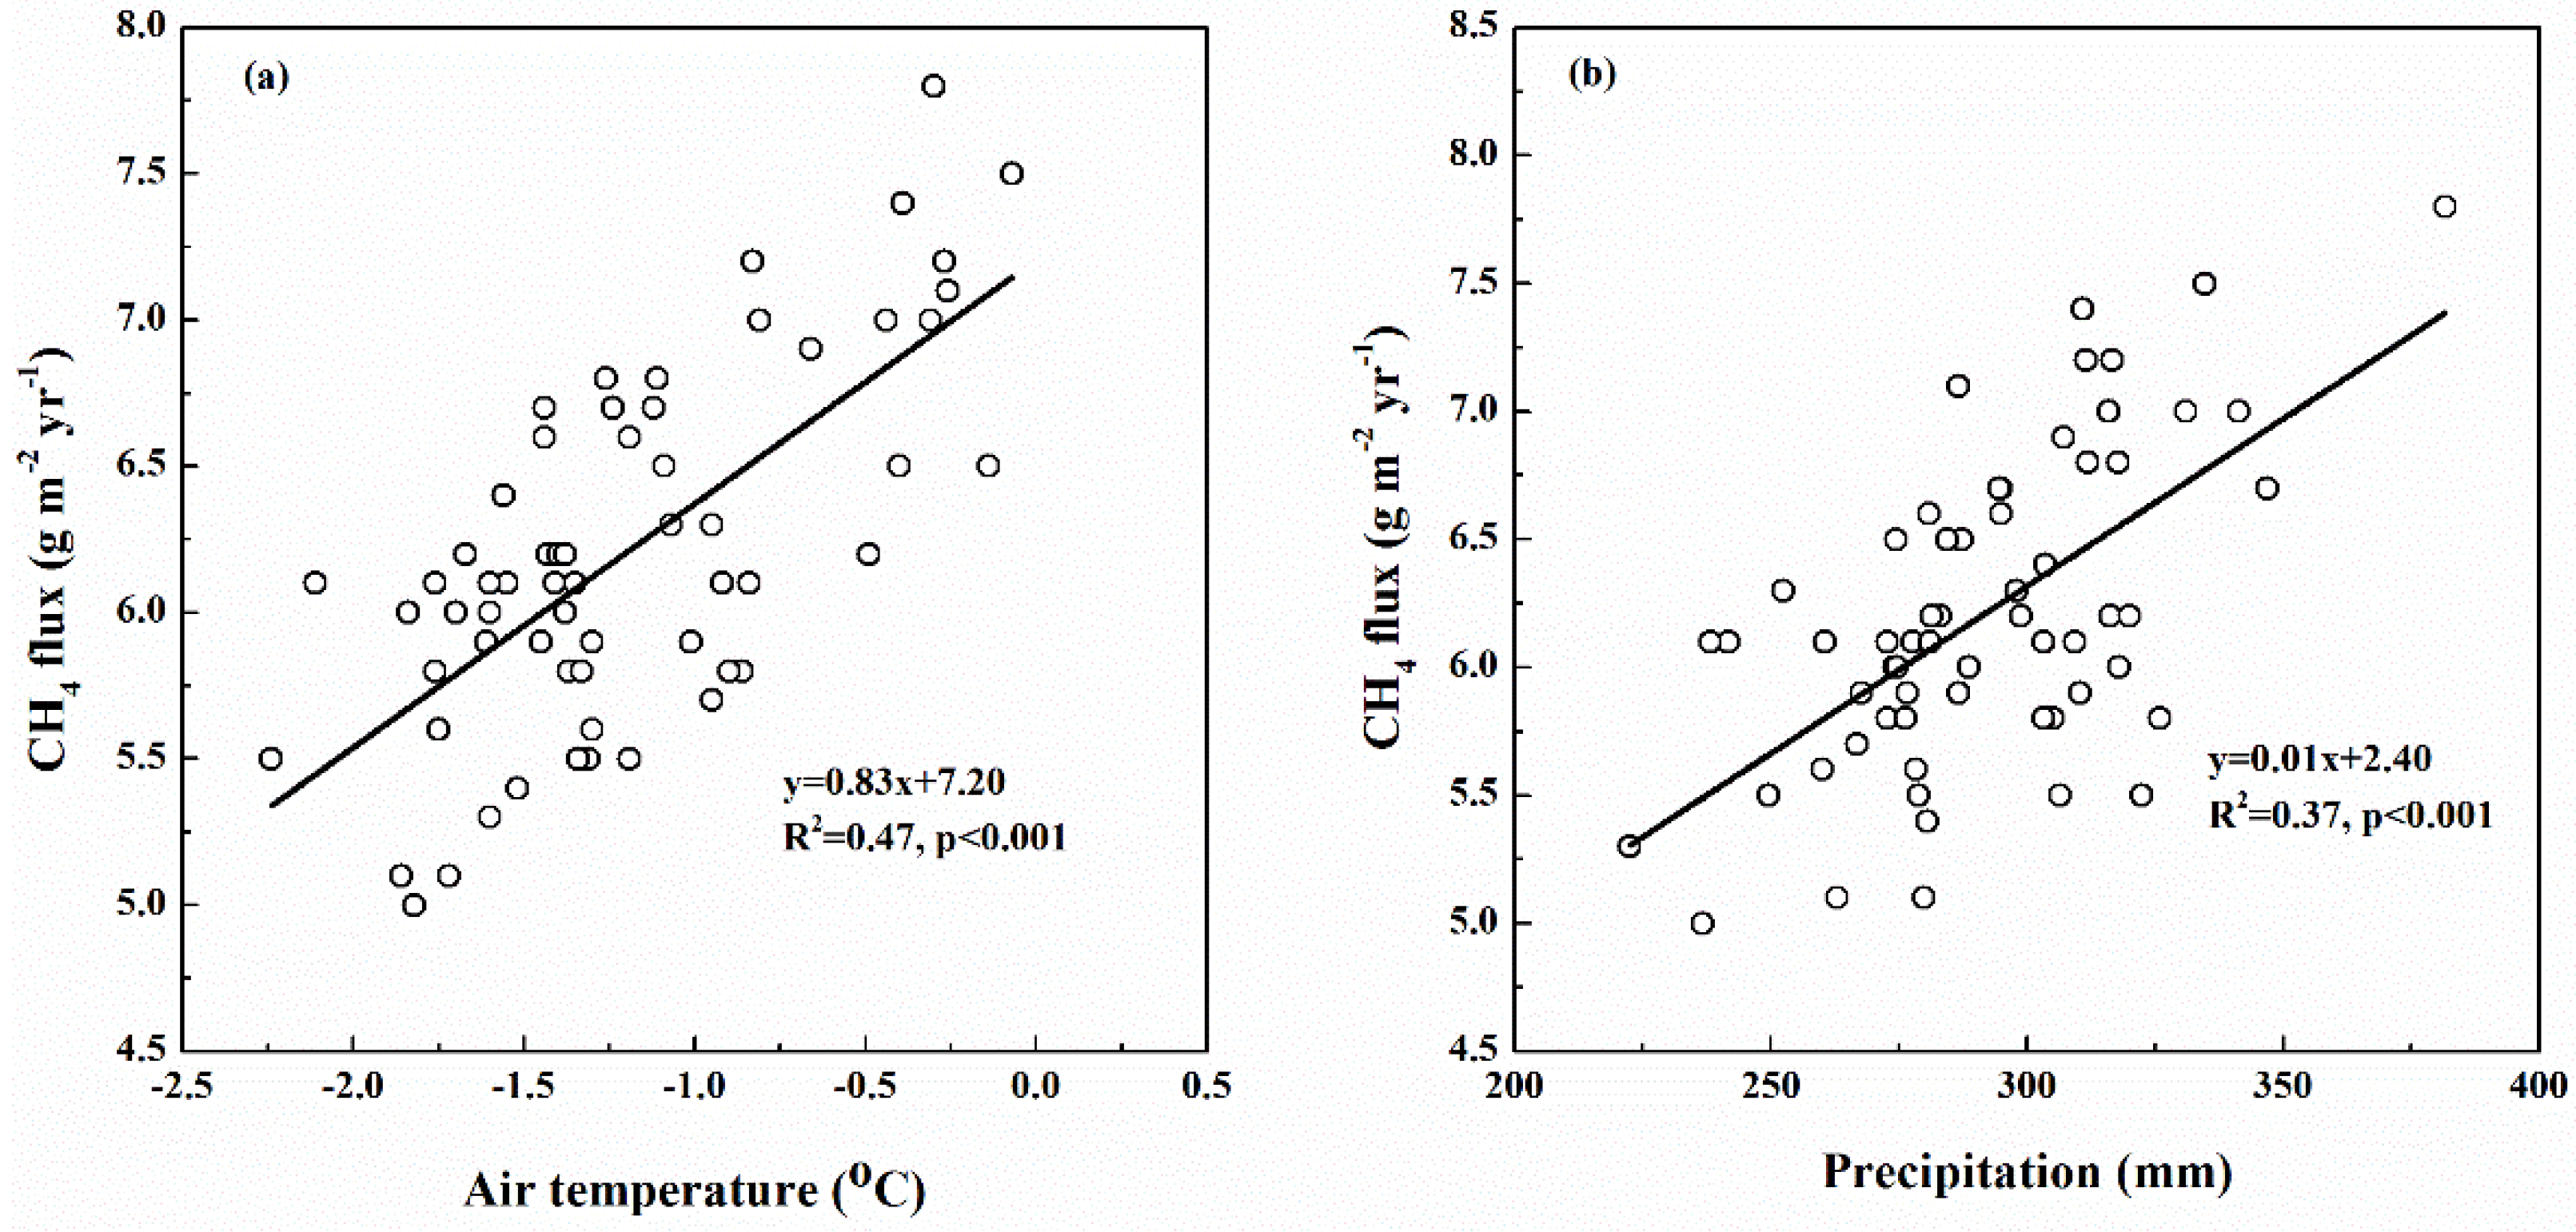
4.2. Feedback between Climate Change and CH4 Emissions

We concluded that the increased CH4 fluxes were primarily induced by increasing temperature and precipitation over the past 60 years. A previous study [62] simulated CH4 fluxes from China from 1949 to 2008 and also determined that climate change was the main factor influencing CH4 fluxes. Zhu reported a significant positive correlation between soil temperature and CH4 emissions, as well as water table depth and CH4 emissions [63]. This finding is consistent with our study (Figure 5). Such a relationship may arise because soil temperature is controlled by air temperature, and water table depth is primarily determined by precipitation.
Other simulation studies also demonstrated that historical climate change could increase CH4 fluxes in different wetlands. Jin simulated annual mean CH4 emissions from potential wetland areas on TP increased gradually from 6.3 g m−2 y−1 in 1979 to 7.4 g m−2 y−1 in 2010, an increase of 17% [60]. Similarly, we estimated an increase of 13% over the same period, from 6.2 g m−2 y−1 in 1979 to 7.0 g m−2 y−1 in 2010 (Figure 3). The influence of climate change on CH4 emissions may differ by region. For example, in the Sanjiang Plain, the CH4 increase induced by climate warming has been offset by the decrease in annual precipitation over the last 60 years [32].
In addition to the temperature and precipitation, the increase in the atmospheric CO2 concentration may have also influenced CH4 emissions over the past 60 years. CO2 fertilization increased the primary production (NPP) of plants [64,65]. This could stimulate CH4 emissions, as they are the main source of methanogenic substrates [66,67]. As simulated by the TEM model in this study, CO2 fertilization resulted in an increase in the plant NPP, with a rate of a rate of 2.2 g m−2 per decade (data not shown). This increase also promoted CH4 fluxes during the past 60 years.
CH4 is an important greenhouse gas, and its emission has created a positive feedback loop effect for climate warming. According to our study, wetland loss on TP reduced the CH4 emissions by approximately 20% (Figure 4b), which may decrease the global warming potential (GWP). However, the wetland loss also results in a loss of soil organic carbon (SOC) (e.g., [68,69,70,71]), releasing additional CO2 into the atmosphere. In addition, draining wetlands may increase N2O emissions [72,73]. Future studies should investigate the concomitant changes in CH4, CO2, and N2O emissions, as well as the consequent GWP.

4.3. Estimates of the Regional CH4 Emissions from the TP

Regional CH4 emissions were estimated using several methods and exhibited a high degree of uncertainty (Table 3). This uncertainty resulted from both the observed or simulated CH4 fluxes, as well as the estimated wetland area.
The site-specific method extrapolated the site-specific CH4 fluxes to the entire region, which may obscure spatial variations in CH4 fluxes (Figure 5). The earliest estimates of CH4 emissions for the TP were from Jin [18], who reported estimated CH4 emissions ranging from 0.7 to 0.9 Tg year−1. This estimation was based on observations from the Huashixia wetland. Estimates from both Ding [19] and Chen [16] were primarily based on measurements from Zoige at the eastern edge of the TP. However, the two studies produced different estimates, with Chen estimating CH4 emissions at 1.25 Tg year−1, while Ding estimated only 0.56 Tg year−1. This difference arose primarily because Chen used an observation of CH4 fluxes that was much higher than the observation of Ding for the 2000s. Recently, Wei [17] made a challenge estimation, which considered the wetland species on the TP. According to Wei, swamp meadows release much less CH4 than a typical swamp. Previous estimates that extrapolated the CH4 fluxes from a typical swamp may have significantly overestimated regional CH4 emissions.
In this study, the simulated spatial variation in CH4 fluxes (Figure 5a,b) was consistent with previous observations. In the Zoige Plateau, located at the eastern edge of the TP, CH4 fluxes ranged from 5 to 40 g m−2 year−1 (Figure 5a,b), which corresponded to the range of measurements previously reported (1.3 to 44.9 g m−2 year−1) [21,49,75]. The simulated CH4 fluxes around Namucuo wetlands ranged from 0 to 10 g m−2 year−1 (Figure 5a,b), which was consistent with prior observations (0.6 to 12.6 g m−2 year−1) [17]. The simulated CH4 fluxes around Huashixia wetlands ranged from 0 to 10 g m−2 year−1 (Figure 5a,b), which also corresponded to prior observations (ranging from 2.4 to approximately 10.5 g m−2 year−1) [18]. Xu and Tian [62] also simulated CH4 fluxes ranging from 0 to 27 g m−2 year−1 from the TP. In contrast, the simulated range of Jin [60] was lower than that found in this study, with a range from 0 to 8 g m−2 year−1.
The estimated wetland area ranged from 3.2 M ha to 18.8 M ha (Table 3). The variation may have been due to the estimation method. Most previous studies used the survey wetland area (e.g., [18,19,74]). Jin [60] estimated an area of 13.4 M ha based on the soil wet extent [76]. Our area estimate was based on remote sensing data [15] and was consistent with both Xu and Tian’s study [62] and Zhang and Jiang’s study [74].

4.4. Uncertainties and Future Needs

This study estimated regional CH4 emissions from natural wetlands in TP over the past 60 years. However, uncertainties still persisted in the estimations due to an incomplete model structure, model inputs, and inaccuracies in the defined wetland area.
First, some physical and biogeochemical processes are still neglected in CH4MODwetland. For example, the impact of nitrogen deposition on CH4 production and oxidation was not considered in this model. Nitrogen deposition can regulate plant growth and microbial activities [77,78]. Nitrogen addition stimulates plant growth [79], and litter with higher N levels decomposes faster [80], leading to increased CH4 emissions. In addition, nitrate can decrease CH4 production by increasing redox potentials [81], and ammonium usually inhibits CH4 oxidation by competing for methane monooxygenase [82]. It was previously reported that nitrogen deposition has increased during the past 60 years in China [83]. The impact of nitrogen deposition on CH4 emissions should be considered in CH4MODwetland in the future to decrease the uncertainties in the long-term estimations.
Secondly, model inputs—especially the spatial variability in the water table depth—account for a large proportion of the uncertainty in regional estimations. TOPMODEL has been widely used to simulate the water table distribution of the natural wetlands. It has been validated for both site-specific water table seasonal variation (e.g., [44]) and the spatial variation on the regional and global scales. On the regional scale, areas where the water table is at or above the soil surface level can be interpreted to correspond to the surface water extent. Thus, the validation of the spatial distribution of the water table depth was usually compared to remotely sensed inundation datasets (such as GIEMS [76,84], or [85]) and wetland and land cover mapping products (including [86,87]). For example, Kleinen [45] and Melton [87] showed reasonable validation by comparing the monthly global distribution of the water table with remote sensing data [76,84] as well as the GLWD map [86]. Similar validations conducted on the regional and global scale have also been reported in previous studies [88,89]. However, the limited resolution would inevitably induce bias into the water table variations—especially on TP, where the natural wetland has a large degree of microscale topographic variation [17]. More accurate descriptions of the hydrology process and higher-resolution datasets will be needed to reduce the error in the simulated water table depth.
Last but not least, popular methods for defining the extent of wetlands include using “Prescribed constant wetland extents” (as was done here) and the “Hydrological model” [90,91]. The latter method uses a model to simulate the dynamical wetland extent. However, both methods may produce uncertainties [88]. Improving the ability to obtain accurate data on the distribution and extent of wetlands should be a research priority in the future [63].

4.5. Future Trends in CH4 Emissions from Natural Wetlands on TP

The projected annual mean air temperature will increase by 17 °C and 3.9 °C under the RCP 4.5 and RCP 8.5 scenarios, respectively, which were designed in the IPCC fifth assessment report (AR5) [92,93] on TP by 2100 [94]. The projected annual precipitation will also increase by 19%–22% and 37%–44% under the RCP 4.5 and RCP 8.5 scenarios, respectively, by the end of the 21st century [94]. Climate change can influence the CH4 fluxes and the wetland area. According to our results (Figure 5), increasing the temperature and precipitation would increase the CH4 fluxes. In addition, future climate would change the wetland area. The rising temperature will increase evapotranspiration, thus decreasing the wetland area. However, this may be balanced by glacial retreat and more precipitation, increasing the water supply to wetlands [15].
The Chinese government has increasingly recognized the importance of wetland protection, particularly after joining the Ramsar Convention in 1992. Thus, the shrinkage and degradation of the wetland began to be reduced after 1990 (Figure 4b). According to the China National Wetland Conservation Action Plan (NWCP) by the Chinese government, 1.4 × 10⁹ ha of wetland will be restored by 2030 [95]. Thus, the NWCP will result in the expansion of wetlands on TP in the future, which may promote regional CH4 emissions.

5. Conclusions

The temporal and spatial patterns of CH4 emissions from natural wetlands on the TP from 1950 to 2010 were simulated using a model framework that integrated the CH4MODwetland, TEM, and TOPMODEL models. Model validation at the site level indicated that the model provided a reasonable description of the observed CH4 emissions from the TP. Simulation results showed that CH4 fluxes increased by 15%, from 6.1 g m−2 year−1 in the 1950s to 7.0 g m−2 year−1 in the 2010s. This change in fluxes was primarily induced by increases in air temperature and precipitation. However, during the same period, CH4 emissions were reduced by an estimated 0.06 Tg year−1 in the TP wetlands, which was primarily due to extensive wetland loss from 4.75 million ha to 3.34 million ha. On a regional scale, CH4 fluxes ranged from 0 to 40 g m−2 year−1. The lowest and highest CH4 emissions occurred at the northwestern and eastern edges of the Plateau, respectively. To decrease the model uncertainty in estimates of regional CH4 emissions, accurate simulations of CH4 fluxes and estimates of wetland area are needed in the future.

Acknowledgments

This work was supported by the National Natural Science Foundation of China (Grant No. 31000234, 41321064 and 41573069), the Chinese Academy of Sciences (CAS) strategic pilot technology special funds (Grant No. XDA05020204) and the Climate Change Special Foundation of China Meteorological Administration (CCSF201604).

Author Contributions

All authors were involved in designing and discussing the study. Tingting Li undertook the model simulation and drafted the manuscript. Qing Zhang and Zhigang Cheng made the TEM model and TOPMODEL simulation, and drew some of the maps. Zhenfeng Ma, Jia Liu and Yu Luo and Jingjing Xu collected the input data. Guocheng Wang and Wen Zhang gave the main idea of this paper and revised the paper. All authors have read and approved the final manuscript.

Conflicts of Interest

The authors declare no conflict of interest.

References

  1. Ramsar Convention Secretariat. Ramsar Handbook for the Wise Use of Wetlands, 2nd ed.; Ramsar Secretariat: Gland, Switzerland, 2004. [Google Scholar]
  2. Mitsch, W.J.; Gosselink, J.G. Wetlands; John Wiley & Sons: Hoboken, NJ, USA, 2007. [Google Scholar]
  3. Gardner, R.C.; Davidson, N.C. The ramsar convention. In Wetlands; Springer: Berlin, Germany, 2011; pp. 189–203. [Google Scholar]
  4. Adams, J.M.; Faure, H.; Faure-Denard, L.; McGlade, J.; Woodward, F. Increases in terrestrial carbon storage from the last glacial maximum to the present. Nature 1990, 348, 711–714. [Google Scholar] [CrossRef]
  5. Gorham, E. Northern peatlands: Role in the carbon cycle and probable responses to climatic warming. Ecol. Appl. 1991, 1, 182–195. [Google Scholar] [CrossRef]
  6. Mitra, S.; Wassmann, R.; Vlek, P.L. An appraisal of global wetland area and its organic carbon stock. Curr. Sci. 2005, 88, 25. [Google Scholar]
  7. Wuebbles, D.J.; Hayhoe, K. Atmospheric methane and global change. Earth Sci. Rev. 2002, 57, 177–210. [Google Scholar] [CrossRef]
  8. Kapoor, D. Sources and Sinks of Methane: Future Concentrations and Impact on Global Warming. Master’s Thesis, University of Pittsburgh, Pittsburgh, PA, USA, 2006. [Google Scholar]
  9. IPCC. Climate Change 2013: The Physical Science Basis. Contribution of Working Group i to the Fifth Assessment Report of the Intergovernmental Panel on Climate Change; Cambridge University Press: Cambridge, UK, 2013. [Google Scholar]
  10. Nisbet, E.G.; Dlugokencky, E.J.; Bousquet, P. Methane on the rise—Again. Science 2014, 343, 493–495. [Google Scholar] [CrossRef] [PubMed]
  11. Dlugokencky, E.J.; Nisbet, E.G.; Fisher, R.; Lowry, D. Global atmospheric methane: Budget, changes and dangers. Philo. Trans. R. Soc. A 2011, 369, 2058–2072. [Google Scholar] [CrossRef] [PubMed]
  12. Montzka, S.A.; Dlugokencky, E.J.; Butler, J.H. Non-CO2 greenhouse gases and climate change. Nature 2011, 476, 43–50. [Google Scholar] [CrossRef] [PubMed]
  13. Fung, I.; John, J.; Lerner, J.; Matthews, E.; Prather, M.; Steele, L.; Fraser, P. Three-dimensional model synthesis of the global methane cycle. J. Geophys. Res. 1991, 96, 13033–13065. [Google Scholar] [CrossRef]
  14. Hein, R.; Crutzen, P.J.; Heimann, M. An inverse modeling approach to investigate the global atmospheric methane cycle. Glob. Biogeochem. Cycles 1997, 11, 43–76. [Google Scholar] [CrossRef]
  15. Niu, Z.; Zhang, H.; Wang, X.; Yao, W.; Zhou, D.; Zhao, K.; Zhao, H.; Li, N.; Huang, H.; Li, C. Mapping wetland changes in China between 1978 and 2008. Chin. Sci. Bull. 2012, 57, 2813–2823. [Google Scholar] [CrossRef]
  16. Chen, H.; Zhu, Q.A.; Peng, C.; Wu, N.; Wang, Y.; Fang, X.; Jiang, H.; Xiang, W.; Chang, J.; Deng, X. Methane emissions from rice paddies natural wetlands, lakes in China: Synthesis new estimate. Glob. Chang. Biol. 2013, 19, 19–32. [Google Scholar] [CrossRef] [PubMed]
  17. Wei, D.; Tarchen, T.; Dai, D.; Wang, Y.; Wang, Y. Revisiting the role of CH4 emissions from alpine wetlands on the Tibetan Plateau: Evidence from two in situ measurements at 4758 and 4320 m above sea level. J. Geophys. Res. Biogeosci. 2015, 120, 1741–1750. [Google Scholar] [CrossRef]
  18. Jin, H.; Wu, J.; Cheng, G.; Nakano, T.; Sun, G. Methane emissions from wetlands on the Qinghai-Tibet Plateau. Chin. Sci. Bull. 1999, 44, 2282–2286. [Google Scholar] [CrossRef]
  19. Ding, W.; Cai, Z.; Wang, D. Preliminary budget of methane emissions from natural wetlands in China. Atmos. Environ. 2004, 38, 751–759. [Google Scholar] [CrossRef]
  20. Ding, W.X.; Cai, Z.C. Methane emission from natural wetlands in China: Summary of years 1995–2004 studies. Pedosphere 2007, 17, 475–486. [Google Scholar] [CrossRef]
  21. Chen, H.; Yao, S.; Wu, N.; Wang, Y.; Luo, P.; Tian, J.; Gao, Y.; Sun, G. Determinants influencing seasonal variations of methane emissions from alpine wetlands in Zoige Plateau and their implications. J. Geophys. Res. Atmos. 2008, 113, D12303. [Google Scholar] [CrossRef]
  22. Cao, M.; Woodward, F. Net primary and ecosystem production and carbon stocks of terrestrial ecosystems and their responses to climate change. Glob. Chang. Biol. 1998, 4, 185–198. [Google Scholar] [CrossRef]
  23. MacDonald, J.A.; Fowler, D.; Hargreaves, K.J.; Skiba, U.; Leith, I.D.; Murray, M.B. Methane emission rates from a northern wetland; response to temperature, water table and transport. Atmos. Environ. 1998, 32, 3219–3227. [Google Scholar]
  24. Ding, W.; Cai, Z.; Tsuruta, H.; Li, X. Effect of standing water depth on methane emissions from freshwater marshes in northeast China. Atmos. Environ. 2002, 36, 5149–5157. [Google Scholar] [CrossRef]
  25. Ballantyne, D.M.; Hribljan, J.A.; Pypker, T.G.; Chimner, R.A. Long-term water table manipulations alter peatland gaseous carbon fluxes in Northern Michigan. Wetl. Ecol. Manag. 2014, 22, 35–47. [Google Scholar] [CrossRef]
  26. Jorgenson, M.T.; Racine, C.H.; Walters, J.C.; Osterkamp, T.E. Permafrost degradation and ecological changes associated with a warming climate in central Alaska. Clim. Chang. 2001, 48, 551–579. [Google Scholar] [CrossRef]
  27. Wang, S.L.; Zhao, L.; LI, S.X.; Ji, G.L.; Xie, Y.Q.; Guo, D.X. Study on thermal balance of asphalt pavement and roadbed stability in permafrost regions of the Qinghai-Tibetan highway. J. Glaciol. Geocryol. 2001, 2, 111–118. (In Chinese) [Google Scholar]
  28. McGuire, A.; Sturm, M.; Chapin, F. Arctic transitions in the land-atmosphere system (ATLAS): Background, objectives, results, and future directions. J. Geophys. Res. Atmos. 2003. [Google Scholar] [CrossRef]
  29. Li, T.; Huang, Y.; Zhang, W.; Song, C. Ch4mod wetland: A biogeophysical model for simulating methane emissions from natural wetlands. Ecol. Model. 2010, 221, 666–680. [Google Scholar] [CrossRef]
  30. Huang, Y.; Sass, R.L.; Fisher, F.M., Jr. A semi-empirical model of methane emission from flooded rice paddy soils. Glob. Chang. Biol. 1998, 4, 247–268. [Google Scholar] [CrossRef]
  31. Huang, Y.; Zhang, W.; Zheng, X.; Li, J.; Yu, Y. Modeling methane emission from rice paddies with various agricultural practices. J. Geophys. Res. Atmos. 2004. [Google Scholar] [CrossRef]
  32. Li, T.; Huang, Y.; Zhang, W.; Yu, Y.-Q. Methane emissions associated with the conversion of marshland to cropland and climate change on the Sanjiang Plain of northeast China from 1950 to 2100. Biogeosciences 2012. [Google Scholar] [CrossRef]
  33. Ma, X.H.; Lu, X.G.; Yang, Q.; Yan, M.H. Carbon cycle of a marsh in Sanjiang Plain. Sci. Geogr. Sin. 1996, 16, 323–330. (In Chinese) [Google Scholar] [CrossRef]
  34. Tian, Y.B.; Xiong, M.B.; Xiong, X.S.; Song, G.Y. The organic carbon distribution and flow in wetland soil-plant system in Ruoergai Plateau. Acta Phytoecol. Sin. 2003, 27, 490–495. (In Chinese) [Google Scholar]
  35. Hirota, M.; Tang, Y.; Hu, Q.; Hirata, S.; Kato, T.; Mo, W.; Cao, G.; Mariko, S. Methane emissions from different vegetation zones in a Qinghai-Tibetan Plateau wetland. Soil Biol. Biochem. 2004, 36, 737–748. [Google Scholar] [CrossRef]
  36. State Soil Survey Service of China. China Soil Series, 6th ed.; China Agriculture Press: Beijing, China, 1994; pp. 518–519. (In Chinese) [Google Scholar]
  37. State Soil Survey Service of China. China Soil Series, 5th ed.; China Agriculture Press: Beijing, China, 1995; pp. 668–669. (In Chinese) [Google Scholar]
  38. Zhuang, Q.; Melillo, J.M.; Kicklighter, D.W.; Prinn, R.G.; McGuire, A.D.; Steudler, P.A.; Felzer, B.S.; Hu, S. Methane fluxes between terrestrial ecosystems and the atmosphere at northern high latitudes during the past century: A retrospective analysis with a process-based biogeochemistry model. Glob. Biogeochem. Cycles 2004. [Google Scholar] [CrossRef]
  39. Zhuang, Q.; He, J.; Lu, Y.; Ji, L.; Xiao, J.; Luo, T. Carbon dynamics of terrestrial ecosystems on the Tibetan Plateau during the 20th century: An analysis with a process-based biogeochemical model. Glob. Ecol. Biogeogr. 2010, 19, 649–662. [Google Scholar] [CrossRef]
  40. McGuire, A.D.; Melillo, J.; Joyce, L.; Kicklighter, D.; Grace, A.; Moore, B.; Vorosmarty, C. Interactions between carbon and nitrogen dynamics in estimating net primary productivity for potential vegetation in north america. Glob. Biogeochem. Cycles 1992, 6, 101–124. [Google Scholar] [CrossRef]
  41. Melillo, J.M.; McGuire, A.D.; Kicklighter, D.W.; Moore, B.; Vorosmarty, C.J.; Schloss, A.L. Global climate change and terrestrial net primary production. Nature 1993, 363, 234–240. [Google Scholar] [CrossRef]
  42. Cramer, W.; Kicklighter, D.; Bondeau, A.; Iii, B.M.; Churkina, G.; Nemry, B.; Ruimy, A.; Schloss, A.L. The participants of the potsdam NPP Model Intercomparison. Comparing global models of terrestrial net primary productivity (NPP): Overview and key results. Glob. Chang. Biol. 1999, 5, 1–15. [Google Scholar] [CrossRef]
  43. Letts, M.G.; Roulet, N.T.; Comer, N.T.; Skarupa, M.R.; Verseghy, D.L. Parametrization of peatland hydraulic properties for the canadian land surface scheme. Atmos. Ocean 2000, 38, 141–160. [Google Scholar] [CrossRef]
  44. Bohn, T.; Lettenmaier, D.; Sathulur, K.; Bowling, L.; Podest, E.; McDonald, K.; Friborg, T. Methane emissions from western Siberian wetlands: Heterogeneity and sensitivity to climate change. Environ. Res. Lett. 2007, 2, 045015. [Google Scholar] [CrossRef]
  45. Kleinen, T.; Brovkin, V.; Schuldt, R. A dynamic model of wetland extent and peat accumulation: Results for the holocene. Biogeosciences 2012, 9, 235–248. [Google Scholar] [CrossRef] [Green Version]
  46. Lu, X.; Zhuang, Q. Modeling methane emissions from the Alaskan Yukon river basin, 1986–2005, by coupling a large-scale hydrological model and a process-based methane model. J. Geophys. Res. Biogeosci. 2012, 117, G02010. [Google Scholar] [CrossRef]
  47. Zhu, X.; Zhuang, Q.; Gao, X.; Sokolov, A.; Schlosser, C.A. Pan-arctic land–atmospheric fluxes of methane and carbon dioxide in response to climate change over the 21st century. Environ. Res. Lett. 2013. [Google Scholar] [CrossRef]
  48. Wang, Y.; Wang, Y. Quick measurement of CH4, CO2 and N2O emissions from a short-plant ecosystem. Adv. Atmos. Sci. 2003, 20, 842–844. [Google Scholar]
  49. Wang, D.; Lv, X.; Ding, W.; Cai, Z.; Gao, J.; Yang, F. Methan emission from narshes in Zoige Plateau. Adv. Earth Sci. 2002, 17, 877–880. (In Chinese) [Google Scholar]
  50. Harris, I.; Jones, P.; Osborn, T.; Lister, D. Updated high-resolution grids of monthly climatic observations—The CRU TS3.10 Dataset. Int. J. Climatol. 2014, 34, 623–642. [Google Scholar] [CrossRef] [Green Version]
  51. FAO/IIASA/ISRIC/ISS-CAS/JRC. Harmonized World Soil Database, 1.2nd ed.; FAO and IIASA: Rome, Italy, 2012. [Google Scholar]
  52. Belward, A.S.; Estes, J.E.; Kline, K.D. The IGBP-DIS global 1-km land-cover data set discover: A project overview. Photogramm. Eng. Remote Sens. 1999, 65, 1013–1020. [Google Scholar]
  53. Loveland, T.; Reed, B.; Brown, J.; Ohlen, D.; Zhu, Z.; Yang, L.; Merchant, J. Development of a global land cover characteristics database and igbp discover from 1 km avhrr data. Int. J. Remote Sens. 2000, 21, 1303–1330. [Google Scholar] [CrossRef]
  54. Fan, Y.; van den Dool, H. Climate prediction center global monthly soil moisture data set at 0.5 resolution for 1948 to present. J. Geophys. Res. Atmos. 2004. [Google Scholar] [CrossRef]
  55. USGS. US Geological Survey: HYDRO1k Elevation Derivative Database; US Geological Survey Earth Resources Observation and Science (EROS) Center: Sioux Falls, SD, USA, 2000.
  56. FAO/IIASA/ISRIC/ISS-CAS/JRC. Harmonized World Soil Database, 1st ed.; FAO and IIASA: Rome, Italy, 2008. [Google Scholar]
  57. National Research Council (NRC). Wetlands: Characteristics and Boundaries; National Academy Press: Washington, DC, USA, 1995.
  58. An, S.; Li, H.; Guan, B.; Zhou, C.; Wang, Z.; Deng, Z.; Zhi, Y.; Liu, Y.; Xu, C.; Fang, S. China’s natural wetlands: Past problems, current status, and future challenges. AMBIO 2007, 36, 335–342. [Google Scholar] [CrossRef]
  59. Sargent, R.G. Verification and validation of simulation models. In Proceedings of the 37th Conference on Winter Simulation, Syracuse University, Syracuse, NY, USA, 8–11 December 2002.
  60. Jin, Z.; Zhuang, Q.; He, J.S.; Zhu, X.; Song, W. Net exchanges of methane and carbon dioxide on the Qinghai-Tibetan Plateau from 1979 to 2100. Environ. Res. Lett. 2015. [Google Scholar] [CrossRef]
  61. Boon, P.I.; Mitchell, A.; Lee, K. Effects of wetting and drying on methane emissions from ephemeral floodplain wetlands in South-Eastern Australia. Hydrobiologia 1997, 357, 73–87. [Google Scholar] [CrossRef]
  62. Xu, X.; Tian, H. Methane exchange between marshland and the atmosphere over China during 1949–2008. Glob. Biogeochem. Cycles 2012. [Google Scholar] [CrossRef]
  63. Zhu, X.; Zhuang, Q.; Chen, M.; Sirin, A.; Melillo, J.; Kicklighter, D.; Sokolov, A.; Song, L. Rising methane emissions in response to climate change in Northern Eurasia during the 21st century. Environ. Res. Lett. 2011. [Google Scholar] [CrossRef]
  64. Todd-Brown, K.; Randerson, J.; Post, W.; Hoffman, F.; Tarnocai, C.; Schuur, E.; Allison, S. Causes of variation in soil carbon simulations from CMIP5 earth system models and comparison with observations. Biogeosciences 2013. [Google Scholar] [CrossRef]
  65. Wieder, W.R.; Cleveland, C.C.; Smith, W.K.; Todd-Brown, K. Future productivity and carbon storage limited by terrestrial nutrient availability. Nat. Geosci. 2015, 8, 441–444. [Google Scholar] [CrossRef]
  66. Whiting, G.J.; Chanton, J.P. Primary productiong control of methane emission from wetlands. Nature 1993, 364, 794–795. [Google Scholar] [CrossRef]
  67. King, J.Y.; Reeburgh, W.S. A pulse-labeling experiment to determine the contribution of recent plant photosynthates to net methane emission in arctic wet sedge tundra. Soil Biol. Biochem. 2002, 34, 173–180. [Google Scholar] [CrossRef]
  68. Euliss, N.H.; Gleason, R.; Olness, A.; McDougal, R.; Murkin, H.; Robarts, R.; Bourbonniere, R.; Warner, B. North American prairie wetlands are important nonforested land-based carbon storage sites. Sci. Total Environ. 2006, 361, 179–188. [Google Scholar] [CrossRef] [PubMed]
  69. Lal, R.; Griffin, M.; Apt, J.; Lave, L.; Morgan, M.G. Managing soil carbon. Science 2004, 304, 393. [Google Scholar] [CrossRef] [PubMed]
  70. Maltby, E.; Immirzi, P. Carbon dynamics in peatlands and other wetland soils regional and global perspectives. Chemosphere 1993, 27, 999–1023. [Google Scholar] [CrossRef]
  71. Huang, Y.; Sun, W.; Zhang, W.; Yu, Y.; Su, Y.; Song, C. Marshland conversion to cropland in northeast China from 1950 to 2000 reduced the greenhouse effect. Glob. Chang. Biol. 2010, 16, 680–695. [Google Scholar] [CrossRef]
  72. Huttunen, J.T.; Nykänen, H.; Martikainen, P.J.; Nieminen, M. Fluxes of nitrous oxide and methane from drained peatlands following forest clear-felling in Southern Finland. Plant. Soil 2003, 255, 457–462. [Google Scholar] [CrossRef]
  73. Freeman, C.; Lock, M.A.; Reynolds, B. Fluxes of CO2, CH4 and N2O from a welsh peatland following simulation of water table draw-down: Potential feedback to climatic change. Biogeochemistry 1992, 19, 51–60. [Google Scholar] [CrossRef]
  74. Zhang, X.; Jiang, H. Spatial variations in methane emissions from natural wetlands in China. Int. J. Environ. Sci. Technol. 2014, 11, 77–86. [Google Scholar] [CrossRef]
  75. Wang, D. Emission fluxes of carbon dioxide, methane and nitrous oxide from peat marsh in Zoige Plateau. Wetl. Sci. 2010, 8, 220–224. (In Chinese) [Google Scholar]
  76. Papa, F.; Prigent, C.; Aires, F.; Jimenez, C.; Rossow, W.; Matthews, E. Interannual variability of surface water extent at the global scale, 1993–2004. J. Geophys. Res. Atmos. 2010, 115, D12111. [Google Scholar] [CrossRef]
  77. Liu, L.; Greaver, T.L. A review of nitrogen enrichment effects on three biogenic GHGs: The CO2 sink may be largely offset by stimulated N2O and CH4 emission. Ecol. Lett. 2009, 12, 1103–1117. [Google Scholar] [CrossRef] [PubMed]
  78. Gomez-Casanovas, N.; Hudiburg, T.W.; Bernacchi, C.J.; Parton, W.J.; DeLucia, E.H. Nitrogen deposition and greenhouse gas emissions from grasslands: Uncertainties and future directions. Glob. Chang. Biol. 2016, 22, 1348–1360. [Google Scholar] [CrossRef] [PubMed]
  79. LeBauer, D.S.; Treseder, K.K. Nitrogen limitation of net primary productivity in terrestrial ecosystems is globally distributed. Ecology 2008, 89, 371–379. [Google Scholar] [CrossRef] [PubMed]
  80. Berg, B.; Laskowski, R. Litter decomposition: A guide to carbon and nutrient turnover. Adv. Ecol. Res. 2004, 38, 1–421. [Google Scholar]
  81. Le Mer, J.; Roger, P. Production, oxidation, emission and consumption of methane by soils: A review. Eur. J. Soil Biol. 2001, 37, 25–50. [Google Scholar] [CrossRef]
  82. Bodelier, P.L.; Laanbroek, H.J. Nitrogen as a regulatory factor of methane oxidation in soils and sediments. FEMS Microbiol. Ecol. 2004, 47, 265–277. [Google Scholar] [CrossRef]
  83. Liu, X.; Zhang, Y.; Han, W.; Tang, A.; Shen, J.; Cui, Z.; Vitousek, P.; Erisman, J.W.; Goulding, K.; Christie, P.; et al. Enhanced nitrogen deposition over China. Nature 2013, 494, 459–462. [Google Scholar] [CrossRef] [PubMed]
  84. Prigent, C.; Papa, F.; Aires, F.; Rossow, W.; Matthews, E. Global inundation dynamics inferred from multiple satellite observations, 1993–2000. J. Geophys. Res. Atmos. 2007, 112, D12107. [Google Scholar] [CrossRef]
  85. Schroeder, R.; Rawlins, M.A.; McDonald, K.C.; Podest, E.; Zimmermann, R.; Kueppers, M. Satellite microwave remote sensing of north Eurasian inundation dynamics: Development of coarse-resolution products and comparison with high-resolution synthetic aperture radar data. Environ. Res. Lett. 2010. [Google Scholar] [CrossRef]
  86. Lehner, B.; Döll, P. Development and validation of a global database of lakes, reservoirs and wetlands. J. Hydrol. 2004, 296, 1–22. [Google Scholar] [CrossRef]
  87. Bergamaschi, P.; Frankenberg, C.; Meirink, J.; Krol, M.; Dentener, F.; Wagner, T.; Platt, U.; Kaplan, J.; Körner, S.; Heimann, M. Satellite chartography of atmospheric methane from sciamachy on board Envisat: 2. Evaluation based on inverse model simulations. J. Geophys. Res. Atmos. 2007, 112, D2. [Google Scholar] [CrossRef]
  88. Melton, J.; Wania, R.; Hodson, E.; Poulter, B.; Ringeval, B.; Spahni, R.; Bohn, T.; Avis, C.; Beerling, D.; Chen, G. Present state of global wetland extent and wetland methane modelling: Conclusions from a model intercomparison project (WETCHIMP). Biogeosciences 2013, 10, 753–788. [Google Scholar] [CrossRef]
  89. Zhu, P.; Gong, P. Suitability mapping of global wetland areas and validation with remotely sensed data. Sci. China Earth Sci. 2014, 57, 2283–2292. [Google Scholar] [CrossRef]
  90. Zhang, Z.; Zimmermann, N.E.; Kaplan, J.O.; Poulter, B. Modeling spatiotemporal dynamics of global wetlands: Comprehensive evaluation of a new sub-grid topmodel parameterization and uncertainties. Biogeosciences 2016, 13, 1387–1408. [Google Scholar] [CrossRef]
  91. Wania, R.; Melton, J.; Hodson, E.; Poulter, B.; Ringeval, B.; Spahni, R.; Bohn, T.; Avis, C.; Chen, G.; Eliseev, A. Present state of global wetland extent and wetland methane modelling: Methodology of a model inter-comparison project (WETCHIMP). Geosci. Model. Dev. 2013, 6, 617–641. [Google Scholar] [CrossRef]
  92. IPCC. Climate Change 2014, Impacts, Adaptation, and Vulnerability Summaries, Frequently Asked Questions, and Cross-Chapter Boxes. A Contribution of Working Group ii to the Fifth Assessment Report of the Intergovernmental Panel on Climate Change; World Meteorological Organization: Geneva, Switzerland, 2014. [Google Scholar]
  93. Moss, R.H.; Edmonds, J.A.; Hibbard, K.A.; Manning, M.R.; Rose, S.K.; Van Vuuren, D.P.; Carter, T.R.; Emori, S.; Kainuma, M.; Kram, T. The next generation of scenarios for climate change research and assessment. Nature 2010, 463, 747–756. [Google Scholar] [CrossRef] [PubMed]
  94. Ji, Z.; Kang, S. Double-nested dynamical downscaling experiments over the Tibetan plateau and their projection of climate change under two RCP scenarios. J. Atmos. Sci. 2013, 70, 1278–1290. [Google Scholar] [CrossRef]
  95. Editoral Committee. China Wetlands Encyclopedia; Beijing Science and Technology Press: Beijing, China, 2009. [Google Scholar]
Figure 1. The distribution of natural wetlands across the Tibetan Plateau (data from Niu et al., 2012 [15]) and location of the study sites.
Atmosphere 07 00090 g001
Figure 2. Simulated and observed seasonal variations of CH4 emissions and the observed air temperatures and water table depths. (a), (b), (c) and and (d) are the CH4 emissions from the Zoige CME site, the Zoige CMU site, the Haibei CAL site and the Haibei HVU site; (e), (f), (g) and (h) are the air temperatures and water table depths from the Zoige CME site, the Zoige CMU site, the Haibei CAL site and the Haibei HVU site.
Atmosphere 07 00090 g002
Figure 3. Comparison of observed and simulated CH4 fluxes.
Atmosphere 07 00090 g003
Figure 4. Temporal variations of (a) simulated decadal mean CH4 fluxes, (b) decadal mean wetland area and regional CH4, (c) decadal mean air temperature, (d) decadal mean precipitation. Boxplots show the median, average values, and interquartile range, with whiskers extending to the most extreme data point within 1.5 × (75% – 25%) data range. Triangles represent the decadal mean wetland area.
Atmosphere 07 00090 g004
Figure 5. Regression between annual mean CH4 fluxes and (a) air temperature and (b) annual precipitation.
Atmosphere 07 00090 g005
Figure 6. Spatial variations of CH4 fluxes and regional CH4 emissions. (a) CH4 fluxes in 1950s; (b) CH4 fluxes in 2000s; (c) CH4 fluxes of 2000s minus 1950s; (d) regional CH4 emissions in 1950s; (e) regional CH4 emissions in 2000s; (f) regional CH4 emissions of 2000s minus 1950s.
Atmosphere 07 00090 g006
Table 1. Site-specific parameters and model inputs of CH4MODwetland.
Parameters/INPUTS (unit)DescriptionValuesReferences
RuoergaiHaibei
VI (dimensionless) ^Vegetation index2.42.8[29]
froot (dimensionless) ^Proportion of below-ground to the total production0.50.5[33]
Pox (dimensionless) ^The fraction of CH4 oxidized during plant mediated transport0.50.5[29]
Tveg (dimensionless) ^The fraction of plant mediated transport was available11[29]
ANPP (g m−2 year−1) *Aboveground net primary productivity340 a, 290 b380 c, 397 d[34,35]
SAND (%) *Soil sand fraction66.050[36,37]
SOM (g kg−1) *Concentration of soil organic matter52016.8
ρ (g cm−3) *Soil bulk density0.751.73
^ Model parameters; * Model inputs; a For the Carex meyeriana site (CME); b For the Carex muliensis site (CMU); c For the Carex allivescers site (CAL); d For the Hippuris vulgaris site (HVU).
Table 2. Model performance on the study sites.
SiteObserved Seasonal CH4 (g m−2 season−1)Simulated Seasonal CH4
(g m−2 season−1)
RMSE (%)RMD (%)EF^ Dimensionless
Zoige11.312.253.8−2.50.29
Haibei16.012.630.6−5.40.05
All13.612.447.4−3.40.52
^ Model efficiency.
Table 3. Regional CH4 estimations from wetlands in the Tibetan Plateau after 1990.
MethodPeriodArea (M ha)CH4 (Tg)Source
Site specific extrapolation1996–199718.800.70–0.90[18]
Site specific extrapolation2001–20025.520.56[19]
Site specific extrapolation2000Nm #1.25[16]
Site specific extrapolation2012–20146.320.22–0.41[17]
Meta-Analysis1990–20103.761.04[74]
Model 2001–201113.400.95[60]
Model20083.200.06[62]
Model2000–20103.330.22This study
# Nm means not mentioned in the reference.

