Abstract
The aim of this study is to understand the inter-annual hydrological variability (precipitation and streamflow) in the basins of the High Atlas in Morocco and to determine how climate fluctuations (represented by the North Atlantic Oscillation (NAO) climate index) are expressed in the hydrological system. To reach this objective, time series of precipitation and streamflow are processed as standardized anomalies and studied by continuous wavelet analysis and wavelet coherence analysis, which are particularly suitable for the study of unsteady processes. Wet and dry periods vary from one basin to another between three and five years. The wavelet analysis shows the existence of many bands of energy in most of the sub-basins, from annual to inter-annual scales regarding the precipitation and streamflow time series. These bands correspond to intervals of one year, 2–4 years, 4–8 years and 8–12 years. The wavelet coherence analysis shows a strong coherence between NAO/streamflow and precipitation/NAO identified at the inter-annual scale. Non-stationarity can be observed in the late 1980s, 1990s and 2000s. The contribution of the NAO is different from one basin to another ranging between 67% and 77%.
1. Introduction
In recent studies such as the IPCC report [1] (Intergovernmental Panel on Climate Change), the term climate change refers to any change in climate parameters in time and space (local, regional and global).
Improving knowledge on the factors controlling water resources variability on inter-annual to multidecadal time scales is of major importance in a context of global climate and environmental change. This may help to explain observed hydro meteorological/hydrological events such as sea level rise and desertification [2], floods, exceptional storms and sustained droughts [2,3,4].
Hydrological cycles are influenced by fluctuations in global climate at different time scales. For example, the El Niño-Southern Oscillation (ENSO) is a sea-surface temperature fluctuation observed over the tropical Pacific Ocean that impacts precipitation in many locations around the globe, from South America to Africa, Australia and North America [5]. Labat et al. [6] performed a cross-wavelet analysis on a monthly and seasonal basis through various climatic indices over the Maroni River. They confirmed a strong relationship between the hydrology of the Guyana shelf and the variations of sea surface temperatures in the Pacific. This finding has led to evidence the influence of intermittent surface temperatures of the Atlantic Ocean on interannual and decadal time scales, especially around the years 1970 and 1990.
The North Atlantic Oscillation (NAO), which is related to atmospheric pressure over the North Atlantic Ocean, exerts a considerable influence on the hydroclimatology of Europe and North America [3,7,8,9]. The NAO is considered to be the dominant metric of the winter atmospheric variability in the Northern hemisphere [10]. The prediction of drought can potentially be estimated by information derived from climate indices such as the NAO [11].
The same index was also used to investigate the climate fluctuations in USA [12], Europe [13,14] and Mediterranean basin [15]. Various studies were conducted to exhibit the relationships between climatic fluctuations and hydrological variability. Massei et al. [16] studied the temporal variability of streamflow in the Mississippi River basin (USA) using continuous wavelet methods to detect changes over the past 60-years. They identified dominant modes of streamflow variability over the inter-annual and pluri-annual periods in the ranges 2–4-year, 4–8-year and 10–16-year, which they related to climatic fluctuations of the Southern Oscillation Index (SOI). Laignel et al. [15] studied the long-term variability of hydrological conditions and relationships with the internal variability of the climate system in the North Atlantic basin (North western France, North Africa, and the USA). Two main discontinuities occurred in the 1970s and 1990s which might be related to global-scale teleconnections. The high modes of variability are correlated with the NAO in the Northwest region of France and North Africa and also with the SOI in the USA.
Since the early 1980s, the southern Mediterranean region has experienced series of dry years [1]. These droughts actually affect the entire Northern Hemisphere [17] and result from a disruption of the ocean-atmosphere system. The southern and eastern Mediterranean countries are particularly vulnerable to climate change because they are exposed to accelerated desertification and aridity of the soil as well as increasing scarcity of water resources in a context of increasing population and water demand. In addition, these areas have limited technical and financial capacities for implementing large-scale adaptation options [18] and their economic structures depend more heavily on natural resources.
The Mediterranean coasts receive more precipitation during wintertime when extratropical synoptic disturbances cross the region. Knippertz et al. [19] explained that frontal winter rains regularly affect the northern and western parts of Morocco and the Algerian coast and usually do not reach the Southern side of the Atlas Mountains. The contribution of the summer rains is not negligible: it helps to sustain the water supply in the oases in northern Mauritania, southern Morocco and western Algeria. The hydrological variability in Africa has been studied by numerous authors since the beginning of the recent drought period in the 1970s. Many studies focused on the Sahelian areas [20,21,22,23,24,25,26,27,28,29,30]. Authors also compared the rainfall on the Sahelian and other African regions, especially in West Africa and also in Central Africa [31,32,33,34,35,36,37,38]. Other researchers used standardized anomalies of hydrological time series in North Africa [4,39].
Morocco is currently experiencing the longest dry period of its modern history, characterized by a decrease in precipitation and a clear trend of rising temperatures [4,40]. Beven et al. [41] identified a correlation between NAO and precipitation during drought in Morocco in 1979 and 1980. During the period 1961–2004 the frequency and severity of drought significantly increased. This phenomenon accompanied with the climate warming cause different troubles for various socio-economic sectors. The complexity of the impacts is due to the non-similarity of sectors using water for the production of goods and services [42].
The climate of the Tensift Haouz region (study area) is semi-arid continental, characterized by seasonal rains often concentrated in the autumn and winter periods with irregular precipitations during the rest of the year, and also by droughts which take a considerable extent, especially in lowland areas where temperature and evaporation are high.
The frequency analysis by the continuous wavelet method is not largely used to study the hydrological variability in the North Africa; Turki et al. [43] investigate only the rainfall variability in Marrakesh. In this study, the variability of rainfall from gauges and grids as well as the streamflow has been investigated over a long period of time and along large spatial scales important to identify similarities and differences between stations in the watershed of Tensift and Ksob. Most of the studied stations are located in the High Atlas.
Thus, the objective of this work is to explore the hydrologic variability over a specific area located in the South of Morocco and controlled by two River basins: the largest one is the Tensift basin and its sub-basins and the smallest one situated near to the sea which is the Ksob basin. The study area is particularly interesting due to the convergence of three climatic influences over the area: the Atlantic mild-humid oceanic cyclonic circulation, the Mediterranean semi-arid climate with seasonal extreme rainfall and the Sahara warm climate with arid South-winds fluxes. In these conditions, the study of the possible links between climate fluctuations (NAO) and the hydrological variability of rainfall and streamflow (several stations, gridded rainfall) using in both cases standardized variables and the wavelet analysis is very important to understand the origin of this variability.
The variability of rainfall and streamflow in the Tensift and Ksob basins is primarily analyzed through standardized annual time series. The method of continuous wavelet is then applied on monthly basis to identify dry and wet periods. Finally, we study the correlations between rainfall, streamflow and NAO signals.
2. Study Area
Located in West-central of Morocco, the Tensift (Figure 1) drains a catchment area with an area of 20,450 km2. It is limited in the South by the ridge line the High Atlas mountain, altitudes range from 0 to 4167 m represented by Jebel Toubkal, in the North by the small mountain named “Jebilet” with altitudes below 1000 m, in the east by the watershed line, slightly marked, separating the Tensift basin from that of the Tessaout and on the West by the Atlantic Ocean where the outlet is located.
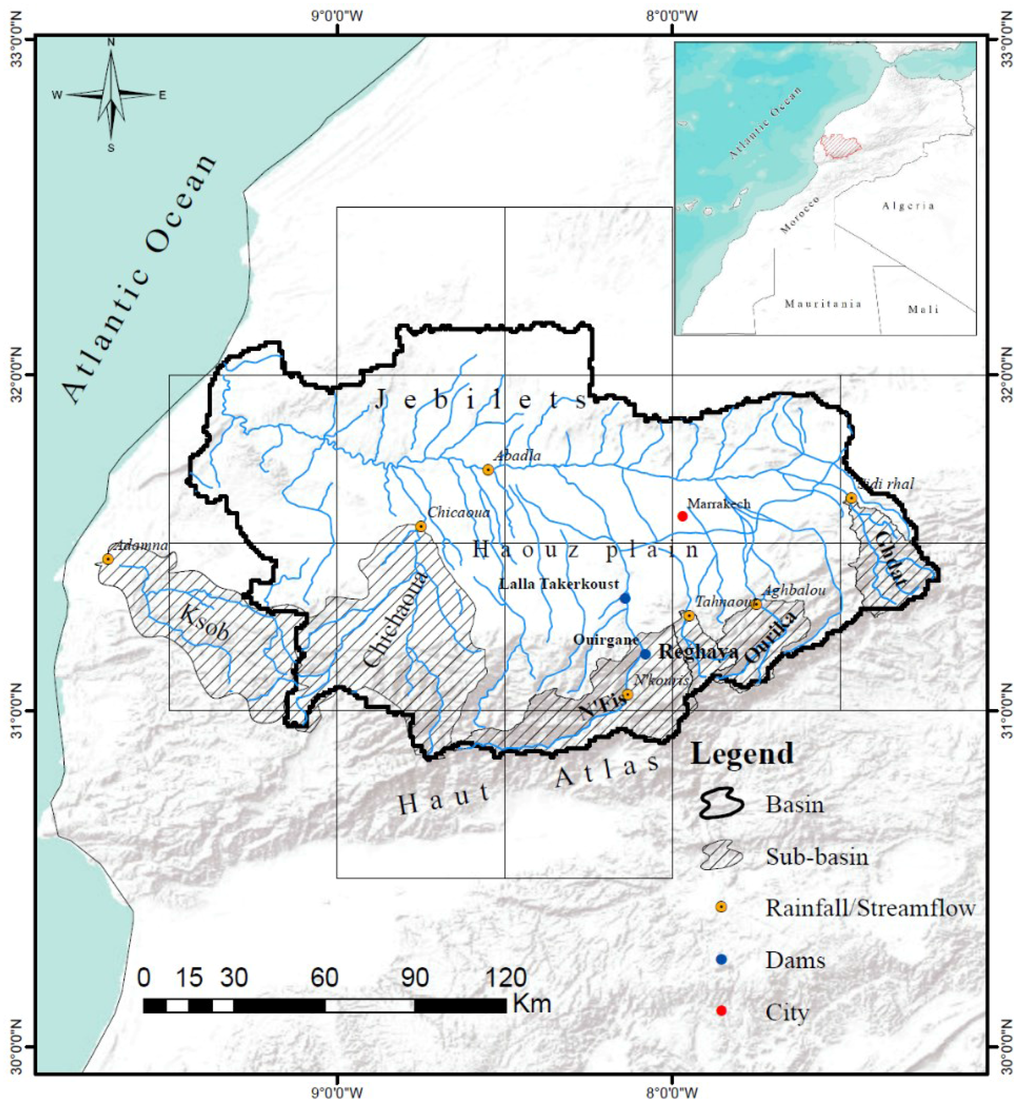
Figure 1.
Location of the Ksob basin and Tensift sub-basins.
The Ksob watershed is localized on Atlantic coast of Morocco, southeast of Essaouira city, it constitutes the western end of the High Atlas range, and extends over an area of 1480 km2 (Figure 1). The Ksob River results from the junction of Igrounzar and Zelten rivers, upstream of the Zerrar canyon about 29 km from the Atlantic Ocean.
The southern part of the Tensift basin consists in a series of sub-basins, divided into five parts: the first one (1317 km2) is drained by the Chichaoua River, the second (1282 km2) by the N’fis River, the third (225 km2) by the Rheraya River, the fourth (503 km2) by Ourika River and the last basin (452 km2) is seeped by R’dat River, flowing from the South to the North of the high Atlas towards the Tensift river in the Haouz plain (Figure 1) and discharges into the Atlantic ocean. The analysis of the physiography and geomorphology of each sub-basin is an element to understand the hydrological functioning. These characteristics are of major importance because they strongly influence the hydrological response including the flow regime during floods or droughts. The main physiographic features of each sub-basin are described in Table 1 [44,45].

Table 1.
Description of the main physiographic features of each sub-basin.
The climate of the Tensift basin is influenced by the cold Canary Current in the coastal zone and in the High Atlas. Climate ranges from semi-arid/warm in the Jebilets to continental/arid in the Haouz and Mejjate plains. Precipitation is low and characterized by a high spatial and temporal variability. The mean annual rainfall is low, on the order of 250 mm in Marrakech and can reach 700 mm on the summits of the Atlas.
Examining the average monthly rainfall distribution shows that there are two seasons: a humid season from October to April, which involved almost all the rainfall events, nearly 85% to 95% of the annual rainfall; and a dry season from May to September with only 5% to 15% of the annual rainfall. The temperature variations are quite significant between winter and summer: 45 °C as maximum temperature and 5 °C as the minimum temperature.
The Ksob basin is located in a semi-arid to arid zone, characterized by interferences between oceanic, continental and mountain influences [46,47,48]. The annual rainfall average is around 300 mm per year, identical to the Tensift basin. The annual average temperature is around 20 °C. The temperature difference between the warmest month (July) and the coldest month (January) does not exceed 6 °C; but the daily range is larger, up to 10 to 12 °C.
Dams have major potential impacts on hydrological and ecological systems that can change the “natural” rhythm of the hydrological cycle. Water losses due to evaporation, combined with large losses induced by consumption, reduce the total amount of water delivered to the water systems. On some rivers, dams have changed sedimentary flows, or reduced the frequency and intensity of floods [49]. There are only two dams on the Tensift basin, both built on the N’fis River. The largest one (Lalla Takerkoust, Figure 1) is built downstream of the gauging station and the smallest one (Ouirgane) has been built only recently after the end of our time series. They have no influence on the results.
3. Data and Methods
3.1. Data
The data used for this study is mainly precipitation, streamflow and the climate index NAO. The duration of these series is variable between 30 and 45 years.
Both precipitation and streamflow data were obtained from ABHT (Agency of the Hydraulic Basin of Tensift and Haouz). Rainfall measurements are carried out through the rain gauges located on the basin. The monthly time series of runoff are calculated from the values of water high and calibration curves, both are measured at the same gauging stations by the ABHT.
To study climate and hydrological variability in the Tensift basin, we analyzed data from 7 stations: (1) Aghbalou in the Ourika sub-basin; (2) Tahanouat in the Rheraya sub-basin; (3) Iguir N’Kouris in the N’Fis sub-basin, the largest sub-basin in the Tensift; (4) Sidi Rehal in the R’dat sub-basin; (5) Chichaoua in the Chichaoua sub-basin; (6) Abadla in the Tensift River; and (7) Adamna in the Ksob basin. Located at the base of the High Atlas Mountain, except for the N’fis, the measuring station is located away from the downstream of sub-basin and Abadla located in the Tensift, the principal river (Haouz plain).
The data must meet two important criteria: the length of the Chronicles (cover the greatest possible duration) and the quality of data (the fewest missing data).
We also used rainfall gridded data to compare with the data from the gauging stations of the ABHT. These gridded data come from the SIEREM (System of environmental information for the water resources and their modeling) dataset, developed at the HydroSciences Montpellier laboratory [50,51]. These data are available at the monthly time scale, over the duration 1940–1999, and at the half-square degree scale. The interpolation method used to prepare this dataset is the kriging method [52] from observed values. For each time step, it has no correlation with a grid of reference on average over a reference period. All the available values each month are used to construct each grid.
The availability of data depends on the regional hydrological agency and the national meteorological direction. From the data received, the time series of streamflow and rainfall start before 1970 in Rdat sub-basin and after the 1970s in the Ourika (rainfall and streamflow) and Rheraya (streamflow) sub-basins, even if hydrological and climatic variability were identified in the 1970s on Rdat, Ourika sub-basins and Tensift River.
The monthly NAO index used in this study corresponds to the normalized winter sea-level pressure difference between Portugal and Reykjavik.
The duration for which this index is available extends from 1864 to 2011.
We also used rainfall gridded data to compare with the data from the gauging stations of the ABHT.
3.2. Methods
To study the hydrological variability in the Tensift basin, we work with the standardized anomalies [53] to identify alternating dry and wet periods (Figure 2).
where
- : Rainfall/streamflow for a given year;
- : Average rainfall/streamflow for interannual period; and
- S: Standard deviation of rainfall/streamflow for interannual period.
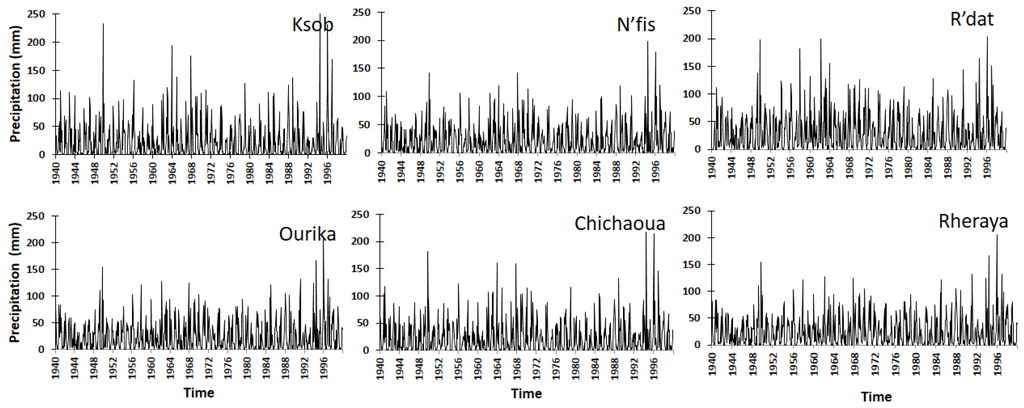
Figure 2.
Rainfall variability at the Ksob basin and Tensift sub-basins.
Contrary to the other methods, wavelet analysis has often been used for hydrological variability of major world rivers [54,55,56].
Many wavelets are available for continuous wavelet analysis (the Morlet, Paul and derivative of Gaussian (DOG) being among the most usual); here we chose the Morlet wavelet, consisting of a Gaussian-modulated sine, which basically has a rather high frequency resolution. The wavenumber of the mother wavelet controls its basic frequency resolution: the higher the wave number, the more rapid the oscillation of the wavelet, and the higher the frequency resolution. The wavenumber used here was six for all spectra.
The continuous wavelet method (WCT) is used to analyze and quantify each temporal feature of the main spectral components in the time series. The wavelet transformation is used to follow the time course of the process at different scales in the signal [57]. It has been used for numerous studies in geosciences (e.g., [13,58,59]). In particular, applications of wavelets to discharge time series allow describing signals of climatic oscillation [14,16,60,61].
The signal is correlated with a set of “daughter wavelets”, which are obtained by translation and dilation of a reference (the so-called “mother”) wavelet:
where a is scale parameter (dilation of the filter) and b a time-localization parameter. The continuous wavelet transforms of a signal (S(t)) produces a wavelet spectrum and is defined by:
The wavelet transform corresponds to the filtering of a signal by a band pass filter, which corresponds to a wavelet basis. Dilated versions of the mother wavelet (i.e., daughter wavelets corresponding to each value taken by parameter a) are generally used for investigating the spectral content of the signal at any time, while at each scale the translation of the wavelet (parameter b) gives access to the spectral content at the corresponding time. Higher variation (large wavelengths) in the signal can be detected by larger daughter wavelets while smaller ones define smaller variations (short wavelengths). The CWT produces a time-scale (that can also be represented as a time-period or a time-frequency diagram) showing the distribution of the spectral content (power, z-axis) across time (x-axis) and at different scale (or period or frequency, y-axis).
In all the following continuous wavelet spectra, the color scale used represents increasing power (variance) from blue to dark red. The continuous wavelet spectrum of the time series highlights the existence of several modes of variability in the form of energy bands covering certain ranges of frequencies.
The coherence is analyzed to determine the correlation between the hydrological variability and climatic parameters [62].
Here, CWT has been used in two modes: (1) univariate mode aims to identify the main variability modes of signals; and (2) bivariate mode for wavelet coherence with the objective of comparing the spectral structuration of signals:
WCn corresponds to the wavelet coherence, Wn is the wavelet and S is the signal. X and Y correspond to two variables studied. The wavelet phases are also plotted to show the amount of delay between both signals [63]. The values of the phase diagram are contained between −π and π. For a zero phase difference, the two variables are in phase. For a π or −π phase difference, the two variables are out of phase (opposite phase) at the corresponding scale in relation with the edges of the influence cone.
The criterion of subdivision used here is the loss of energy that is detected from the extracted and reconstructed signal in the time domain by either inverse Fourier or wavelet transform of selected bands in the spectrum.
Discontinuities are identified by a loss of energy; physical causes of the discontinuities are not yet understood. However, according to [55], this abrupt change is explained by a change in climate patterns, mainly controlled by NAO in this case of study.
4. Results: Determination of the Hydrological Variability of the Tensift
From the SIEREM data (1940–1999), we present rainfall variability for each sub-basin of the Tensift River and Ksob basin (Figure 2). This variability is higher at the end of the 1940s and 1990s. We deduce also that the rainfall variability in Ourika and Rheraya sub-basins is similar due to the fact that the two sub-basins have a small area and share the same rainfall grid-cells.
4.1. Hydrological Variability from the Standardized Variables
4.1.1. Rainfall
Standardized annual rainfall during the period between 1970 and 2010 displayed five distinct periods in Tensift River and its two sub-basins (N’Fis and R’dat) and also Ksob basin, four periods in the Chichaoua and Rheraya sub-basins, and three periods in the Ourika sub-basin (Figure 3).
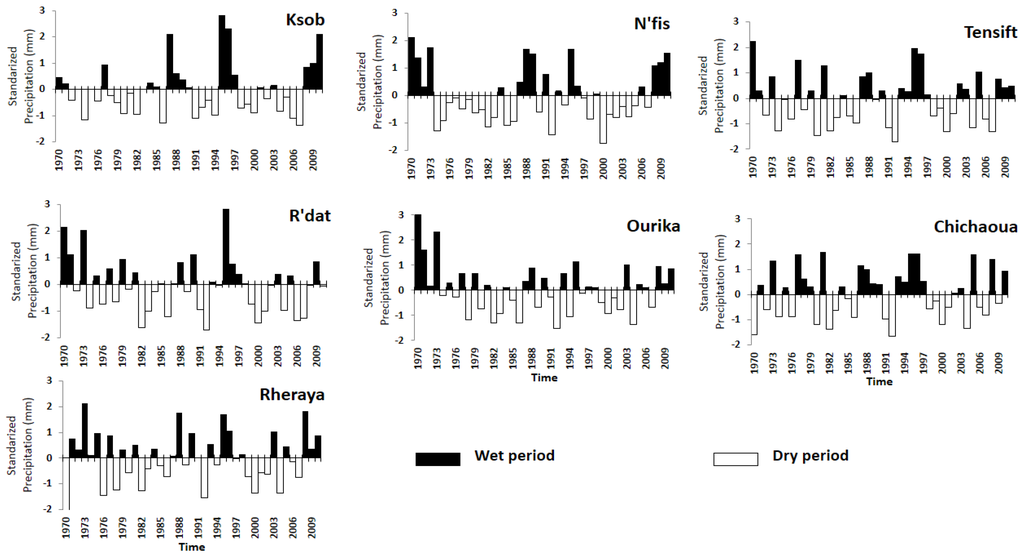
Figure 3.
Standardized annual rainfall anomalies in Ksob basin and Tensift sub-basins, between 1970 and 2011.
For the first group of basins (Tensift, Ksob, N’fis and R’dat), the initial period (1970–1973) was wet. The second one (1974–1987) was generally dry with few years wetter than the average. The third period (1987–1997) was characterized by a succession of humid years interrupted by periods of deficit varying from 2–4 years. The fourth period (1997–2007) was distinguished by dry years similar to those observed in the first period. After 2007, the area knew another wet period.
In the Chichaoua sub-basin, there was a succession of dry and wet years constituting four periods from 1970 to 1982, followed by a short dry period from 1982 to 1987, then a wet period from 1987 until 1998 and lastly fluctuations between wet and dry years from 1998 to 2011. In the Rheraya sub-basin, there was a wet period from 1970 to 1977, followed by a cycle of high variability displaying wet and dry years from 1977 to 1997, a dry period from 1997 to 2007 and wet years from 2007 onward.
The Ourika sub-basin experienced a succession of wet and dry years between 1974 and 2007 where two humid periods are identified before 1974 and after 2007, forming three cycles.
4.1.2. Streamflow
Standardized streamflow from 1970 to 2010 are presented in Figure 4. The selected weather calendar for the streamflow and rainfall studied series has no influence on the results obtained. They are identical. For the Tensift, Ksob, R’dat, Rheraya, and Ourika basins, similar patterns were observed. The duration 1970–1973 was characterized by high runoff level. Low streamflow generally occurred during the period 1974–1986. The duration between 1987 and 1997 was characterized by a succession of high streamflow years interrupted by periods of deficit varying from 2–4 years. The period 1997–2009 was generally marked by a succession of dry years similar to those observed in the second period, although some streamflow were above the average over the duration 2007–2009. Like the other sub-basins, N’fis and Chichaoua present above-average streamflow from 1986 to 1997, interrupted by deficits of 1–3 years, followed by dry years from 1997 to 2009.
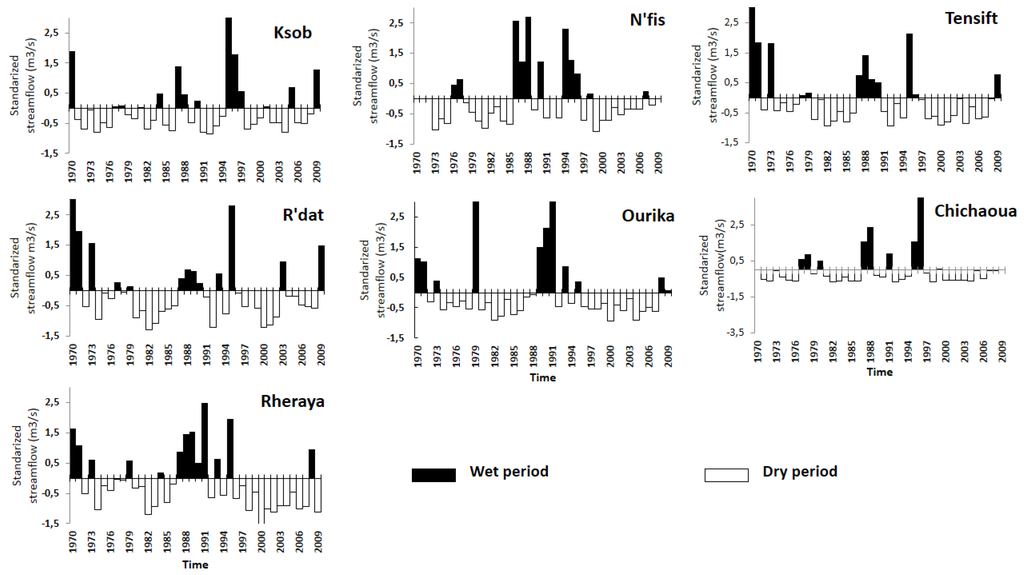
Figure 4.
Standardized annual streamflow anomalies in Ksob basin and Tensift sub-basins between 1970 and 2011.
However, neither N’fis nor Chichaoua sub-basins have above-average streamflow in the early 1970s, and both present several years of above-average streamflow in the late 1970s.
Variation in SIEREM interannual rainfall in the Ksob basin and in each sub-basin of the Tensift River are characterized by an alternation of wet and dry years. The dry period is distinguished from 1943 to 1961, encompassing some wet years. This dry period is shorter in the Sub-basin of the Ourika and R’dat ranging, respectively, between 1949 and 1953. A slightly wet period comes after 1962 to 1972 all over the basin, followed by a dry cycle, interrupted by lightly humid years identified in 1976 and 1982. In the Ourika sub-basin, the second period is described by an alternation of wet and dry years from 1950–1999, followed by a long dry period during the rest of the calendar interrupted by a few wet years (Figure 5).
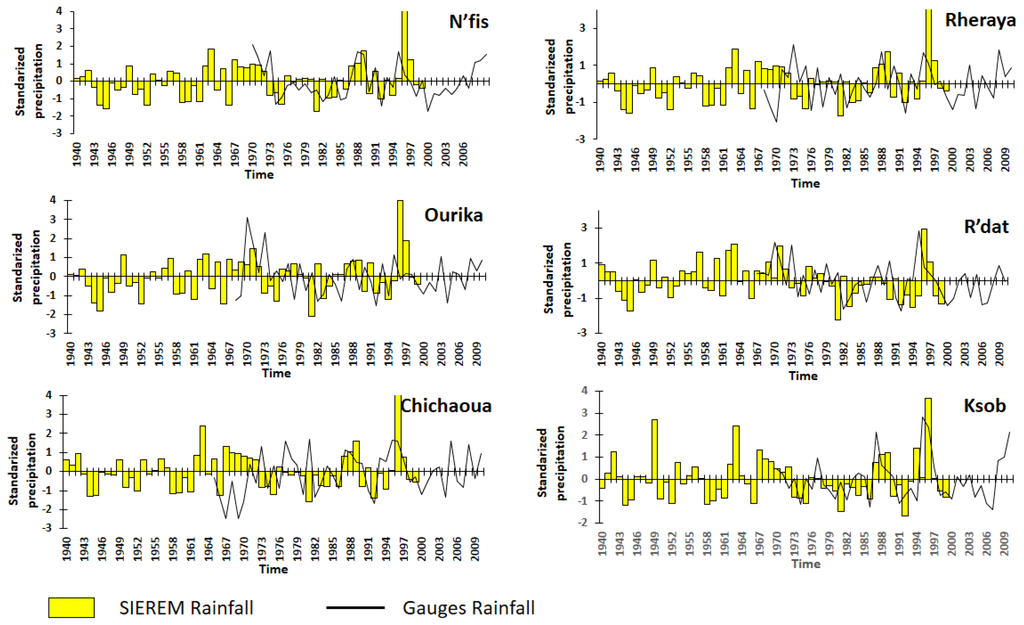
Figure 5.
Interannual evolution of rainfall (SIEREM and gauging station) at the sub-basins of Tensift.
At N’fis, rainfall SIEREM and hydrological stations have the same trend over the whole period; however, in Rheraya, they progress differently. In Ourika, this variability is different during some years, namely in 1973, 1978, 1986, 1993 and 1996. Regarding the sub-basins R’dat and Chichaoua, the comparable variables exhibit different variability during the periods ranging, respectively, from 1986–1990 and 1976–1980; however, this pattern is similar in Chichaoua during the rest of the time series displaying some short duration difference. In the Ksob basin, rainfall SIEREM and the studied stations have the same variability, except in 1977 and 1984–1986 where the trend is different.
4.2. Hydrological Variability from the Wavelet Analysis
Rainfall
The Wavelet analysis of data precipitation shows several energy bands from the annual to interannual scales (2–3 year and 8–12 year) (Figure 6) (Table 2). In the Tensift River and the sub-basins, a frequency of one year is more identified. The 2–3 year band was only detected in the Ourika and the R’dat sub-basins for the first half of the 1970s and in the N’fis sub-basin for the first half of the 1990s. The eight-year band is observed in the Tensift River, Ksob, Chichaoua and N’fis sub-basins during the 1990s. The Ksob and N'fis basins are characterized by discontinuities during the mid-1980s and 2000s. For the Tensift River and Chichaoua, these discontinuities are observed in 1990 and 2000, which delimit three periods. Regarding the R’dat and Ourika basins, we find four periods according to the discontinuities in 1970, 1990 and 2000, while, in the Rheraya, we identify only two periods around a discontinuity in 2000.
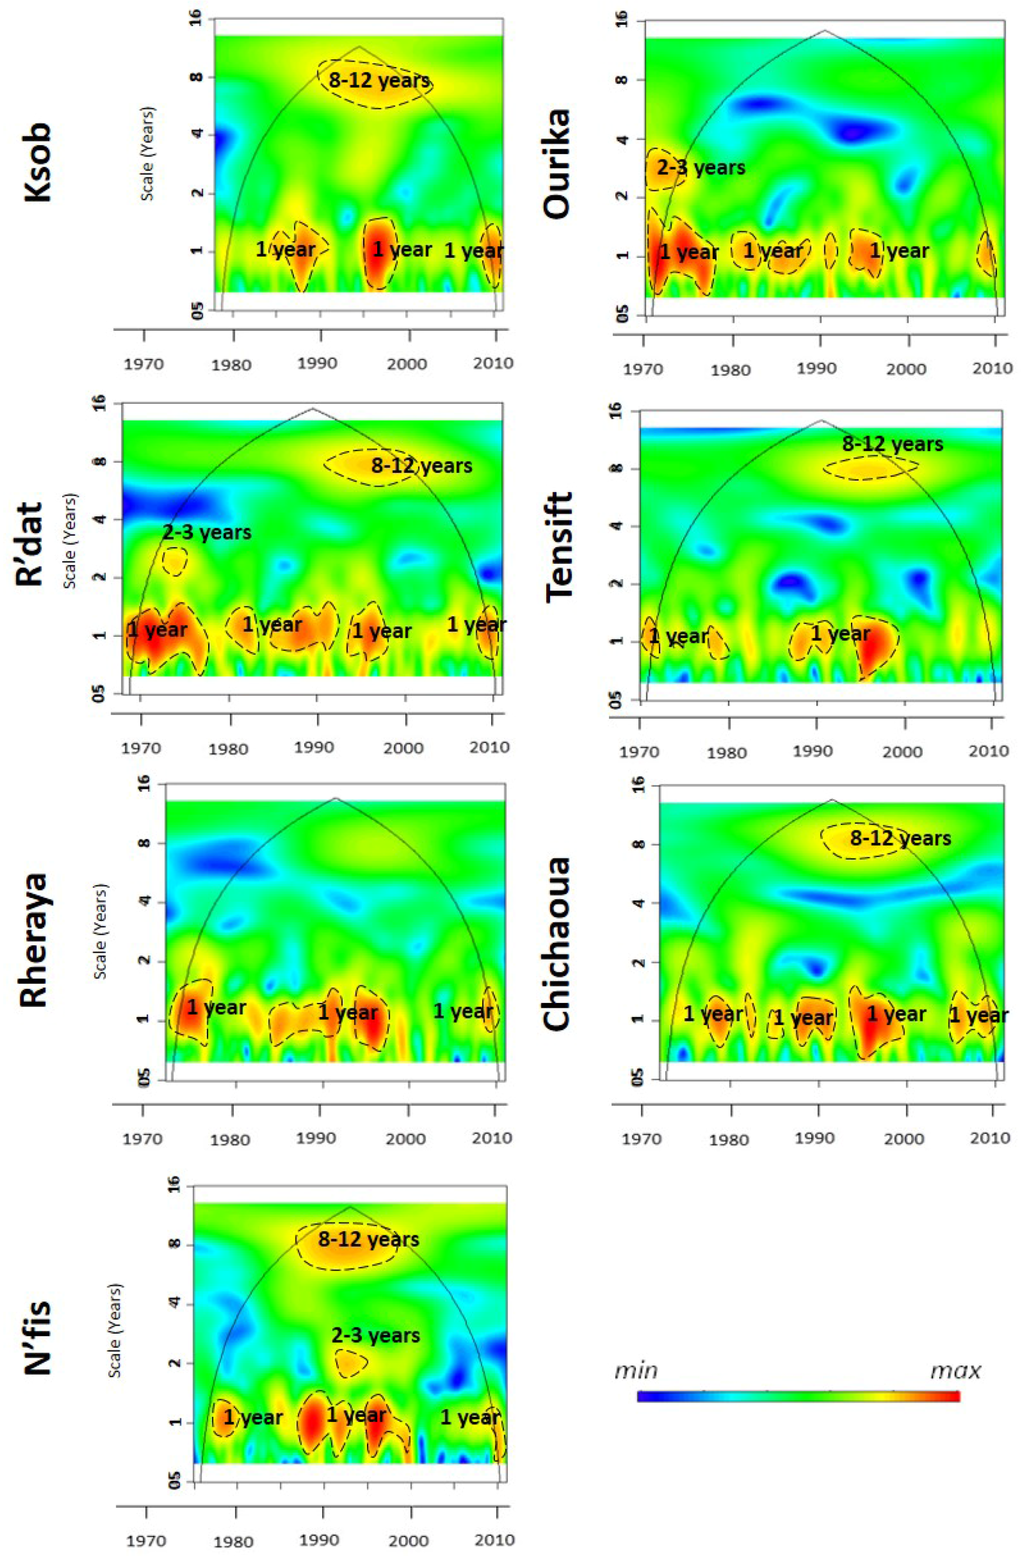
Figure 6.
Continuous wavelets transform of the monthly rainfall at selected gauging stations.

Table 2.
The time variation of the rainfall variability modes, extracted from the continuous wavelet analysis, at Tensift River, Ksob, Ourika, Chichaoua, N’fis, R’dat and Rheraya basin.
For all basins, we deduce generally three discontinuities around 1980, 1990 and 2000 according to rainfall stations multiple energy bands can be seen on the wavelet spectra streamflow (Figure 7) (Table 3). As in the case of the rainfall, frequencies are one year, 2–4 years and 8–12 years, but these bands occur in all sub-basins and do not always appear in the same period. There is also a moderately strong 4–8-year band that is more visible.
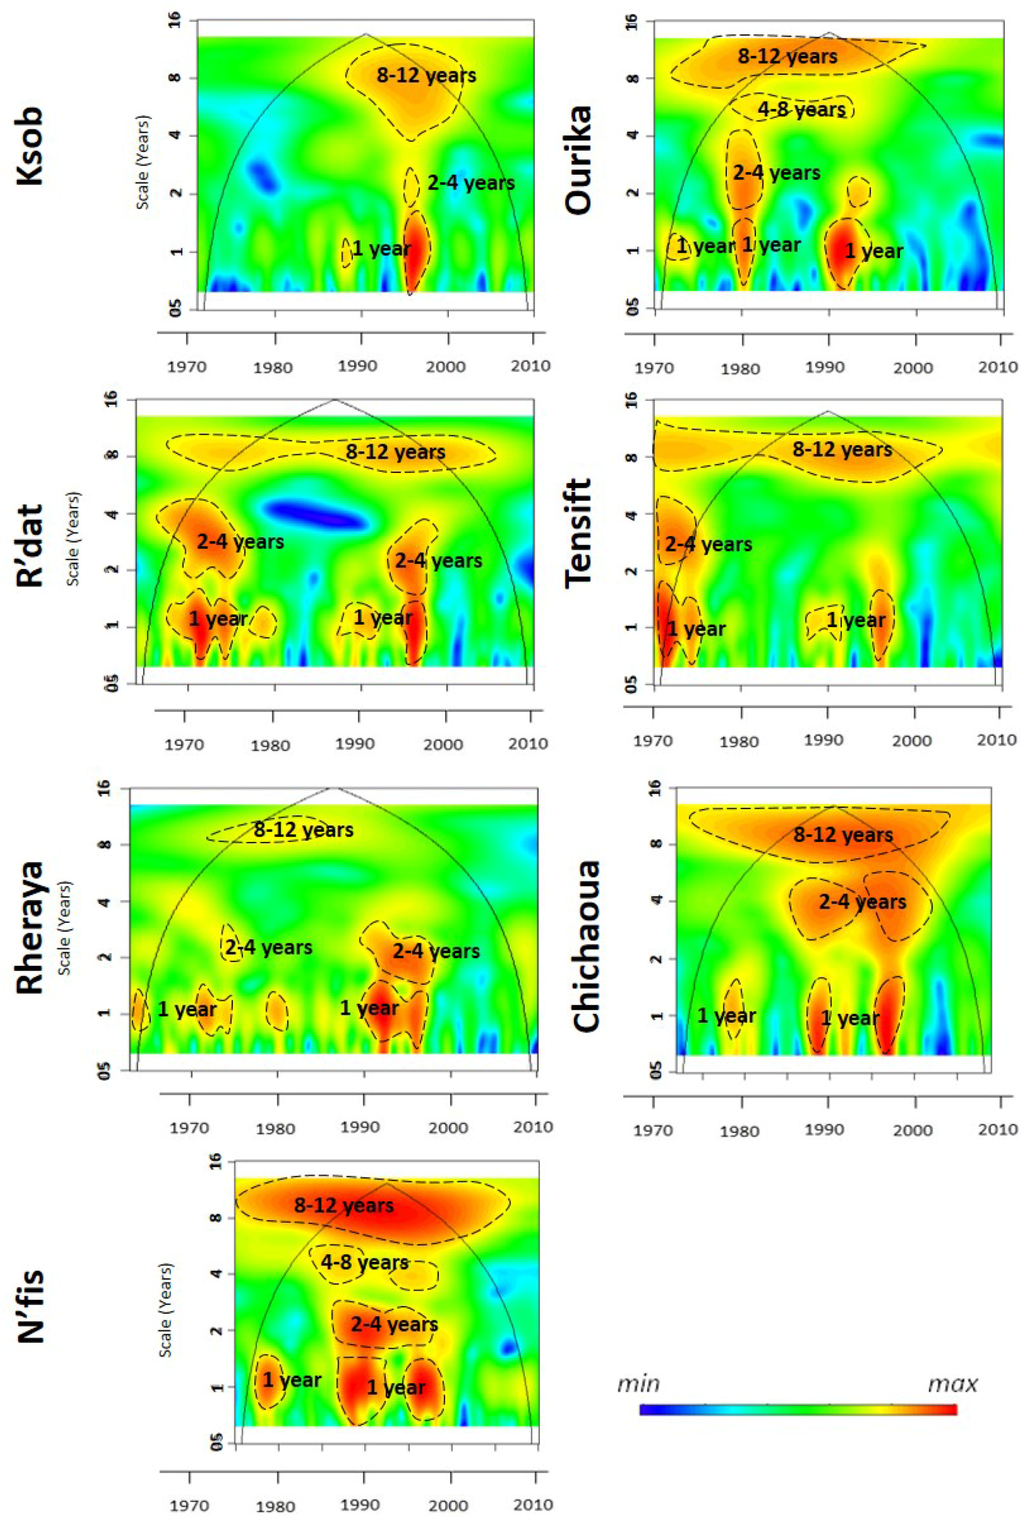
Figure 7.
Continuous wavelets transform of the monthly streamflow at selected hydrological stations.

Table 3.
The time variation of the streamflow variability, extracted from the continuous wavelet analysis, at Tensift River, Ksob, Ourika, Chichaoua, N’fis, R’dat and Rheraya basin.
For the N’Fis and Ourika sub-basins, the annual cycle is generally characterized by strong attenuation during the 1970s (except for the Ksob) and during the 1990s. The 2–4-year band corresponds to a high-power fluctuation for all sub-basins expect the Tensift River from the early to the mid-1990s. It occurs also in the early to mid-1970s (Tensift river, R’dat), the mid-1970s (Rheraya) and around 1980 (Ourika). Strong 8–12-year bands are identified in all regions except Rheraya.
Major discontinuities are identified depending on the basins: they appear during the mid-1970s, 1980, 1990 and 2000. These discontinuities help to subdivide the time-series into a number of periods depending on the sub-basin; R’dat, Rheraya and Tensift River. On the other hand, we observe the presence of three periods in the Ksob, Nfis, Chichaoua and Ourika sub-basins related to discontinuities identified in 1980 and 1990.
5. Discussion: Influence of the Climatic Fluctuations of the North Atlantic Oscillation (NAO) on the Hydrological Variability of the Tensift and Ksob Basins
This section begins with a comparison of the series of data used in our study, and then studies the coherence among NAO, Rainfall and streamflow.
5.1. Comparison between Rainfall and Streamflow
The results obtained from wavelets analysis show three discontinuities during the 1980s, 1990s and 2000s.
The wavelet analysis shows some common energy bands between rainfall and streamflow but the interannual energy bands are better identified in streamflow time series than in rainfall. Except for the Ourika and Rheraya sub-basins, common annual-scale bands are identified between 1980s and 1990 as well as common 8–12-year bands for the mid-1990s. Comparing rainfall and streamflow, a discontinuity appears within the majority of stations in the 1980 and 2000 periods. In the same station, rainfall and streamflow energy bands discontinuities are coherent for Ksob, N’fis R’dat, and Chichaoua sub-basins. It is less visible during certain periods for Tensift River, Ourika and Rheraya sub-basins.
The eight-year mode is observed during the second and the third period for streamflow and only observed during the second period for rainfall. The 2–3-year mode appears with a low energy level on Ksob and R’dat rainfall in 1970. This mode can be slightly identified on N’fis rainfall between 1980 and 1990. For streamflow, the 2–4-year and 4–8-year modes were detected during the first and second periods, 1970–1980 and 1990–2000; and the 8–12-year mode is observed during the second and third periods. The major climatic variability is observed between 1980 and 1990.
For some stations, two important dry periods occur in 1974–1987 and 1997–2007. For others, there are some wetter periods with an alternation of wet and dry years but in a homogeneous tendency as shown by the wavelets analysis.
The annual variability for rainfall and streamflow identified by the continuous wavelet method can correspond to wet years determined by the standardized variables.
5.2. Comparison between Rainfall and Gridded Rainfall Data
The rainfall data used in this study are related to gauging stations, as there were no other available rainfall data from authorities. Thus, we might miss some significant variabilities that might occur outside the study area. To overcome this problem, we also used the continuous wavelet analysis on the rainfall data of the SIEREM database. This also allows comparing the signals of the streamflow with rainfall, which could better take into account regional influences of rainfall over the basin. The Tensift basin is covered by 14 grid cells. The wavelet analysis shows fluctuations generally of very low intensity. The annual cycle is identified over the whole time series showing a discontinuity in the North of the basin. The seasonal alternation is moderately expressed, the modes of variability 8–12 years are identified at the end of time series from mid-1980 to 1999 on the grids located in the South of the basin (Figure 8a,b).
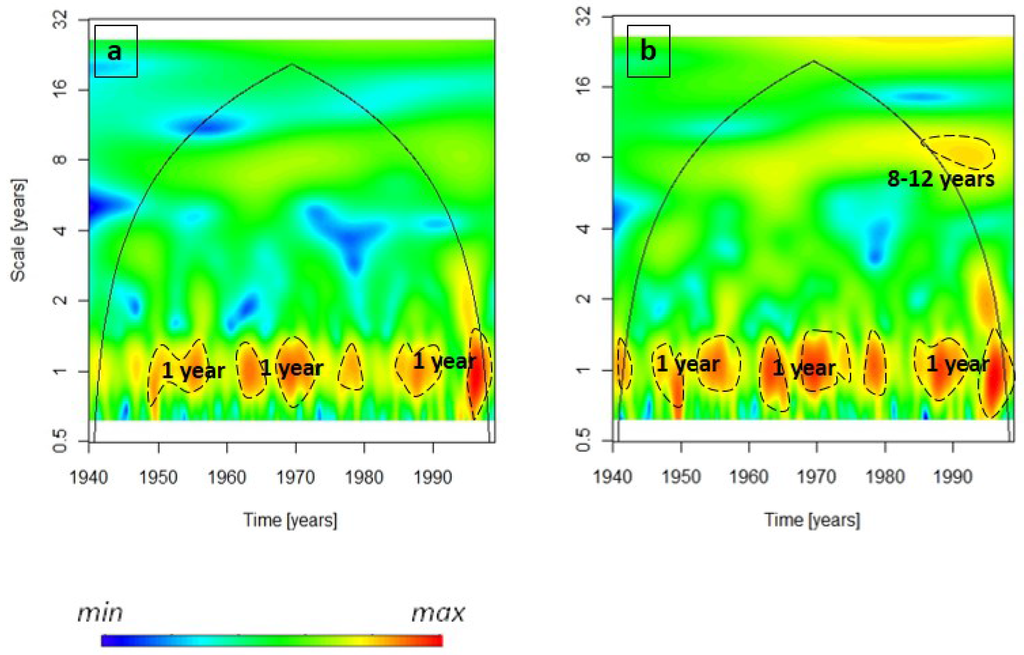
Figure 8.
Continuous wavelets transform of the monthly rainfall from the SIEREM gridded dataset: (a) in the North of Tensift basin; and (b) in the South of Tensift basin.
In the period between 1970 and 1990 (common period between SIEREM and gauging stations data), we identify two kind of variabilities: the annual cycle, which is found on the gauging stations and grids data, and the 8–12-year band, which is detected on some grids during the end of the 1990 period and in the Tensift sub-basin. Besides, more variability is found in the streamflow compared to gauging station and gridded rainfall.
5.3. Influence of the NAO on the Hydrological Variability
Fourier analysis gives a coherence result defined as the square of the cross-spectrum normalized by the individual power spectra. This gives a quantity between 0 and 1. The cross-correlation is measured between two time series as a function of frequency [64].
Many studies have been carried out in order to determine the relationship between NAO and hydrological parameters [13,14,15,16]. They show the NAO contribution in the eight-year band falling on the second half of the last century. The annual oscillation was always strongly represented in streamflow time series and was affected by an increase in power from 1990 in Seine River [15].
The analysis of NAO and precipitation time series (Figure 9) shows rather large annual and inter-annual coherence scales. The annual scale weak coherence is visible around 1985, 1995 and 2005. The first one might be linked to the drought periods that occurred in Morocco between 1980 and 1985. Mahé et al. [65] identified a rupture in annual rainfall in Morocco between 1979 and 1980. The inter-annual coherence is mainly distributed in the energy bands of 2–4 years, 4–8 years, and 8–12 years. Considerable energy is observed between the mid-1980s and the mid-1990s for the 2–4-year band. The 8–12-year band is continuous over the entire duration for the Ksob basin and is nearly continuous for the R’dat sub-basin.
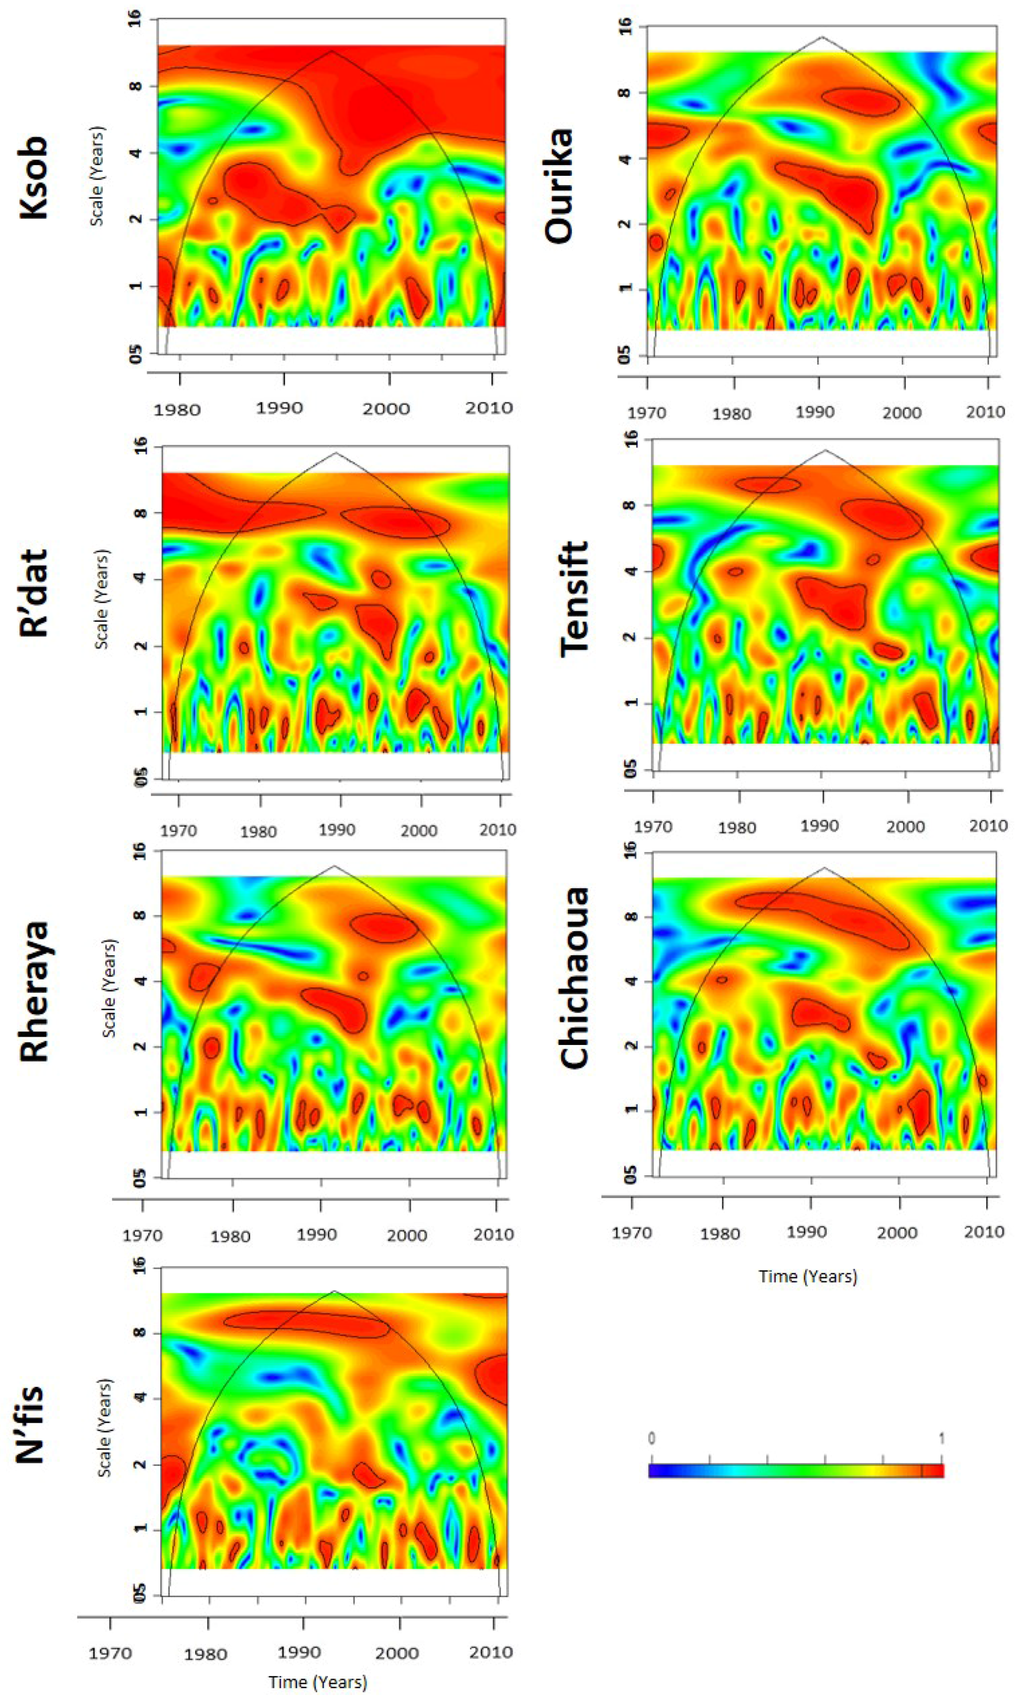
Figure 9.
Wavelet coherence analysis diagram for rainfall at selected gauging stations.
To estimate the contribution of a component over the total signal, we operate a reconstruction through the inverse transform component and compare its standard deviation to the one of the original series. The reconstruction may be performed by the wavelet inverse transform [64] or by Fourier inverse transform. Both approaches have been tested and are supposed to give very similar results.
The contribution of the NAO variability to rainfall (Table 4) is very close in the Chichaoua, Rheraya, Ourika, and N’fis sub-basins and Tensift River, with a minimum of 65% and a maximum of 69%. It varies between 74% and 79% for the Ksob basin and R’dat sub-basin.

Table 4.
The mean percentage of NAO/rainfall wavelet coherence for the different modes of variability (one year, 2–4 years and 8–12 years) at selected stations.
Wavelet coherence analysis also indicates correlations between the NAO index and the monthly streamflow (Figure 10). As observed in the NAO-precipitation coherence analysis, annual and interannual bands (2–4 years, 4–8 years, and 8–12 years) are clearly visible and annual-scale coherence losses are visible around 1985, 1995, and 2005. However, the 2–4-year band for the Ksob, Tensift River and Chichaoua sub-basin is generally less extended in Figure 8 than in Figure 7, ranging from the mid-1980s to the mid-1990s. Conversely, the 8–12-year band in Figure 8 is continuous or nearly so over the entire duration for a larger number of sub-basins (Chichaoua, Rheraya, N’fis, and R’dat) than in Figure 7. The contribution of the NAO variability on streamflow is almost identical for the Tensift River, R’dat and Ourika sub-basins, with 68%, 69% and 67% respectively. For the Ksob basin, Rheraya, N’fis and Chichaoua sub-basins, their contribution varies with a minimum of 71% and a maximum of 77%. The contribution of the NAO is more or less important according to the variability of the modes (Table 5). Loss of coherence in the interannual scales (2–4 years and 4–8 years) is identified.
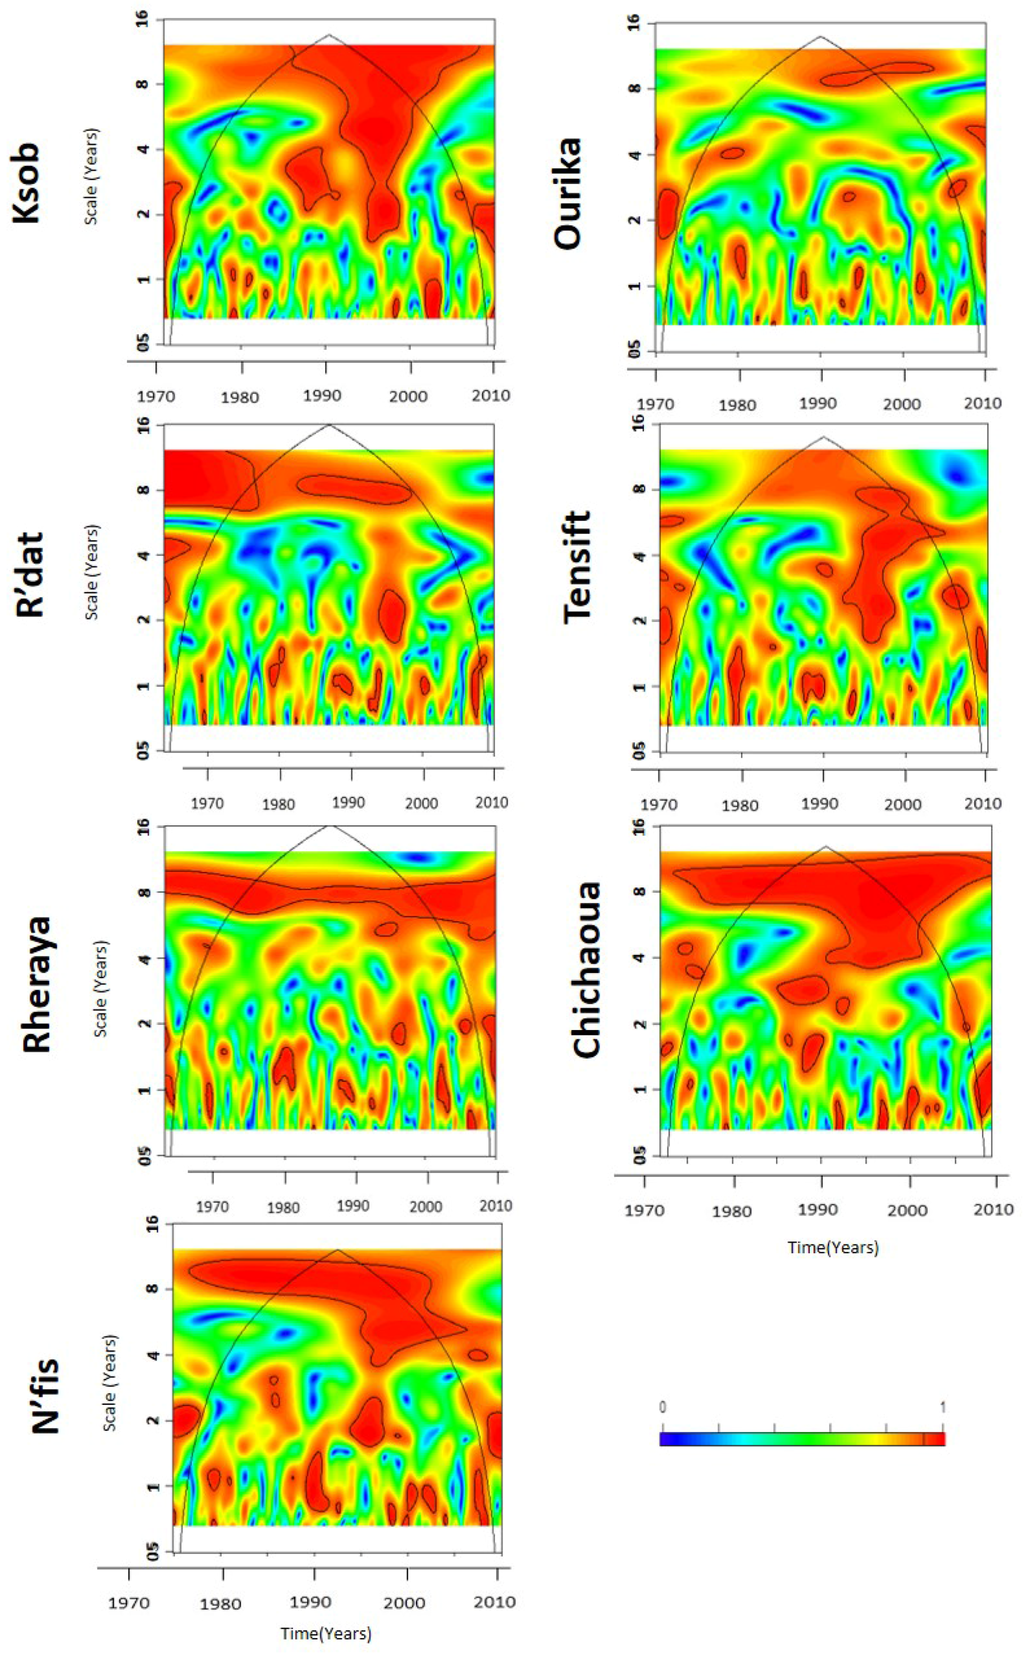
Figure 10.
Wavelet coherence analysis diagram for streamflow at selected hydrological stations.

Table 5.
The mean percentage of NAO/streamflow wavelet coherence for the different modes of variability (one year, 2–4 years, 4–8 years and 8–12 years) at selected stations.
Laignel et al. [15] related major discontinuities observed in 1970 and 1990 to global discontinuities observed in the NAO, SOI and PDO indices, which might also be the case in our study.
The wavelets coherence analysis between the NAO and streamflow has shown that variability in flows was related to climate index (approximately), which can vary depending on time scales, the mode of variability and the nature of the sub-basin. These characteristics were also reported by other works related to unregulated watersheds [55,66,67,68], which suggested a climatic origin of such a transient pattern rather than an anthropogenic one. In addition, the External forcing (atmospheric) determines the water inflows and the energy in a watershed as well as their spatial and temporal variability (rain), the climate forcing influence on hydrological response of basin over the time [69]. However, the watershed characteristics that may influence the hydrological behavior of the basin can be Geometric (morphology) of the watershed, land use, lithology, or the influence of aquifers.
5.4. NAO Wavelet Analysis
From the NAO wavelet analysis during the period ranging between 1960 and 2011 (Figure 11) we identify a long lasting energy loss from approximately 1970 until the late 1980s. We find also intermittent annual bands from 1990 to 2007; 2–4-year bands in the 1960s, in the early to mid-1990s and around 2010; a 4–8-year band from nearly 1998 to 2010; and a relatively strong 8–12-year band from the mid-1980s to 2010. On the streamflow and rainfall spectrum, we find discontinuities in 1980 period. The study carried out by Rossi et al. [12] on the Mississippi area showed the presence of discontinuities around the 1970s and 1980s. Other discontinuities were also identified during 1970 and 1990 in the Colorado [14].
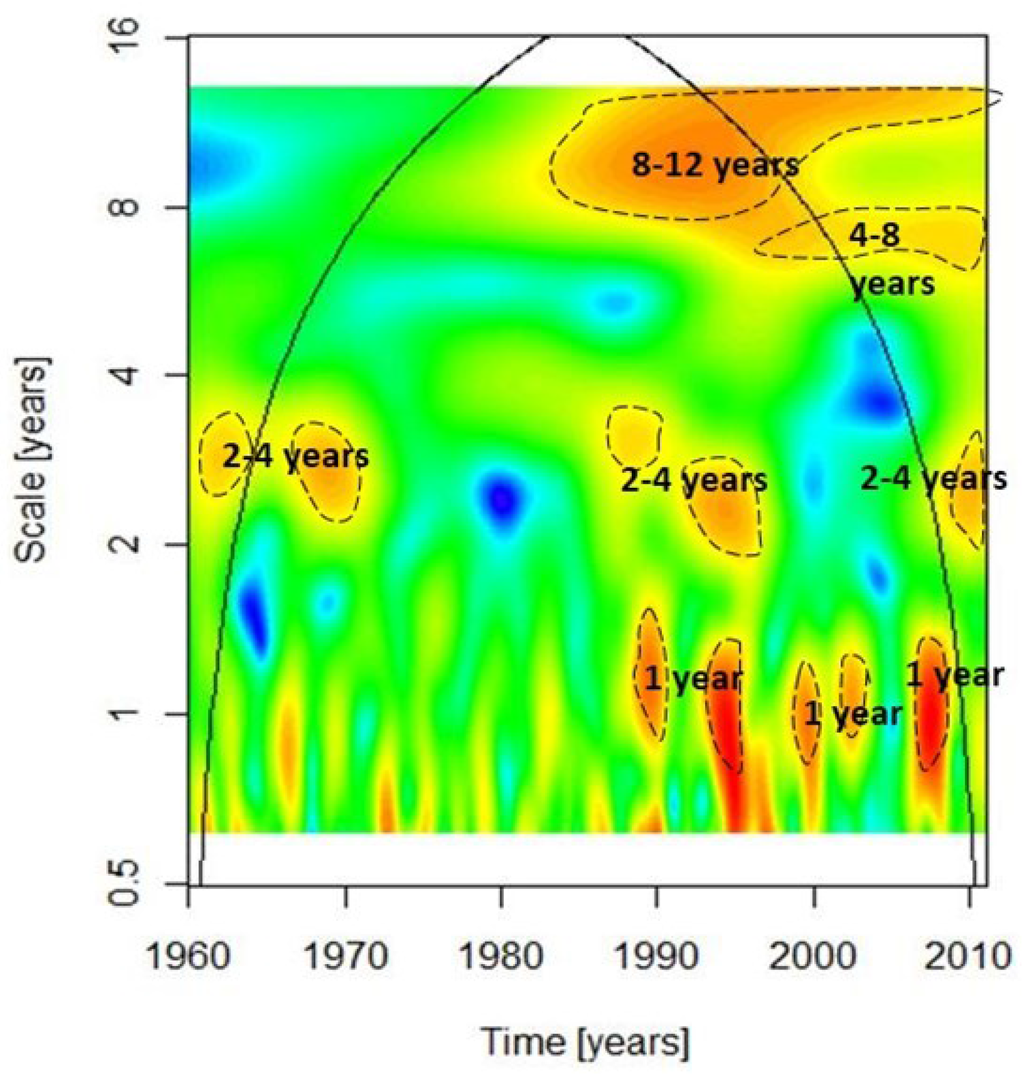
Figure 11.
The time variation of the NAO between 1960 and 2011 [70].
Different studies have shown the important role of the NAO in the Mediterranean and Atlantic areas. According to Hurell and Barnston [9,10], the NAO reflects the main fluctuations of climatic conditions The North Atlantic Oscillation is also considered to be the dominant mode of the Winter atmospheric variability in the northern Hemisphere [11].
Understanding the NAO variability of the last few decades in the context of past behavior is of considerable importance for enhanced predictability of the NAO and estimation of its influences on the North Atlantic region [71]. The NAO displays several non-stationary features that can be readily detected using continuous wavelet analyses, which are specially designed for the investigation of non-stationary signals. The relationships between NAO, rainfall and streamflow for the Tensift basin allows the identification of the part of variability correlated with the NAO in the related time series. Spatial and temporal variability in rainfall and streamflow in the Tensift basin is linked to climate and physiographic conditions in each sub-basin, which might modify the hydrological response of the main NAO forcing signal. For instance, the N’fis sub-basin is located at a relatively high altitude and receives low rainfall. This can be explained by the influence of the local topography that blocks the extension of the Atlantic winds. This fact could have an influence on the rainfall characteristics, which will be different from another regional basin being differently oriented in regard to the Atlantic winds, like the Ksob basin. Each sub-basin has specific physical characteristics (Table 1) that determine the shape of the observed hydrographs at the channel [72,73,74]. The mountainous N’fis, Rheraya and Ourika sub-basins, which have relatively impervious soils, are often exposed to violent floods. The magnitude of short-term flow is related to morphological characteristics [44]. The rainfall–runoff relationship can be explained by the position of each basin compared to the others influenced by humid Atlantic air masses during the winter and stormy periods in the Summer that bring torrential rain causing heavy floods [45].
6. Conclusions
In this study, we investigated the series of streamflow and rainfall on the Tensift Basin, which is part of the semi-arid areas of the Southern part of Morocco. These data have been used to determine the interannual variability and its relation with climate fluctuations.
The Wavelet technique was carried out to complete the preliminary statistical analyses of standardization and correlation. This analysis is able, in our case, to assess and describe the links between the hydrological and climatic variability of the NAO. The Wavelet method was applied to the rainfall and streamflow time series in the Tensift and Ksob basins. It showed a distribution of energy bands following high and low frequencies. The results demonstrated that the hydrological variability can be described by four modes of variability: one year, 2–4 years, 4–8 years and 8–12 years. The 4–8-year mode was only observed in streamflow time series and detected between 1990 and 2000.
Such modes are distributed following three main discontinuities occurring during the 1980s, the 1990s and mid-2000s. These discontinuities are related to the basins geomorphology, spatial variability and global exposure to seasonal drought.
The study of the coherence between the NAO and rainfall in the Tensift basin has outlined low frequencies where the total contribution is 78%. The results are quite similar for the streamflow with a contribution of 77%. However, the contribution within the 8–12-year band appeared to be higher, with a frequency equals to 95%.
These first results have to be developed further on to explore the relationships between hydrological variability and the NAO signal from the North to the South of Morocco, in order to check if there are clear boundaries between the influences of the Atlantic, the Mediterranean and the Sahara, and, on the other hand, to use longer time series of streamflow, starting long before 1970, in the case of availability of sufficient data.
Acknowledgments
The authors would like to thank the Averroes Program for financial support, and also PHC Maghreb/MAE France, the IRD grant program.
Author Contributions
Zineb Zamrane, Imen turki and Benoit Laignel analyzed data and carried out computation. Nour Eddine Laftouhi identified the framework of this study. Zineb Zamrane prepared the manuscript. Gil Mahé provided suggestions and technical support. All authors discussed the results and made contributions to the revision of the manuscript.
Conflicts of Interest
The authors declare no conflict of interest.
References
- Pachauri, R.K.; Andy, R. Climate Change 2007 Synthesis Report: Summary for Policymakers; IPCC Secretariat: Geneva, Switzerland, 2007. [Google Scholar]
- Seguin, B. Coup de chaud sur l’agriculture. Meteorologie 2010, 71, 55. [Google Scholar]
- Hurrell, J.W. Decadal trends in the North Atlantic Oscillation: Regional temperatures and precipitation. Science 1995, 269, 676–679. [Google Scholar] [CrossRef] [PubMed]
- Khomsi, K.; Mahe, G.; Sinan, M.; Snoussi, M. Hydro-climatic variability in two Moroccan watersheds: A comparative analysis of temperature, rain and flow regimes. In Climate and Land Surface Changes in Hydrology; Boegh, E., Blyth, E., Hannah, D.M., Hisdal, H., Kunstmann, H., Su, B., Yilmaz, K.K., Eds.; IAHS Publication: Wallingford, UK, 2013; Volume 359, pp. 183–190. [Google Scholar]
- Berri, G.J.; Ghietto, M.A.; Garcia, N.O. The influence of ENSO in the flows of the upper Parana river of South America over the past 100 years. J. Hydrometeorol. 2002, 3, 57–65. [Google Scholar] [CrossRef]
- Labat, D.; Espinoza, J.C.; Ronchail, J.; Cochonneau, G.; de Oliveira, E.; Doudou, J.C.; Guyot, J.L. Fluctuations in the monthly discharge of Guyana Shield rivers, related to Pacific and Atlantic climate variability. Hydrol. Sci. J. 2012, 57, 1081–1091. [Google Scholar] [CrossRef]
- Biondi, F.; Gershunov, A.; Cayan, D.R. North Pacific decadal climate variability since 1661. J. Clim. 2001, 14, 5–10. [Google Scholar] [CrossRef]
- Chang, P.; Ji, L.; Li, H. A decadal climate variation in the tropical Atlantic Ocean from thermodynamic air-sea interaction. Nature 1997, 85, 516–518. [Google Scholar] [CrossRef]
- Hurrell, J.W.; Van Loon, H. Decadal variations in climate associated with the North Atlantic Oscillation. In Climatic Change at High Elevation Sites; Diaz, H.F., Beniston, M., Bradley, R.S., Eds.; Springer: Berlin, Germany, 1997; pp. 69–94. [Google Scholar]
- Barnston, A.G.; Livezey, R.E. Classification, seasonality and persistence of low frequency atmospheric circulation patterns. Mon. Weather Rev. 1987, 115, 1083–1126. [Google Scholar] [CrossRef]
- Di Mauro, G.; Bonaccorso, B.; Cancelliere, A.; Rossi, G. Use of NAO index to improve drought forecasting in the Mediterranean area: Application to Sicily region. In Drought Management: Scientific and Technological Innovations; López-Francos, A., Ed.; CIHEAM: Zaragoza, Spain, 2008; pp. 311–319. [Google Scholar]
- Rossi, A.; Massei, N.; Laignel, B.; Sebag, D.; Copard, Y. The response of the Mississippi River to climate fluctuations and reservoir construction as indicated by wavelet analysis of streamflow and suspended-sediment load, 1950–1975. J. Hydrol. 2009, 377, 237–244. [Google Scholar] [CrossRef]
- Massei, N.; Durand, A.; Deloffre, J.; Dupont, J.P.; Valdes, D.; Laignel, B. Investigating possible links between the North Atlantic Oscillation and rainfall variability in northwestern France over the past 35 years. J. Geophys. Res. Atmos. 2007, 112. [Google Scholar] [CrossRef]
- Massei, N.; Laignel, B.; Deloffre, J.; Mesquita, J.; Motelay, A.; Lafite, R.; Durand, A. Long-term hydrological changes of the Seine River flow (France) and their relation to the North Atlantic Oscillation over the period 1950–2008. Int. J. Climatol. 2009, 30, 2146–2154. [Google Scholar] [CrossRef]
- Laignel, B.; Massei, N.; Rossi, A.; Mesquita, J.; Slimani, S. Water Resources Variability in the Context of Climatic Fluctuations on Both Sides of the Atlantic Ocean; IAHS-AISH Publication: Wallingford, UK, 2010; pp. 612–619. [Google Scholar]
- Massei, N.; Laignel, B.; Rosero, E.; Motelay-Massei, A.; Deloffre, J.; Yang, Z.L.; Rossi, A. A wavelet approach to the short-term to pluridecennal variability of streamflow in the Mississippi river basin from 1934 to 1998. Int. J. Climatol. 2011, 31, 31–43. [Google Scholar] [CrossRef]
- Lotsch, A.; Friedl, M.A.; Anderson, B.T.; Tucker, C.J. Response of terrestrial ecosystems to recent Northern Hemispheric drought. Geophys. Res. Lett. 2005, 32. [Google Scholar] [CrossRef]
- Facilité euro-méditerranéenne d’investissement et de partenariat. A Review of the Economic and Social Impact of Microfinance with Analysis of Options for the Mediterranean Region; European Investment Bank: Boulevard Konrad Adenauer, Luxembourg, 2008. [Google Scholar]
- Knippertz, P.; Fink, A.H.; Reiner, A.; Speth, P. Three late summer/early autumn cases of tropical-extratropical interactions causing precipitation in Northwest Africa. Mon. Weather Rev. 2003, 131, 116–135. [Google Scholar] [CrossRef]
- Winstanley, D. Rainfall patterns and general atmospheric circulation. Nature 1973, 245, 190–194. [Google Scholar] [CrossRef]
- Bunting, A.H.; Dennet, M.D.; Elston, J.; Milford, J.R. Rainfall trends in the West African Sahel. Q. J. R. Meteorol. Soc. 1976, 102, 59–64. [Google Scholar] [CrossRef]
- Lamb, P. Large-scale tropical Atlantic surface circulation patterns associated with sub-Saharan weather anomalies. Tellus 1978, 30, 240–251. [Google Scholar] [CrossRef]
- Lamb, P. Persistance of sub-Saharan drought. Nature 1982, 299, 46–47. [Google Scholar] [CrossRef]
- Nicholson, S.E. Revised rainfall series for the West Africa subtropics. Mon. Weather Rev. 1979, 107, 620–623. [Google Scholar] [CrossRef]
- Olivry, J.C. Le point en 1982 sur l’évolution de la sécheresse en Sénégambie et aux Iles du Cap Vert. Examen de quelques séries de longue durée (débits et précipitations). Cah. ORSTOM, Série Hydrol. 1983, 20, 47–69. [Google Scholar]
- Olivry, J.C. Les conséquences durables de la sécheresse actuelle sur l’écoulement du fleuve Sénégal et l’hypersalinisation de la basse Casamance. In Influence of Climate Change Variability on Influence of Climate Change Variability on the Hydrologie Regime and Water Resources; IAHS Publication: Wallingford, UK, 1987; pp. 501–512. [Google Scholar]
- Farmer, G. The Rainfall Climatology of the Sahel from Senegal to Somalia. A Report for the International Union for the International Union for the Conversation of Nature and Nature Resources; IUCN: Gland, Switzerland, 1988. [Google Scholar]
- Lamb, P.; Peppier, R.A. Further case studies of tropical Atlantic surface atmospheric and oceanic patterns associated with subsaharan drought. J. Clim. 1992, 5, 476–488. [Google Scholar] [CrossRef]
- Hulme, M. The sensitivity of Sahel rainfall to global warming: implications for scenario analysis of future climate change impact. In Water Resources Variability in Africa during the XXth Century; Servat, E., Hughes, D., Fritsch, J.-M., Hulme, M., Eds.; IAHS Publication: Wallingford, UK, 1998; pp. 429–436. [Google Scholar]
- Mahé, G.; Paturel, J.E. 1896–2006 Sahelian rainfall variability and runoff increase of Sahelian rivers. Comptes Rendus Geosci. 2009, 341, 538–546. [Google Scholar] [CrossRef]
- Sircoulon, J. Les données hydropluviométriques de la sécheresse récente en Afrique intertropicale; comparaison avec les sécheresses “1913” et “1940”. Cah. ORSTOM Série Hydrol. 1976, 13, 75–174. [Google Scholar]
- Motha, R.P.; Leduc, S.K.; Steyaert, L.T.; Sakamoto, C.M.; Strommen, N.D. Precipitation patterns in west Africa. Mon. Weather Rev. 1980, 108, 1567–1578. [Google Scholar] [CrossRef]
- Sircoulon, J. La sécheresse en Afrique de l’Ouest. Comparaison des années 1982–1984 avec les années 1972–1973. Cah. ORSTOM Série Hydrol. 1985, 21, 75–86. [Google Scholar]
- Nicholson, S.E. The nature of rainfall fluctuations in subtropical West Africa. Mon. Weather Rev. 1980, 108, 473–487. [Google Scholar] [CrossRef]
- Nicholson, S.E. Sub-Saharan rainfall in the years 1976–1980: Evidence of continued drought. Mon. Weather Rev. 1983, 111, 1646–1654. [Google Scholar] [CrossRef]
- Camberlin, P. La Variabilité Interannuelle des Champs Pluviométriques Ouest Africains; Cahier du Centre de Recherches de Climatologie: Dijon, France, 1990; pp. 7–32. [Google Scholar]
- Hulme, M. Rainfall changes in Africa: 1931–1960 to 1961–1990. Int. J. Climatol. 1992, 12, 685–699. [Google Scholar] [CrossRef]
- Mahé, G.; Olivry, J.C. Variations des précipitations et des écoulements en Afrique de l’Ouest et Centrale de 1951 à 1989. Sécheresse 1995, 1, 109–117. [Google Scholar]
- Taibi, S.; Meddi, M.; Souag, D.; Mahé, G. Climate and Land Surface Changes in Hydrology. In Proceedings of the H01, IAHS-IAPSO-IASPEI Assembly, Gothenburg, Sweden, 22–26 July 2013; IAHS Publication: Wallingford, UK, 2013; pp. 191–197. [Google Scholar]
- Driouech, F.; Deque, M.; Sanchez-Gomez, E. Weather regimes—Moroccan precipitation link in a regional climate change simulation. Glob. Planet. Chang. 2010, 72, 1–10. [Google Scholar] [CrossRef]
- Beven, K.; Lamb, R.; Quinn, P.; Romanowicz, R.; Freer, J.; Singh, V.P. Topmodel. In Computer Models of Watershed Hydrology; Singh, V.P., Ed.; Water Resources Publications: Littleton, CO, USA, 1995; pp. 627–668. [Google Scholar]
- Stour, L.; Agoumi, A. Sécheresse climatique au Maroc durant les dernières décennies. Hydroécologie Appliquée 2008, 16, 215–232. [Google Scholar] [CrossRef]
- Turki, I.; Laignel, B.; Laftouhi, N.; Nouaceur, Z.; Zamrane, Z. Investigating possible links between the North Atlantic Oscillation and rainfall variability in Marrakech (Morocco). Arabian J. Geosci. 2016, 9, 1–14. [Google Scholar] [CrossRef]
- El Mimouni, A.; Daoudi, L.; Saidi, M.E.; Baiddah, A. Comportement hydrologique et dynamique d’un bassin versant en milieu semi-aride: Exemple du bassin versant du Ksob (haut atlas occidental, Maroc). Span. J. Quat. Geomorphol. 2010, 24, 99–112. [Google Scholar]
- Riad, S.; Mania, J.; Bouchaou, L. Variabilité hydroclimatique dans les bassins versants du Haut Atlas de Marrakech (Maroc). Sci. Chang. Planétaires Sécheresse. 2006, 17, 443–446. [Google Scholar]
- Allam, M.; Houmimyd, A. Etude de Protection Contre l’ensablement de la Liaison Routière Entre Moulay Bouzarktoun et Essaouira; Rapport du Service Forestier d’Essaouira: Essaouira, Morocco, 1990; p. 65. [Google Scholar]
- Weisrock, A. Géomorphologie et Paléoenvironnements de l’Atlas Atlantique, Maroc. Ph.D. Thesis, Université de Paris I, Paris, France, 1980; p. 837. [Google Scholar]
- Hander. Contribution à l’étude de la Bioclimatologie humaine au Maroc l’exemple d’Essaouira. Ph.D. Thesis, Université de Paris IV, Paris, France, 1993; p. 230. [Google Scholar]
- Graf, W. Dam nation: A geographic census of American dams and their large-scale hydrologic impacts. Water Resour. Res. 1999, 35, 1305–1311. [Google Scholar] [CrossRef]
- Boyer, J.F.; Dieulin, C.; Rouché, N.; Crès, A.; Servat, E.; Paturel, J.E.; Mahé, G. SIEREM: An environmental information system for water resources. In Water Resource Variability: Hydrological Impacts, Proceedings of the 5th FRIEND World Conference, La Havana, Cuba, 27 November–1 December 2006; IAHS Publication: Wallingford, UK, 2006; Volume 308, pp. 19–25. [Google Scholar]
- Rouché, N.; Mahé, G.; Ardoin-Bardin, S.; Brissaud, B.; Boyer, J.F.; Crès, A.; Dieulin, C.; Bardin, G.; Commelard, G.; Paturel, J.E.; et al. Constitution d’une grille de pluies mensuelles pour l’Afrique, période 1900–2000. Sécheresse 2010, 21, 336–338. [Google Scholar]
- Dieulin, C.; Mahe, G.; Ejjiyar, S.; El Mansouri, B.; Paturel, J.E.; Boyer, J.F. A new gridded rainfall dataset for Africa over the period 1940–1999. In Proceedings of the Large River Basins Conference, Manaus, Brazil, 21–25 July 2014; p. 53.
- Lubès, H.; Masson, J.M.; Servat, E.; Paturel, J.E.; Kouame, B.; Boyer, J.F. Caractérisation de Fluctuations dans une Série Chronologique par Applications de Tests Statistiques-Etude Bibliographique; Orstom éditions: Montpellier, France, 1994. [Google Scholar]
- Gaucherel, C. Use of wavelet transform for temporal characterisation of remote watersheds. J. Hydrol. 2002, 269, 101–121. [Google Scholar] [CrossRef]
- McCabe, G.J.; Wolock, D.M. A step increase in streamflow in the conterminous United States. Geophys. Res. Lett. 2002, 29. [Google Scholar] [CrossRef]
- Labat, D. Oscillations in land surface hydrological cycle. Earth Planet. Sci. Lett. 2006, 242, 143–154. [Google Scholar] [CrossRef]
- Daubechies, I. The wavelet transform time-frequency localization and signal analysis. IEEE Trans. Inf. Theory 1990, 36, 961–1005. [Google Scholar] [CrossRef]
- Labat, D. Recent advances in wavelet analyses: Part 1. A review of concepts. J. Hydrol. 2005, 314, 275–288. [Google Scholar] [CrossRef]
- Ghil, M.; Allen, M.R.; Dettinger, M.D.; Ide, K.; Kondrashov, D.; Mann, M.E.; Robertson, A.W.; Saunders, A.; Tian, Y.; Varadi, F.; et al. Advanced spectral methods for climatic time series. Rev. Geophys. 2002, 40. [Google Scholar] [CrossRef]
- Labat, D.; Ababou, R.; Mangin, A. Rainfall-runoff relations for karstic springs—Part II: Continuous wavelet and discrete orthogonal multiresolution analyses. J. Hydrol. 2000, 238, 149–178. [Google Scholar] [CrossRef]
- Lafrenieres, M.; Sharp, M. Wavelet analysis of inter-annual variability in the runoff regimes of glacial and nival stream catchments, Bow Lake, Alberta. Hydrol. Process. 2003, 17, 1093–1118. [Google Scholar] [CrossRef]
- Labat, D. Cross wavelet analyses of annual continental freshwater discharge and selected climate indices. J. Hydrol. 2010, 385, 269–278. [Google Scholar] [CrossRef]
- Maraun, D.; Kurths, J. Cross wavelet analysis: Significance testing and pitfalls. Non Linear Process. Geophys. 2004, 11, 505–514. [Google Scholar] [CrossRef]
- Torrence, C.; Compo, G.P. A practical guide to wavelet analysis. Bull. Am. Meteorol. Soc. 1998, 79, 61–78. [Google Scholar] [CrossRef]
- Mahe, G.; Singla, S.; Driouech, F.; Khomsi, F. Analyse de la persistance de ruptures dans des séries pluviométriques au Maroc en fonction de l’échelle spatiale et de la reconstitution des données. In Proceedings of the Conférence CIREDD4, Blida, Algeria, 22–23 February 2011.
- Anctil, F.; Coulibaly, P. Wavelet analysis of the interannual variability in southern Québec streamflow. J. Clim. 2004, 17, 163–173. [Google Scholar] [CrossRef]
- Kucuk, M.; Kahya, E.; Cengiz, T.M.; Karaca, M. North Atlantic Oscillation influences on Turkish lake levels. Hydrol. Process. 2009, 23, 893–906. [Google Scholar] [CrossRef]
- Coulibaly, P.; Burn, D.H. Wavelet analysis of variability in annual Canadian streamflow. Water Resour. Res. 2004, 40. [Google Scholar] [CrossRef]
- Mesquita, J. Facteurs de Contrôle Climatique et Géomorphologique de la Variabilité Hydrologique de Bassins Versants en Substrat Carbonaté. Comparaison Haute Normandie (FR) et Région d’Austin, Texas (USA). Ph.D. Thesis, Université de Rouen, Mont Saint Aignan, France, 2009. [Google Scholar]
- Climate Data: Hurrell North Atlantic Oscillation (NAO) Index (Station-Based). Available online: https://climatedataguide.ucar.edu/climate-data/hurrell-north-atlantic-oscillation-nao-index-station-based (accessed on 20 April 2016).
- Glueck, M.F.; Stockton, C.W. Reconstruction of the North Atlantic oscillation, 1429–1983. Int. J. Climatol. 2001, 21, 1453–1465. [Google Scholar] [CrossRef]
- Humbert, J.; Najjar, J.; Ambroise, B.; Amiet, Y. Caractéristiques Morphométriques et Hydrographiques des Bassins de la Petite Fecht et du Ringel Barch; Recherche Géographique Strasbourg: Strasbourg, France, 1982; pp. 19–21. [Google Scholar]
- Saidi, M.E. Contribution à l’hydrologie profonde et superficielle du bassin du Souss (Maroc). Ph.D. Thesis, Université de Paris IV, Paris, France, 1995. [Google Scholar]
- Saidi, M.E.M; Daoudi, L.; Aresmouk, M.; Blali, A. Rôle du milieu physique dans l’amplification des crues en milieu montagnard: Exemple de la crue du 17 août 1995 dans la vallée de l’Ourika (Haut Atlas, Maroc). Sci. Chang. Planét. Séch. 2003, 14, 107–114. [Google Scholar]
© 2016 by the authors; licensee MDPI, Basel, Switzerland. This article is an open access article distributed under the terms and conditions of the Creative Commons Attribution (CC-BY) license (http://creativecommons.org/licenses/by/4.0/).