Article

Seasonal Variations and Correlation Analysis of Water-Soluble Inorganic Ions in PM2.5 in Wuhan, 2013

1
School of Environmental Studies, China University of Geosciences, Wuhan 430074, China
2
Department of Environmental Studies, SIP-UCLA Institute for Technology Advancement, Suzhou 215000, China
3
Hubei Environment Monitoring Center, Wuhan 430072, China
*
Author to whom correspondence should be addressed.
Atmosphere 2016, 7(4), 49; https://doi.org/10.3390/atmos7040049
Submission received: 23 December 2015 / Revised: 3 March 2016 / Accepted: 14 March 2016 / Published: 23 March 2016

Abstract

:
Daily PM2.5 and water-soluble inorganic ions (NH4+, SO42−, NO3, Cl, Ca2+, Na+, K+, Mg2+) were collected at the Hongshan Air Monitoring Station at the China University of Geosciences (Wuhan) (30°31′N, 114°23′E), Wuhan, from 1 January to 30 December 2013. A total of 52 effective PM2.5 samples were collected using medium flow membrane filter samplers, and the anionic and cationic ions were determined by ion chromatography and ICP, respectively. The results showed that the average mass concentration of the eight ions was 40.96 µg/m3, which accounted for 62% of the entire mass concentration. In addition, the order of the ion concentrations was SO42− > NO3 > NH4+ > Cl >K+ > Ca2+ > Na+ > Mg2+. The secondary inorganic species SO42−, NO3 and NH4+ were the major components of water-soluble ions in PM2.5, with a concentration of 92% of the total ions of PM2.5, and the total concentrations of the three ions in the four seasons in descending order as follows: winter, spring, autumn, and summer. NH4+ had a significant correlation with SO42− and NO3, and the highest correlation coefficients were 0.943 and 0.923 (in winter), while the minimum coefficients were 0.683 and 0.610 (in summer). The main particles were (NH4)2SO4 and NH4NO3 in PM2.5. The charge of the water-soluble ions was nearly balanced in PM2.5, and the pertinence coefficients of water-soluble anions and cations were more than 0.9. The highest pertinence coefficients were in the spring (0.9887), and the minimum was in summer (0.9459). That is, there were more complicated ions in PM2.5 in the summer. The mean value of NO3/SO42− was 0.64, indicating that stationary sources of PM2.5 had a greater contribution in Wuhan.

Graphical Abstract

1. Introduction

With the rapid development of modern industrialization and urbanization and the sustainable growth of energy consumption and the number of motor vehicles, air contamination has gradually become the core constraint of sustainable urban progress and eco-civilization construction in recent decades. As a vital indicator of current domestic ambient air quality, Particulate Matter (PM) with aerodynamic diameters less than 2.5 µm (PM2.5) has received extensive attention from society and academia. PM2.5 not only reduces atmospheric visibility [1,2] but also severely damages organisms in the environment and public health [3,4]. Numerous studies have revealed that the sources, material compositions and formation mechanisms of atmospheric PM2.5 are very complicated [5,6], and PM2.5 mainly contains black carbon [7], elemental carbon [8], crust elements [9,10], water-soluble ions [11,12], microelements [13,14], etc. Among these species, water-soluble ions could account for more than 80% of PM2.5’s constituents [15] and are an important factor in the increase in PM2.5 concentrations. Nonetheless, PM2.5’s constituents are different with the diversities of regional geographic conditions, meteorological conditions [16] and energy structures [17], and the constituents in the same district even show different varieties because of different economic development levels during different periods. The differences in PM2.5 are primarily observed on the sources, composition structure, and concentration levels.
Wuhan is one of the most rapidly developing cities in China. Along with the increase in the speed of the urbanization process, the population is rising sharply, traffic pressure is constantly increasing, and problems from PM2.5 pollution are also increasing gradually. Wuhan, as well as substantial areas of China, is experiencing chronic air pollution [18]. Currently, there are some preliminary studies on the composition characteristics and concentration levels of water-soluble ions in PM2.5 in Wuhan [19,20,21,22]. However, these studies lack long-term and continuous monitoring data and a comparison of seasonal differences. Based on this background, this study monitored PM2.5’s water-soluble ions in Wuhan continuously throughout an entire year from 1 January to 30 December 2013, and then analyzed the concentration levels and correlations of water-soluble ions and the seasonal variation in the main ions in order to provide a theoretical foundation for the control and treatment of PM2.5 pollution in Wuhan.

2. Materials and Methods

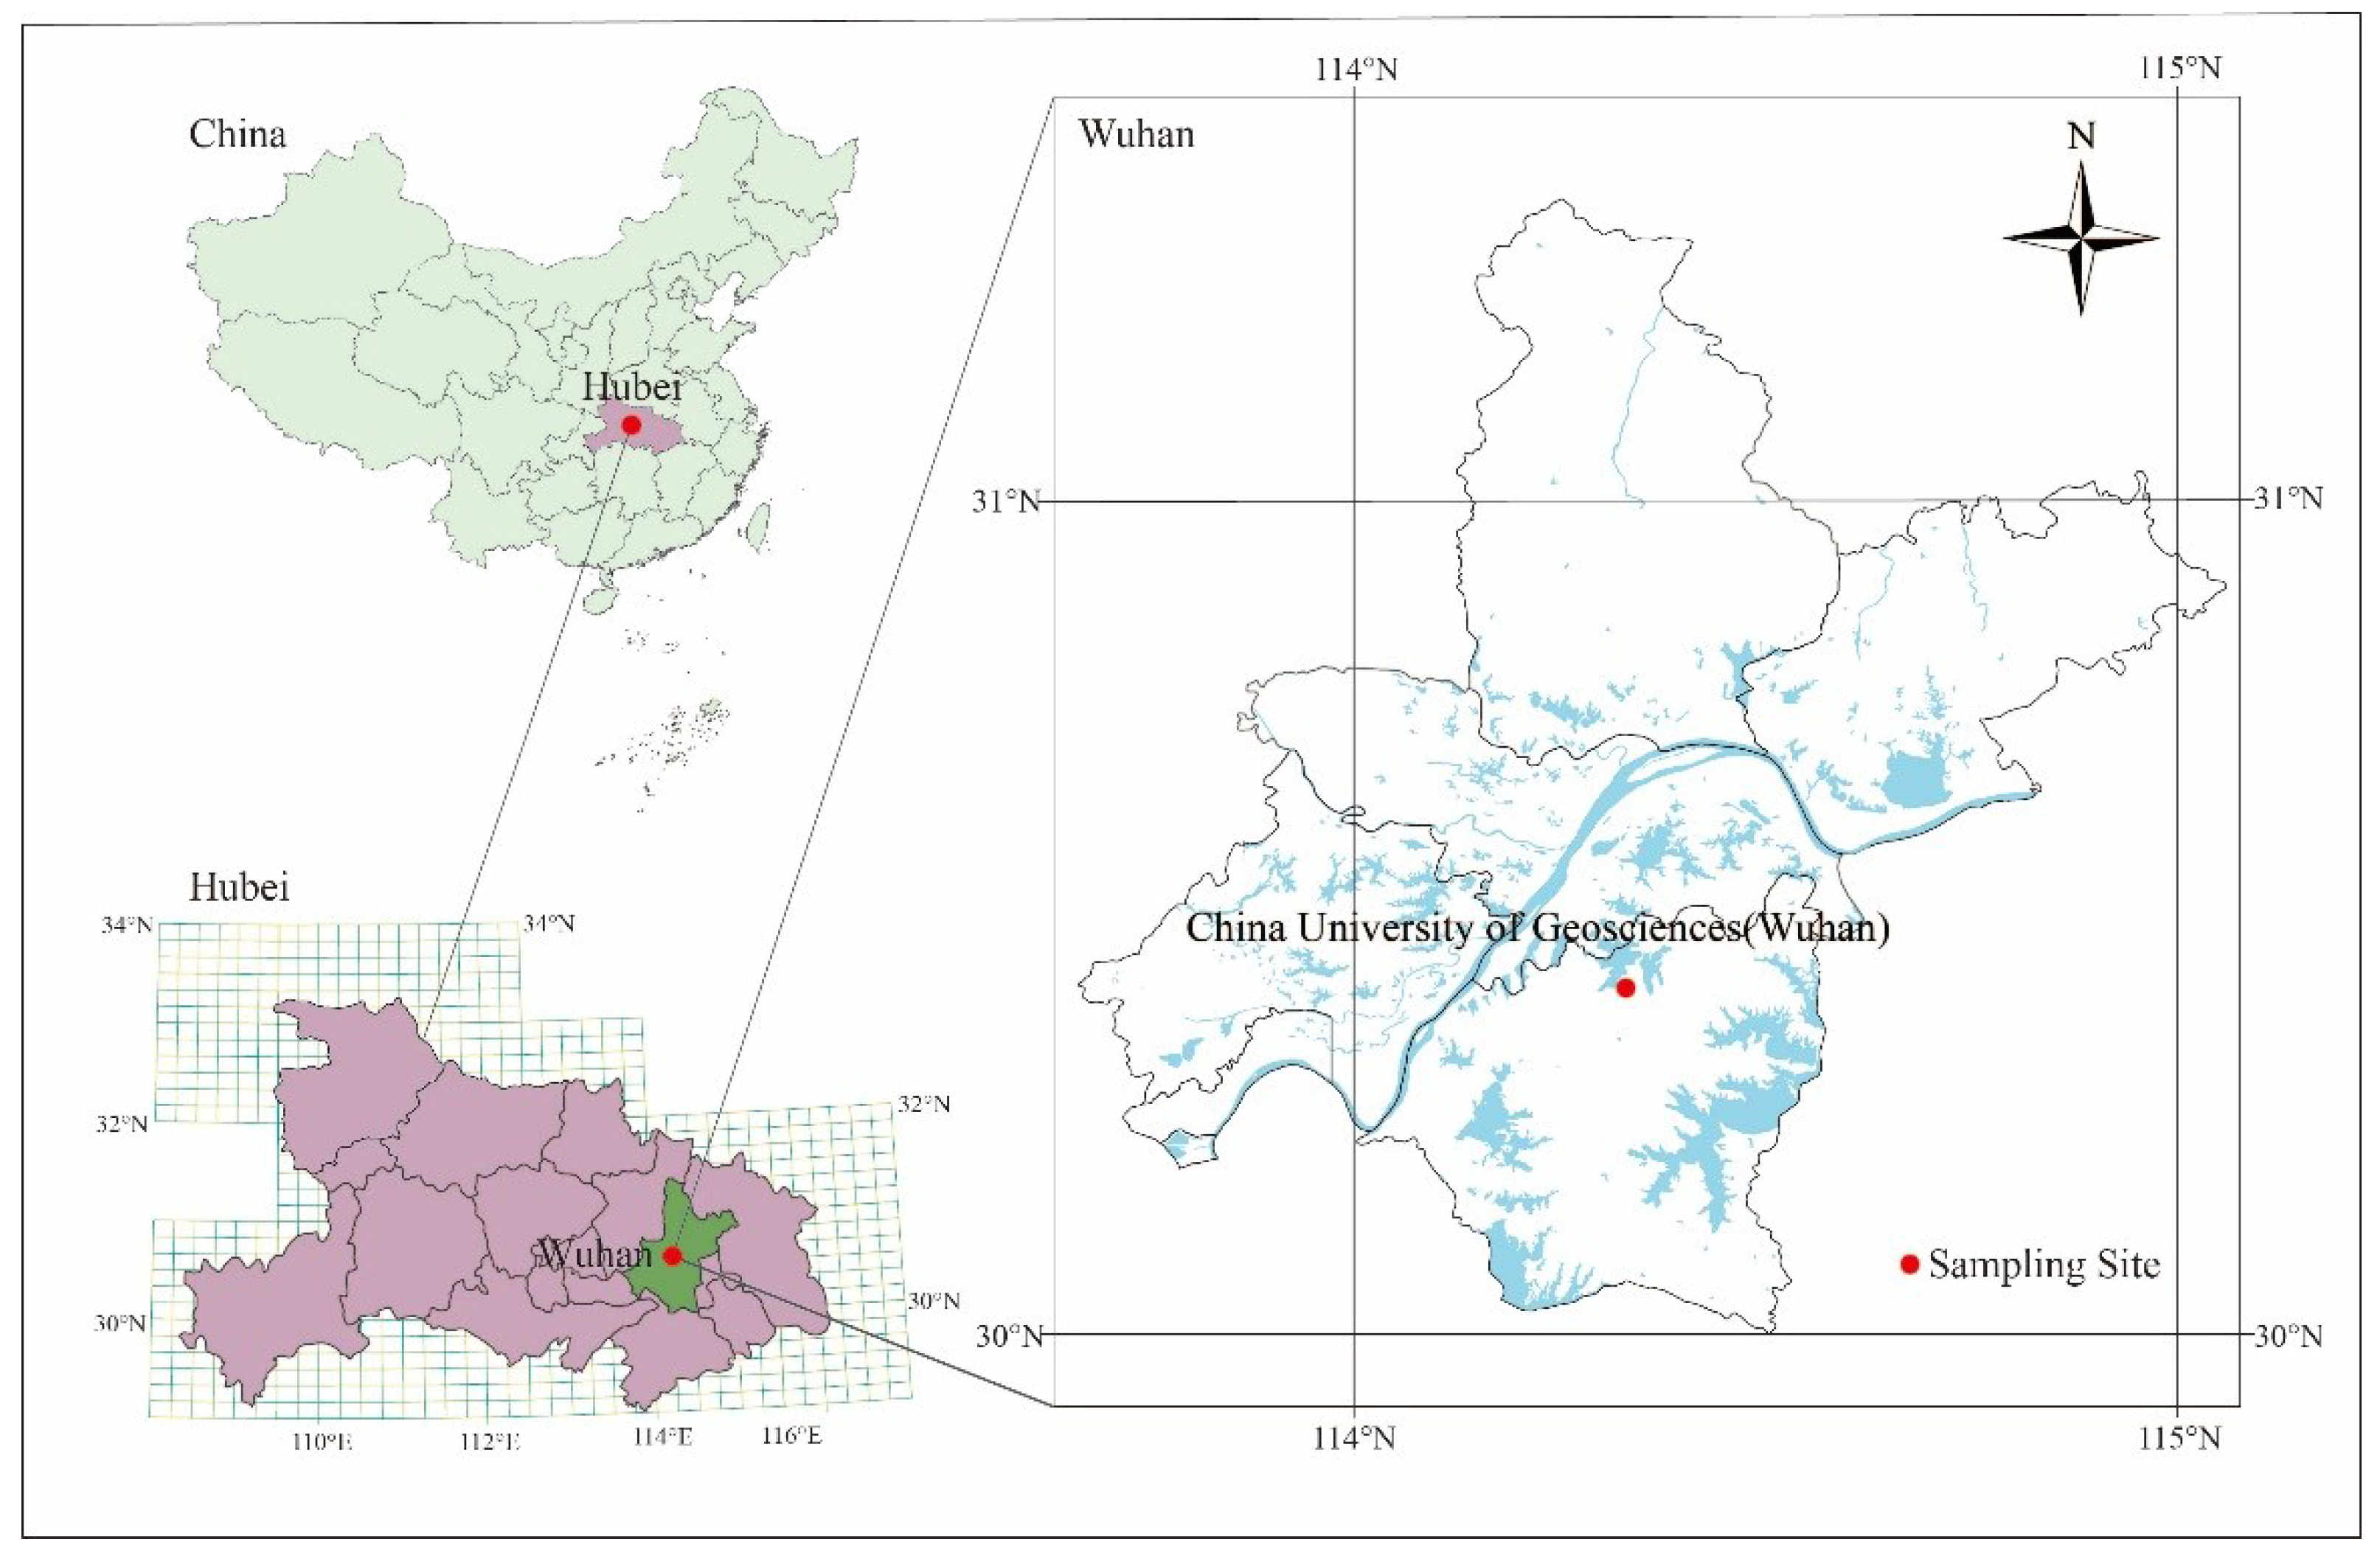
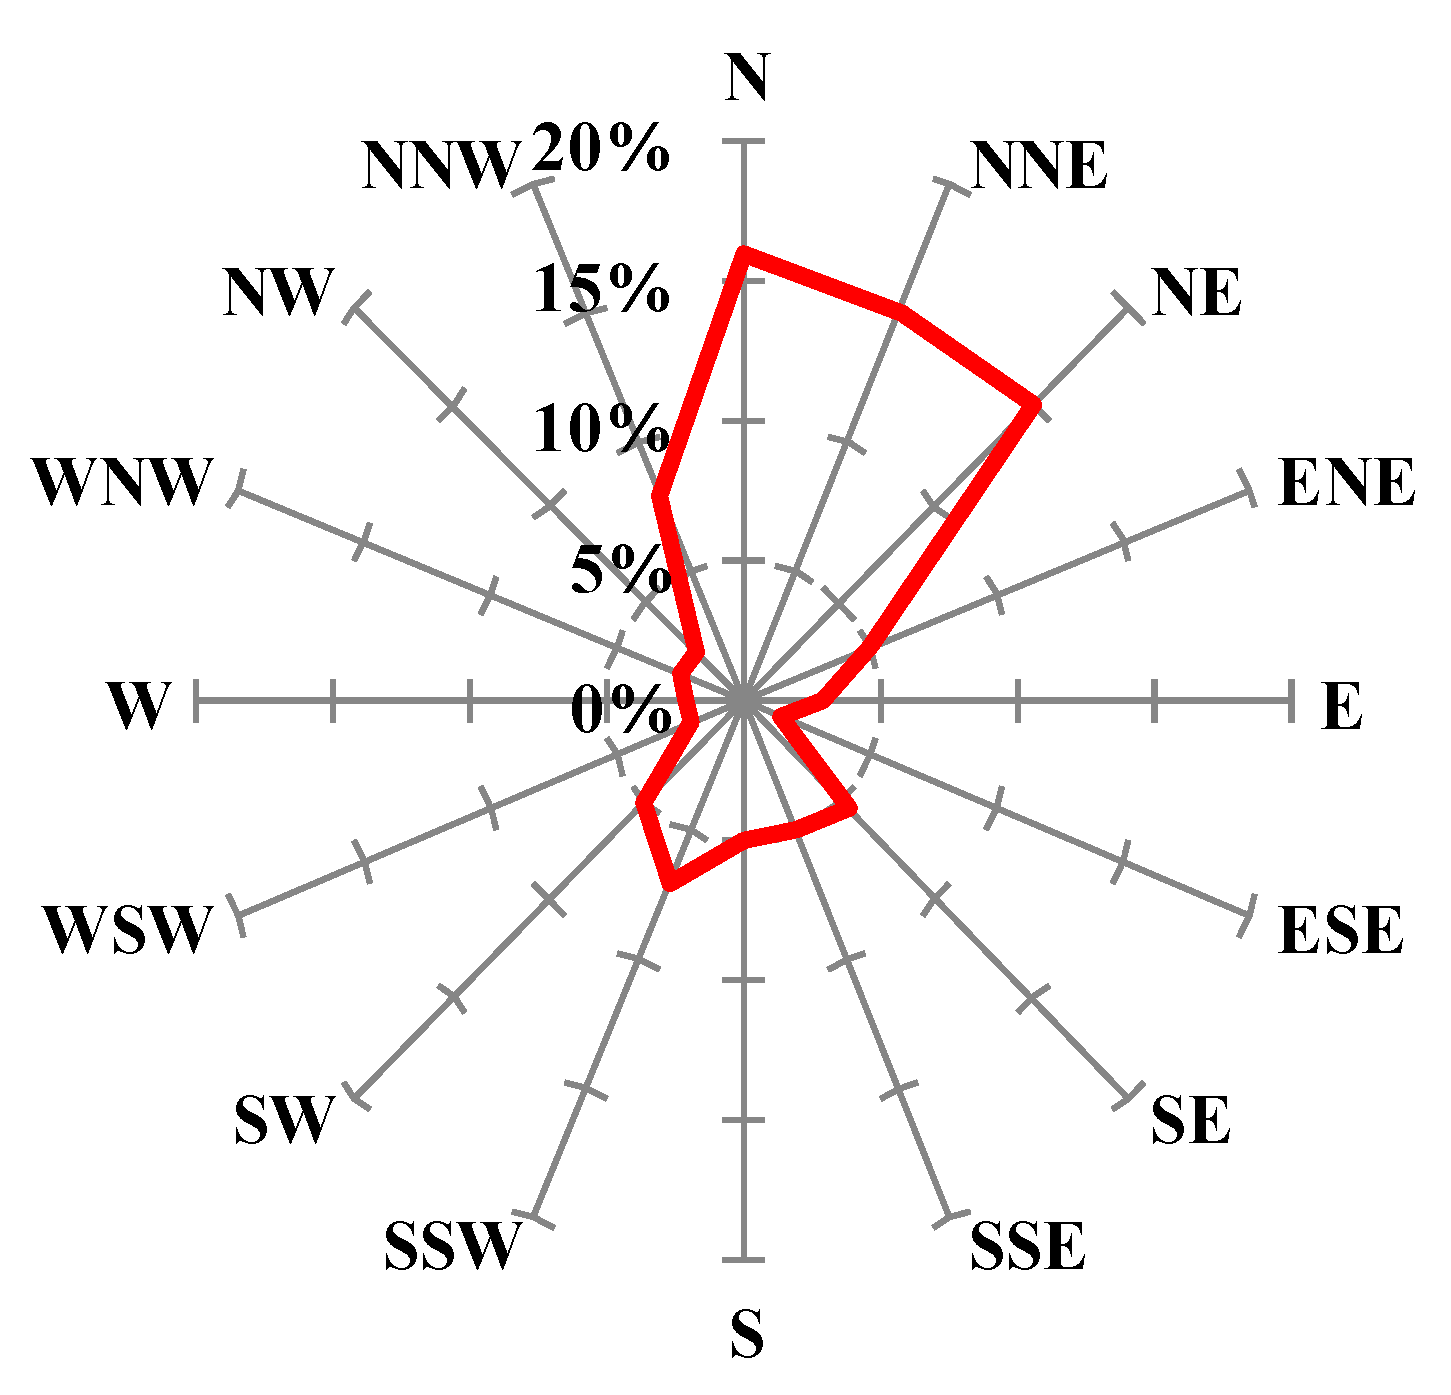
2.1. Overview of the Study Area

Wuhan is located in the middle and lower reaches of the Yangtze River, east of the Jianghan Plain, and its geographical location is between 113°41′E and 115°05′E (longitude) and between 29°58′N and 31°22′N (latitude). The climate is a subtropical humid monsoon climate, with abundant rainfall, sufficient sunshine, and four distinct seasons; in the summer, the temperature is high and precipitation is concentrated, while in the winter, the weather is moist and slightly cold. The average temperature reaches the lowest point of 3.0 °C in January and a peak of 29.3 °C in July. The summer period is as long as 135 days, and the spring and autumn periods both contain approximately 60 days. Wet and dry seasons are readily apparent, the rainfall is relatively adequate in the early summer, and the annual precipitation is 1205 mm. According to the ground monitoring datum in Wuhan, the winter has a prevailing north-northeast wind (NNE), while the summer has a prevailing south-southwest wind (SSW), and the rest of the seasons have a dominant southwest wind. The annual average wind speed is 1.1–1.2 m/s, and light wind and calm wind are frequent. Air pollutants in northeastern provinces and cities easily drift to Wuhan with the airflow direction because of the controlled northeast monsoon in the winter, which could intensify Wuhan’s air pollution. Therefore, Wuhan’s air pollution is more serious in the winter than in other seasons. The wind rose diagram in Wuhan in 2013 is shown in Figure 1.
The sampling site is on the roof of the Institute of Atmospheric Environment at the China University of Geosciences, Hongshan District of Wuhan (14°23′E, 30°31′N), at an elevation of approximately 8 m above the ground (Figure 2). From 1 January to 30 December 2014, we collected PM2.5 samples continuously and acquired 52 valid samples with Wuhan Tianhong Company’s sampling apparatus (Type TH-150F). The sampling filter used a quartz fiber filter membrane (QFF, Φ90 mm, Whatman Company, Leicestershire, UK). The sampling time started at 10 a.m. on each Wednesday and was maintained for 24 h to the next day.

2.2. Sample Analysis Method

The PM2.5 samples were weighed, and a quarter of the samples were cut up and placed into 50 mL polypropylene centrifugal tubes, to which was added 30 mL of ultrapure water. The samples were extracted at a constant temperature with an ultrasonic wave for 30 min and then stewed and filtered through a 0.45-µm-diameter micro-porous membrane. Furthermore, an inductively coupled plasma optical atomic emission spectrometer (Type ICAP6300, Thermo Fisher Scientific Inc, MA, USA) and an ion chromatograph (Type ICS-1100) were used to measure the concentrations of cations (K+, Ca2+, Na+, Mg2+, NH4+) and anions (Cl, SO42, NO3). Stringent quality checks were executed during the sample analysis processes.

3. Results and Discussion

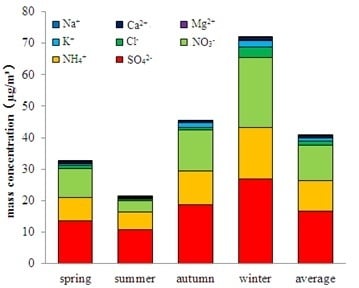
3.1. Concentration Level Analysis of PM2.5’s Water-Soluble Ions

During the monitoring period, the total mass concentration value of the eight water-soluble ions of PM2.5 was 40.96 µg/m3, which accounted for 62% of the entire mass concentration. The sequence of the concentrations of water-soluble ions in order from high to low was SO42− > NO3 > NH4+ > Cl > K+ > Ca2+ > Na+ > Mg2+, and the three secondary ions SO42−, NH4 + and NO3 were the main water-soluble ions, which were separately converted from gas precursors SO2, NOx and NH3 and accounted for 92% of the total measured water-soluble ions.
The concentration level of SO42− was the highest of the eight water-soluble ions and was lower than the values for the northern cities Beijing and Tianjin and greater than the values for the southern cities Shanghai, Guangzhou and Hong Kong (Table 1, [15,23,24,25,26,27]), mainly due to the emissions of industrial pollution sources and coal sources in Wuhan. The concentration levels of NO3 and NH4+ ions were basically identical to the concentration of SO42−. The high concentration of NO3 was based on the number of motor vehicles rising constantly in Wuhan in recent years. For example, take the NOx emissions (Table 2), we can find that the industrial NOx emission (stationary source) was the main source of NOx. Among them, NOx emission from thermal power industry was the primary source of pollution and accounts for 35.06% in the total NOx emission, followed by vehicle exhaust emissions accounts for 34%, suggesting that NOx emissions have a tendency to increase gradually. In addition, as seen from the seasonal distribution of NO3, the concentration level in the winter and autumn was significantly higher than that in the spring and summer because the high temperatures in the spring and summer accelerated the volatilization loss of nitrate.
The annual average concentration of NH4+ in the study was second only to that of Beijing and was relatively high in the winter and low in the summer. NH4+, converted from NH3, is an important ion that reacts with SO42− and NO3 in the aerosol phase to form secondary particles. NH3 mainly comes from agricultural production, industrial emissions, vehicle exhaust emissions and other sources. Attributed to the sharp rise of motor vehicles in Wuhan, a large number of nitrogen compounds are emitted into atmosphere by vehicle exhaust and produce ammonium nitrate through a chemical reaction with NH3. Meanwhile, urban population growth (increasing the consumption of energy) and industrial economic expansion (such as thermal power industry, iron and steel industry and cement industry) are also important factors leading to an increase in ammonia emissions.

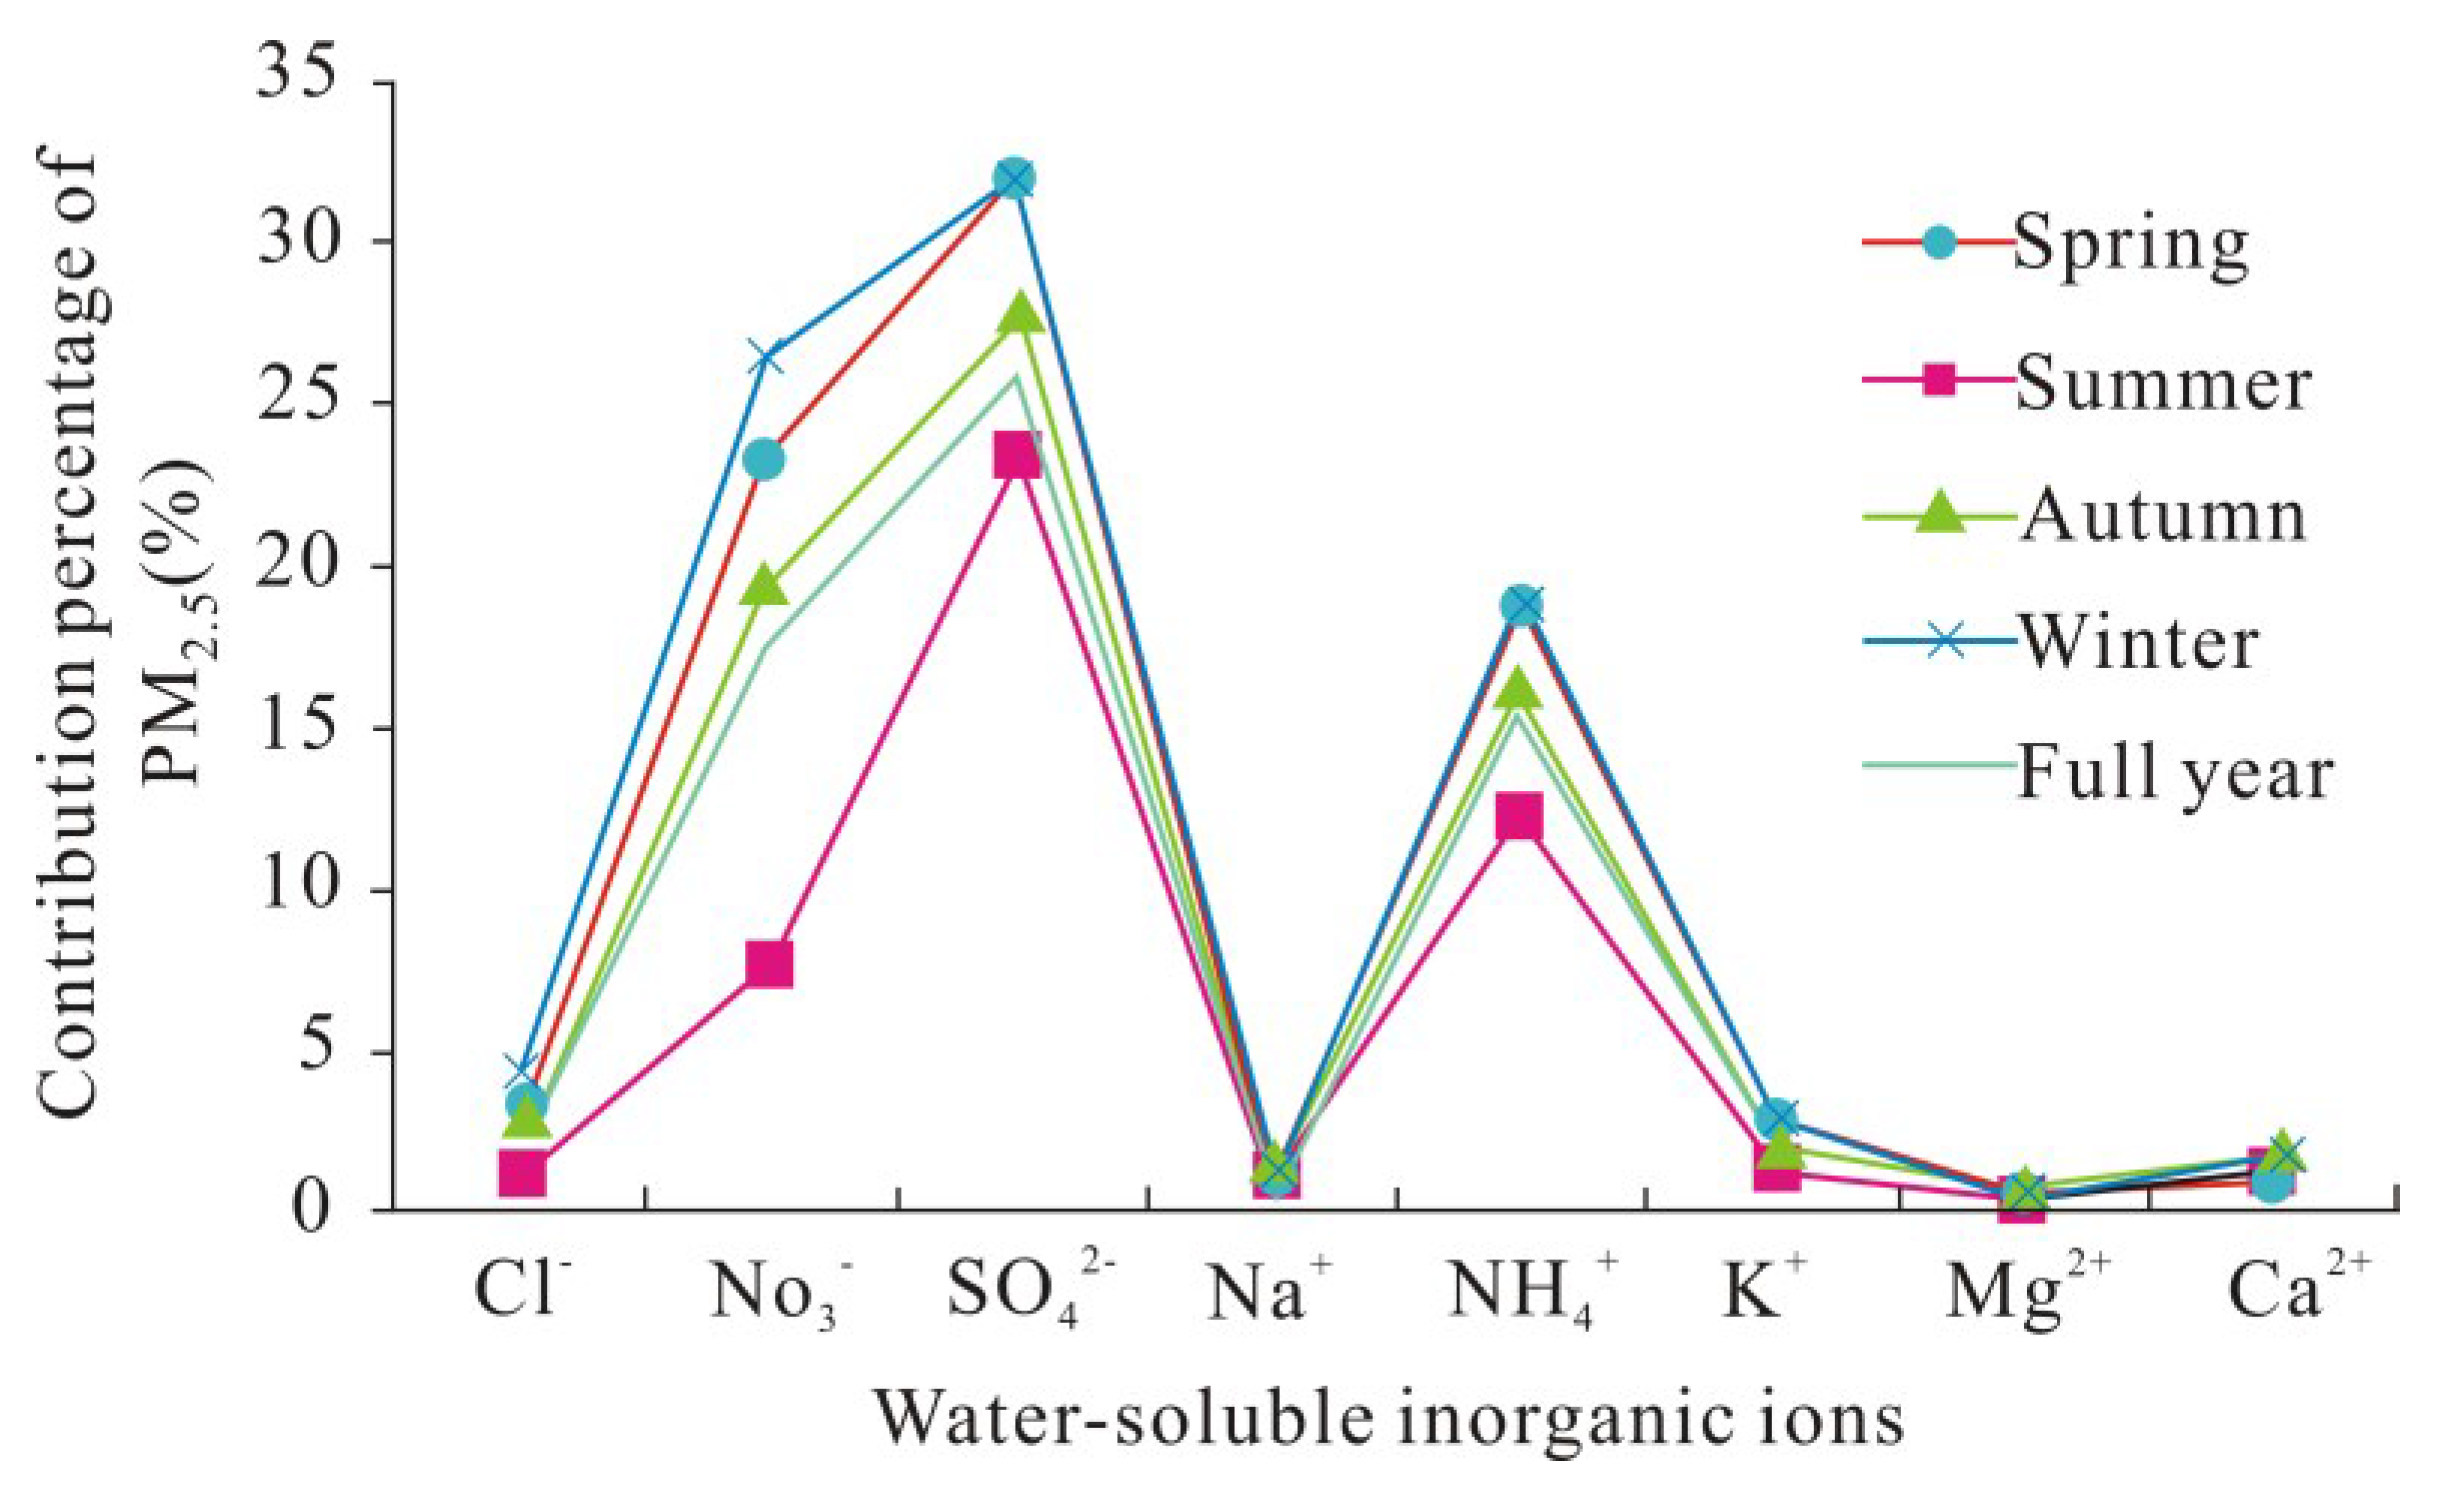
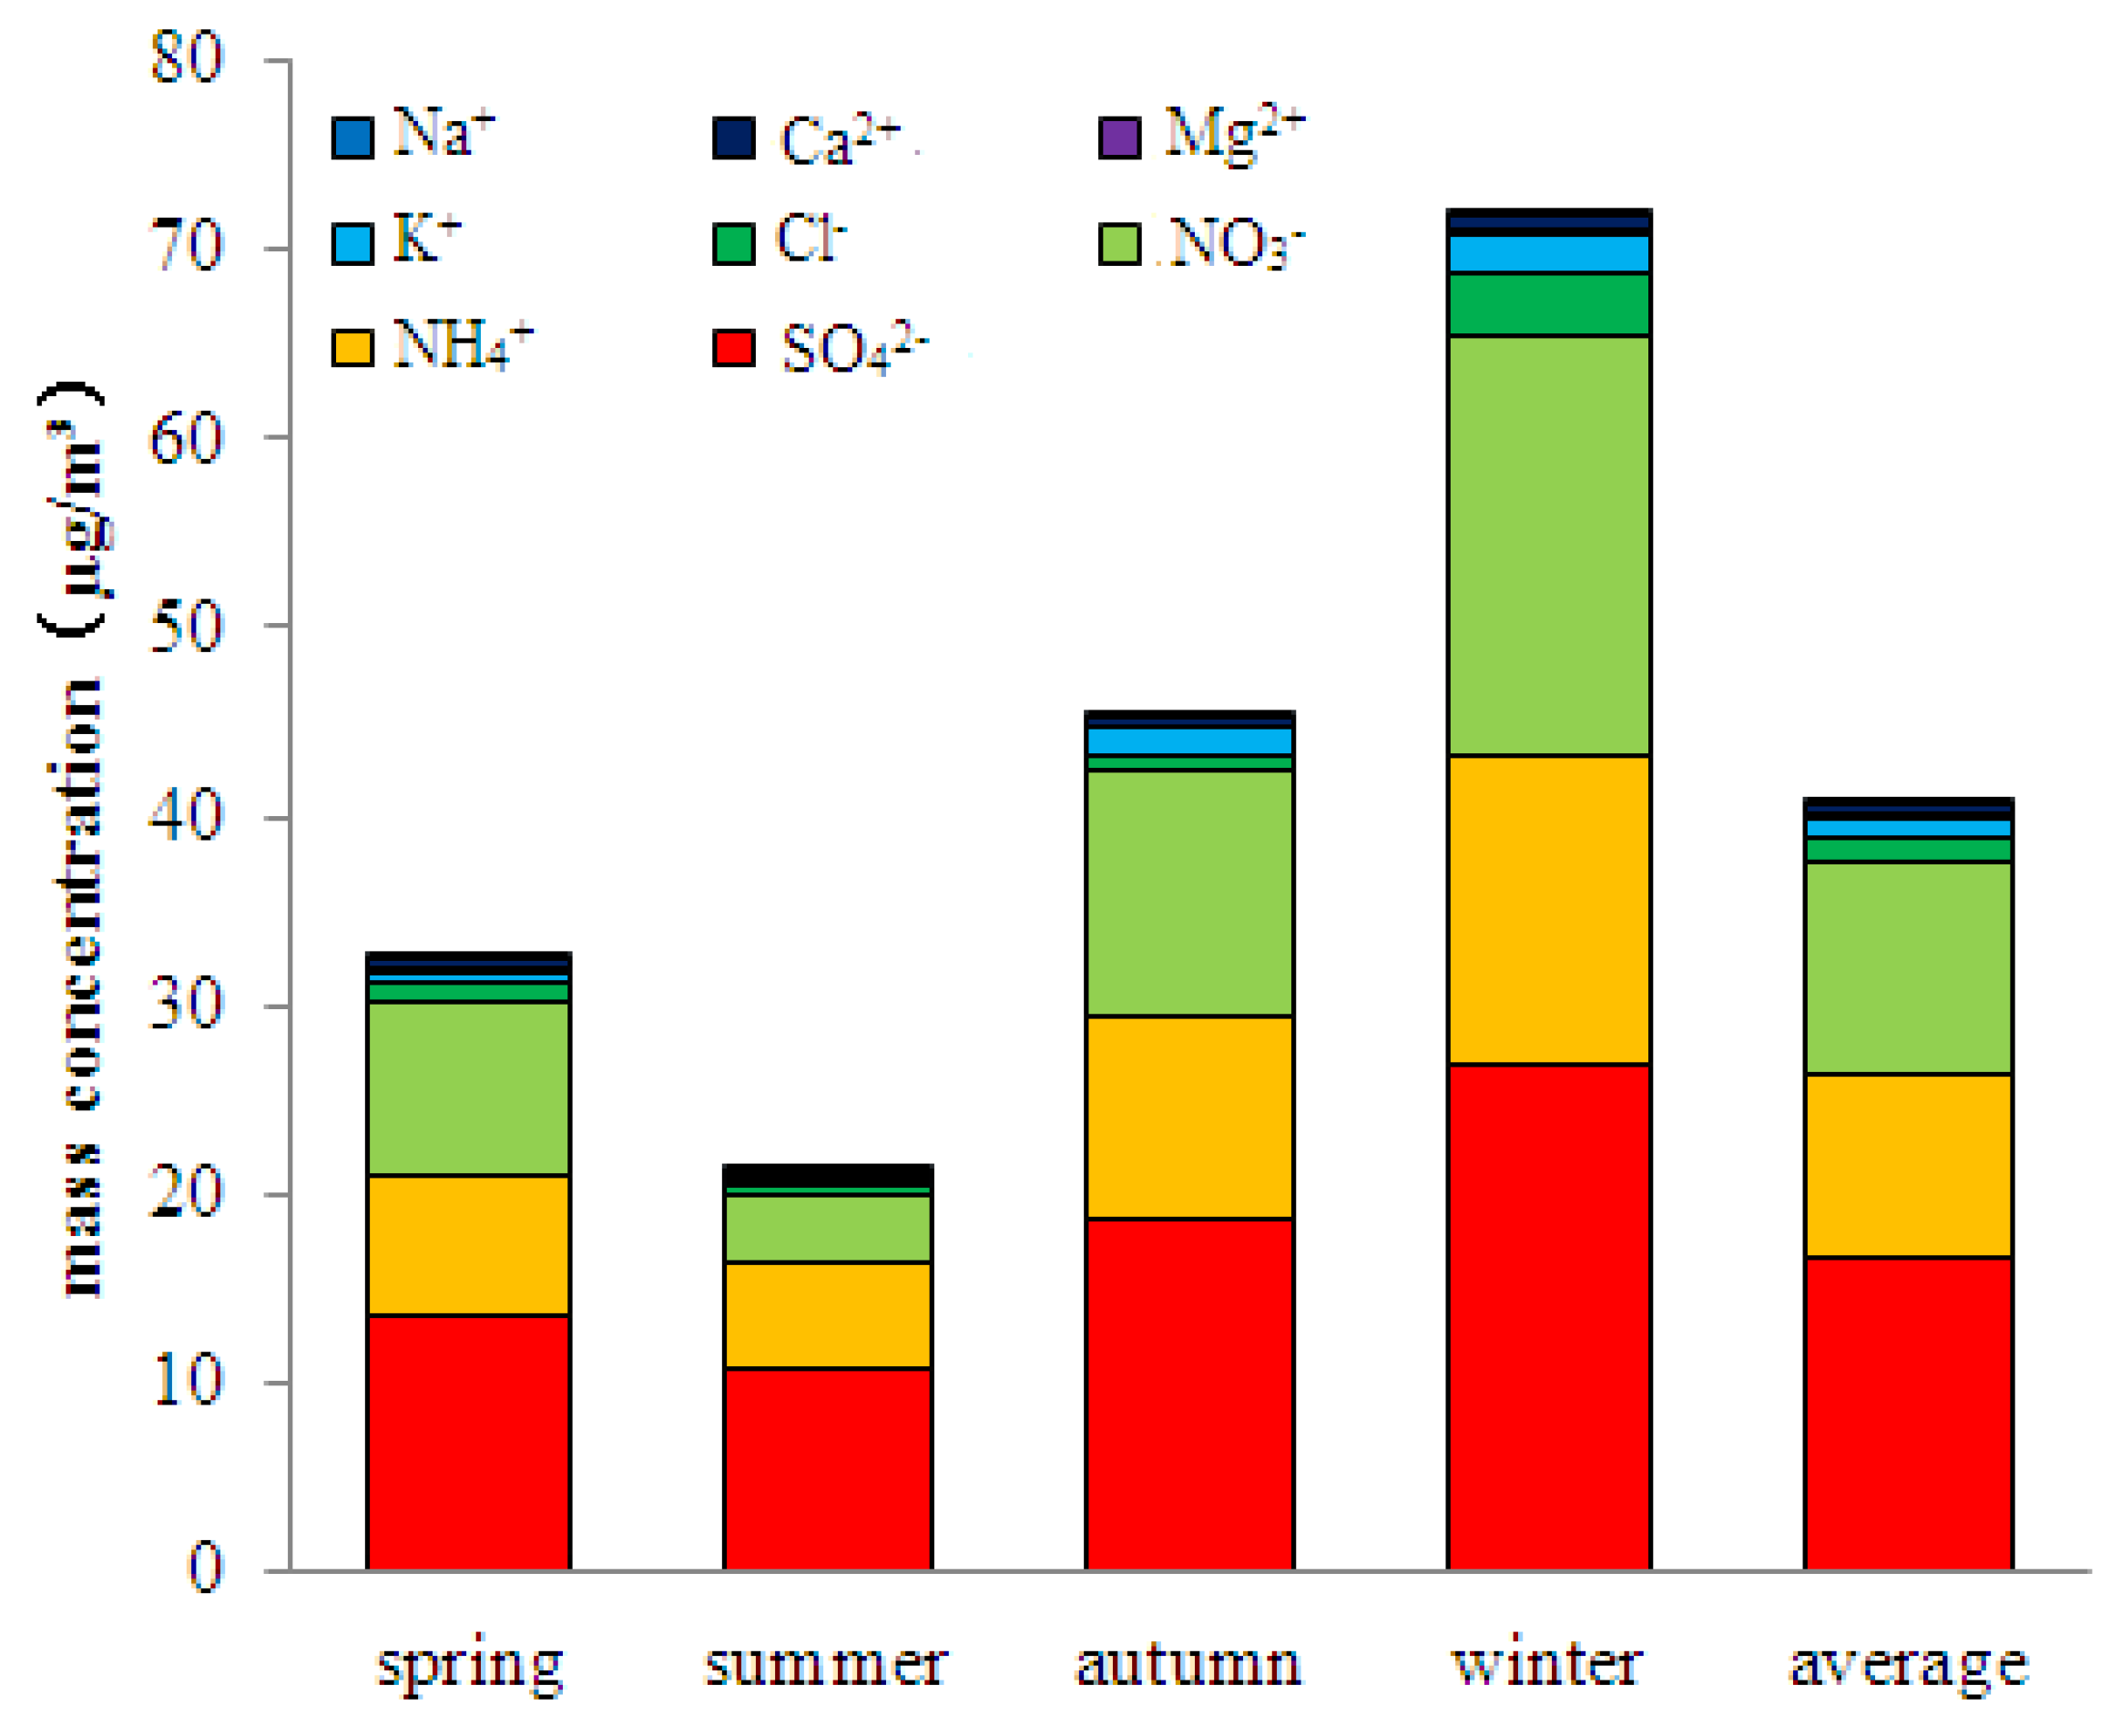
3.2. Seasonal Variation Characteristics of Water-Soluble Ions

The mass concentration variation of water-soluble ions in PM2.5 presented distinctly seasonal distribution features. The sequence of the mass concentration levels in the four seasons was winter > spring > autumn > summer. The seasonal distribution of the cumulative concentration of eight water-soluble ions is shown in Figure 3. The concentration sum of the three main secondary ions (SO42−, NO3, NH4+) in the four seasons accounted for 79%, 46%, 67% and 85% of the total soluble-water ions, respectively, and was highest in the winter. The average mass concentration of the eight ions was 40.96 μg/m3, which composed 63% of the total mass concentration of the water-soluble ions.
As shown in Figure 4, the proportion of concentration contribution of the three main ions was SO42− (31.64%) > NO3 (26.27%) > NH4+ (19.27%) in winter, and the same order in spring and autumn, but was SO42− (23.11%) > NH4+ (12.15%) > NO3 (7.38%) in summer, implying concentration value of NH4+ was ascending comparing with the value of NO3. High temperature in summer is advantageous for the decomposition of solid material NH4NO3 and forming into gaseous materials NH3 and HNO3. After two-step chemical reactions (step one: NH3 + H2O = NH3·H2O; step two: NH3·H2O = NH4+ + OH) in the atmosphere, NH3 transforms into NH4+ compounds, causing the concentration level of NH4+ to rise.
Similar to the seasonal variation tendency of all water-soluble ions, the concentration of SO42− was greatest in the winter, followed by the autumn, and was the lowest in the summer. The concentration value in the winter was 2.5 times that of the summer. One reason for the above situation is that citizens generally burn coal to keep warm in the winter. In addition, little rain and a dry climate in the winter cause SO42− to remain in the atmosphere for a long time, so its concentration is elevated. On the contrary, high temperatures and rainy weather in the summer are not conducive to the formation of SO42−.
The concentration levels of Ca2+ and Mg2+ experienced similar seasonal varying trends, such that the values decreased as follows: winter > autumn > spring > summer. The concentrations of Ca2+ and Mg2+ in the winter were 1.9 times and 4.3 times those of the summer, respectively. As typical ions of flowing dust [29], the concentrations of Ca2+ and Mg2+ are immensely influenced by seasons and anthropic actions. On one hand, the winter climate with dry weather and little rain reduces wet subsidence of Ca2+ and Mg2+; on the other hand, with accelerating urbanization processes in recent years in Wuhan, a large number of surfaces from construction operation are emerging every year, thus increasing dust sources and resulting in the rise in the concentrations of Ca2+ and Mg2+ ions. Conversely, high temperatures and rainy weather in the summer provide beneficial conditions for the settlement of Ca2+ and Mg2+ compounds, which causes the concentrations of Ca2+ and Mg2+ ions to drop.

3.3. Concentration Equivalent Ratio Analysis of NO3/SO42−

Concentration equivalent normality is defined as the number of equivalents per liter of solution, where the definition of an equivalent depends on the reaction taking place in the solution. For an acid-base reaction, the equivalent is the mass of the acid or base that can furnish or accept exactly 1 mole of protons (H+ ions). The mass concentration equivalent ratio of NO3 and SO42− could be used as relative significant index to measure the relative contribution of mobile source (vehicles) and fixed sources (coal) for nitrogen pollution and sulfur pollution in the atmosphere [24]. Arimoto et al. (1996) attributed the high ratio of NO3/SO42− to mobile sources, which had a greater contribution to the concentrations of regional atmospheric pollutants [30]. The sulfur contents in gasoline and diesel in China were 0.12% and 0.2%, respectively. The NOx/SOx ratios from comburent of gasoline and diesel fuel were approximately 13:1 and 8:1, respectively. Coal’s sulfur content is 1%; the ratio of NOX/SOX from coal’s combustion is approximately 1:2. Therefore, NOX and SOX can act as tracers of mobile sources and fixed sources separately. When the concentration equivalent ratio of NO3/SO42− exceeds 1, it means that pollution sources of the observation point are dominated by mobile sources, while fixed sources play major roles when the ratio is below 1 [30]. The equivalent ratios of NO3/SO42− in Wuhan were 0.73, 0.32, 0.70 and 0.83 in the spring, summer, autumn and winter, respectively. The annual average equivalent ratio of NO3/SO42− in Wuhan was 0.64, which is higher than the value of 0.73 in Changbai Mountain and the value of 0.46 in Nanjing, lower than the value of 0.83 in Shanghai, and essentially consistent with the value of 0.64 in Beijing [31]. The results revealed that the main pollution source in Wuhan was a fixed pollution source, which was consistent with the research of Zhang et al. [22].

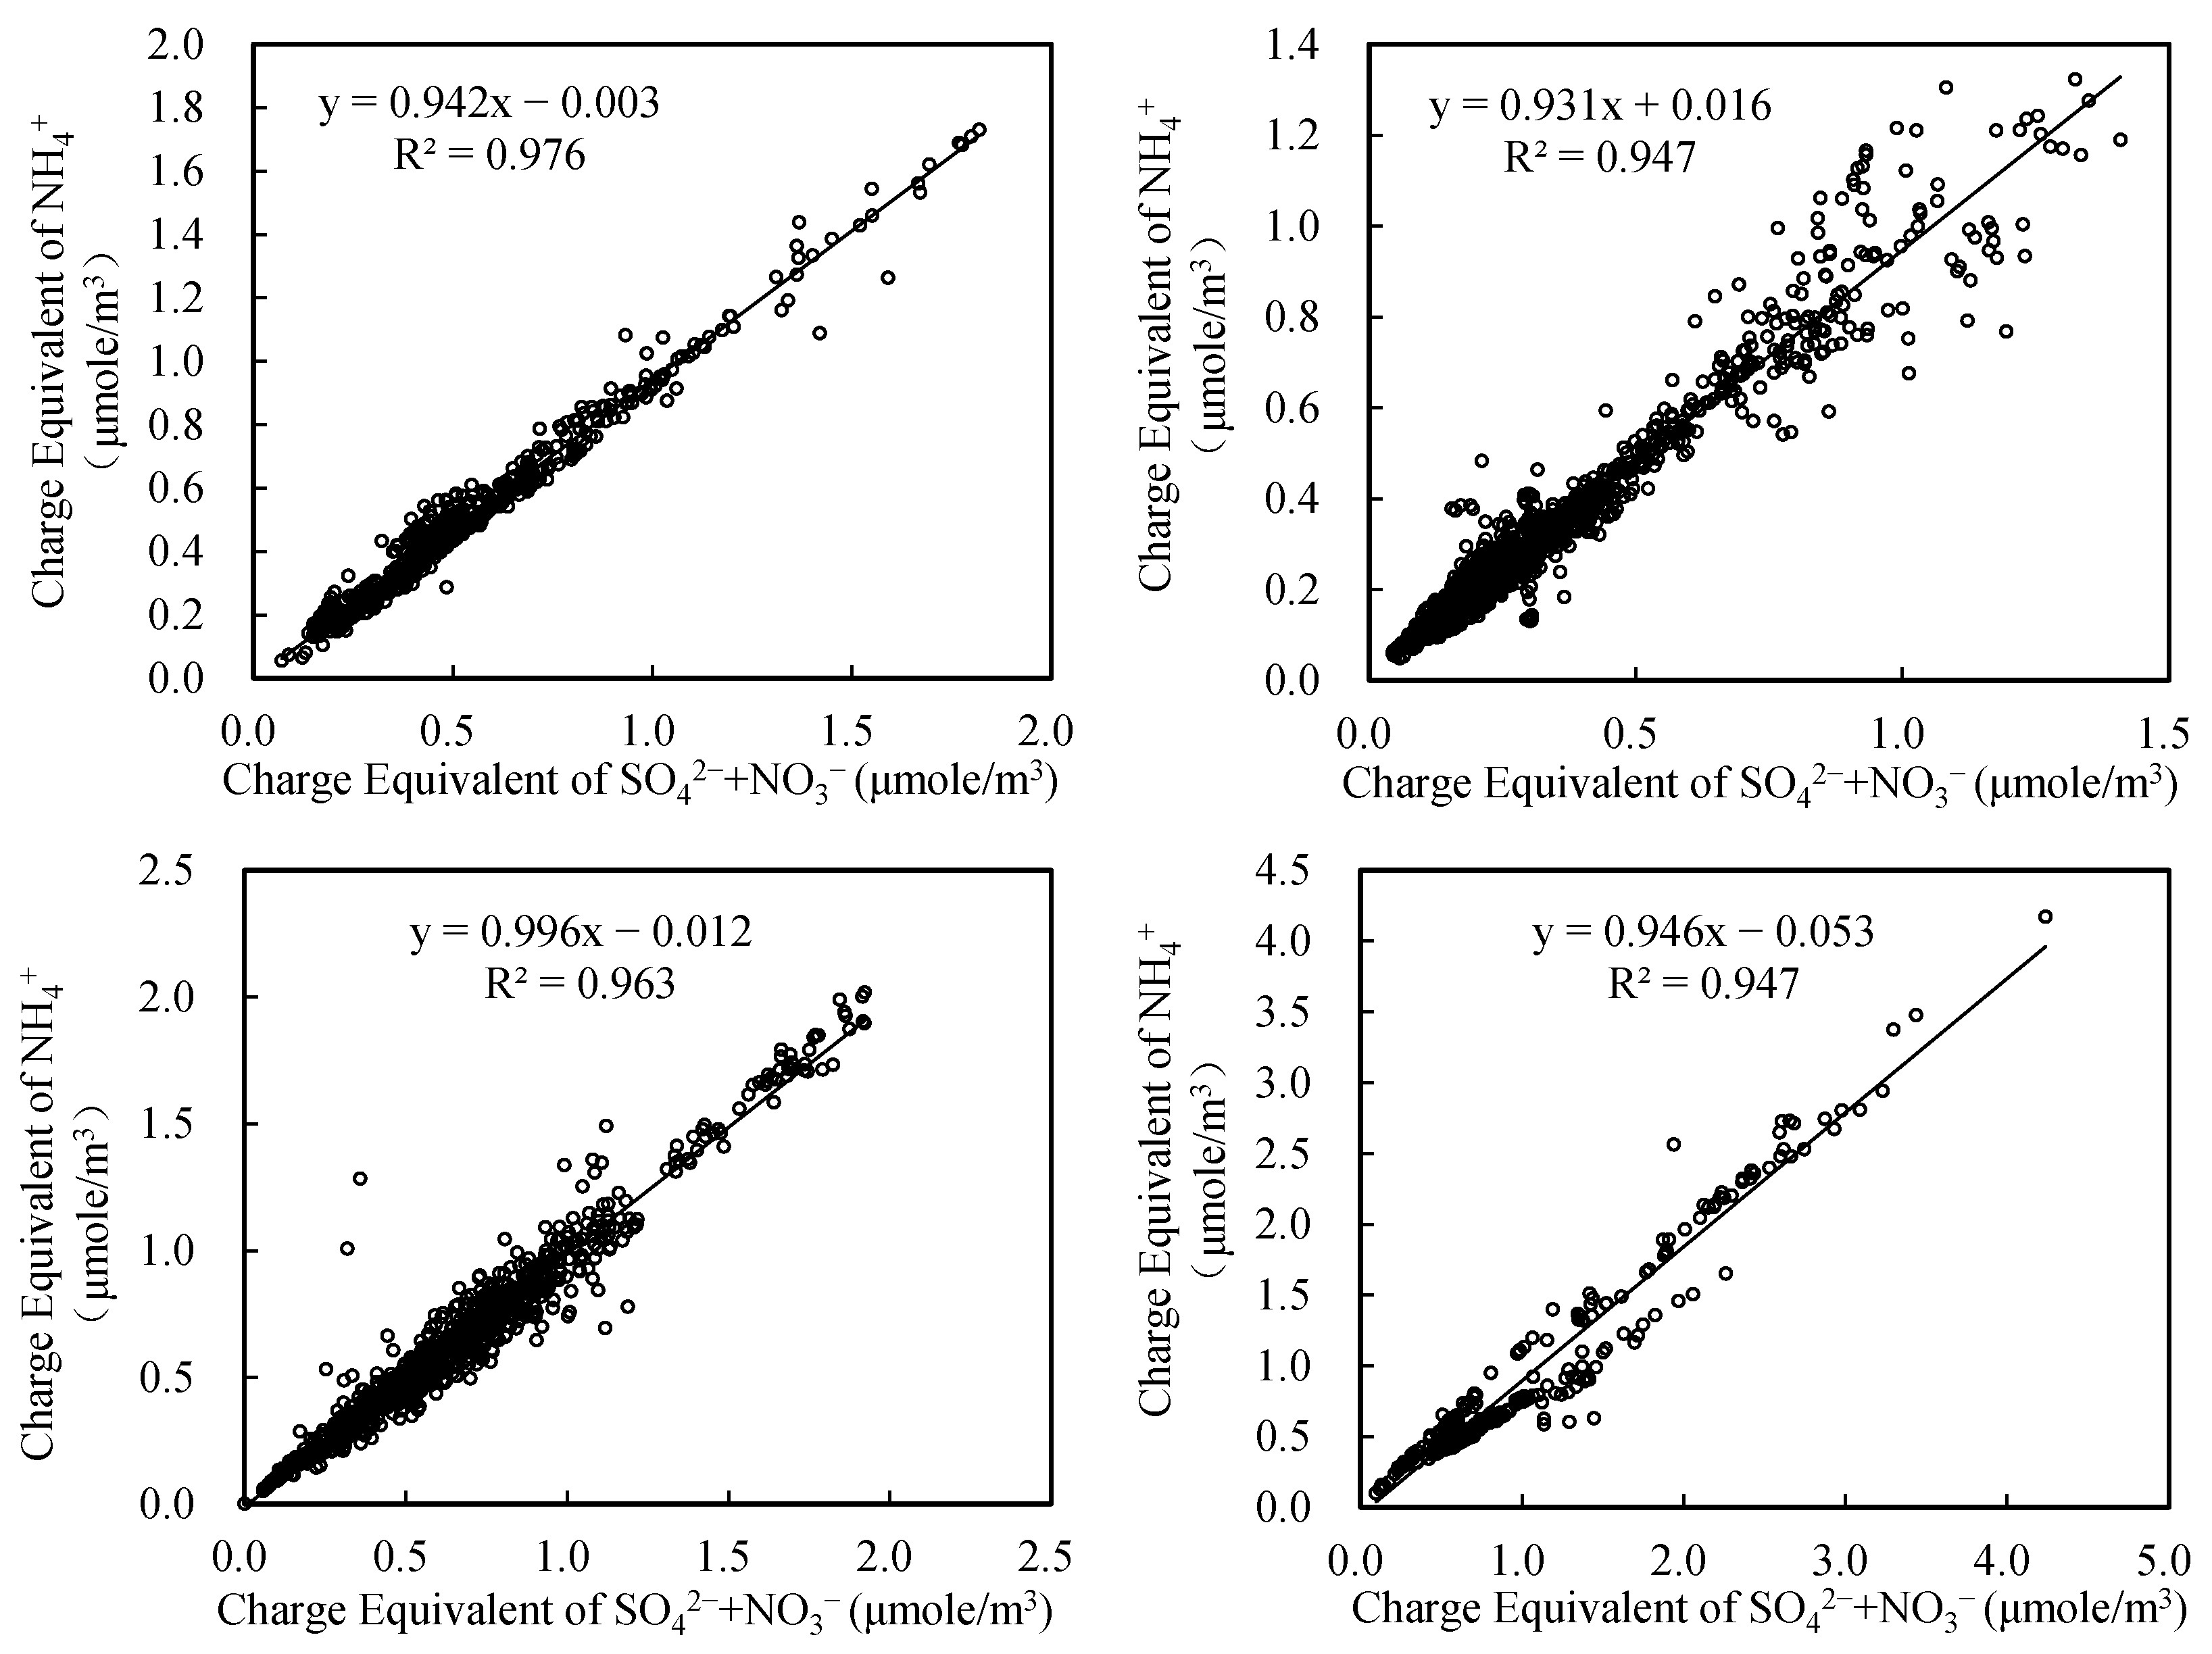
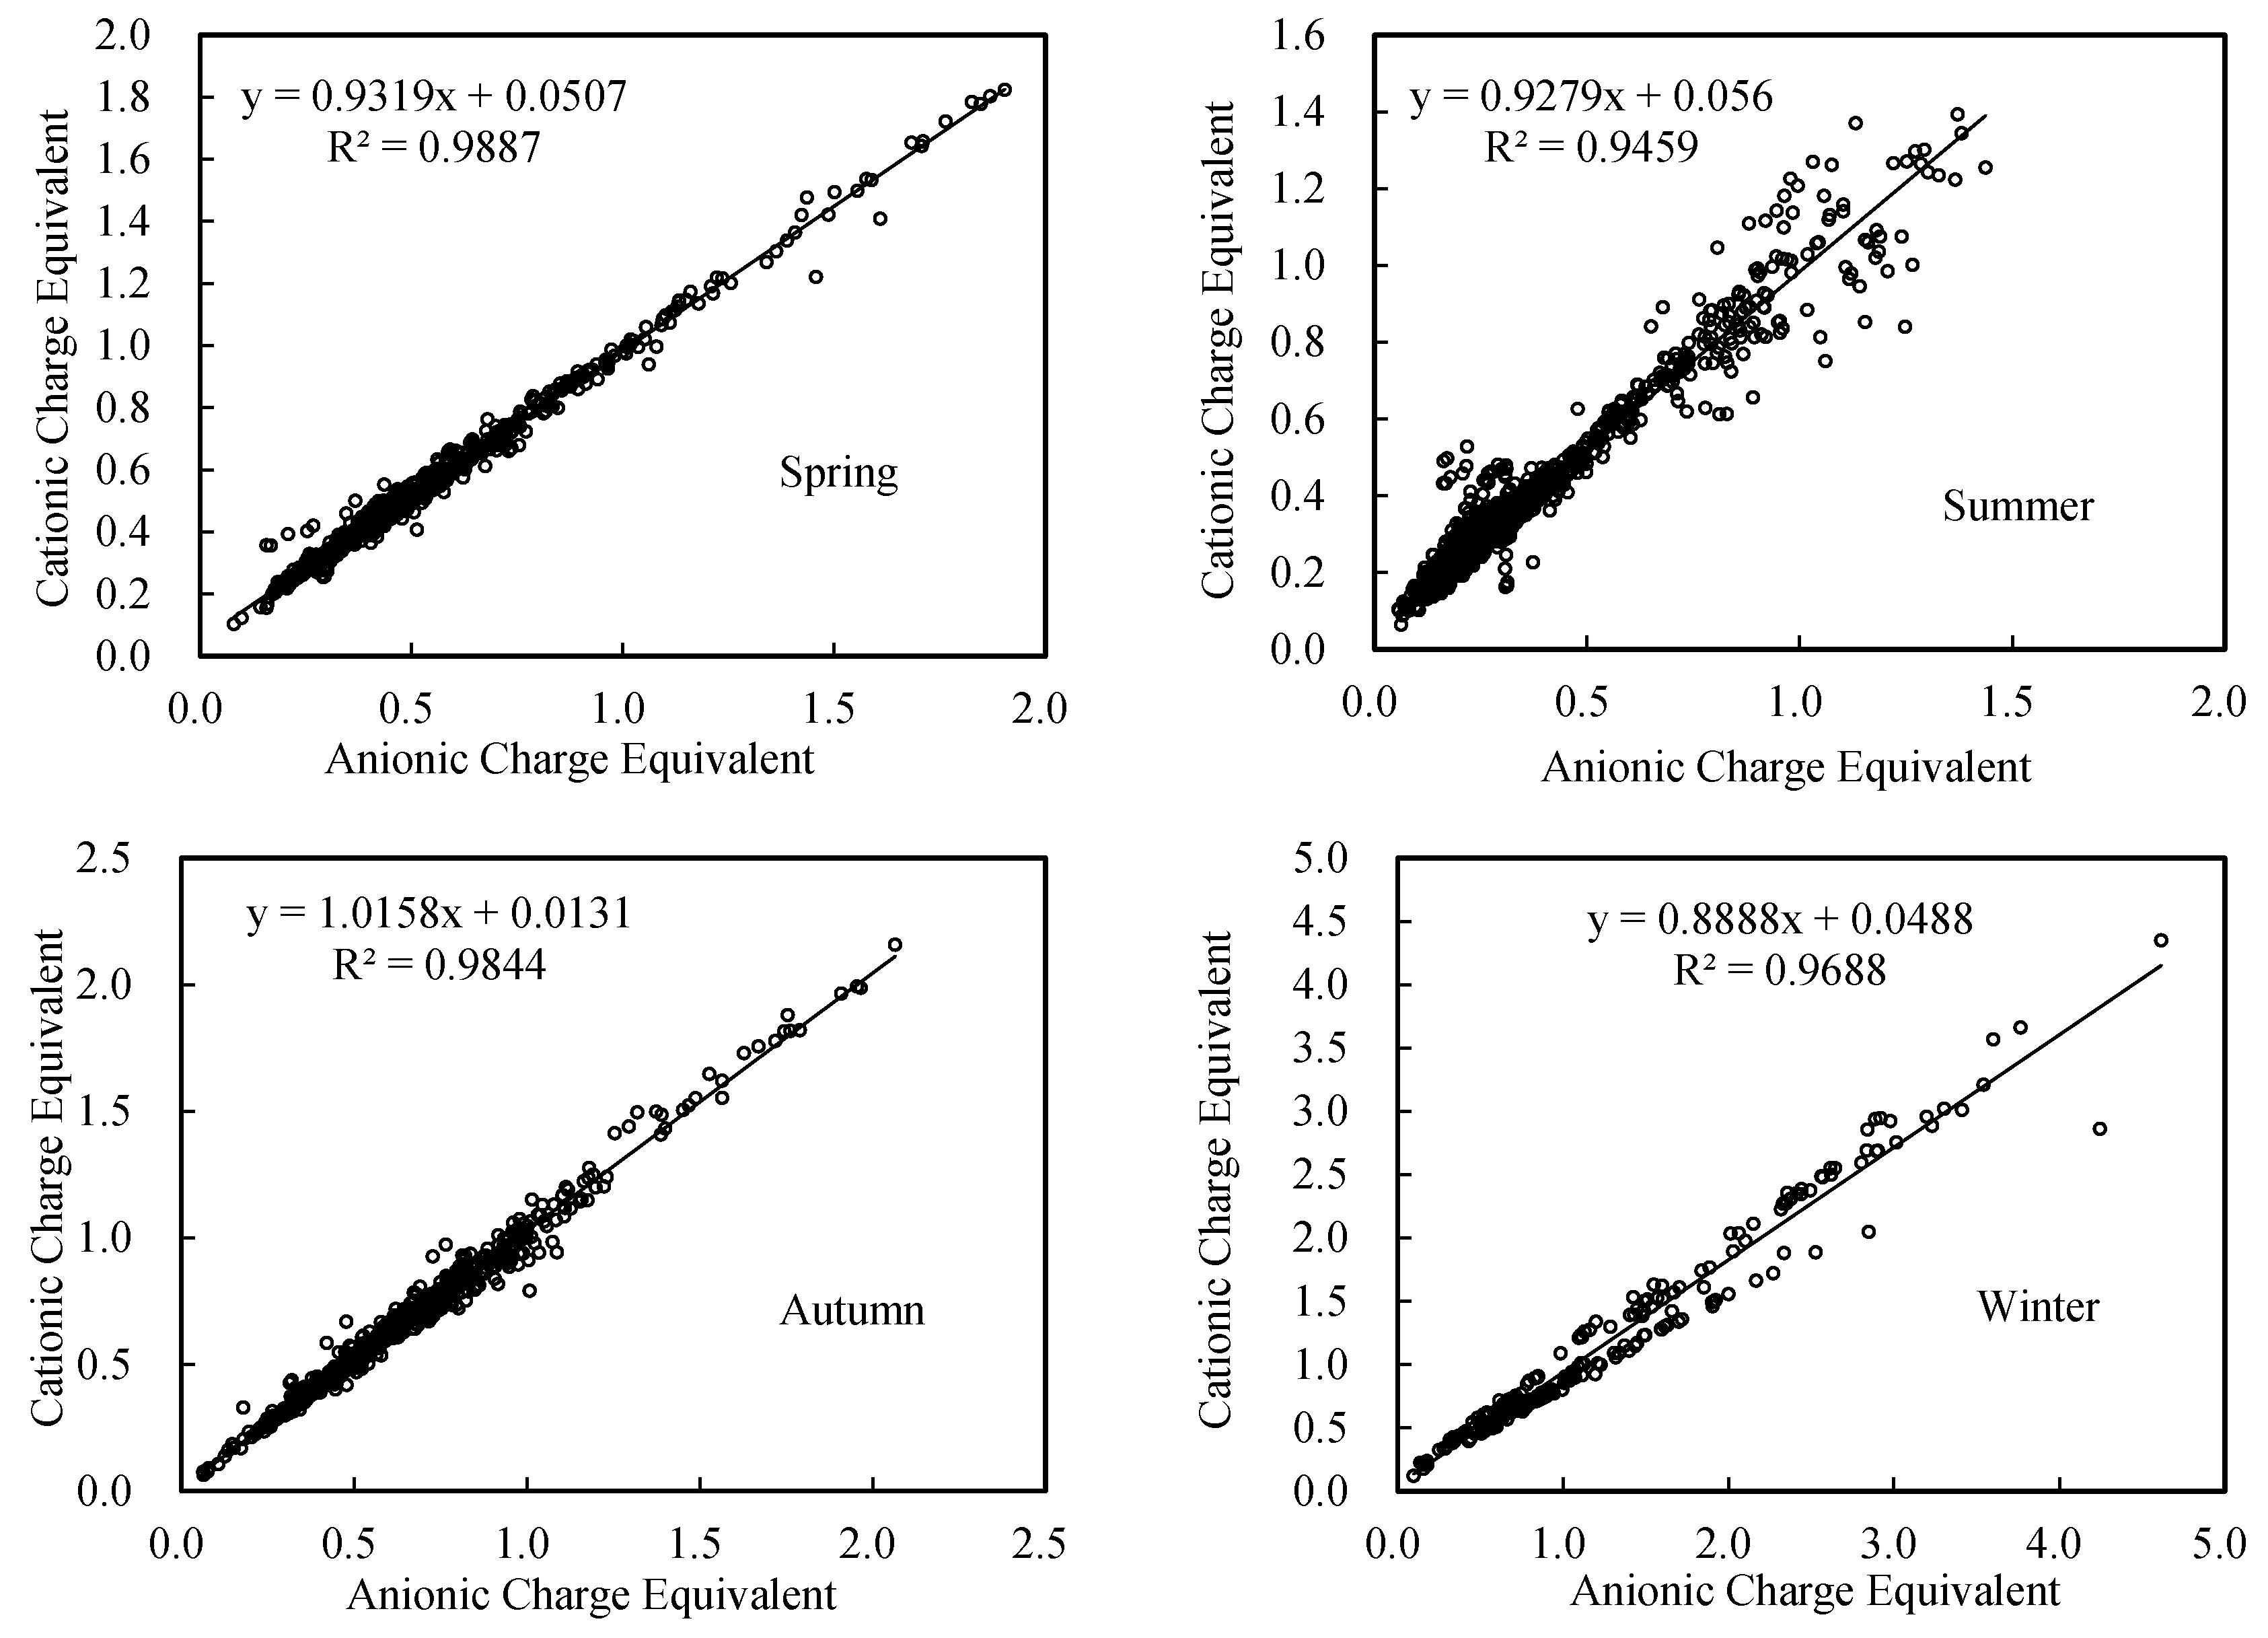
3.4. Charge Balance Analysis of Water-Soluble Ions

Previous studies showed that the charge balance of water-soluble ions in PM2.5 could be used to analyze the importance of the contribution of water-soluble ions to the mass concentration of PM2.5 [14,32,33]. According to the analysis of data from the experiments, the charge balance figures of PM2.5’s anions and cations in the four seasons in 2013 are drawn in Figure 5.
The slope value of the linear fitting lines reached 0.9319 (R2 = 0.9887), 0.9279 (R2 = 0.9459) and 1.0158 (R2 = 0.9844) in spring, summer and autumn, respectively. All values were nearly 1, while the slope value in winter only reached 0.8888 (R2 = 0.9688), and had a relatively large gap with 1. These results revealed that the main ionic compositions in PM2.5 in spring, summer and autumn were SO42−, NO3, Cl, Na+, K+, NH4+, Mg2+ and Ca2+, the eight ions that the experiments analyzed. By contrast, cationic charge numbers were slightly low in winter, revealing that there were some other cationic ions not detected except those had been measured in this study (Na+, K+, NH4+, Mg2+ and Ca2+), such as H+ [34], organic cations or heavy metal ions (Zn2+, Cu2+, etc.), which reflected that the ion components of PM2.5 in winter were much more complicated than that in spring, summer and autumn, and resulted from the more serious air pollution problems in winter compared with other seasons. Morever, existing research have shown that the mass concentrations of PM were higher in winter than other seasons, hence it carried a certain probability that PM2.5 contained organic cations [7] or heavy metal ions (Zn2+, Cu2+, etc.) in winter [35]. This is not only a significant feature of the PM2.5 in winter, but also one of the reasons that the days of heavy pollution weather in winter were more than the days in the other three seasons.

3.5. Correlation and Seasonal Difference Analysis of Water-Soluble Ions

The existing forms of water-soluble ions in PM2.5 are diverse in different air pollution extents or different seasons, which have certain effects on atmospheric visibility, the PH of particulate matter, the viability of chemical reactions, etc. The correlation analysis method is usually used to study the existing forms of water-soluble ions [36]. As the correlation coefficient between water-soluble ions increases, the correlation between water-soluble ions increases.
The Pearson correlation coefficients of the water-soluble ions of PM2.5 in all four seasons are shown in Table 3, Table 4, Table 5 and Table 6 below. High correlations existed between NH4+ and SO42−, NH4+ and NO3, Mg2+ and SO42−, Ca2+ and SO42−, K+ and Cl, Na+ and Cl, which were consistent overall in one season. Nevertheless, seasonal differences lie in water-soluble ions. The correlation levels between NH4+ and SO42−, NH4+ and NO3 were significantly higher than the level in the summer, slightly exceeding the value in the autumn, while distinctly lower than the degree in the winter. The correlations between Mg2+ and SO42− were higher in the spring, summer and autumn, but not in the winter, according to the sequence that the correlation coefficient spring > summer > autumn > winter. The correlation between Mg2+ and Cl was higher than the level between Mg2+ and SO42−. The correlation of Ca2+ and SO42− followed the order of spring > autumn > summer > winter, and the correlation between Ca2+ and NO3 was higher than that between Ca2+ and SO42−. The correlation between K+ and Cl followed the order autumn > winter > spring, and the correlation level of K+ and SO42− was obvious than the level of K+ and Cl. NH4+, SO42− and NO3 in the weak acid environment is reversible reaction, and reaction process is as follows:
2NH4+ + SO42− ↔ (NH4)2SO4
H+ +3NH4+ + 2SO42− ↔ (NH4)3H(SO4)2
NH4+ + NO3 ↔ NH4NO3
NH4+ as a kind of weak acid ion, is an incomplete reaction in aqueous solution, which existing in free form has not been involved in the charge balance in the solution. In the acidic environment, we can ignore the effects of free NH4+ on the balance, the results as shown in Figure 6. Figure 6 presents the positive and negative charge balances of NH4+, SO42− and NO3 in all four seasons. As is shown in these figures, the slope values (k) of the fitting line between the charge equivalent of NH4+ and the charge equivalent of SO42−+NO3 were all less, but very close to, 1; meanwhile, the goodness of fit values (R2) approximated 1. As a consequence, NH4+ in PM2.5 in Wuhan was neutralized by SO42− and NO3 in all four seasons in 2013, which then existed with the forms of (NH4)2SO4, (NH4)3H(SO4)2and NH4NO3 in PM2.5.
Synthetically, diverse forms of inorganic water-soluble ions in PM2.5 not only have some similar states or common characteristics but also exists some variation in four different seasons in Wuhan. The similarity or consistency was revealed at the aspect that the main compositions of PM2.5 were basically identical in four seasons, with their cations consisted of NH4+, Mg2+, Ca2+, K+ and Na+. In addition, there were several kinds of same particles in the four seasons, including (NH4)2SO4, NH4NO3 and CaSO4. The variation or diversity was reflected by the types of main particles compositions of PM2.5 in four seasons. Among them, Na+ ion mainly composited to form NaCl in spring (correlation coefficient between Na+ and Cl reached 0.458 in Table 3), while forming NaNO3 in summer, autumn and winter (correlation coefficients between Na+ and NO3 reached 0.423, 0.331 and 0.706 in Table 4, Table 5 and Table 6, respectively); K+ composed to be K2SO4 in summer (correlation coefficient between K+ and SO42− reached 0.631 in Table 4), and then KCl in spring, autumn and winter (correlation coefficients between K+ and Cl reached 0.537, 0.632 and 0.612 in Table 3, and Table 5 and Table 6, respectively); K+ also formed KNO3 only in autumn (correlation coefficient between K+ and NO3 reached 0.586 in Table 5); Mg2+ composited MgCl2 in winter (correlation coefficient between Mg2+ and Cl reached 0.331 in Table 6) while MgSO4 in spring, summer and autumn (correlation coefficients between Mg2+ and SO42− reached 0.590, 0.469 and 0.441 in Table 3, Table 4 and Table 5, respectively); furthermore, Ca(NO3)2 also came into being in winter as a compound of Ca2+, with correlation coefficient between Ca2+ and NO3 reached 0.418 in Table 6, unlike other seasons that CaSO4 was the main existing form.

4. Conclusions

This study elucidated the characteristics of PM2.5 in Wuhan city from January to December 2013. The analyses of the obtained results showed that there was a relatively high total mass concentration level of water-soluble ions in PM2.5, and the ions followed a descending order of SO42− > NO3 > NH4+ > Cl > K+ > Ca2+ > Na+ > Mg2+. The dominant ions of SO42−, NO3 and NH4+ had a total concentration that reached 92% of the total water-soluble ions of PM2.5, which showed that secondary particle pollution in Wuhan was very serious. The mass concentration of water-soluble ions in PM2.5 in four seasons followed the sequence of winter > spring > autumn > summer. The concentration of the main secondary ions SO42−, NO3 and NH4+ relative to the concentration of the whole water-soluble ions in the spring, summer, autumn and winter were 79%, 46%, 67% and 85%, respectively, and the annual average concentration value of all water-soluble ions was 63%.
The charge balance fitting curves of water-soluble ions in PM2.5 had a high degree of imitation, indicating that the positive and negative charges of water-soluble ions were essentially balanced. Among the ions, there were certain cationic losses in the summer. In addition, there were large differences in the types of water-soluble ions in PM2.5 in the four seasons. The main molecular compositions of PM2.5 were (NH4)2SO4, NH4NO3, NaCl, NaNO3, NaSO4, KCl, K2SO4, KNO3, MgSO4, MgCl2, CaSO4 and Ca(NO3)2, and (NH4)2SO4 and NH4NO3 were the dominant particles over the four seasons. The N and S emissions from human activities in Wuhan were large, and the main air pollution sources were inorganic secondary sources. In addition, the charge balance fitting curve in winter revealed that there were some other cationic ions not detected such as organic cations or heavy metal ions (Zn2+, Cu2+, etc.), which reflected that the ion components of PM2.5 in winter was much more complicated than that in spring, summer and autumn. Therefore, for the further study, we must focus on the organic cations and heavy metal ions, especially in winter and the haze pollution weather. In addition, we also must realize that the temporal difference and seasonal difference in source apportionment of airborne particulate matter.
The mass concentration equivalent ratio of NO3/SO42− in the spring, summer, autumn and winter were 0.73, 0.32, 0.70 and 0.83, respectively, and the mean ratio was 0.64, which revealed that the main pollution sources (mobile source and stationary source) in Wuhan were fixed sources. The emissions load of fixed pollution sources in Wuhan, which is a vital industrial city, is relatively high from steel metallurgy, thermal power, cement and other industries. The city's industrial waste gas emissions reached 563.642 billion cubic meters 5636.42 (108 m3) in 2013, and industrial SO2 emissions and smoke powder accounted for 94.4% and 77.2% of the total emissions, respectively. With the background of energy conservation, emissions reduction and air quality improvement, relevant government departments and persons in Wuhan should strictly adopt the following measures: converting energy structures, improving industrial technologies, controlling the release of the fixed sources and normalizing the EIA approval process of air-involved construction projects. For motor vehicle exhaust pollution control, Wuhan have conducted the reform pilot work of Diesel Exhaust After treatment System Technical in 2015, adopting advanced technology to decrease the emission of nitrogen oxides and particulate matter in addition to gradual elimination of Yellow Label cars and old cars by strict traffic law enforcement, in order to reduce the mobile sources of exhaust pollution.

Acknowledgments

This work was supported by the Natural Science Foundation of China (No. 41072023 and 41402312).

Author Contributions

Ting Huang and Shenggao Cheng designed the study, analyzed the data and wrote the manuscript. Juan Chen, Weituo Zhao and Jixiong Cheng collected the data, coordinated the data-analysis and revised the paper.

Conflicts of Interest

The authors declare no conflict of interest.

References

  1. Yuan, C.S.; Lee, C.G.; Liu, S.H.; Chang, J.C.; Yuan, C.; Yang, H.Y. Correlation of atmospheric visibility with chemical composition of Kaohsiung aerosol. Atmos. Environ. 2006, 82, 663–679. [Google Scholar] [CrossRef]
  2. Liao, W.H.; Wang, X.M.; Fan, Q.; Zhou, S.Z.; Chang, M.; Wang, Z.M.; Wang, Y.; Tu, Q.L. Long-term atmospheric visibility, sunshine duration and precipitation trends in South China. Atmos. Environ. 2015, 107, 204–216. [Google Scholar] [CrossRef]
  3. Baker, K.R.; Foley, K.M. A nonlinear regression model estimating single source concentrations of primary and secondarily formed PM2.5. Atmos. Environ. 2011, 45, 3758–3767. [Google Scholar] [CrossRef]
  4. Yang, L.X.; Cheng, S.H.; Wang, X.F.; Nie, W.; Xu, P.J.; Gao, X.M.; Yuan, C.; Wang, W.X. Source identification and health impact of PM2.5 in a heavily polluted urban atmosphere in China. Atmos. Environ. 2013, 75, 265–269. [Google Scholar] [CrossRef]
  5. Sun, K.; Qu, Y.; Wu, Q.; Han, T.T.; Gu, J.W.; Zhao, J.J.; Sun, Y.L.; Jiang, Q.; Gao, Z.Q.; Hu, M.; et al. Chemical characteristics of size-resolved aerosols in winter in Beijing. J. Environ. Sci. 2014, 26, 1641–1650. [Google Scholar] [CrossRef] [PubMed]
  6. Xue, J.; Griffith, S.M.; Yu, X.; Lau, A.K.H.; Yu, J.Z. Effect of nitrate and sulfate relative abundance in PM2.5 on liquid water content explored through half-hourly observations of inorganic soluble aerosols at a polluted receptor site. Atmos. Environ. 2014, 99, 24–31. [Google Scholar] [CrossRef]
  7. Gong, W.; Zhang, T.; Zhu, Z.; Ma, Y.; Ma, X.; Wang, W. Characteristics of PM1.0, PM2.5, and PM10, and Their Relation to Black Carbon in Wuhan, Central China. Atmosphere 2015, 6, 1377–1387. [Google Scholar] [CrossRef]
  8. Ram, K.; Sarin, M.M.; Tripathi, S.N. Temporal trends in atmospheric PM2.5, PM10, elemental carbon, organic carbon, water-soluble organic carbon, and optical properties: Impact of biomass burning emissions in the Indo-Gangetic Plain. Environ. Sci. Technol. 2012, 46, 686–695. [Google Scholar] [CrossRef] [PubMed]
  9. Wang, J.; Hu, Z.M.; Chen, Y.Y.; Chen, Z.L.; Xu, S.Y. Contamination characteristics and possible sources of PM10 and PM2.5 in different functional areas of Shanghai, China. Atmos. Environ. 2013, 68, 221–229. [Google Scholar] [CrossRef]
  10. Gugamsetty, B.; Wei, H.; Liu, C.N.; Awasthi, A.; Hsu, S.C.; Tsai, C.J.; Roam, G.D.; Wu, Y.C.; Chen, C.F. Source characterization and apportionment of PM10, PM2.5 and PM0.1 by using positive matrix factorization. Aerosol Air Qual. Res. 2012, 12, 476–491. [Google Scholar] [CrossRef]
  11. Deshmukh, D.K.; Deb, M.K.; Tsai, Y.I.; Mkoma, S.L. Water soluble ions in PM2.5 and PM1 aerosols in Durg city, Chhattisgarh, India. Aerosol Air Qual. Res. 2011, 11, 696–708. [Google Scholar] [CrossRef]
  12. An, J.J.; Wang, H.L.; Shen, L.J.; Zhu, B.; Zou, J.N.; Gao, J.H.; Kang, H.Q. Characteristics of new particle formation events in Nanjing, China: Effect of water-soluble ions. Atmos. Environ. 2015, 108, 32–40. [Google Scholar] [CrossRef]
  13. Reff, A.; Bhave, P.V.; Simon, H.; Pace, T.G.; Pouliot, G.A.; Mobley, J.D.; Houyoux, M. Emissions inventory of PM2.5 trace elements across the United States. Environ. Sci. Technol. 2009, 43, 5790–5796. [Google Scholar] [CrossRef] [PubMed]
  14. Hueglin, C.; Gehrig, R.; Baltensperger, U.; Gysel, M.; Monn, C.; Vonmont, H. Chemical characterisation of PM2.5, PM10 and coarse particles at urban, near-city and rural sites in Switzerland. Atmos. Environ. 2005, 39, 637–651. [Google Scholar] [CrossRef]
  15. Yang, D.Y.; Liu, B.X.; Zhang, D.W.; Chen, Y.Y.; Zhou, J.N.; Liang, Y.P. Correlation, Seasonal and Temporal Variation of Water-soluble Ions of PM2.5 in Beijing during 2012–2013. Environ. Sci. 2015, 36, 768–773. (In Chinese) [Google Scholar]
  16. Fann, N.; Lamson, A.D.; Anenberg, S.C.; Wesson, K.; Risley, D.; Hubbell, B.J. Estimating the national public health burden associated with exposure to ambient PM2.5 and ozone. Risk Anal. 2012, 32, 81–95. [Google Scholar] [CrossRef] [PubMed]
  17. Chen, J.; Qiu, S.S.; Shang, J.; Wilfrid, O.M.F.; Liu, X.G.; Tian, H.Z.; Boman, H. Impact of relative humidity and water soluble constituents of PM2.5 on visibility impairment in Beijing, China. Aerosol Air Qual. Res. 2014, 14, 260–268. [Google Scholar] [CrossRef]
  18. Ding, L.; Zhao, W.; Huang, Y.; Cheng, S.; Liu, C. Research on the Coupling Coordination Relationship between Urbanization and the Air Environment: A Case Study of the Area of Wuhan. Atmosphere 2015, 6, 1539–1558. [Google Scholar] [CrossRef]
  19. Cheng, H.R.; Gong, W.; Wang, Z.W.; Zhang, F.; Wang, X.M.; Lv, X.P.; Liu, J.; Fu, X.X.; Zhang, G. Ionic composition of submicron particles (PM1.0) during the long-lasting haze period in January 2013 in Wuhan, central China. J. Environ. Sci. 2014, 26, 810–817. [Google Scholar] [CrossRef]
  20. Guo, H.T.; Zhou, J.B.; Wang, L.; Zhou, Y.; Yuan, J.P.; Zhao, R.S. Seasonal Variations and Sources of Carboxylic Acids in PM2.5 in Wuhan, China. Aerosol Air Qual. Res. 2015, 15, 517–528. [Google Scholar] [CrossRef]
  21. Cao, J.J.; Shen, Z.X.; Chow, J.C.; Waston, J.G.; Lee, S.C.; Tie, X.X.; Ho, K.F.; Wang, G.H.; Han, Y.M. Winter and summer PM2.5 chemical compositions in fourteen Chinese cities. J. Air Waste Manag. 2012, 62, 1214–1226. [Google Scholar] [CrossRef]
  22. Zhang, F.; Wang, Z.W.; Cheng, H.R.; Lv, X.P.; Gong, W.; Wang, X.M.; Zhang, G. Seasonal variations and chemical characteristics of PM2.5 in Wuhan, central China. Sci. Total. Environ. 2015, 518, 97–105. [Google Scholar] [CrossRef] [PubMed]
  23. Zhang, F.; Cheng, H.R.; Wang, Z.W.; Lu, X.P. Characteristics of Water-soluble Ions in PM2.5 during Haze and Non-haze Periods in autumn in Wuhan. China Power Sci. Technol. 2013, 5, 31–33. (In Chinese) [Google Scholar] [CrossRef]
  24. Wang, Y.; Zhuang, G.S.; Zhang, X.Y.; Huang, K.; Xu, C.; Tang, A.H.; Chen, J.M.; An, Z.S. The ion chemistry, seasonal cycle, and sources of PM2.5 and TSP aerosol in Shanghai. Atmos. Environ. 2006, 40, 2935–2952. [Google Scholar] [CrossRef]
  25. Gu, J.X.; Bai, Z.P.; Li, W.F.; Wu, L.P.; Liu, A.X.; Dong, H.Y.; Xie, Y.Y. Chemical composition of PM2.5 during winter in Tianjin, China. Particuology 2011, 9, 215–221. [Google Scholar] [CrossRef]
  26. Cheng, Y.; Lee, S.C.; Ho, K.F.; Chow, J.C.; Louie, P.K.K.; Cao, J.J.; Hai, X. Chemically-speciated on-road PM 2.5 motor vehicle emission factors in Hong Kong. Sci. Total. Environ. 2010, 408, 1621–1627. [Google Scholar] [CrossRef] [PubMed]
  27. Tao, J.; Zhang, L.M.; Ho, K.F.; Zhang, R.J.; Lin, Z.J.; Zhang, Z.S.; Lin, M.; Cao, J.J.; Liu, S.X.; Wang, G.H. Impact of PM2.5 chemical compositions on aerosol light scattering in Guangzhou—The largest megacity in South China. Atmos. Res. 2014, 135, 48–58. [Google Scholar] [CrossRef]
  28. Wuhan City Environmental Monitoring Center. Wuhan City Environmental Quality Report. 2014. [Google Scholar]
  29. Lough, G.C.; Schauer, J.J.; Park, J.S.; Shafer, M.M.; Deminter, J.T.; Weinstein, J.P. Emissions of metals associated with motor vehicle roadways. Environ. Sci. Technol. 2005, 39, 826–836. [Google Scholar] [CrossRef] [PubMed]
  30. Arimoto, R.; Duce, R.A.; Savoie, D.L.; Prospero, J.M.; Talbot, R.; Cullen, D.; Tomza, U. Relationships among aerosol constituents from Asia and the North Pacific during PEM-West A. J. Geophys. Res.-Atoms. 1996, 101, 2011–2023. [Google Scholar] [CrossRef]
  31. Zhao, Y.N.; Wang, Y.S.; Wen, T.X.; Liu, Q. Characterization of water-soluble ions in PM2.5 at Dinghu Mount. Environ. Sci. 2013, 34, 1232–1239. (In Chinese) [Google Scholar]
  32. Orsini, D.A.; Ma, Y.L.; Sullivan, A.; Sierau, B.; Baumann, K.; Weber, R.J. Refinements to the Particle-Into-Liquid Sampler (PILS) for ground and airborne measurements of water soluble aerosol composition. Atmos. Environ. 2003, 37, 1243–1259. [Google Scholar] [CrossRef]
  33. Hu, M.; Wu, Z.J.; Slanina, J.; Lin, P.; Liu, S.; Zeng, M. Acidic gases, ammonia and water-soluble ions in PM2.5 at a coastal site in the Pearl River Delta, China. Atmos. Environ. 2008, 42, 6310–6320. [Google Scholar] [CrossRef]
  34. Pathak, R.K.; Chan, C.K. Inter-particle and gas-particle interactions in sampling artifacts of PM2.5 in filter-based samplers. Atmos. Environ. 2005, 39, 1597–1607. [Google Scholar]
  35. Lv, W.; Wang, Y.; Querol, X.; Zhuang, X.; Alastuey, A.; López, A.; Viana, M. Geochemical and statistical analysis of trace metals in atmospheric particulates in Wuhan, central China. Environ. Geol. 2006, 51, 121–132. [Google Scholar] [CrossRef]
  36. Chen, J.; Qiu, S.; Shang, J.; Wilfrid, O.M.; Liu, X.; Tian, H.; Boman, J. Impact of relative humidity and water soluble constituents of PM2.5 on visibility impairment in Beijing, China. Aerosol Air Qual. Res. 2014, 14, 260–268. [Google Scholar] [CrossRef]
Figure 1. The wind rose diagram in 2013, Wuhan (calm wind frequency was 2.15%) 2.2 Sampling site and method.
Atmosphere 07 00049 g001
Figure 2. The location map of sampling site.
Atmosphere 07 00049 g002
Figure 3. Seasonal variation of water-soluble ions in Wuhan during the observation period.
Atmosphere 07 00049 g003
Figure 4. Seasonal variation of eight inorganic ions accounts for the total mass concentration of PM2.5 in Wuhan during observation period.
Atmosphere 07 00049 g004
Figure 5. The charge balance of anion and cation water-soluble ions in Wuhan in four seasons.
Atmosphere 07 00049 g005
Figure 6. Positive and negative charge balances of NH4+, SO42− and NO3 in all four seasons in Wuhan.
Atmosphere 07 00049 g006
Table 1. Mass concentration of particulate matter (PM2.5) and the water-soluble ions at different sites (μg/m−3).
SiteWuhan (This Study)Wuhan [23]Beijing [15]Shanghai [24]Tianjin [25]Hongkong [26]Guangzhou [27]
Locationurbanurbanurban & suburburbanurbanurbanurban
Time201320122012–20132003–2005200820032012–2013
Sampling sites1282111
Sample number522151920219--51
PM2.565120.9189.894.6144.649.376.8
Cl1.242.183.6136.70.171.8
NO311.2825.6120.36.3216.60.797.8
SO42−16.7843.1519.410.3924.111.618.1
NH4+9.6717.8313.53.788.74.35.1
Na+0.240.751.190.573.40.262.2
K+1.082.961.050.630.90.670.9
Mg2+0.140.350.050.2810.045--
Ca2+0.545.170.781.251.80.13--
Table 2. Main pollution source of NOx in Wuhan, 2013–2014 [28].
Year20132014
SourcesEmissions (t)Percentage (%)Emissions (t)Percentage (%)
Total NOx emission147,100--137,000--
Total industrial NOx emission95,60065.0084,20061.46
Thermal power industry51,57635.0629,81721.80
Iron and steel industry99376.7696617.05
Cement industry73405.0065804.80
Vehicle exhaust emissions50,00034.0051,40037.54
Life source emissions14000.9513000.95
Centralized management facilities1000.051000.05
Table 3. Pearson correlation of the water-soluble ions in PM2.5 in the spring.
--ClNO3SO42−Na+NH4+K+Mg2+Ca2+
Cl1--------------
NO30.401 **1------------
SO42−0.0360.579 **1----------
Na+0.458 **0.337 **0.396 **1--------
NH4+0.276 **0.882 **0.859 **0.371 **1------
K+0.537 **0.439 **0.426 **0.811 **0.492 **1----
Mg2+0.152 **0.082 *0.590 *0.473 **0.0010.269 **1--
Ca2+0.085 *−0.253 **0.536 **0.382 **−0.301 **0.135 **0.698 **1
**: Significant at a level of 0.01 (2-tailed); *: Significant at a level of 0.05 (2-tailed); the bold data: descripted in content.
Table 4. Pearson correlation of the water-soluble ions in PM2.5 in the summer.
--ClNO3SO42−Na+NH4+K+Mg2+Ca2+
Cl1--------------
NO30.668 **1------------
SO42−0.293 **0.335 **1----------
Na+0.173 **0.423 **0.159 **1--------
NH4+0.582 **0.611 **0.686 **0.441 **1------
K+0.449 **0.397 **0.631 **0.211 **0.659 **1----
Mg2+0.101 **−0.089 **0.469 **0.067 *−0.116 **0.092 **1--
Ca2+0.114 **0.0360.438 **0.291 **0.134 **0.311 **0.125 **1
**: Significant at a level of 0.01 (2-tailed); *: Significant at a level of 0.05 (2-tailed); the bold data: descripted in content.
Table 5. Pearson correlation of the water-soluble ions in PM2.5 in the autumn.
--ClNO3SO42−Na+NH4+K+Mg2+Ca2+
Cl1--------------
NO30.552 **1------------
SO42−0.177 **0.472 **1----------
Na+0.184 **0.331 **0.224 **1--------
NH4+0.488 **0.846 **0.821 **0.214 **1------
K+0.632 **0.586 **0.392 **0.271 **0.546 **1----
Mg2+0.111 **0.235 **0.441 *0.263 **0.228 **0.176 **1--
Ca2+−0.0040.0350.502 **0.682 **0.0010.184 **0.218 **1
**: Significant at a level of 0.01 (2-tailed); *: Significant at a level of 0.05 (2-tailed); the bold data: descripted in content.
Table 6. Pearson correlation of the water-soluble ions in PM2.5 in the winter.
--ClNO3SO42−Na+NH4+K+Mg2+Ca2+
Cl1--------------
NO30.365 **1------------
SO42−0.486 **0.846 **1----------
Na+0.306 **0.706 **0.695 **1--------
NH4+0.474 **0.925 **0.941 **0.696 **1------
K+0.612 **0.436 **0.518 **0.528 **0.395 **1----
Mg2+0.331 **0.0210.141 *0.214 **−0.0670.738 **1--
Ca2+−0.172 **0.418 **0.316 **0.004−0.421 **−0.158 **0.144 *1
**: Significant at a level of 0.01 (2-tailed); *: Significant at a level of 0.05 (2-tailed); the bold data: descripted in content.

