Article

Increasing Winter Precipitation over Arid Central Asia under Global Warming

1
State Key Laboratory of Desert and Oasis Ecology, Xinjiang Institute of Ecology and Geography, Chinese Academy of Sciences, Urumqi 830011, China
2
College of Resource and Environment Sciences, Xinjiang University, Urumqi 830046, China
3
University of Chinese Academy of Sciences, Beijing 100049, China
*
Author to whom correspondence should be addressed.
Atmosphere 2016, 7(10), 139; https://doi.org/10.3390/atmos7100139
Submission received: 26 September 2016 / Revised: 17 October 2016 / Accepted: 18 October 2016 / Published: 21 October 2016

Abstract

:
Precipitation has been considered to be a critical water source for both human livelihoods and ecosystems in Central Asia. Using observational data and gridded datasets, we studied the regional and seasonal differences of precipitation climate characteristics and variations in precipitation over Central Asia. Using observational data obtained from the China Meteorological Administration, Global Historical Climatology Network (V3.02), we divided Central Asia into four subregions (North, Center, Southwest, and Southeast) based on the differences in seasonal cycles of precipitation. ‘Single peaks’ were detected as types of seasonal cycles over the North and the Southeast, while ‘two peaks’ was the type that occurred in the Southwest. For the Center, the zone of transition between the North and the Southwest, each monthly precipitation value was higher than the Southwest’s and less than the North’s. GPCC (R2 of 0.89, RMSE of 64.5 mm/year) was proven to be the most suitable dataset of the four datasets (CRU, GPCC, MERRA, and TRMM) to describe precipitation in Central Asia, based on validation against observational data, and used to detect the spatial and temporal trend of precipitation in Central Asia and four subregions during 1960–2013. No significant trends were observed for annual precipitation in Central Asia, while precipitation in winter displayed a significant increase (0.11 mm/year). Additionally, significantly increasing trends (0.16, 0.27, 0.13, and 0.13 mm/year) were detected in spring, summer, autumn, and winter over the Southeast during 1960–2013.

1. Introduction

Precipitation is considered to be a critical water source for both human livelihoods and ecosystems of Central Asia, which comprises one of the largest arid and semiarid areas in the world [1,2,3]. In recent years, earth’s global mean surface temperature has significantly increased and warming has been estimated to lead to large increases in atmospheric water vapor content and acceleration of the hydrological cycle [4,5,6]. In the context of global warming, a sound understanding of precipitation climate characteristics and variations in precipitation is essential for successful management of water resources in this arid and semiarid region.
A Synthetic Assessment of the Global Distribution of Vulnerability to Climate Change published by CIESIN (Center for International Earth Science Information Network) declared that no data were available in Central Asia [7]. For a long time, a satisfactory detection of precipitation variations over Central Asia was hampered by the lack of observational data. Large parts of Central Asia are sparsely populated steppes, deserts and mountain systems where the density of meteorological stations is very low [8]. Moreover, the density of meteorological stations decreased significantly after the collapse of the Soviet Union in the beginning of the 1990s [9].
Due to lack of observational data, most previous research concentrated on gridded datasets (output of climate model, climate reanalysis, spatial-interpolation, or remote sensing) to detect the region’s climate variations even though large uncertainties have been noticed in these datasets. Small, et al. [10] used the National Center for Atmospheric Research (NCAR) regional climate model (RegCM2) to simulate the mean precipitation in Central Asia and indicated that RegCM2 was not versatile enough to simulate the full range of precipitation. Using output from the Climate High Resolution Model (CHRM) and three reanalysis datasets, Schiemann, et al. [9] analyzed precipitation climate (mean spatial distribution, seasonal cycle, amplitude of interannual variability) over Central Asia, but the accuracies of datasets were problematic. An increased trend of precipitation and regional differences during 1930–2009 were detected by Chen, et al. [11] based on a dataset from the Climatic Research Unit (CRU). Bothe, et al. [12] presented a descriptive large-scale atmospheric circulation climatology model related to the precipitation climate over the Tianshan Mountains of Central Asia based on the ERA-40 reanalysis data. In much detail, Huang, et al. [13] discussed the various climatic characteristics and climate change based on CRU data. Recent studies focused on the evaluation of gridded datasets for Central Asia. Guo, et al. [14] pointed out that both the satellite-only and gauge-adjusted products had poor performance in Central Asia. A dataset released by CRU was widely used in previous investigations, but the root-mean-square error (RMSE) against observational data was larger than those derived from the University of Delaware, Global Precipitation Climatology Centre (GPCC), and National Oceanic and Atmospheric Administration (NOAA) in Xinjiang [15]. Results presented by Hu, et al. [16] showed that Modern-Era Retrospective Analysis for Research and Applications (MERRA) data have higher accuracy than ECMWF Interim Re-Analysis (ERA-Interim) and Climate Forecast System Reanalysis (CFSR), although they all overestimate the observed precipitation in Central Asia.
The Global Historical Climatology Network (GHCN) is a database of temperature, precipitation, and pressure records managed by the National Climatic Data Center, Arizona State University and the Carbon Dioxide Information Analysis Center [17]. These records were collected from stations of more than 30 different data sources. Over Central Asia, daily observations from 609 stations were collected and organized by GHCN (V3.02), which was released in June 2013. However, most of the 609 stations covered the period before 1991. Even so, these data provide an opportunity to understand precipitation climate characteristics based on observational data.
Most of previous studies were based on gridded datasets, and observational data in these studies were only used for evaluating gridded datasets. Different from previous research, in this work, we focus on making better use of observational data to detect precipitation climate characteristics and the regional and seasonal differences in these characteristics and variations in precipitation from 1960–1991 based on observational data over Central Asia. These results based on observational data will provide more accurate information about precipitation than gridded datasets, which will be essential for hydrological, climatological, and ecological research. Therefore, the main objectives were: (1) to detect precipitation climate characteristics based on observational data; (2) to depict regional differences of variations in precipitation from 1960–1991 based on observational data; (3) to evaluate four gridded datasets of precipitation against observational data; and (4) to detect regional differences of variations in precipitation from 1960–2013 based on the most suitable datasets.

2. Data and Methodology
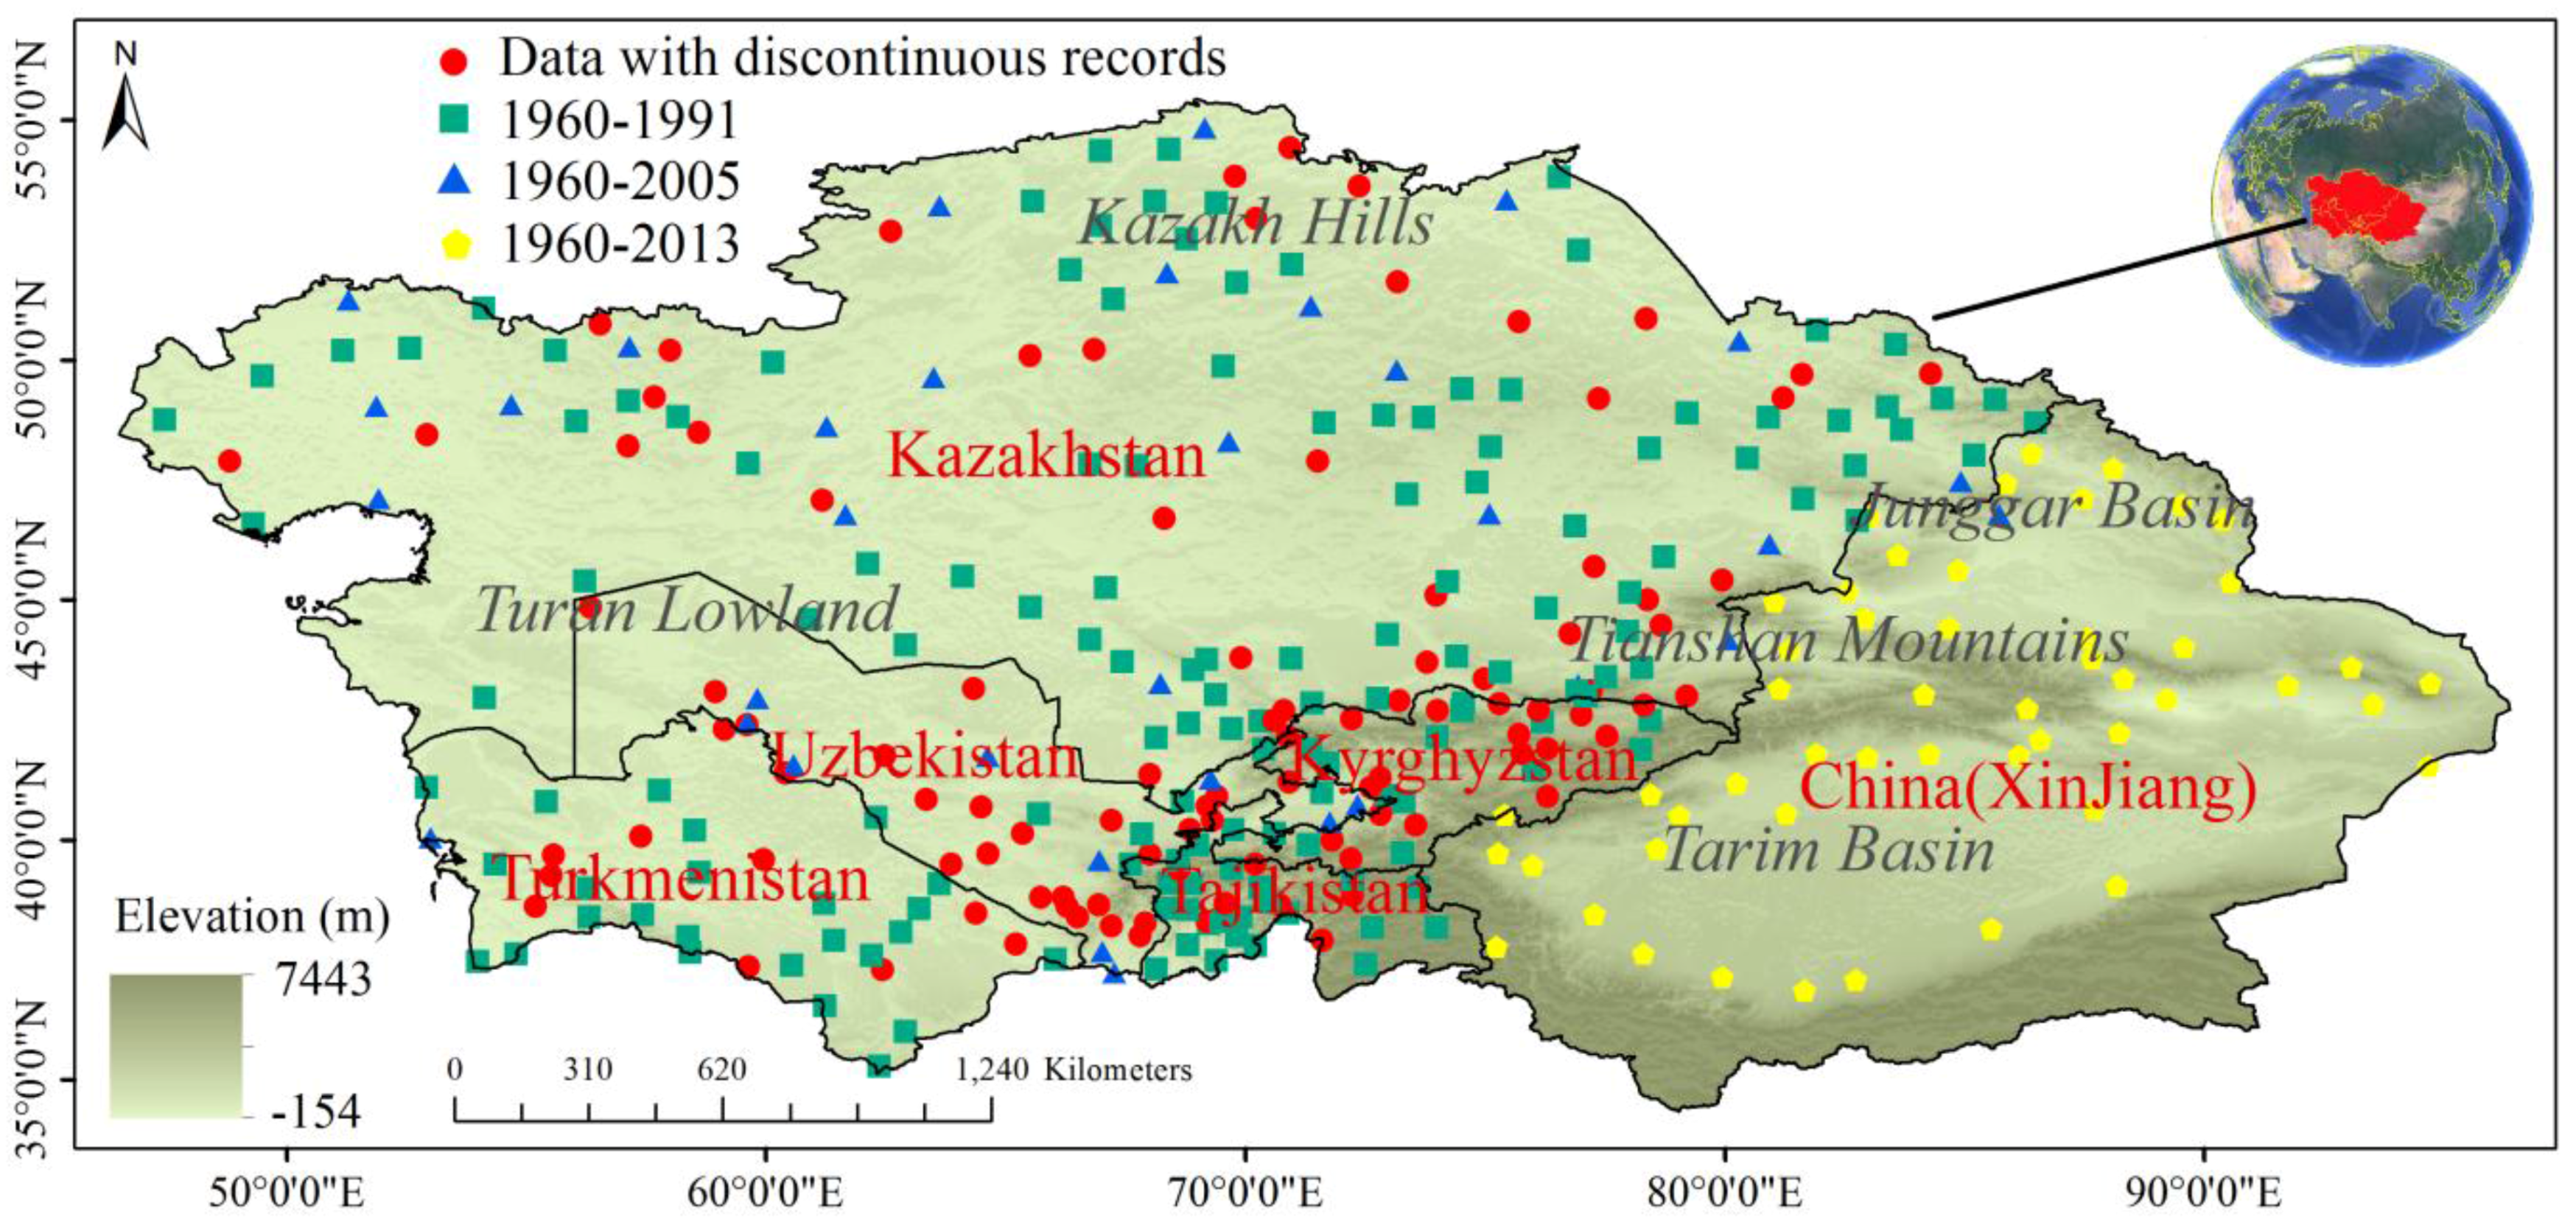
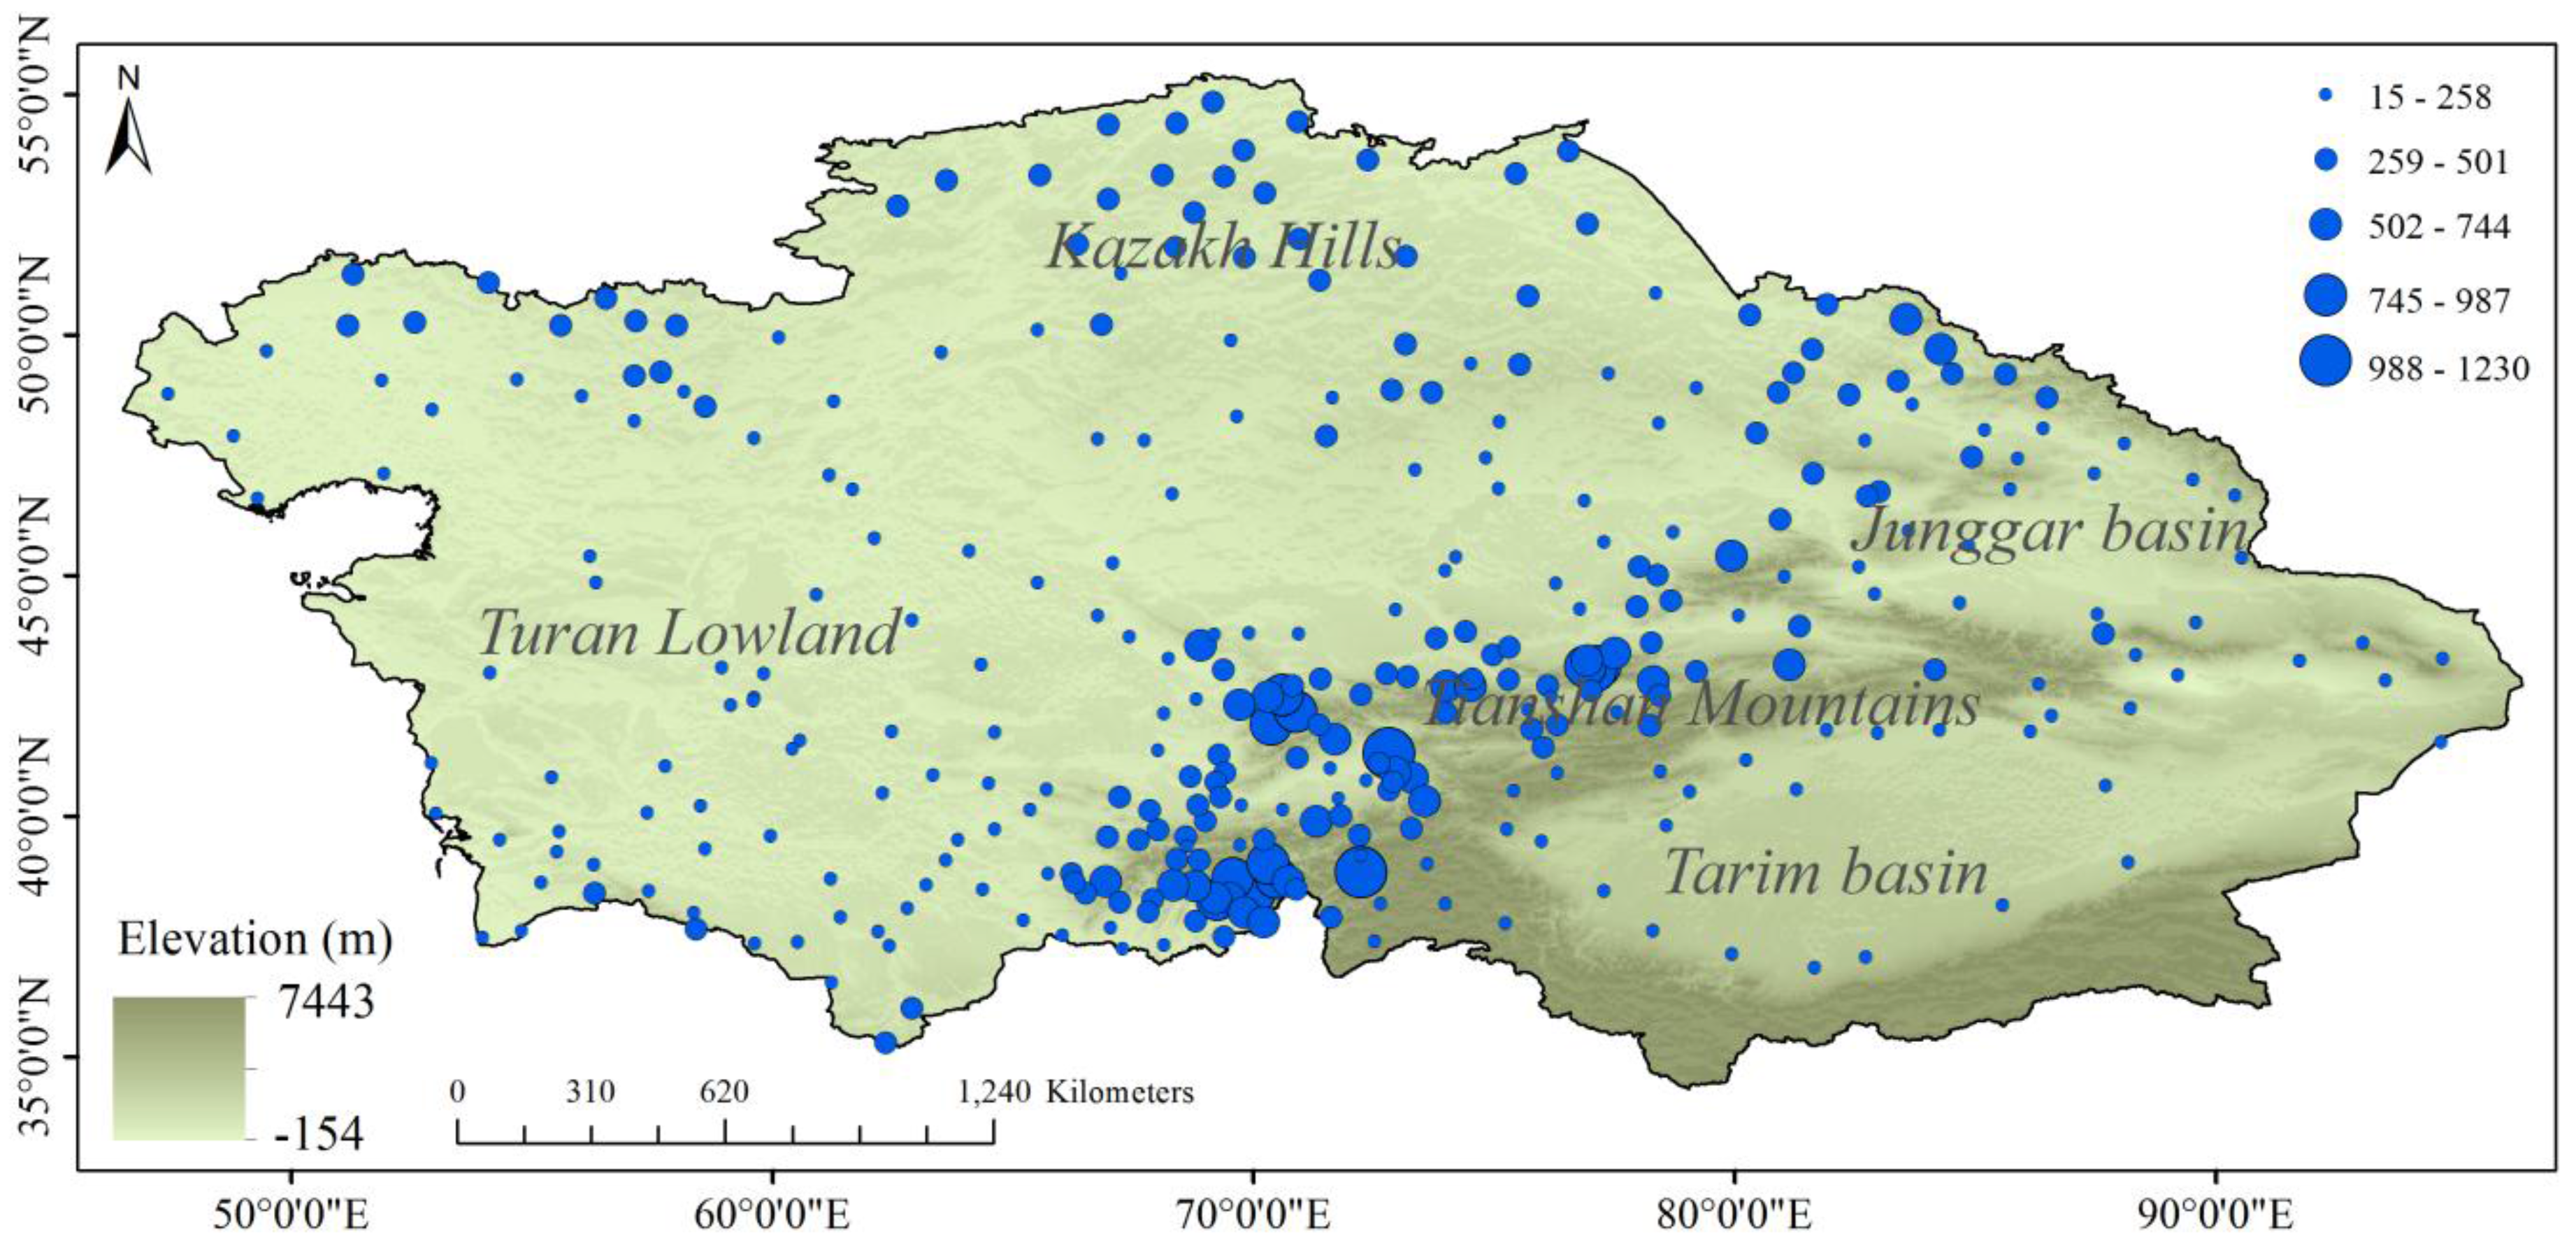
2.1. Study Area

Central Asia is located between 34°N–55°N and 46°N–96°N, with a total area of 4 × 10⁶ km2. Central Asia comprises five states of the Commonwealth of Independent States formed in 1991 after the fall of the former Soviet Union, namely Kazakhstan, Kyrgyzstan, Tajikistan, Turkmenistan, and Uzbekistan, and the Xinjiang Uygur Autonomous Region (also called Xinjiang for short) in northwestern China (Figure 1). The topography of Central Asia is complicated with altitudes between −154 and 7443 m, and includes the Kazakh Hills, the Turan Lowland, the Tianshan Mountains, the Junggar Basin, and the Tarim Basin (Figure 1). The climate is typically continental with mean annual precipitation ranging from less than 20 mm to more than 1000 mm and mean annual temperature ranging from −5 to 15 °C.

2.2. Data

Observational data obtained from meteorological stations and four monthly gridded precipitation datasets were used in this study. Stations located in Xinjiang are from the China Meteorological Administration (CMA), while stations located in the five states are from the Global Historical Climatology Network (GHCN).
Considering data integrity, consistency, and the time duration of measurements, we selected 52 stations from 1960–2013 from CMA, and 289 stations from GHCN. Of these 289 stations from GHCN, 155 stations cover the period from 1960 to 1991, 33 stations cover the period from 1960 to 2005, and there are 101 stations with more than 15 years worth of records from 1960–2013, but these years are not continuous (Figure 1). The main uses of these data were: (1) all the 341 stations extended dataset—used to describe the spatial distribution of the mean annual precipitation and seasonal cycle and to validate gridded datasets; (2) 240 stations covering 1960–1991—used for trend analysis from 1960–1991; (3) gridded dataset - used for trend analysis from 1960–2013.
Table 1 displays the information on the four monthly gridded datasets including the spatially interpolated dataset developed by the CRU [18], the spatially interpolated dataset developed by the GPCC [19,20], reanalysis by MERRA [21], and the satellite-retrieved dataset developed by the TRMM project [22].

2.3. Methodology

To better understand the regional seasonal cycle of precipitation, we used the cluster analysis method to divide Central Asia into subregions. Cluster analysis is the task of grouping a set of objects in such a way that objects in the same group (called a cluster) are more similar to each other than to those in other groups (clusters). It is a common technique for statistical data analysis and is widely used in research on geoscience. We first calculated the mean monthly precipitation for the seasonal cycle of precipitation for each of the 341 meteorological stations from 1960–2013, then used the cluster analysis method to classify these mean monthly precipitation data.
We used the Mann-Kendall method to test the significance (95% level of confidence) of the precipitation trends, and the linear least squares fitting method was used to compute the trends. Due to the robustness of abnormally distributed data, the nonparametric Mann-Kendall test [23] proposed by the World Meteorological Organization has been widely used for detecting trends of meteorological factors [24,25]. The Mann-Kendall method is based on the correlation between the ranks of a time series and their time order. For a time series composed of X1, X2, ..., Xn, their ranks are R1, R2, ..., Rn, and the Mann-Kendall rank statistic S is given by
S = i = 1 n 1 ( j = i + 1 n s i g n ( R j R i ) )
where
{ s i g n ( X ) = 1   f o r   X > 0 s i g n ( X ) = 0   f o r   X = 0 s i g n ( X ) = 1   f o r   X < 0
Positive S means an increasing trend for the time series, while negative S indicates a decreasing trend. If the null hypothesis H0 is true, there is no trend in the data. Then, S can be assumed to be approximately normally distributed with:
{ μ = 0 σ = n ( n 1 ) ( 2 n + 5 ) / 18
The Z score of S is computed based from
Z = S / σ 0.5
According the Z score, the p value can be obtained. In this study, the level of p is 0.05.
There were only 52 stations covering the period from 1960 to 2013. Therefore, we tried to select a most suitable dataset for Central Asia from four monthly gridded precipitation datasets to detect the region’s precipitation trends from 1960–2013. We used Pearson correlation coefficients (R) and root-mean-squareerror (RMSE) as indicators to validate the applicability of the four gridded datasets according to observational data.

3. Results

3.1. Spatial Distribution of Mean Annual Precipitation

Mean annual precipitation (MAP) distribution within Central Asia was determined based on observations from all of the 341 meteorological stations (Figure 2). Numerically, the MAP of Central Asia ranged from 15 mm to 1230 mm. In terms of spatial distribution, MAP was obviously uneven with less precipitation in the Tarim Basin, the Turan Lowland, and more precipitation in the Kazakh Hills and the Tianshan Mountains. MAP within the Kazakh Hills decreased from north (600 mm) to south (150 mm), while MAP within the Turan Lowland located in the south of the Kazakh Hills was only 130 mm. There was high MAP (about 700 mm) in the Tianshan Mountains, and higher MAP on the west piedmont of the Tianshan Mountains due to its location under the influence of the westerlies. MAP values within the Junggar and Tarim Basins ranged from approximately 100 to 200 mm.

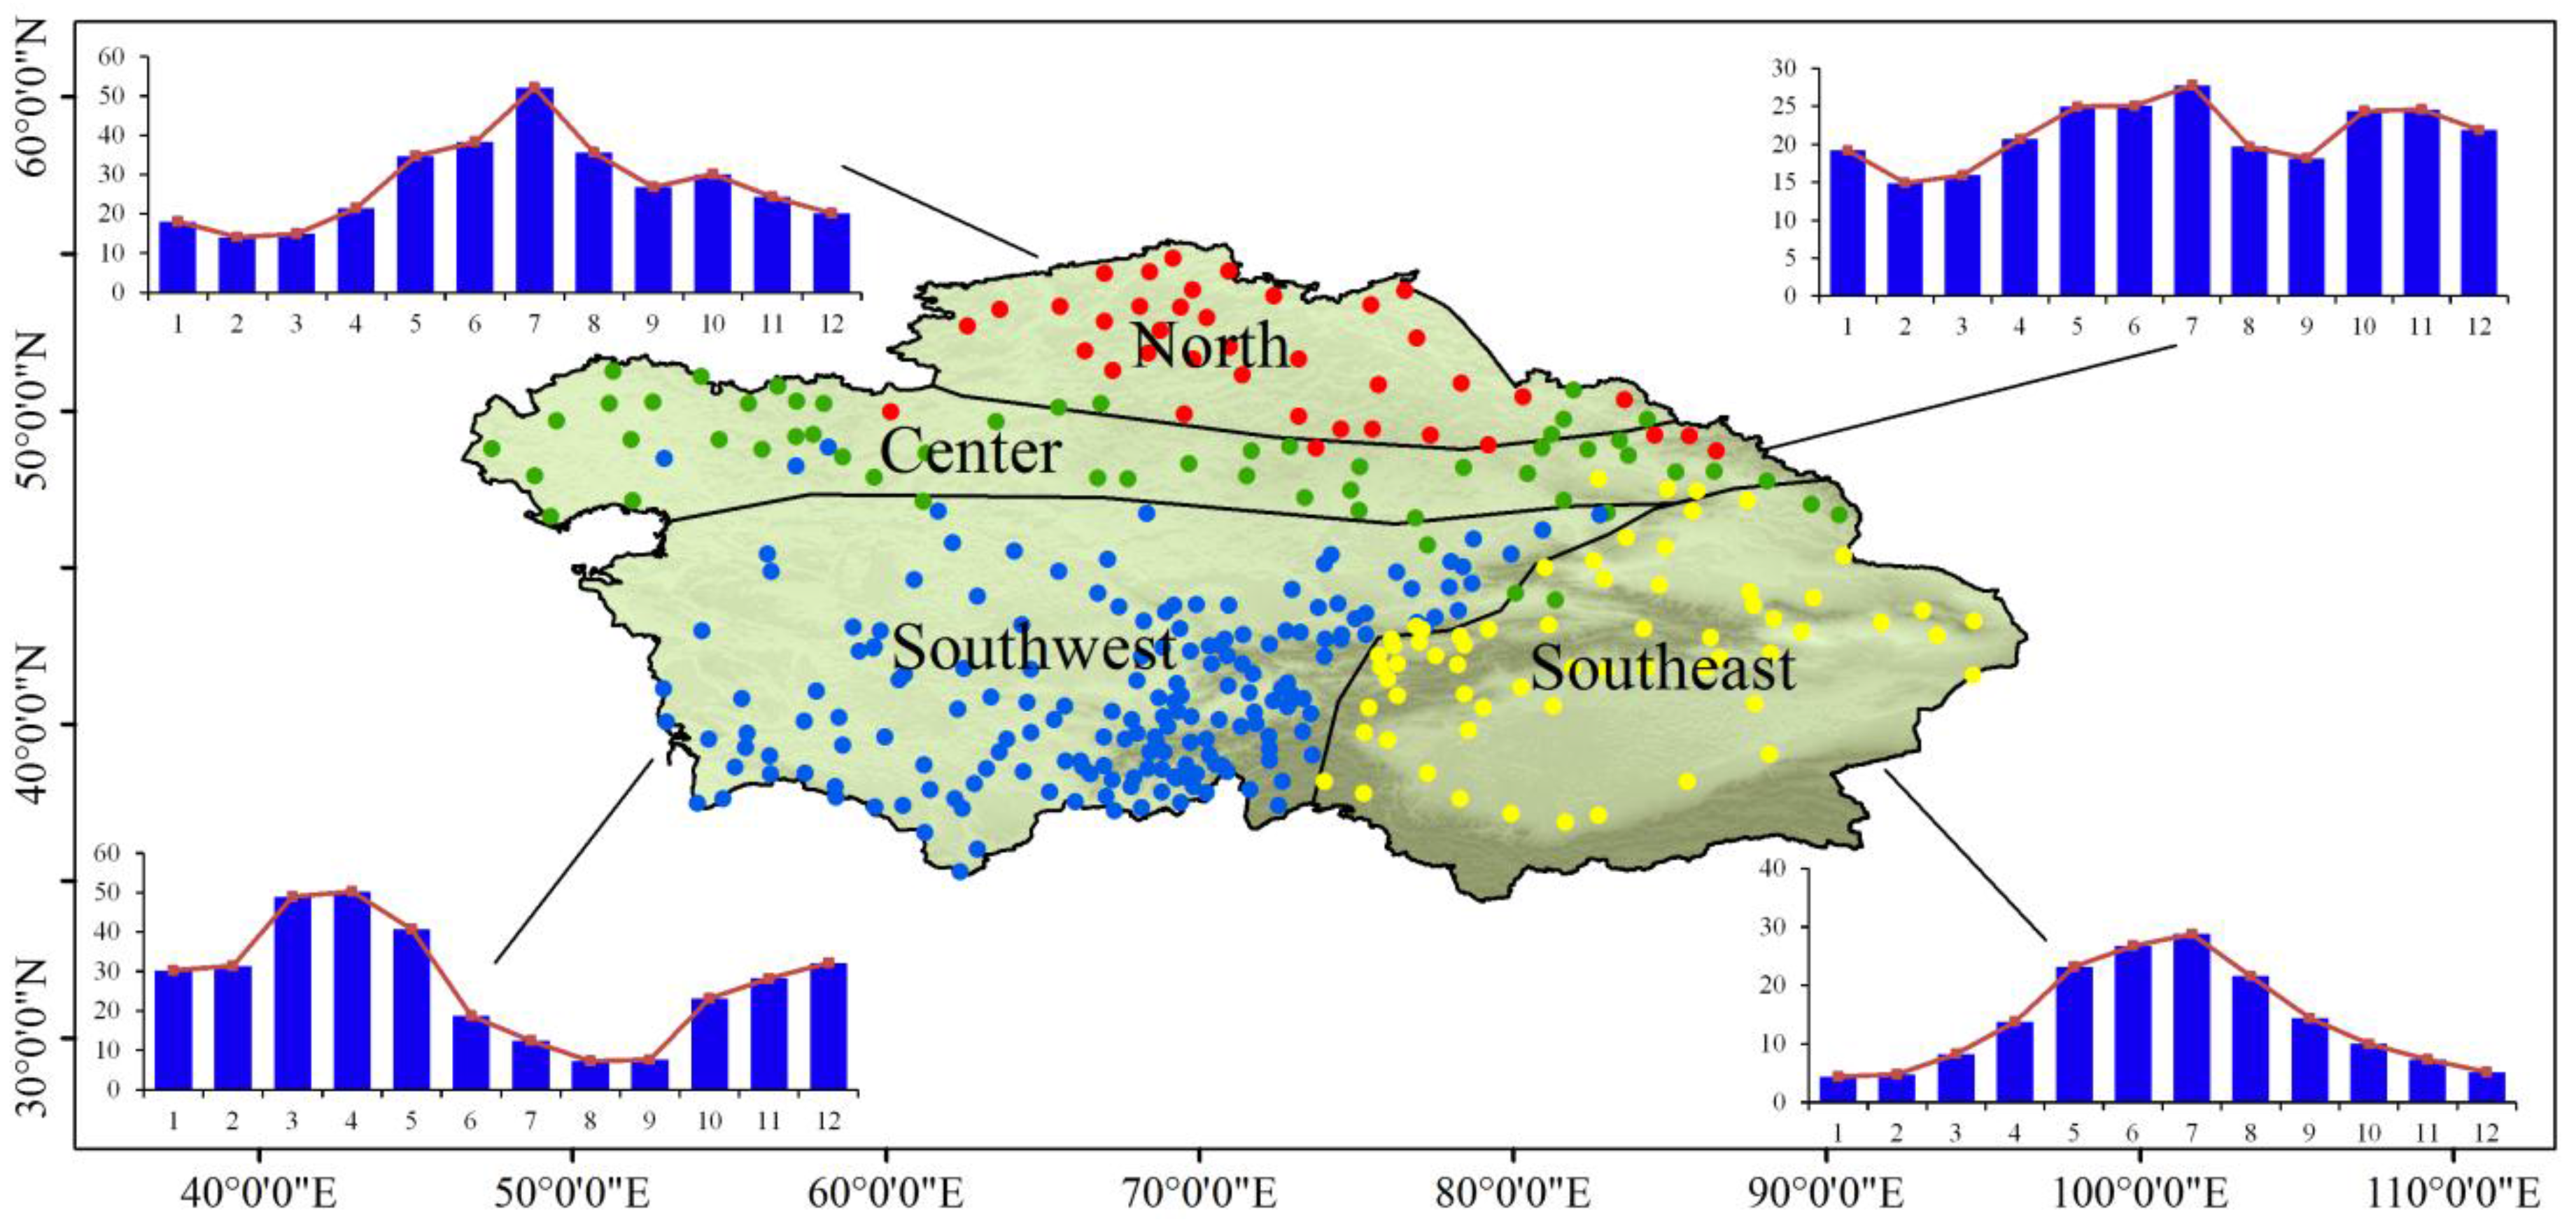
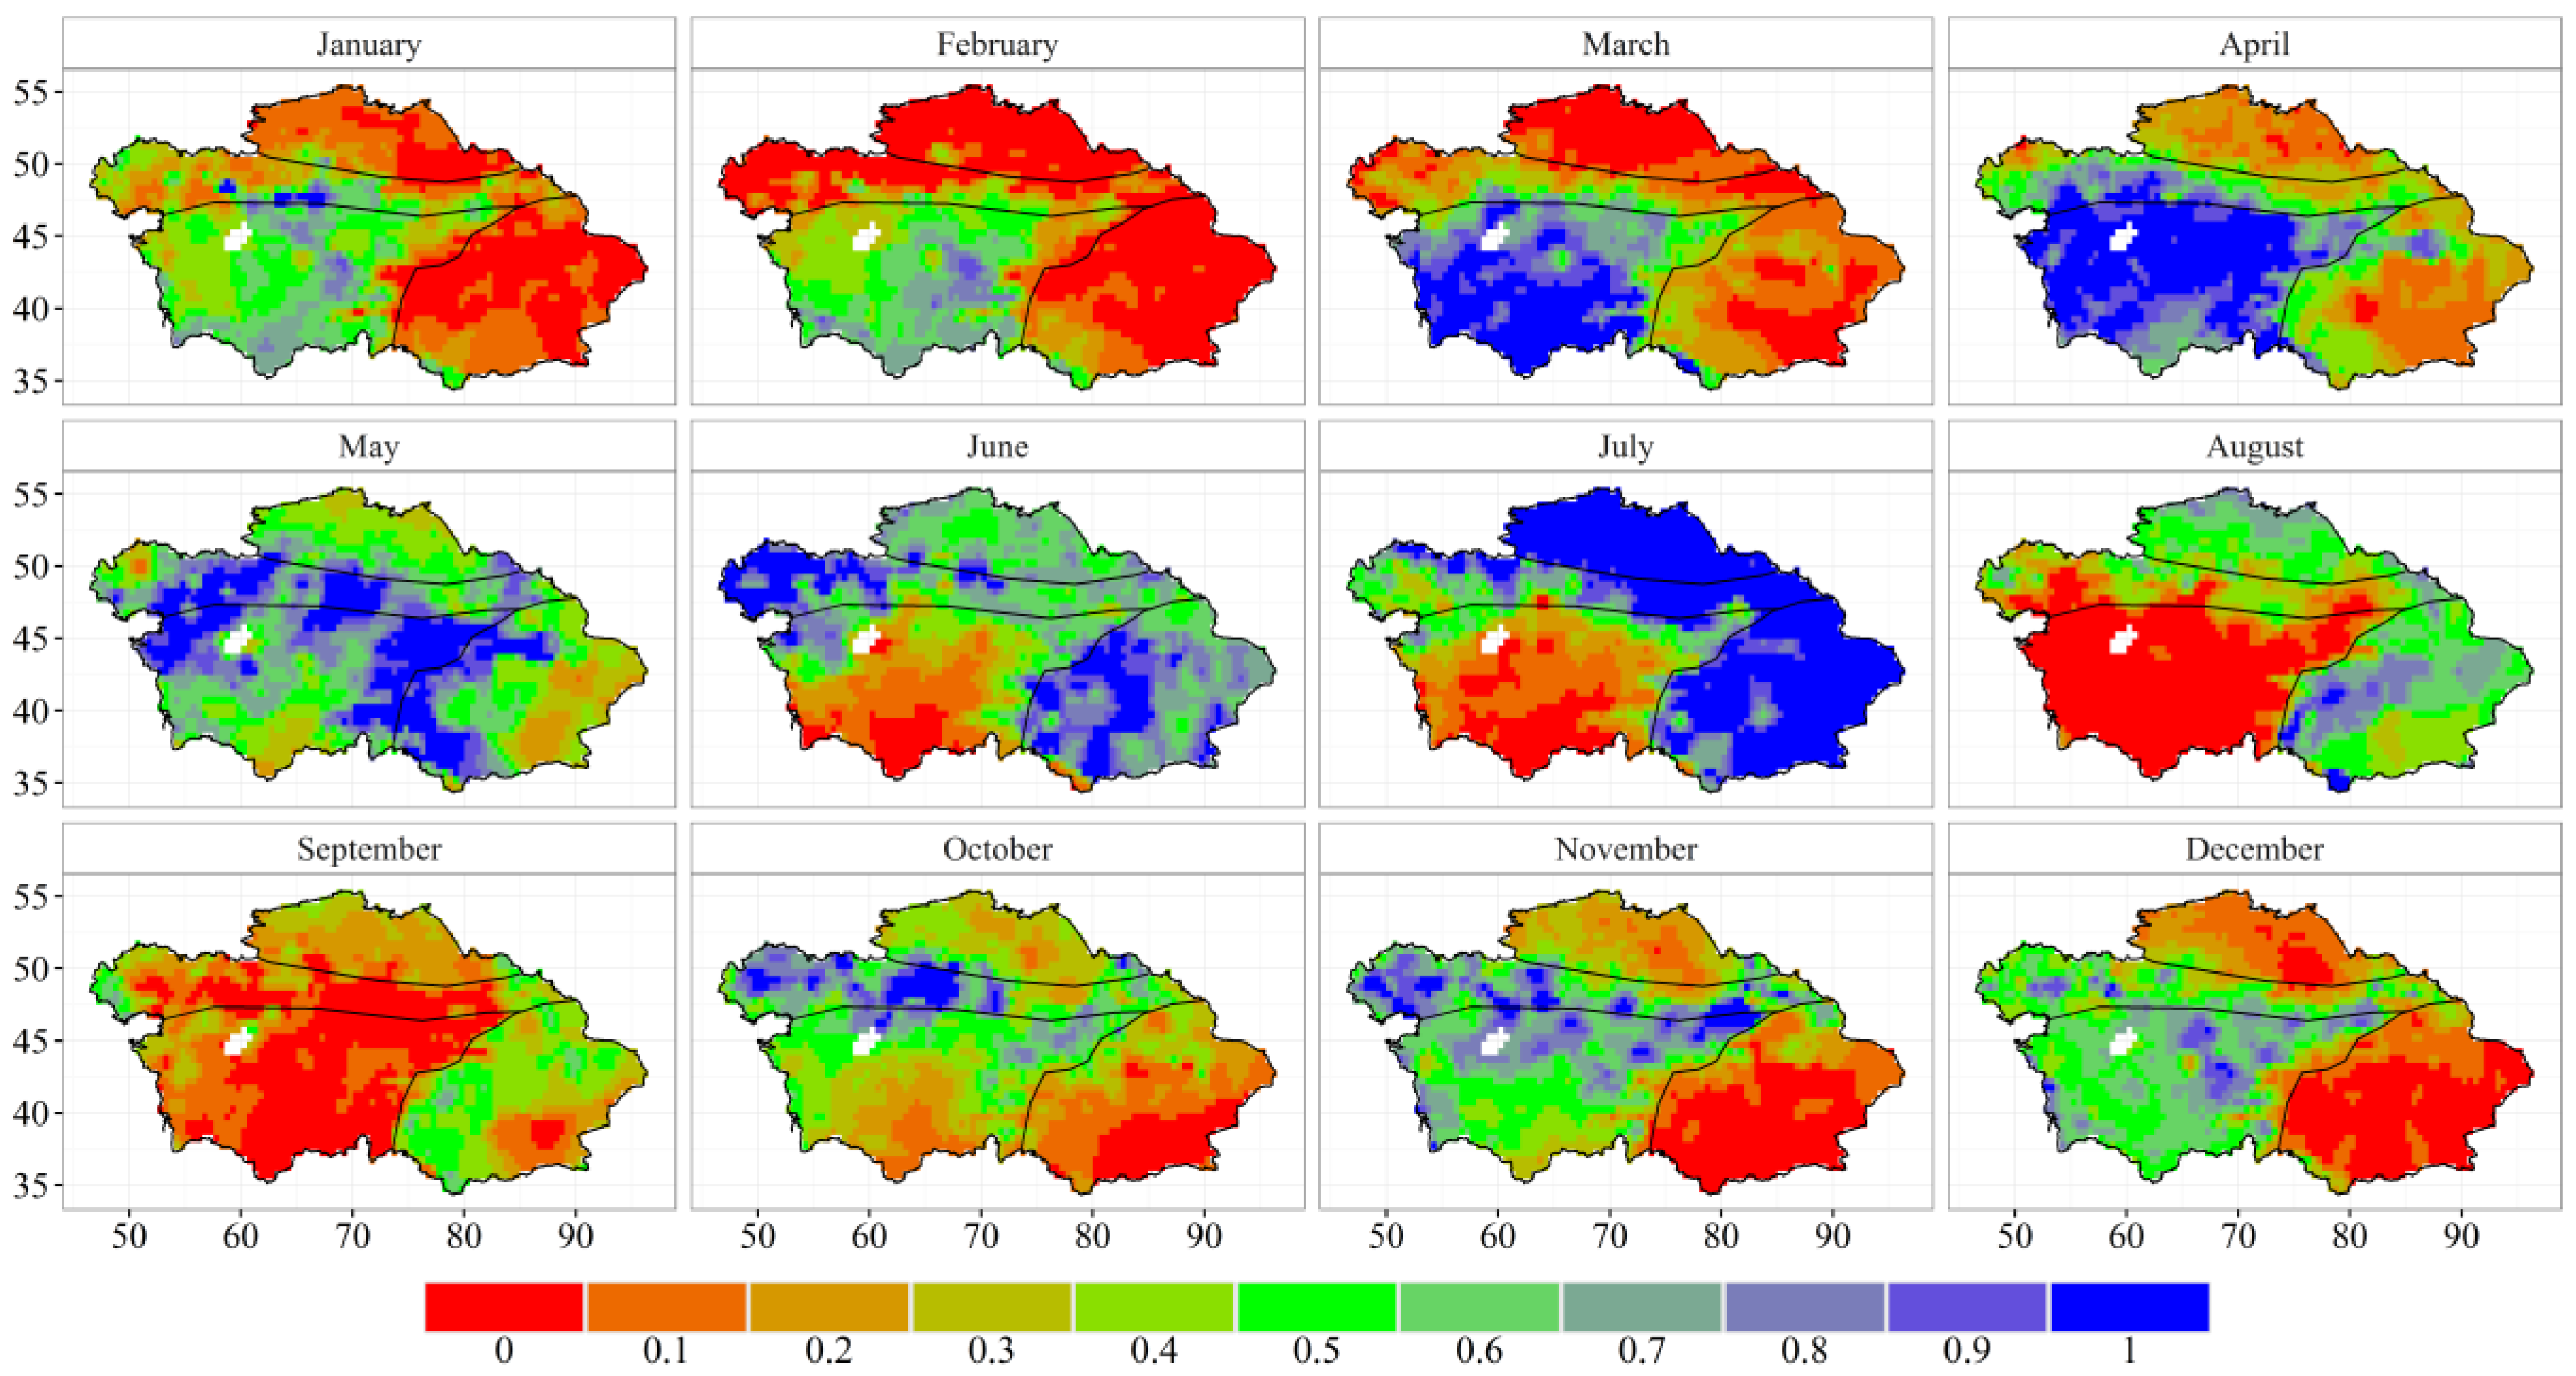
3.2. Subregion Division and Seasonal Cycle of Precipitation

Using the cluster analysis method, we divided Central Asia into four subregions as follows: (1) the North, which includes the northern part of the Kazakh Hills, (2) the Center as the zone of transition, which includes the southern part of the Kazakh Hills and the northern part of the Turan Lowland, (3) the Southwest, which includes the main part of the Turan Lowland and a part of the Tianshan Mountains, and (4) the Southeast, which includes the main part of the Tianshan Mountains, the Junggar Basin and the Tarim Basin (Figure 3).
Then, we calculated regional averages of mean monthly precipitation to obtain the seasonal cycle of precipitation for each subregion. In the North, there was maximum precipitation in July and minimum precipitation in February. However, the seasonal cycle of the Southwest was typically a ‘two peak’ type with the first peak occurring in April, and the second peak occurring in December, without ignoring the minimum precipitation observed in August. For the Center, the zone of transition between the North and the Southwest, for each month, precipitation was higher than the Southwest region’s and less than in the North. Additionally, the seasonal cycle of the Center was smooth and steady with maximum precipitation in July and minimum precipitation in February. For the Southeast, the seasonal cycle was typically a ‘single peak’ type with the maximum precipitation registered in July and the minimum precipitation recorded in January (Figure 3). Figure 4 displays the spatial distribution of the monthly precipitation in Central Asia based on the GPCC, which is consistent with regional patterns in Figure 3.

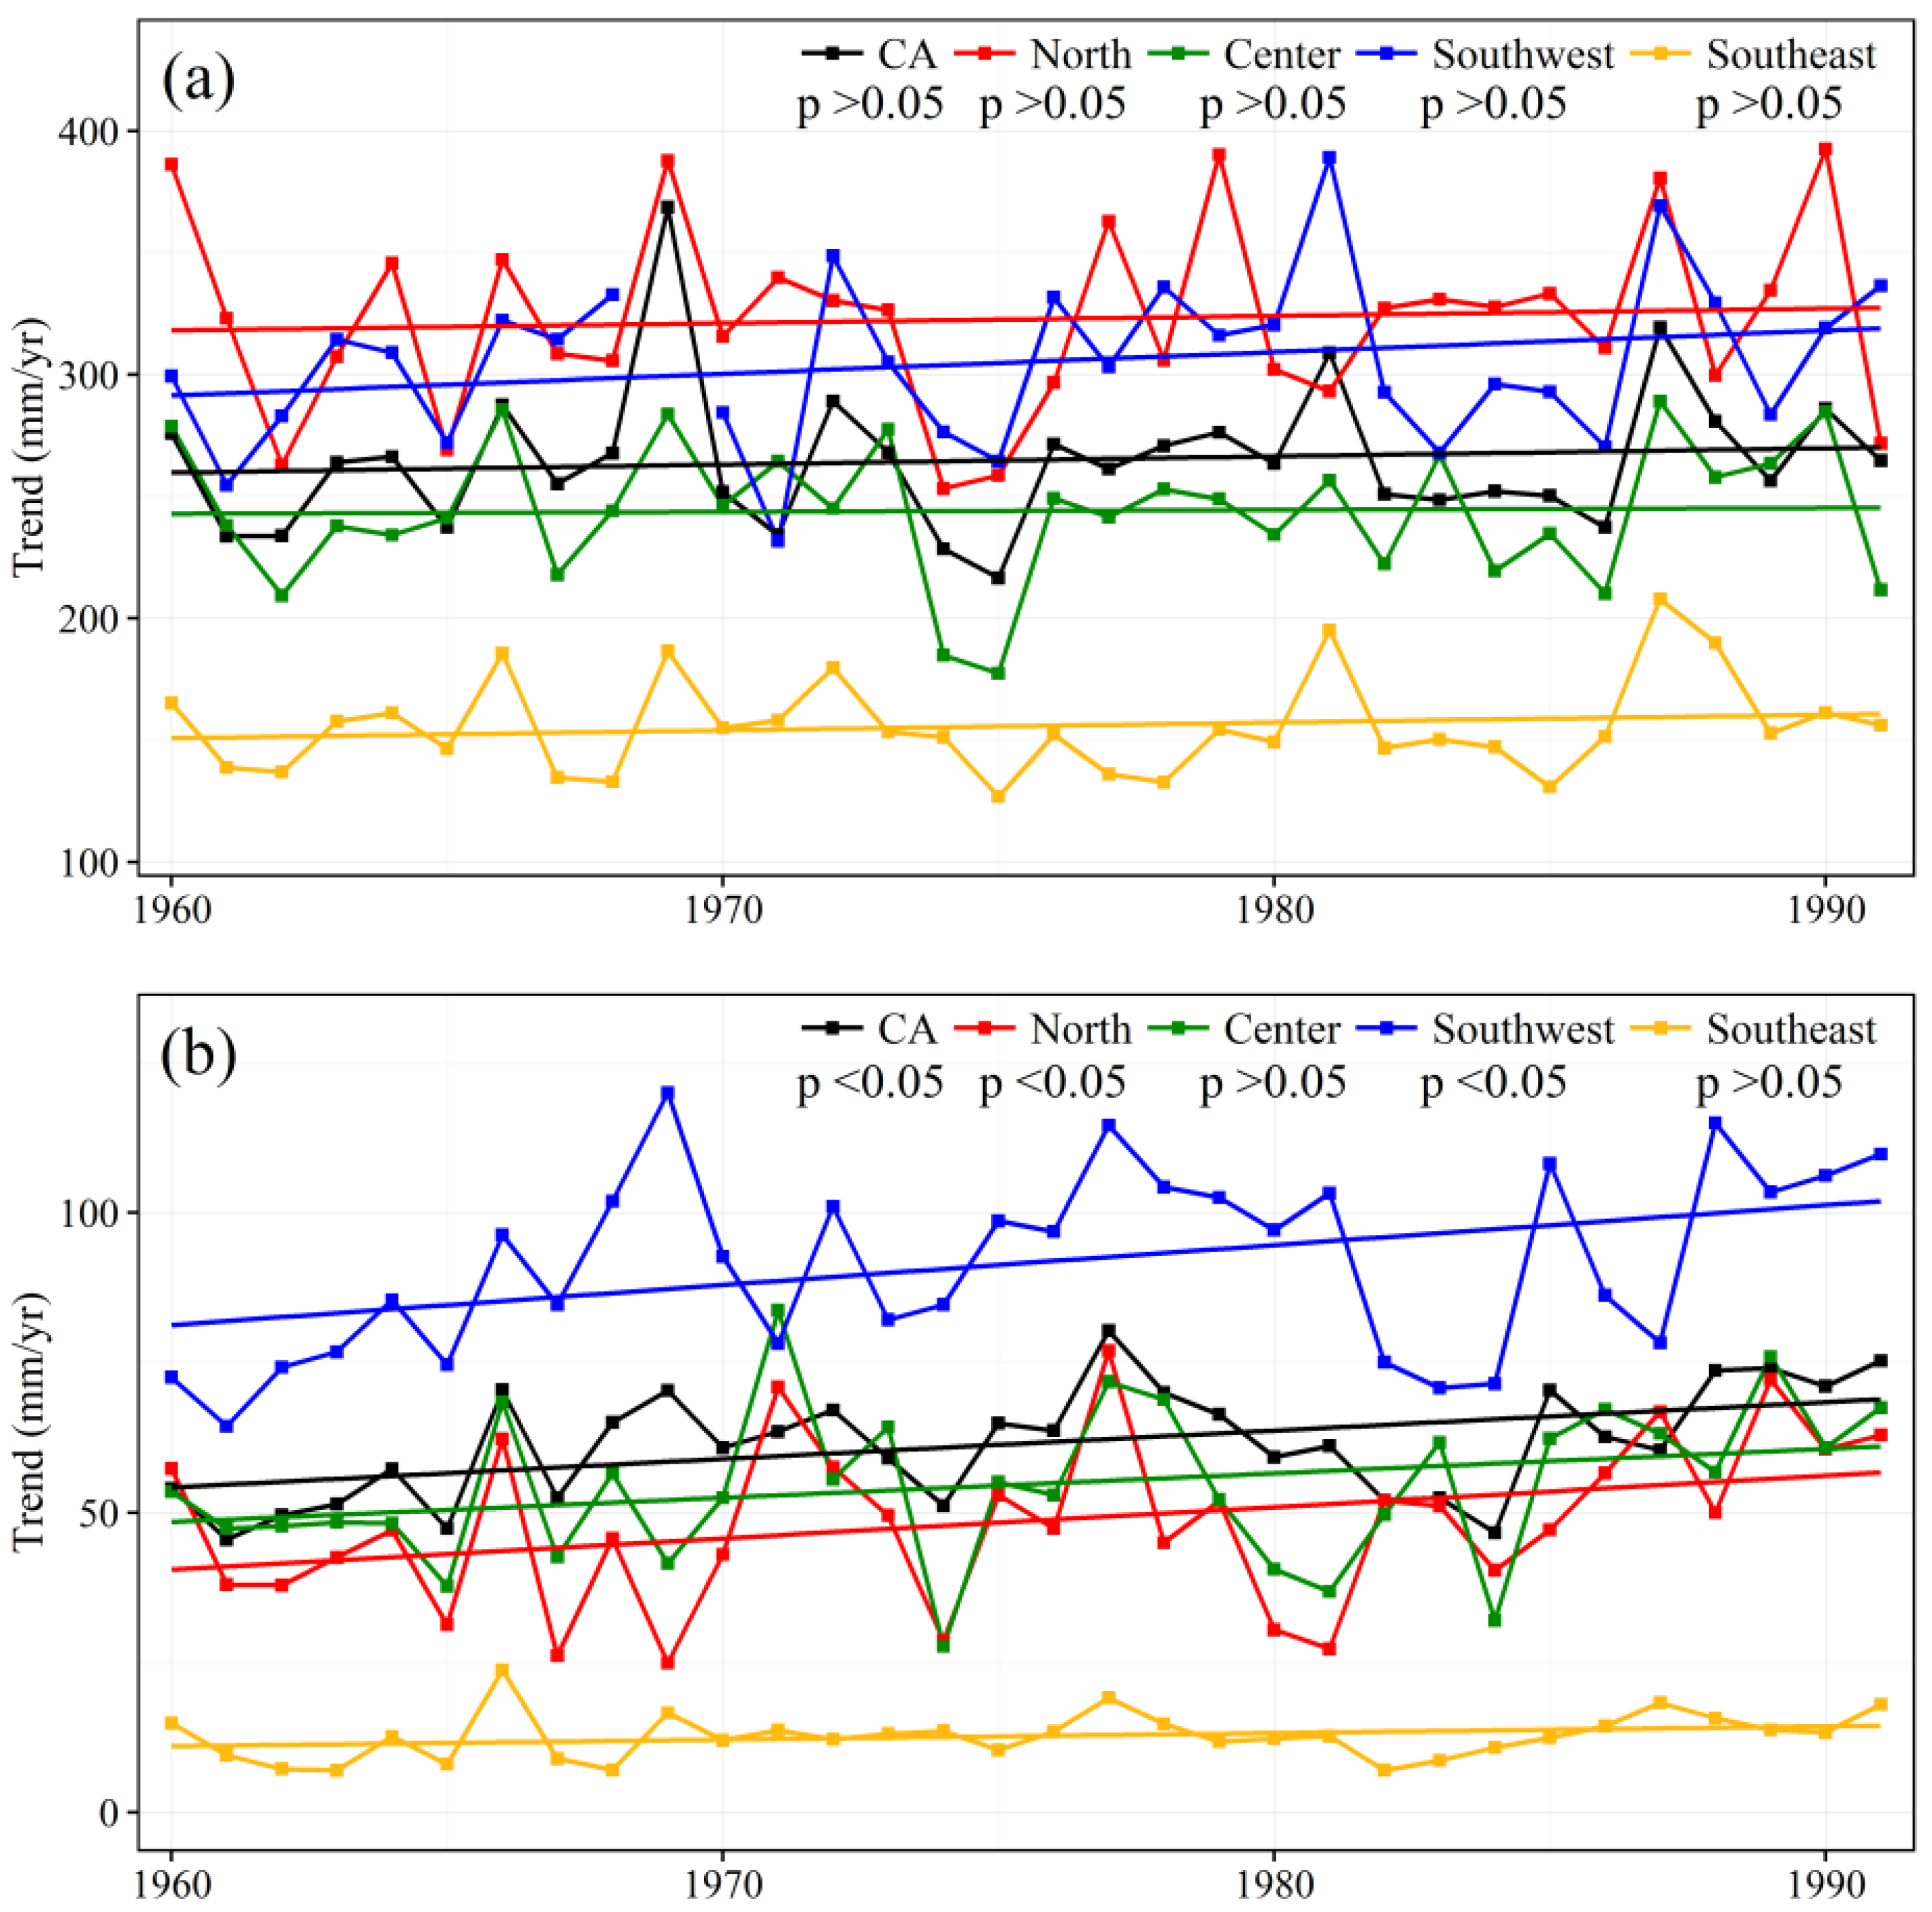
3.3. Variations in Precipitation from 1960–1991

Observations from 240 stations covering the period 1960–1991 were used to detect trends of precipitation over Central Asia and four subregions from 1960–1991. The annual precipitation across the entire Central Asia did not exhibit a significant trend but displayed significant increasing trends in winter.
At an annual scale, the precipitation in Central Asia and the four subregions did not exhibit significant trends (p > 0.05) according to the M-K test (Figure 5a, Table 2). At a seasonal scale, Central Asia, the North and the Southwest displayed significantly increasing trends (p < 0.05) in winter precipitation (Figure 5b), with respective rates of 0.49, 0.52, and 0.67 mm/year according to linear least squares fitting, whereas the Center and the Southeast exhibited insignificant trends in winter. No significant trends were detected for Central Asia and the four subregions in spring, summer, and autumn (Table 2).

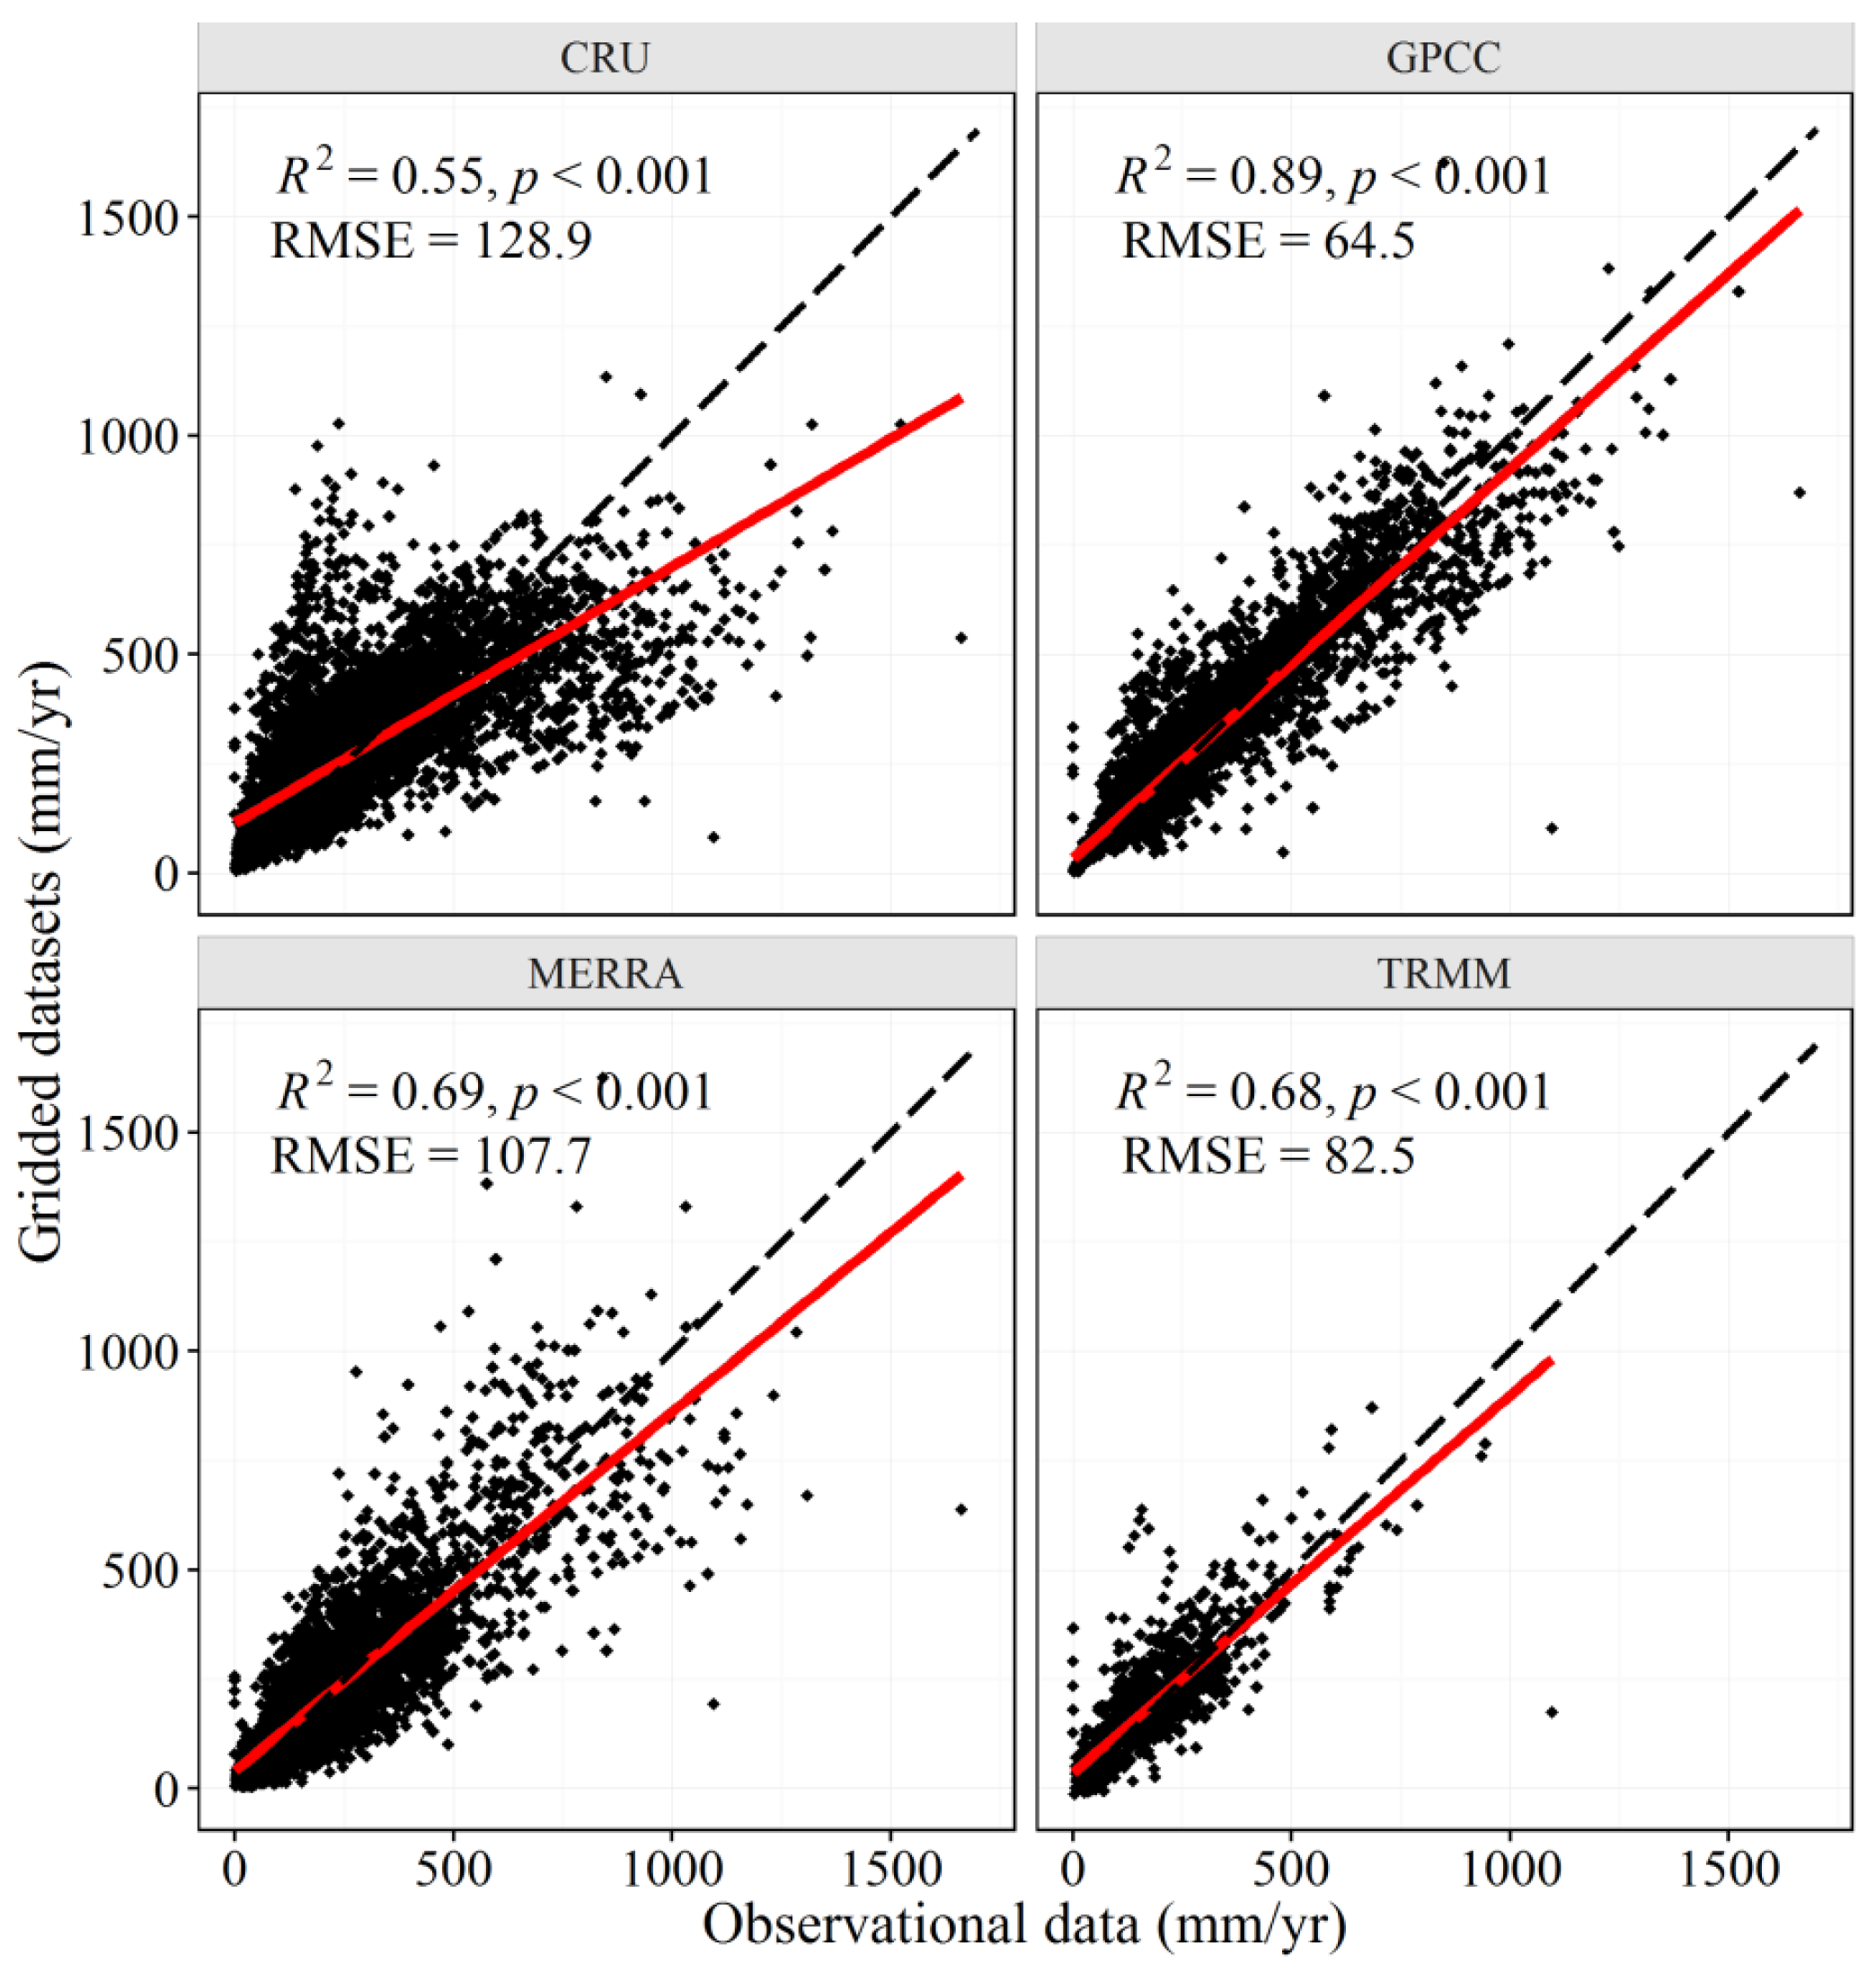
3.4. Validations of the Four Gridded Datasets against Observational Data

Four gridded datasets (CRU, GPCC, MERRA, and TRMM) were validated against all of the 341 stations observations. As Figure 6 displays, all annual precipitation from CRU, GPCC, MERRA, and TRMM was significantly (p < 0.05) correlated with the gauged observations, with correlation coefficients (R2) of 0.55, 0.89, 0.69, and 0.68, respectively. The root-mean-square errors (RMSE) of CRU, GPCC, MERRA, and TRMM against observational data were 128.9, 64.5, 107.7, and 82.5 mm/year, respectively. In conclusion, the GPCC dataset had the highest R2 (0.89) and lowest RSME (64.5 mm/year) among the four gridded datasets. The results indicated that GPCC was the most suitable dataset to describe the precipitation in Central Asia.

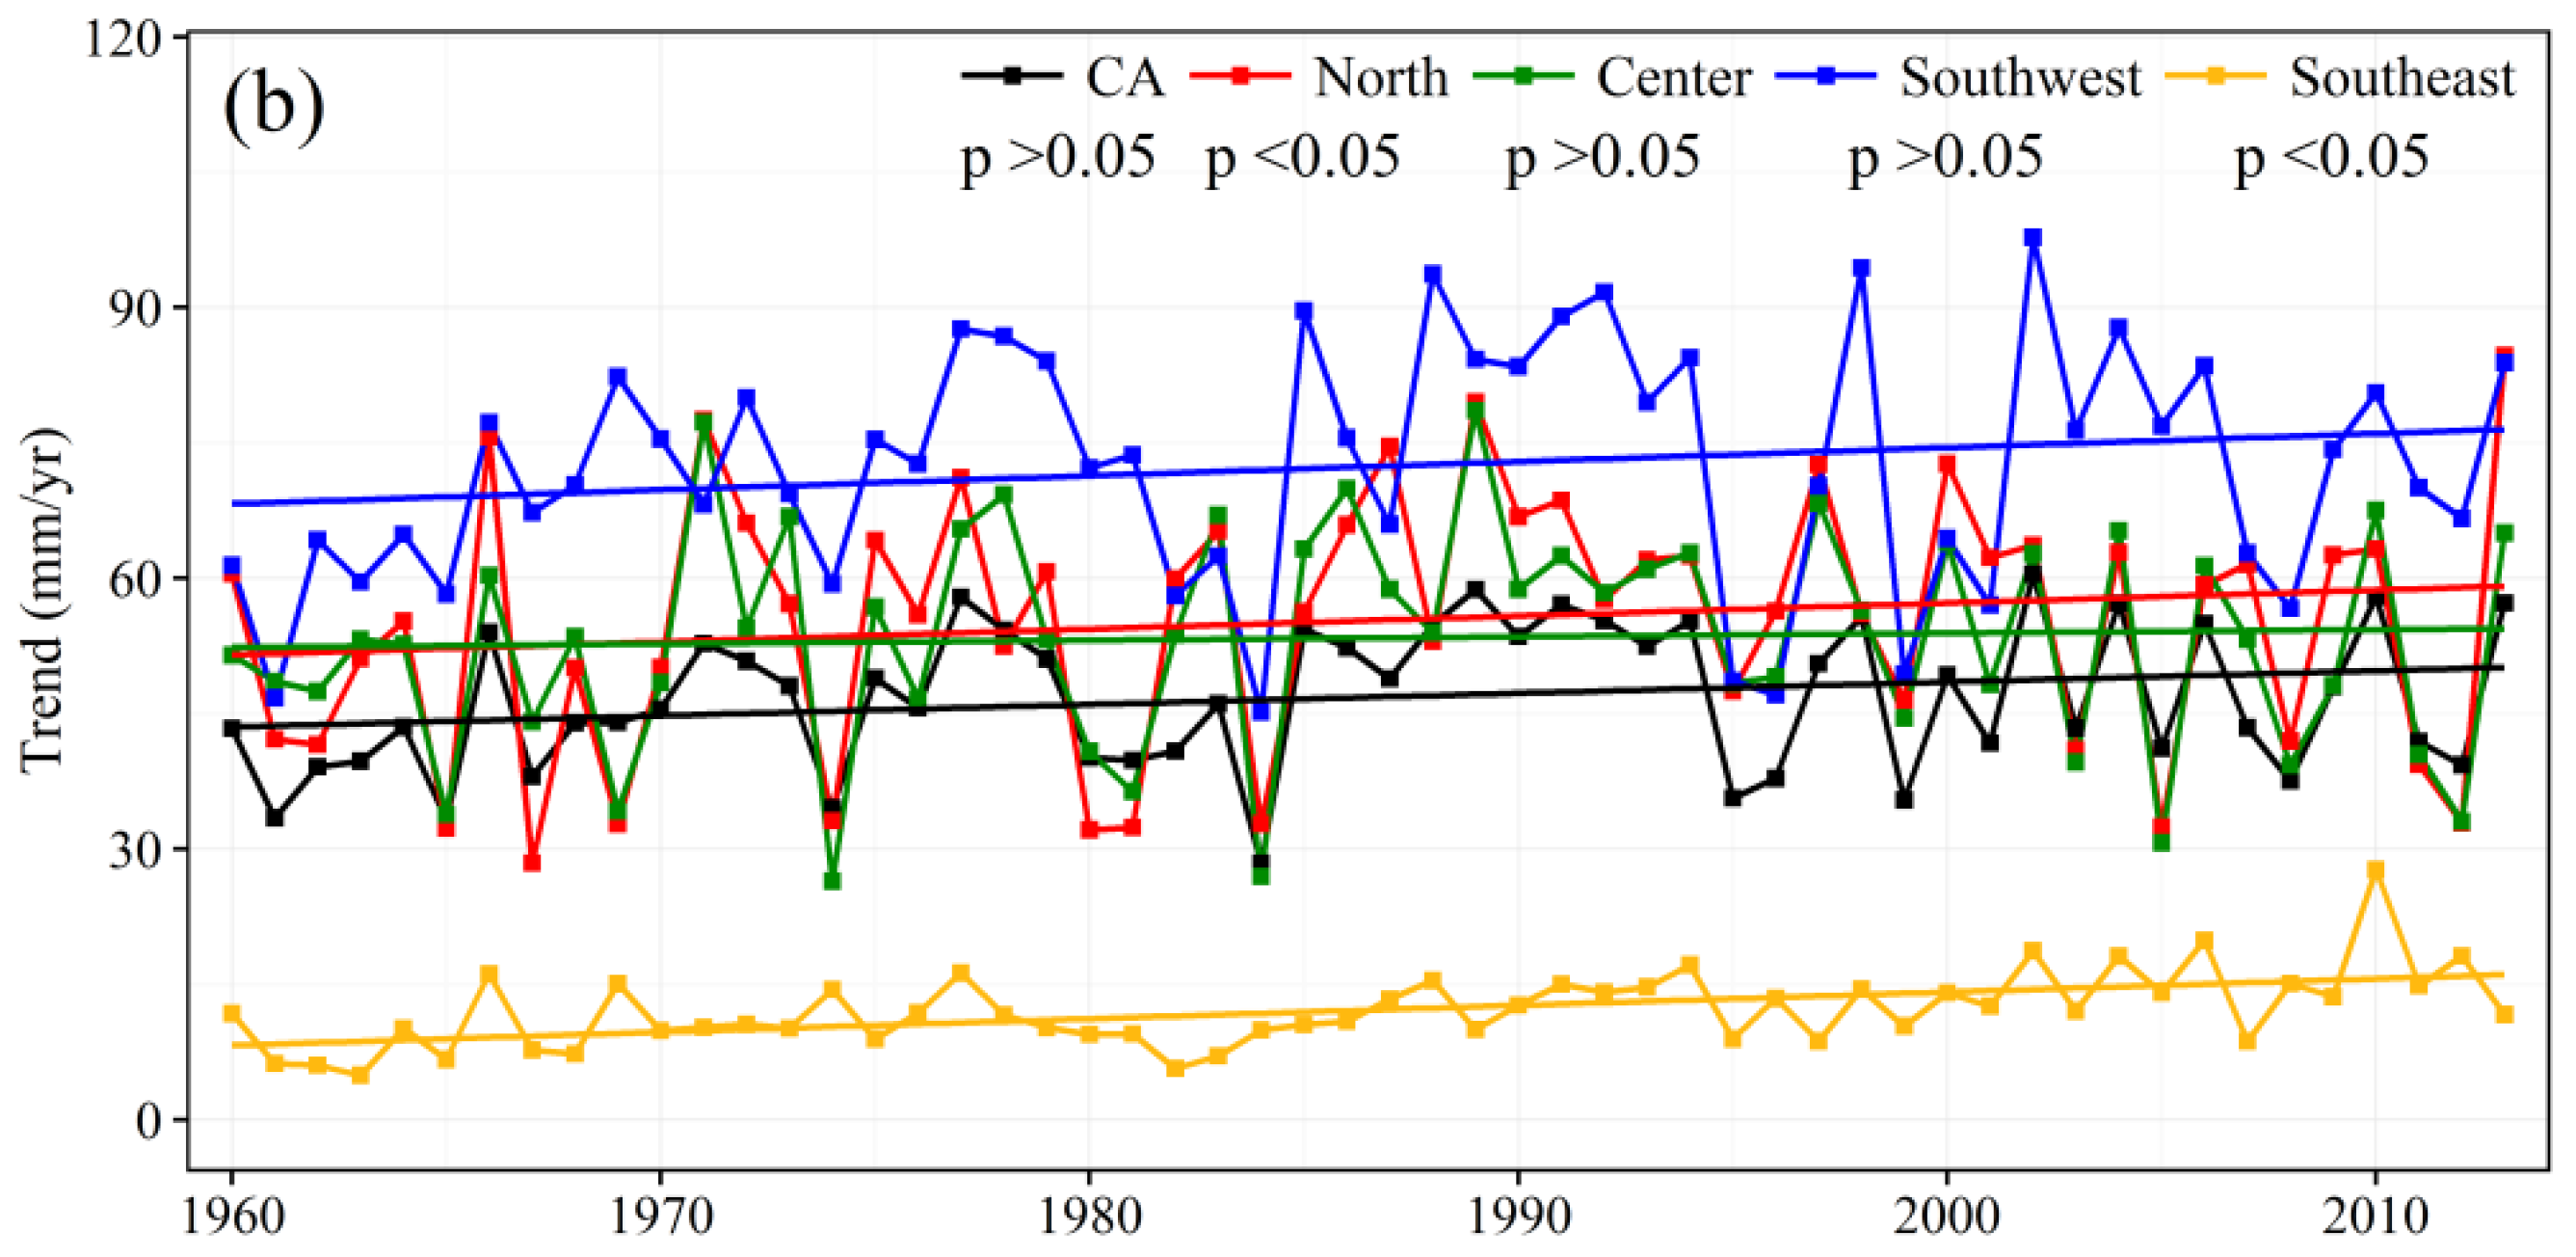
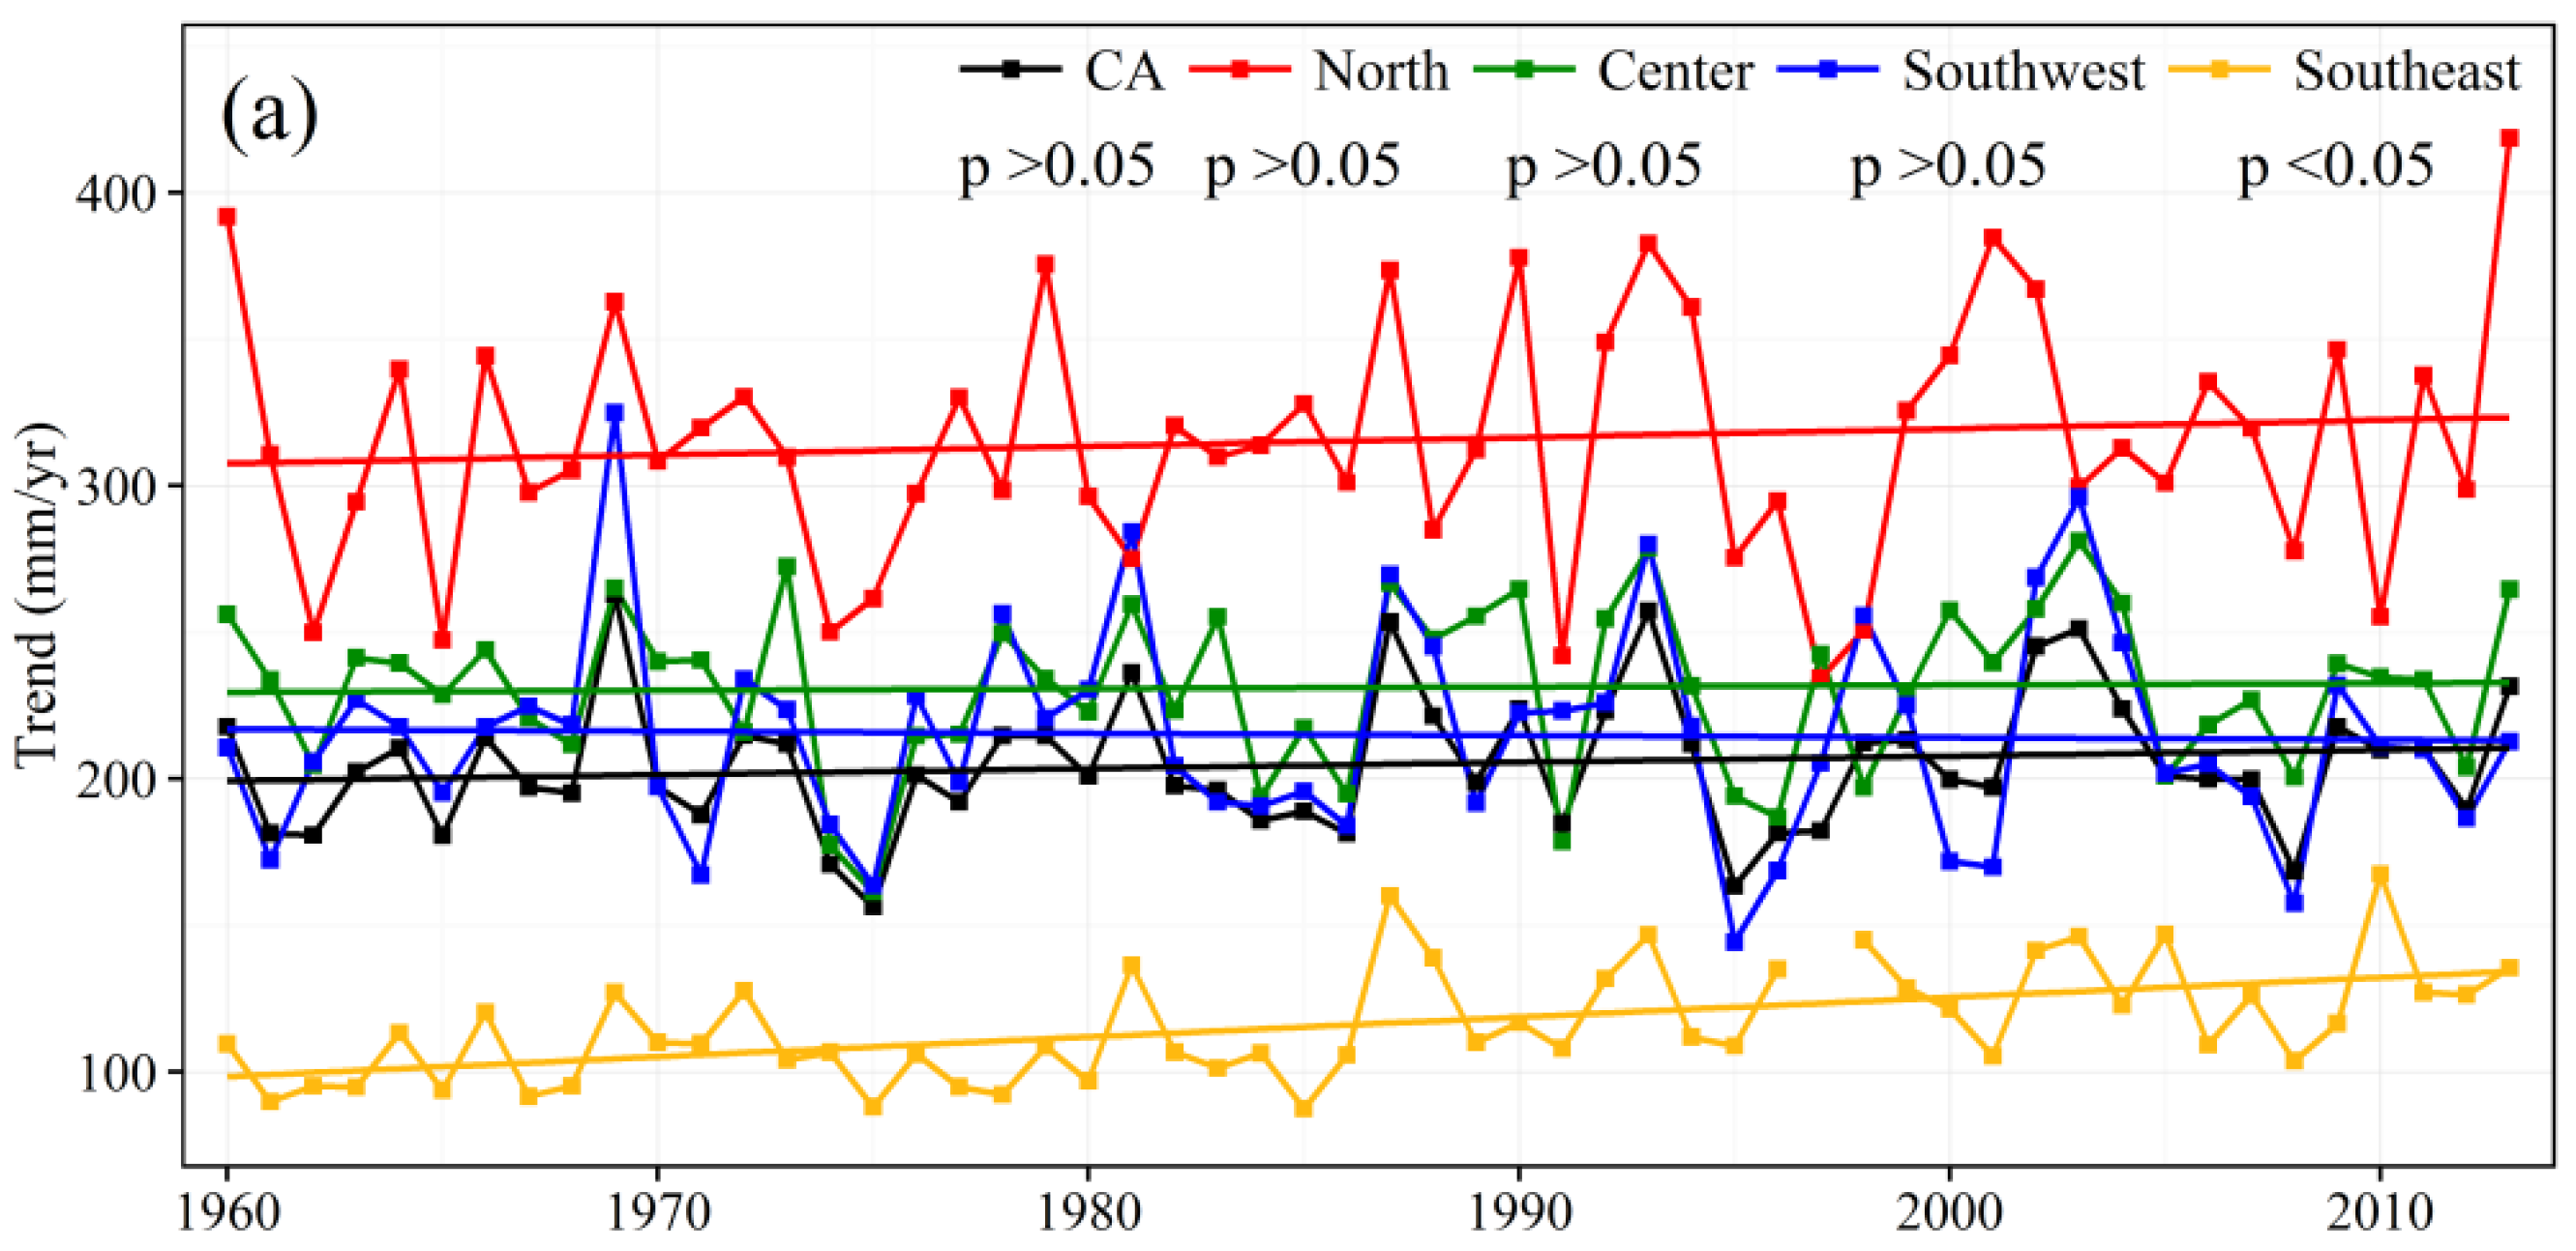
3.5. Spatial and Temporal Variations of Precipitation from 1960–2013

Since there were not enough observational data after 1991, the selected GPCC datasets were used to detect the spatial temporal trends of precipitation over Central Asia from 1960-2013. The results indicated that annual precipitation did not exhibit a significantly increasing trend, while precipitation in winter significantly increased in Central Asia, which was consistent with the observed trends from 1960–1991.
At an annual scale, only precipitation in the Southeast exhibited a significant increase (p < 0.05) of 0.64 mm/year (Figure 7a, Table 3). Spatially, a significant increasing trend was observed over most regions of the Southeast. Except for the Southeast, almost the same area with increasing and decreasing trends was located in the North, the Center, and the Southeast (Figure 8a). At a seasonal scale, precipitation over Central Asia displayed a significantly (p < 0.05) increasing trend of 0.11 mm/year in winter. In the Southeast, precipitation increased significantly in all seasons, with rates of 0.16 mm/year in spring, 0.27 mm/year in summer, 0.13 mm/year in autumn and 0.13 mm/year in winter. In the North, the Center, and the Southwest, no significant trends were identified in any season except for the North and the Center in spring (Figure 7b, Table 3). Spatially, an increasing trend was observed over most regions of Central Asia. Furthermore, an area with significant increasing trends was located in the North, the Southeast, and southern part of the Tianshan Mountains (Figure 8b).

4. Discussion

The results indicated that the GPCC dataset was the most suitable dataset to describe the precipitation across Central Asia. This is probably because GPCC uses about 30 data sources with a maximum number of 49,450 stations [19,20]. CRU is also a station-based interpolation, but it uses only 4,000 stations; therefore it makes sense that comparing CRU to the local stations yields worse results. TRMM satellite data and MERRA reanalysis data are independent of local surface observations of precipitation, and had poor performance in Central Asia, which is consistent with the research of Guo, et al. [14]. In the study conducted by Hu, et al. [16], the RMSE of GPCC was lower than that of MERRA, ERA-Interim, CFSR in Central Asia. In addition, GPCC also performed well in other arid regions [26,27]. Furthermore, both GPCC and CRU are station-based interpolation datasets. There are two major error sources (systematic measuring error and stochastic sampling error) associated with gauge-based measurement of precipitation. Of the sources of bias, wind-induced undercatch of solid precipitation is by far the largest [28], especially in Central Asia, where snow makes an important contribution to total precipitation. Parameters affecting the accuracy of measurement are features of the instrument used (shape, size, exposition, etc.) and the meteorological conditions (wind, air temperature, radiation, humidity) during the precipitation event. However, this information is not available to correct the measuring error for most precipitation stations [20]. There is no accounting of snow undercatch in the precipitation for these two datasets [18,20].
The results shown in Table 2 revealed that only precipitation in winter displayed a significant increasing trend over Central Asia, and that significant increasing trends were detected in all seasons over the Southeast from 1960–2013, which is not true for the other subregions.
In recent years, the global mean surface temperature has increased significantly by 0.85 ℃, especially in winter, according to the IPCC Fifth Assessment Report [29]. Under global warming, some previous studies suggest that there existed a ’dry gets drier, wet gets wetter’ pattern because atmospheric moisture convergence and divergence are expected to increase with increasing atmospheric moisture content in a warmer atmosphere [30,31,32]. However, a recent study by Greve, et al. [33] found that only 10.8% of the global land area shows a robust ‘dry gets drier, wet gets wetter’ pattern, compared to 9.5% of global land area with the opposite pattern, that is, dry gets wetter, and wet gets drier. Globally, precipitation averaged over dry regions shows robust increases in both observations and climate models over the past six decades [34]. In Central Asia, annual precipitation did not exhibit any significant increasing trend, while precipitation of Central Asia displayed significantly increasing trends in winter from 1960–2013. Chen, et al. [11] also found that the annual precipitation in this arid region generally increased during the past 80 years, with an apparent increasing trend (0.07 mm/year) in winter. Global warming, southward shift and intensification of the westerly cyclones and the associated changes of water vapor at the middle latitudes are likely the major factors that increase the precipitation over Central Asia [11,35]. The causes of the regional differences in variations in precipitation may be the physical and dynamic processes of precipitation and land use/land cover changes. Due to the variation of the North Atlantic oscillation (NAO), the column water vapor content increases above the southeast region of Central Asia, where significant increasing trends were detected in all seasons from 1960–2013 according to the results above, while the transient eddy activity becomes intensified in the areas with a further south route moving from Europe, Central Asia throughout northwestern China [36,37]. Local and regional human impacts, such as massive irrigation, may have a stronger impact on the climatic system at the regional level than global climate change [38,39]. Because of the Soviet Union collapse in 1991, arable land decreased sharply until 2000 in the five states of Central Asia [40], while the oasis area in Xinjiang experienced an increasing trend especially from 1975 [41], which may cause increases in evapotranspiration and water vapor in the atmosphere. However, the vapor source and the physical and dynamic processes of precipitation in Central Asia still require further study.

5. Conclusions

In this work, we detected the regional and seasonal differences in precipitation climate characteristics based on observational data from CMA and GHCN and variations in precipitation from 1960–2013 based on the GPCC dataset.
Using observational data, we divided Central Asia into four subregions (North, Center, Southwest, and Southeast) based on the differences in seasonal cycles of precipitation. Both the seasonal cycles of the North and the Southeast displayed a single peak pattern with a peak in July and minimum in February over the North and minimum in January over the Southeast with a smoother curve. The Southwest was a two peak type with the first peak in April and the second peak in December. For the Center, the zone of transition between the North and the Southwest, each monthly precipitation value was higher than the Southwest’s and lower than the North’s.
Four widely used gridded datasets (CRU, GPCC, MERRA, and TRMM) were validated against observational data, and GPCC was proven to be the most suitable dataset to describe precipitation in Central Asia and was used to detect the spatial and temporal trend of precipitation from 1960–2013. The results indicated that the annual precipitation over Central Asia did not exhibit a significant increasing trend, while precipitation in winter displayed a significant increase in winter from 1960–2013. Additionally, significant increasing trends were detected in all seasons over the Southeast during 1960–2013.

Acknowledgments

This research was supported by the Key Laboratory Project of Xinjiang Uygur Autonomous Region, China (2016D03004).

Author Contributions

Shikai Song provided datasets, performed the experiments, and wrote the paper; Jie Bai designed the experiments.

Conflicts of Interest

The authors declare no conflict of interest in this manuscript. The founding sponsors had no role in the design of the study; in the collection, analyses, or interpretation of data; in the writing of the manuscript, and in the decision to publish the results.

References

  1. Gessner, U.; Naeimi, V.; Klein, I.; Kuenzer, C.; Klein, D.; Dech, S. The relationship between precipitation anomalies and satellite-derived vegetation activity in central Asia. Glob. Planet. Chang. 2013, 110, 74–87. [Google Scholar] [CrossRef]
  2. Knorr, W.; Schnitzler, K.G.; Govaerts, Y. The role of bright desert regions in shaping North African climate. Geophys. Res. Lett. 2001, 28, 3489–3492. [Google Scholar] [CrossRef]
  3. Xu, H.; Li, Y.; Xu, G.Q.; Zou, T. Ecophysiological response and morphological adjustment of two central asian desert shrubs towards variation in summer precipitation. Plant. Cell. Environ. 2007, 30, 399–409. [Google Scholar] [CrossRef] [PubMed]
  4. Folland, C.K.; Rayner, N.A.; Brown, S.J.; Smith, T.M.; Shen, S.S.P.; Parker, D.E.; Macadam, I.; Jones, P.D.; Jones, R.N.; Nicholls, N. Global temperature change and its uncertainties since 1861. Geophys. Res. Lett. 2001, 28, 2621–2624. [Google Scholar] [CrossRef]
  5. Stocker, T.F.; Qin, D.; Plattner, G.K.; Tignor, M.; Allen, S.K.; Boschung, J.; Nauels, A.; Xia, Y.; Bex, V.; Midgley, P.M. The Physical science basis. Contribution of Working Group I to the Fifth Assessment Report of the Intergovernmental Panel on Climate Change; Cambridge University Press: Cambridge, UK, 2013. [Google Scholar]
  6. Taikan, O.; Shinjiro, K. Global hydrological cycles and world water resources. Science 2006, 313, 1068–1072. [Google Scholar]
  7. Yohe, G.; Malone, E.; Brenkert, A.; Schlesinger, M.; Meij, H.; Xing, X.S.; Lee, D. A Synthetic Assessment of the Global Distribution of Vulnerability to Climate Change from the IPCC Perspective that Reflects Exposure and Adaptive Capacity. Available online: http://ciesin.columbia (accessed on 8 July 2006).
  8. Borovikova, L.N. Description of the State of the National Hydrometeorological Surveys and Concept for Their Future Development; Report No. 4 World Bank Program 2.1; Improvement of hydrometeorological surveys in Central Asia: Tashkent, Usbekistan, 1997. [Google Scholar]
  9. Schiemann, R.; Lüthi, D.; Vidale, P.L.; Schär, C. The precipitation climate of central Asia—Intercomparison of observational and numerical data sources in a remote semiarid region. Int. J. Climatol. 2008, 28, 295–314. [Google Scholar] [CrossRef]
  10. Small, E.E.; Giorgi, F.; Sloan, L.C. Regional climate model simulation of precipitation in central Asia: Mean and interannual variability. J. Geophys. Res. 1999, 104, 6563–6582. [Google Scholar] [CrossRef]
  11. Chen, F.H.; Huang, W.; Jin, L.Y.; Chen, J.H.; Wang, J.S. Spatiotemporal precipitation variations in the arid central Asia in the context of global warming. Sci. China Earth Sci. 2011, 54, 1812–1821. [Google Scholar] [CrossRef]
  12. Bothe, O.; Fraedrich, K.; Zhu, X.H. Precipitation climate of central Asia and the large-scale atmospheric circulation. Theor. Appl. Climatol. 2012, 108, 345–354. [Google Scholar] [CrossRef]
  13. Huang, Q.X.; Zhao, Y.; He, Q. Climatic characteristics in central Asia based on cru data. Arid Zone Res. 2013, 30, 396–403. [Google Scholar]
  14. Guo, H.; Chen, S.; Bao, A.M.; Hu, J.J.; Gebregiorgis, A.; Xue, X.W.; Zhang, X.H. Inter-comparison of high-resolution satellite precipitation products over central Asia. Remote Sens. Basel 2015, 7, 7181–7212. [Google Scholar] [CrossRef]
  15. Zhu, X.F.; Zhang, M.J.; Wang, S.J.; Qiang, F.; Zeng, T.; Ren, Z.G.; Dong, L. Comparison of monthly precipitation derived from high-resolution gridded datasets in arid Xinjiang, central Asia. Quatern. Int. 2015, 358, 160–170. [Google Scholar] [CrossRef]
  16. Hu, Z.Y.; Hu, Q.; Zhang, C.; Chen, X.; Li, Q.X. Evaluation of reanalysis, spatially-interpolated and satellite remotely-sensed precipitation datasets in Central Asia. J. Geophys. Res. Atmos. 2016. [Google Scholar] [CrossRef]
  17. Peterson, T.C.; Vose, R.S. An overview of the global historical climatology network temperature database. Bull. Am. Meteorol. Soci. 1997, 78, 2837–2849. [Google Scholar] [CrossRef]
  18. Harris, I.; Jones, P.D.; Osborn, T.J.; Lister, D.H. Updated high-resolution grids of monthly climatic observations - the cru ts3.10 dataset. Int. J. Climatol. 2014, 34, 623–642. [Google Scholar] [CrossRef] [Green Version]
  19. Rudolf, B.; Beck, C.; Grieser, J.; Schneider, U. Global Precipitation Analysis Products of the GPCC. Available online: http://www.juergen-grieser.de/publications/publications_pdf/GPCC-intro-products-2005.pdf (accessed on 16 October 2016).
  20. Schneider, U.; Becker, A.; Finger, P.; Meyer-Christoffer, A.; Rudolf, B.; Ziese, M. GPCC full data reanalysis version 7.0 at 0.5°: Monthly land-surface precipitation from rain-gauges built on GTS-based and historic data. Rep. Ger. Weather Serv. 2015. [Google Scholar] [CrossRef]
  21. Rienecker, M.M.; Suarez, M.J.; Gelaro, R.; Todling, R.; Bacmeister, J.; Liu, E.; Bosilovich, M.G.; Schubert, S.D.; Takacs, L.; Kim, G.K. Merra: Nasa’s modern-era retrospective analysis for research and applications. J. Clim. 2011, 24, 3624–3648. [Google Scholar] [CrossRef]
  22. Huffman, G.J.; Bolvin, D.T.; Nelkin, E.J.; Wolff, D.B.; Adler, R.F.; Gu, G.J.; Hong, Y.; Bowman, K.P.; Stocker, E.F. The TRMM Multisatellite Precipitation Analysis (TMPA): Quasi-global, multiyear, combined-sensor precipitation estimates at fine scales. J. Hydrometeorol. 2007, 8, 38–55. [Google Scholar] [CrossRef]
  23. Farlie, D.J.G. Rank correlation methods. J. R Stat. Soc. Ser. A-G 1971, 134, 682. [Google Scholar] [CrossRef]
  24. Hamed, K.H. Trend detection in hydrologic data: The Mann-Kendall trend test under the scaling hypothesis. J. Hydrol. 2008, 349, 350–363. [Google Scholar] [CrossRef]
  25. Yue, S.; Wang, C.Y. Applicability of prewhitening to eliminate the influence of serial correlation on the Mann-Kendall test. Water Res. Res. 2002, 38, 7. [Google Scholar] [CrossRef]
  26. Nicholson, S.E.; Some, B.; Mccollum, J.; Nelkin, E.; Klotter, D.; Berte, Y.; Diallo, B.M.; Gaye, I.; Kpabeba, G.; Ndiaye, O. Validation of TRMM and other rainfall estimates with a high-density gauge dataset for west Africa. Part i: Validation of GPCC rainfall product and pre-TRMM satellite and blended products. J. Appl. Meteorol. 2003, 42, 1337–1354. [Google Scholar] [CrossRef]
  27. Raziei, T.; Bordi, I.; Pereira, L.S. An application of GPCC and NCEP/NCAR datasets for drought variability analysis in Iran. Water Resour. Manag. 2011, 25, 1075–1086. [Google Scholar] [CrossRef]
  28. Adam, J.C.; Lettenmaier, D.P. Adjustment of global gridded precipitation for systematic bias. J. Geophys. Res. 2003, 108, 1414–1422. [Google Scholar] [CrossRef]
  29. Stocker, T.F.; Dahe, Q.; Plattner, G. Working Group I Contribution to the IPCC Fifth Assessment Report Climate Change 2013, the Physical Science Basis; Final draft underlying scientific-technical assessment IPCC: Bern, Switzerland, 2013. [Google Scholar]
  30. Held, I.M.; Soden, B.J. Robust responses of the hydrological cycle to global warming. J. Clim. 2006, 19, 5686–5699. [Google Scholar] [CrossRef]
  31. Allen, M.; Ingram, W.J. Constraints on future changes in climate and the hydrologic cycle. Nature 2002, 419, 224–232. [Google Scholar] [CrossRef] [PubMed]
  32. Dore, M.H.I. Climate change and changes in global precipitation patterns: What do we know? Environ. Int. 2005, 31, 1167–1181. [Google Scholar] [CrossRef] [PubMed]
  33. Greve, P.; Orlowsky, B.; Mueller, B.; Sheffield, J.; Reichstein, M.; Seneviratne, S.I. Corrigendum: Global assessment of trends in wetting and drying over land. Nat. Geosci. 2014, 7, 848–852. [Google Scholar] [CrossRef]
  34. Donat, M.G.; Lowry, A.L.; Alexander, L.V.; O’Gorman, P.A.; Maher, N. More extreme precipitation in the world’s dry and wet regions. Nat. Clim. Chang. 2016. [Google Scholar] [CrossRef]
  35. Lioubimtseva, E.; Cole, R. Uncertainties of climate change in arid environments of central Asia. Rev. Fish. Sci. 2006, 14, 29–49. [Google Scholar] [CrossRef]
  36. Dai, X.G.; Wang, P.; Zhang, K.J. A study on precipitation trend and fluctuation mechanism in northwestern china over the past 60 years. Acta Phys. Sin.-Ch. Ed. 2013, 62, 129201–129210. [Google Scholar]
  37. Li, B.F.; Chen, Y.N.; Chen, Z.S.; Xiong, H.G.; Lian, L.S. Why does precipitation in northwest china show a significant increasing trend from 1960 to 2010? Atmos. Res. 2016, 167, 275–284. [Google Scholar] [CrossRef]
  38. Jaramillo, F.; Destouni, G. Developing water change spectra and distinguishing change drivers worldwide. Geophys. Res. Lett. 2014, 41, 8377–8386. [Google Scholar] [CrossRef]
  39. Jaramillo, F.; Destouni, G. Local flow regulation and irrigation raise global human water consumption and footprint. Science 2015, 350, 1248–1251. [Google Scholar] [CrossRef] [PubMed]
  40. Han, Q.F.; Luo, G.P.; Bai, J.; Li, J.L.; Li, C.F.; Fan, B.B.; Wang, Y.G. Characteristics of land use and cover change in central Asia in recent 30 years. Arid Land Geogr. 2012, 35, 909–918. [Google Scholar]
  41. Wang, Y.G.; Luo, G.P.; Zhao, S.B.; Han, Q.F.; Li, C.F.; Fan, B.B.; Chen, Y.L. Effects of arable land change on regional carbon balance in Xinjiang. Acta. Geogr. Sin. 2014, 69, 110–120. [Google Scholar]
Figure 1. The study area and the geographical distribution of meteorological stations.
Atmosphere 07 00139 g001
Figure 2. The distribution of the mean annual precipitation (mm) based on meteorological stations in Central Asia.
Atmosphere 07 00139 g002
Figure 3. The four subregions (North, Center, Southwest, and Southeast) and the seasonal cycle of precipitation (mm/month).
Atmosphere 07 00139 g003
Figure 4. Spatial distribution of monthly precipitation in Central Asia based on the GPCC dataset. The twelve monthly precipitation values in each pixel were transformed into 0-1, and the minimum value was set as 0 while maximum was set as 1.
Atmosphere 07 00139 g004
Figure 5. Variations in precipitation (mm/year) of Central Asia (CA) and four subregions from 1960–1991. (a) Annual; (b) Winter.
Atmosphere 07 00139 g005
Figure 6. Validations of the four gridded datasets against observational data.
Atmosphere 07 00139 g006
Figure 7. Variations in annual precipitation (mm/year) of Central Asia (CA) and four subregions from 1960-2013. (a) Annual; (b) Winter.
Atmosphere 07 00139 g007aAtmosphere 07 00139 g007b
Figure 8. Spatial trends in winter precipitation (mm/year) over Central Asia and four subregions from 1960–2013.
Atmosphere 07 00139 g008
Table 1. Precipitation datasets used in this study.
DatasetVersionSpatial ResolutionTime SpanDescription and Data Source
Climate Research Unit (CRU)TS3.100.5° × 0.5°1901–2013Angular distance-weighted (ADW) interpolation based on records from 4,000 meteorological stations.
Global Precipitation Climatology Centre (GPCC)V7.00.5° × 0.5°1901–2013Interpolation based on quality controlled data from all stations in GPCC's data base available for the required month with a maximum number of 49,450 stations.
Modern Era Retrospective-Analysis for Research and Applications (MERRA)V2.10.5° × 0.67°1979–2013NASA Re-analysis for the satellite era using a major new version of the Goddard Earth Observing System Data Assimilation System Version 5 (GEOS-5).
Tropical Rainfall Measuring Mission (TRMM)V7.00.25° × 0.25°1998–2013TRMM satellite product.
Table 2. Trends in annual and seasonal precipitation (mm/year) for Central Asia (CA) and four subregions from 1960–1991.
RegionAnnualSpringSummerAutumnWinter
SlopepSlopepSlopepSlopepSlopep
CA0.33NS−0.2NS−0.11NS0.15NS0.49**
North0.3NS0.16NS−0.87NS0.47NS0.52*
Center0.08NS−0.1NS−0.3NS0.07NS0.4NS
Southwest0.45NS−0.43NS0.06NS0.09NS0.67*
Southeast0.32NS−0.03NS0.08NS0.16NS0.1NS
Symbols *, **, and *** represent significance at the 0.05, 0.01, 0.001 levels, respectively. NS indicates “not significant”.
Table 3. Trends in annual and seasonal precipitation (mm/year) for Central Asia (CA) and four subregions from 1960–2013.
RegionAnnualSpringSummerAutumnWinter
SlopepSlopepSlopepSlopepSlopep
CA0.22NS0.04NS0.09NS−0.03NS0.11*
North0.3NS0.29*−0.05NS−0.08NS0.13NS
Center0.06NS0.24*−0.05NS−0.16NS0.04NS
Southwest−0.07NS−0.22NS0.07NS−0.06NS0.13NS
Southeast0.64***0.16*0.27***0.13**0.13***
Symbols *, **, and *** represent significance at the 0.05, 0.01, 0.001 levels, respectively. NS indicates “not significant”.

