Article

Seasonal Variations of Atmospheric Pollution and Air Quality in Beijing

1
College of Geoscience and Surveying Engineering, China University of Mining and Technology, Beijing 100083, China
2
Beijing Key Lab of Spatial Information Integration and Its Applications, Peking University, Beijing 100081, China
*
Authors to whom correspondence should be addressed.
Atmosphere 2015, 6(11), 1753-1770; https://doi.org/10.3390/atmos6111753
Submission received: 30 September 2015 / Revised: 28 October 2015 / Accepted: 4 November 2015 / Published: 18 November 2015

Abstract

:
New ambient air quality standards were released in 2012 and implemented in 2013 with real time monitoring data publication of six atmospheric pollutants: particulate matter (PM)2.5, PM10, O3, SO2, NO2 and CO. According to the new standards, Beijing began to publicize real-time monitoring data of 35 monitoring stations in 2013. In this study, real time concentrations of all six atmospheric pollutants of all 35 monitoring stations were collected from September 2014 to August 2015 to investigate the spatial and temporal pattern of the air quality and atmospheric pollutants. By comparing the annual and seasonal variations of all six pollutants’ concentrations, it was found that particulate matter, especially PM2.5, is still the major contributor to the deterioration of air quality in Beijing. Although the NO2 and O3 concentrations of some stations were still high under certain circumstances, their contributions to air quality index (AQI) were not comparable to those of PM2.5 and PM10. SO2 and CO concentrations have dropped to well below the qualification standards. Winter and autumn were the most polluted seasons for all pollutants except O3, whose concentrations are higher in summer. South and southeast stations were the most polluted compared with the rest of the stations, especially for particulate matter. Wind profile analysis with heavy pollution situations indicates that low speed southwest or east wind situations have the higher possibility of heavy pollution, suggesting that it is highly possible that long-range transportation of air pollutants from south or east neighboring provinces played an important role in the worsening air conditions in Beijing.

1. Introduction

Air quality is a major concern for people living in Beijing [1,2], especially after several serious haze-fog events since 2011 [3,4]. However, the air quality evaluation standards released in 1996 (NAAQS-1996), did not take into account PM2.5 (Particulate Matter with aerodynamic diameter less than 2.5 µm) [5]. As a result, the air quality attainment rate of Beijing under NAAQS-1996 (Air Pollution Index, API < 100) has always been greater than 70% since 2008 [6]. This is inconsistent with public awareness since people are suffering by the worsening air pollution [7,8].
In China, air quality monitoring started from the mid-1980s while the release of daily air pollution levels began from 2000 under NAAQS-1996 by taking into account the daily average concentrations of PM10, SO2 and NO2. Twelve years of daily monitoring data provided a effective data source for the analysis of air pollution level of major Chinese cities [9]. However, a series of studies suggested that PM2.5 in major northern Chinese cities had been an important issue, as although the air pollution index (API) under NAAQS-1996 suggested that air quality was fine, the atmospheric conditions were poor [10,11,12,13,14,15]. In February 2012, China then released new air quality standards (NAAQS-2012) by taking into account six air pollutants: PM2.5, PM10, SO2, O3, NO2 and CO [16]. From January 2013, Beijing adopted NAAQS-2012 to publicize real time air monitoring data at one hour intervals along with 73 other cities by deploying 35 permanent air quality monitoring stations. These monitoring data provided unique tools to analyze the present atmospheric pollution levels for Beijing, the capital of China.
In this paper, we collected hourly air quality data of all 35 air quality monitoring stations in Beijing from September 2014 to August 2015 to give a comprehensive analysis of the air quality evaluations under the new national ambient air quality standards.

2. Data and Methods

From January 2013, Beijing began to publicize real time air quality monitoring data under National Ambient Air Quality Standards released in 2012 (NAAQS-2012) at one hour intervals on a municipal web platform [17]. In this paper, hourly monitoring concentrations of all six pollutants (PM2.5, PM10, O3, SO2, NO2 and CO) from September 2014 to August 2015 were collected through deploying a web download program. In total, more than 300,000 hourly monitoring data were collected and analyzed in this paper. The 35 monitoring stations were divided into six groups: 12 urban stations, 11 suburban stations (four in north and seven in the south of Beijing), seven background stations (four in the north and three in the south) and five traffic monitoring stations, shown in Figure 1 and Table 1. Although the real-time web platform publicizes current monitoring data, the history data two weeks ahead are not provided publicly. Therefore, our web deployed program accessed to the web platform at an interval of half an hour to download the real-time data. Due to equipment failure or internet transfer error, some data were missing during the collection. According to NAAQS-2012, daily observations for at least 20 h were supposed to be valid, while the rest were abandoned to ensure the representativeness of the data.
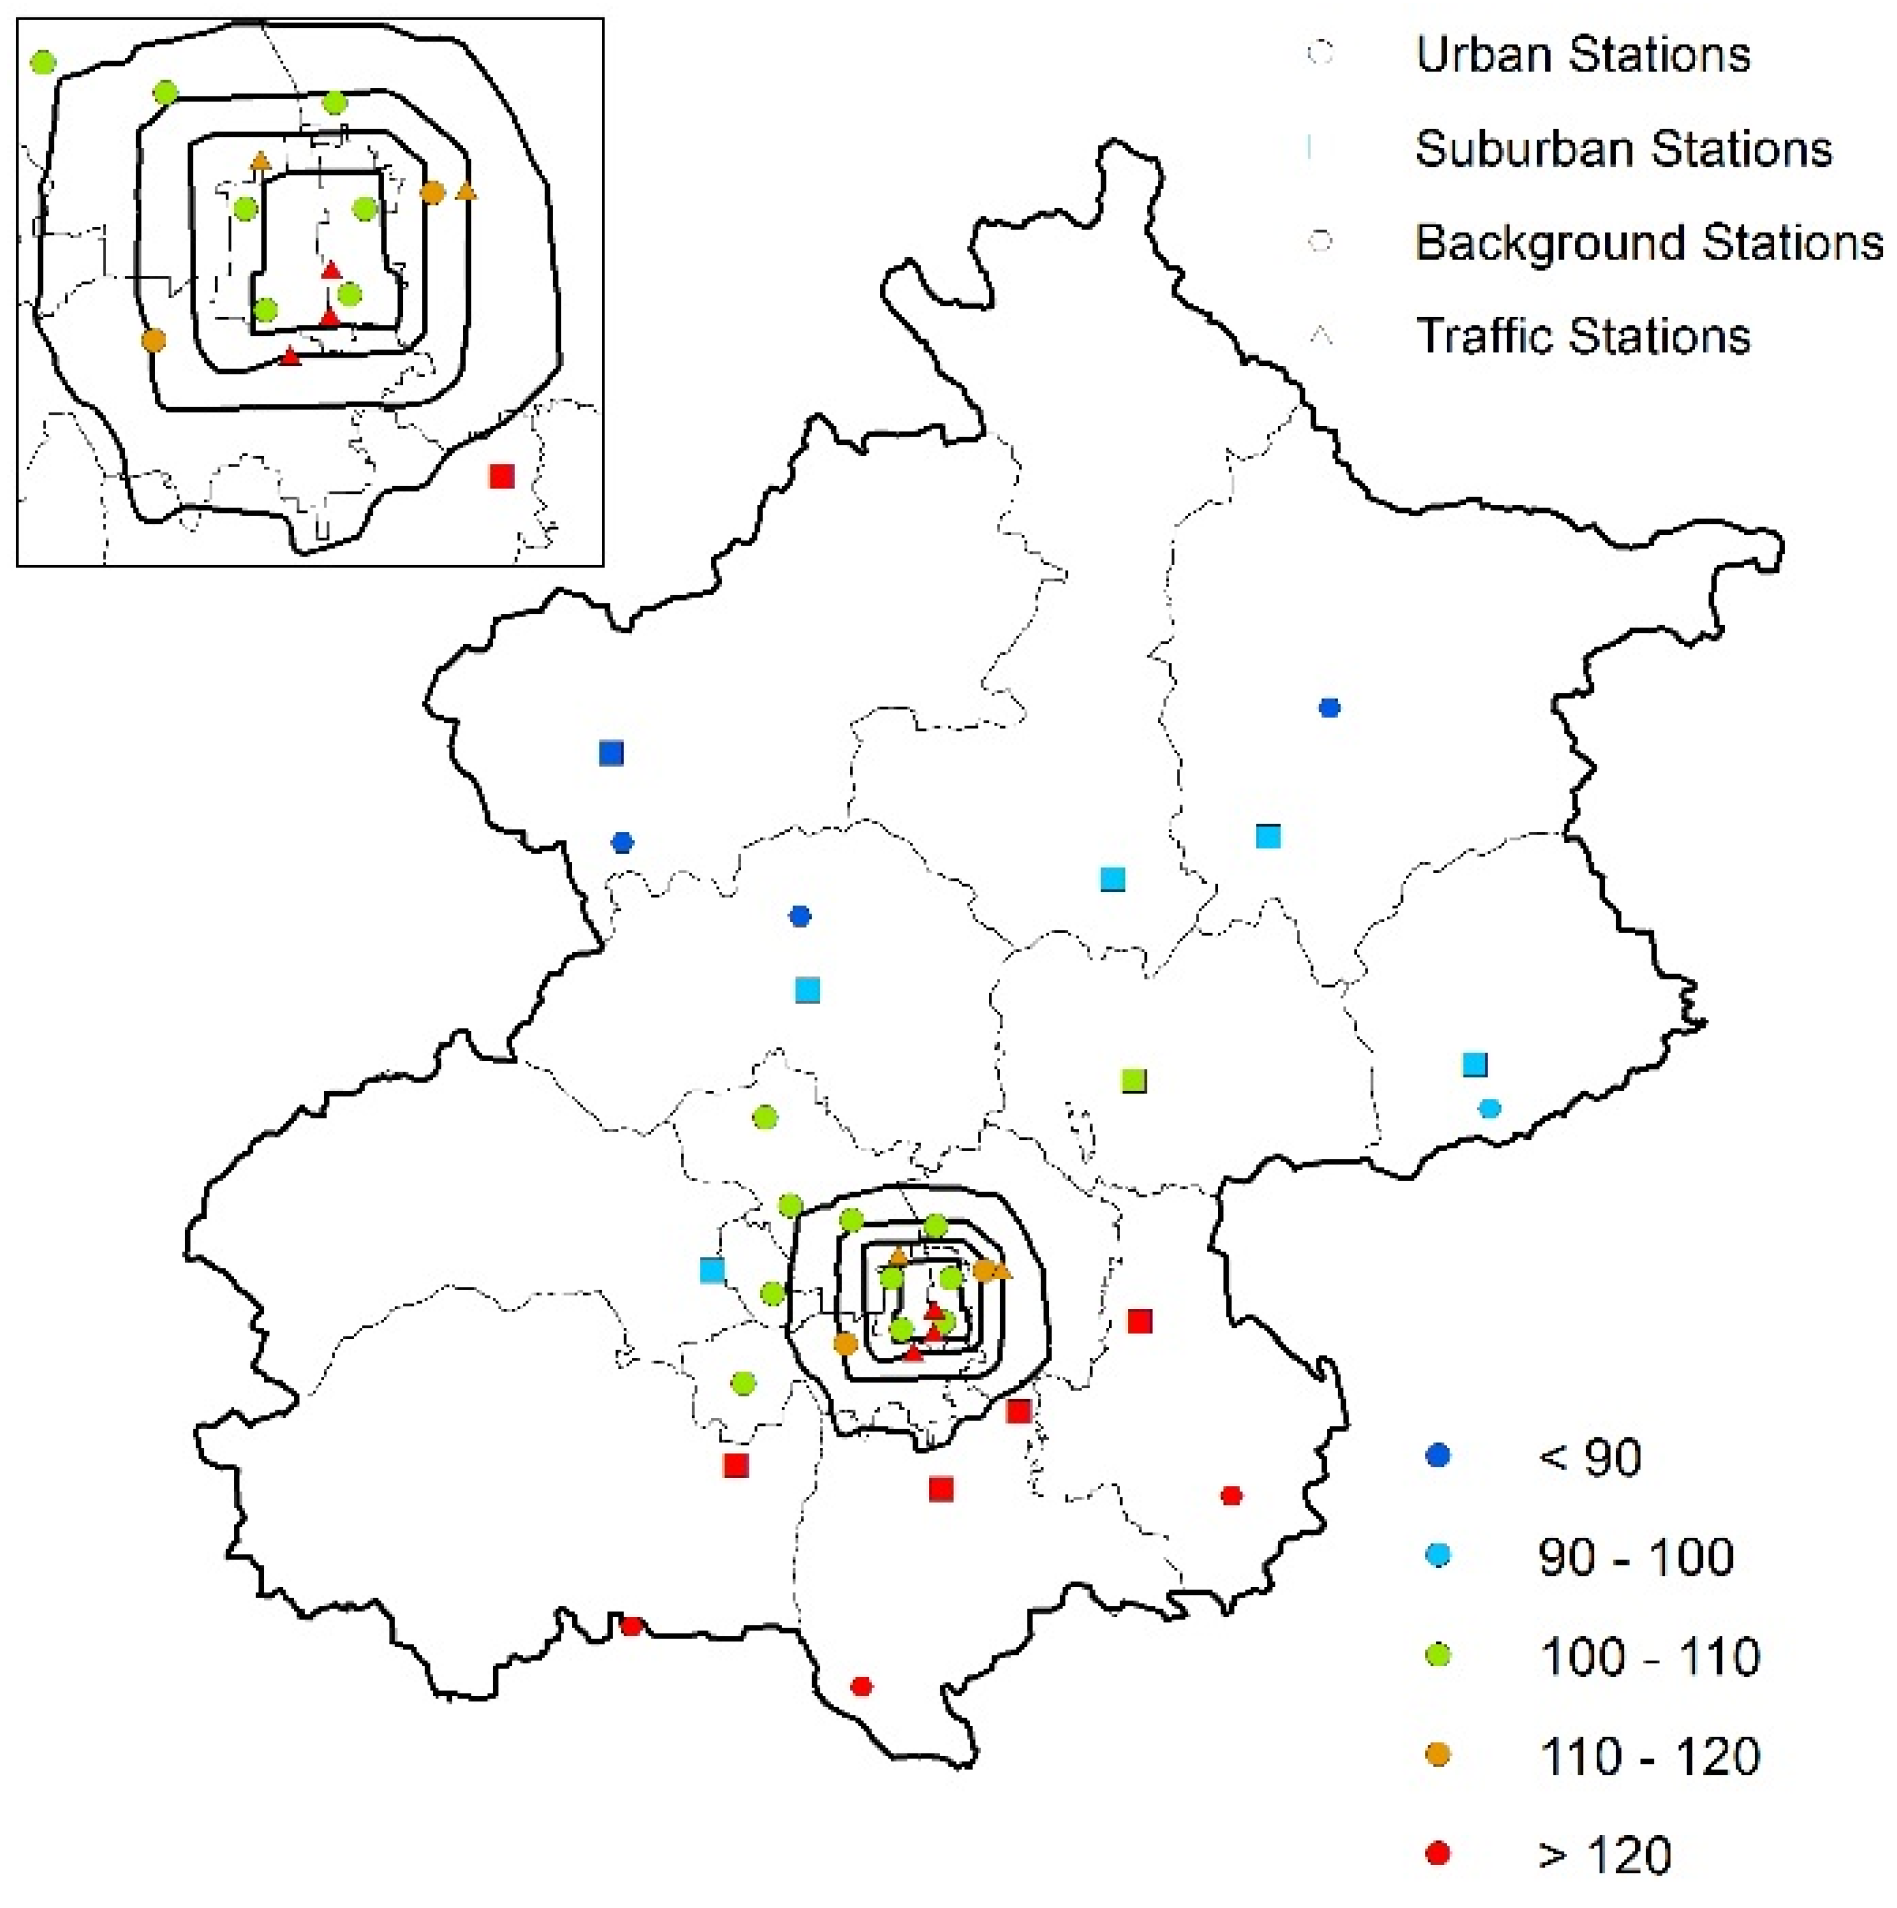
Figure 1. Distribution and station IDs of the 35 air quality monitoring stations. The four rings in the map are the 2nd, 3rd, 4th, and 5th Ring Road in Beijing from inner to outside.
Atmosphere 06 01753 g001
The 12 urban stations were deployed in the urban areas of Beijing, while the 11 suburban stations were located at the downtown areas of suburban counties in Beijing. The seven background stations were placed at those areas far away from human activities: Station 24 is the background for urban areas; Stations 25 and 26 are for monitoring the transportation from north and northwest directions; Stations 27 and 28 in the northeast and southeast mainly monitored the transportation from nearby Tianjin; Stations 29 and 30 in the south and southwest were for monitoring the data from the heavily polluted Hebei Province. Different to the previous 30 stations, the five traffic monitoring stations were placed just next to the main road as suggested in Table 1, while the other 30 stations were 150 m away from the main road according to NAAQS-2012.
Table 1. Category and locations of monitoring stations.
Station ID & NameCategory
1 DongsiUrban Stations
2 Temple of HeavenUrban Stations
3 West Park OfficialsUrban Stations
4 West Wanshou NishinomiyaUrban Stations
5 Olympic Sports CenterUrban Stations
6 Agricultural Exhibition HallUrban Stations
7 WanliuUrban Stations
8 Northern New AreaUrban Stations
9 Botanical GardenUrban Stations
10 Fengtai gardenUrban Stations
11 YungangUrban Stations
12 Shijingshan cityUrban Stations
13 LiangxiangSuburban Stations (South)
14 DaxingSuburban Stations (South)
15 YizhuangSuburban Stations (South)
16 TongzhouSuburban Stations (South)
17 ShunyiSuburban Stations (North)
18 ChangpingSuburban Stations (North)
19 MentougouSuburban Stations (South)
20 PingguSuburban Stations (North)
21 HuairouSuburban Stations (North)
22 MiyunSuburban Stations (North)
23 YanqingSuburban Stations (North)
24 DinglingBackground Stations (North)
25 BadalingBackground Stations (North)
26 Miyun ReservoirBackground Stations (North)
27 DonggaocunBackground Stations (North)
28 YongledianBackground Stations (South)
29 YufaBackground Stations (South)
30 LiuliheBackground Stations (South)
31 Qianmen East StreetTraffic Monitoring Stations
32 Yongdingmen Inner StreetTraffic Monitoring Stations
33 Xizhimen North StreetTraffic Monitoring Stations
34 South 3rd Ring RoadTraffic Monitoring Stations
35 East 4th Ring RoadTraffic Monitoring Stations
Table 2. Concentration limits for air quality index (AQI) calculation.
IAQIPM10 (µg/m3)SO2 (µg/m3)NO2 (µg/m3)PM2.5 (µg/m3)1-Hour Peask O3 (µg/m3)CO (mg/m3)
50505040351602
10015015080752004
15025047518011530014
20035080028015040024
300420160056525080036
4005002100750350100048
5006002620940500120060
The AQI is an index that indicates the pollution level of the atmosphere, ranging from 0 to 500. The higher the AQI value is, the heavier the atmospheric pollution is. According to NAAQS-2012, PM2.5, PM10, ozone (O3), sulfur dioxide (SO2), nitrogen dioxide (NO2) and carbon monoxide (CO) were included into the calculation of the AQI. The first step in calculating the AQI is to calculate the IAQI (individual air quality index) for each pollutant. The IAQI of each pollutant mentioned above is calculated as follows:
IAQI P = IAQI Hi IAQI Lo BP Hi BP Lo ( C P BP Lo ) + IAQI Lo
where IAQI P is the individual air quality index for pollutant P (PM2.5, PM10, O3, SO2, NO2 and CO), and C P is the daily mean concentration of pollutant P . BP Hi and BP Lo are the nearby high and low values of C P as shown in Table 2.  IAQI Hi , and IAQI Lo are the individual air quality indexes in terms of BP Hi and BP Lo as shown in Table 2. The largest IAQI value is 500, and once the air pollutant’s concentration exceeds the highest limit in Table 2, the IAQI will be set to 500. After the calculation of each IAQI P , the AQI is then calculated by choosing the max IAQI P as follows:
AQI = max ( IAQI 1 , , IAQI n )
Equation (2) suggests that the AQI is not the sum contribution of all of the air pollutants but rather the maximum value of the IAQI. The air pollutant with a maximum IAQI when the AQI is larger than 50 is designated as the Primary Pollutant. Daily AQI less than 100 is supposed to be qualified according to NAAQS-2012.

3. Results

3.1. Air Quality Attainment Rate under the New National Ambient Air Quality Standards
The annual averaged AQI for all 35 stations is shown in Figure 2. A distinguished spatial pattern of AQI could be observed from Figure 2: south and southeast stations (both suburban and background) as well as three traffic monitoring stations in the south were those having the worst air qualities (annual AQI > 120). Urban stations and two north traffic monitoring stations followed with annual AQI in the range of 100 to 120, which is still exceeding the attainment level of 100. Suburban stations and north background stations in the north of Beijing had the best air qualities of AQI less than 100. The four remote north stations even had annual AQIs less than 90.
Figure 2. Annual average AQIs of the 35 monitoring stations.
Atmosphere 06 01753 g002
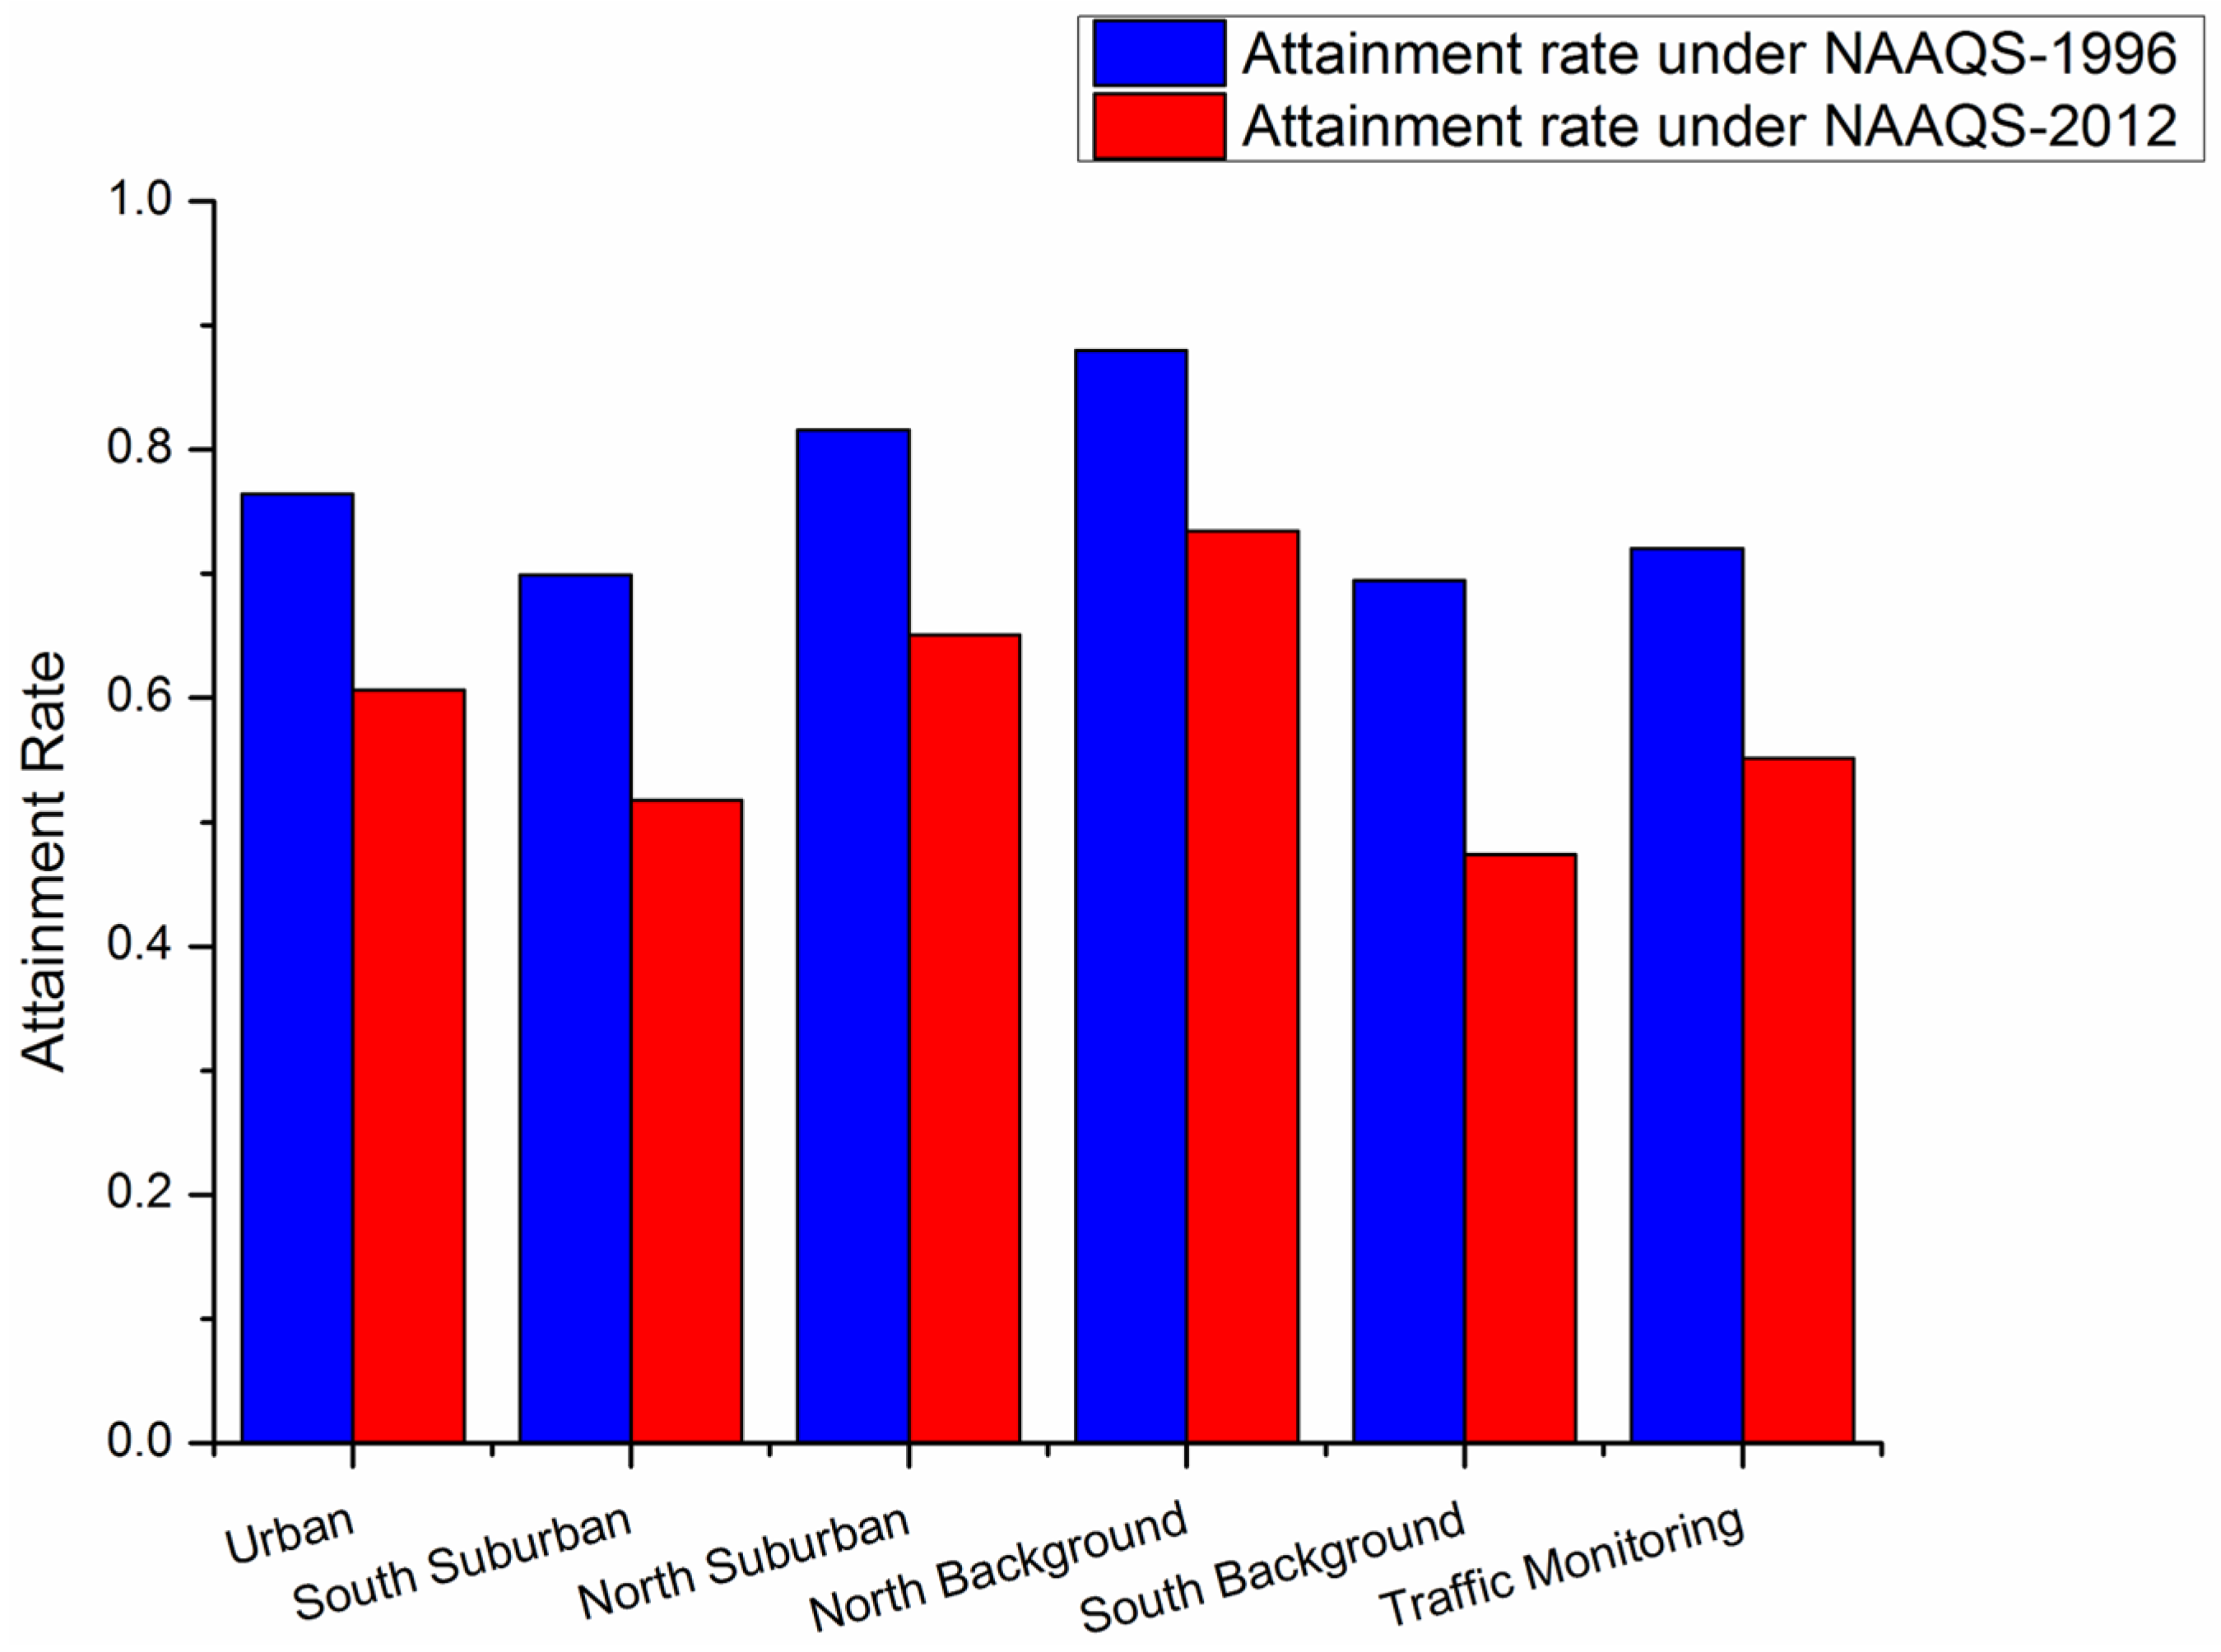
The attainment rates (rates of AQI < 100 or API < 100) for the 35 monitoring stations were calculated and grouped into the six categories, as shown in Figure 3. It could be determined that the air quality attainment rates have all fallen by 15%–22% under NAAQS-2012 with south background stations having the largest attainment rate decrease. Under both standards, north background stations were those having the highest air quality attainment rates (88% for NAAQS-1996 and 73% for NAAQS-2012) while south background stations had the lowest air quality attainment rates (69% for NAAQS-1996 and 47% for NAAQS-2012). These results suggested that the shift from NAAQS-1996 to NAAQS-2012 have had greatly decreased the air quality attainment rates for all stations by stricter standards but the spatial pattern remained similar: north background had the best air qualities while south background had the worst ones.
Figure 3. Annual AQI attainment rate of the six monitoring stations groups.
Atmosphere 06 01753 g003

3.2. Annual Variations of Air Quality and Atmospheric Pollutants
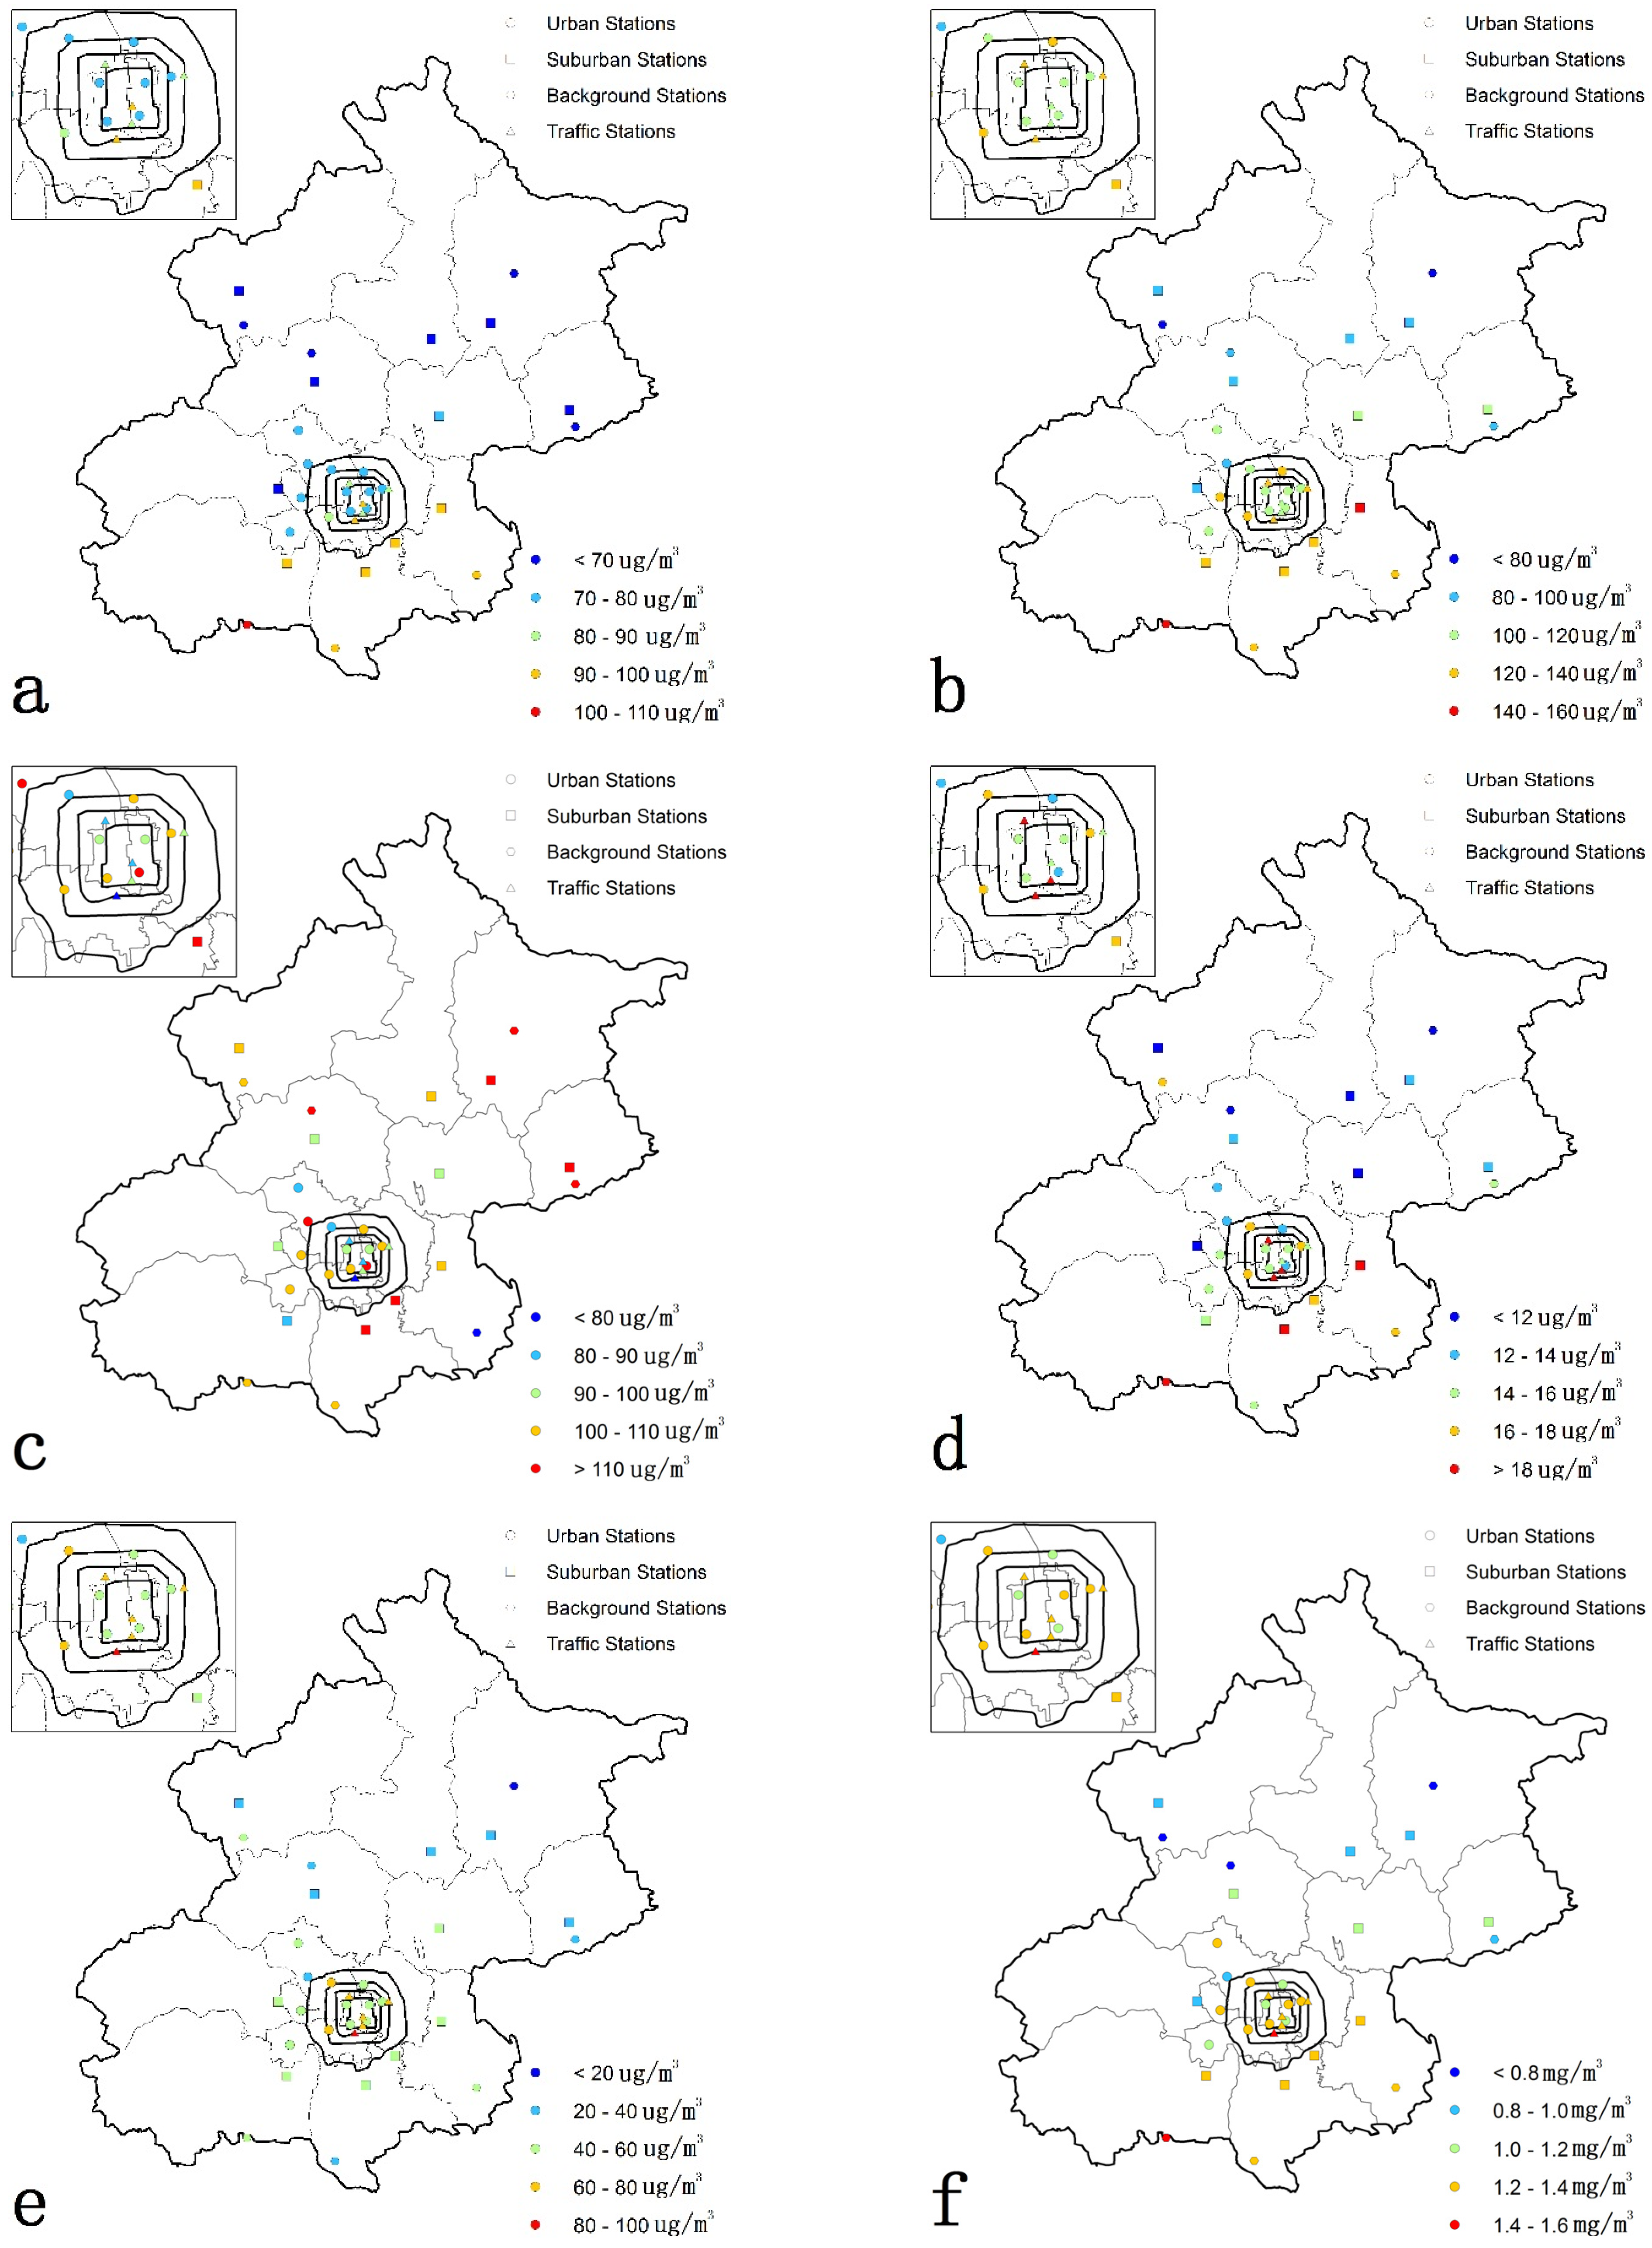
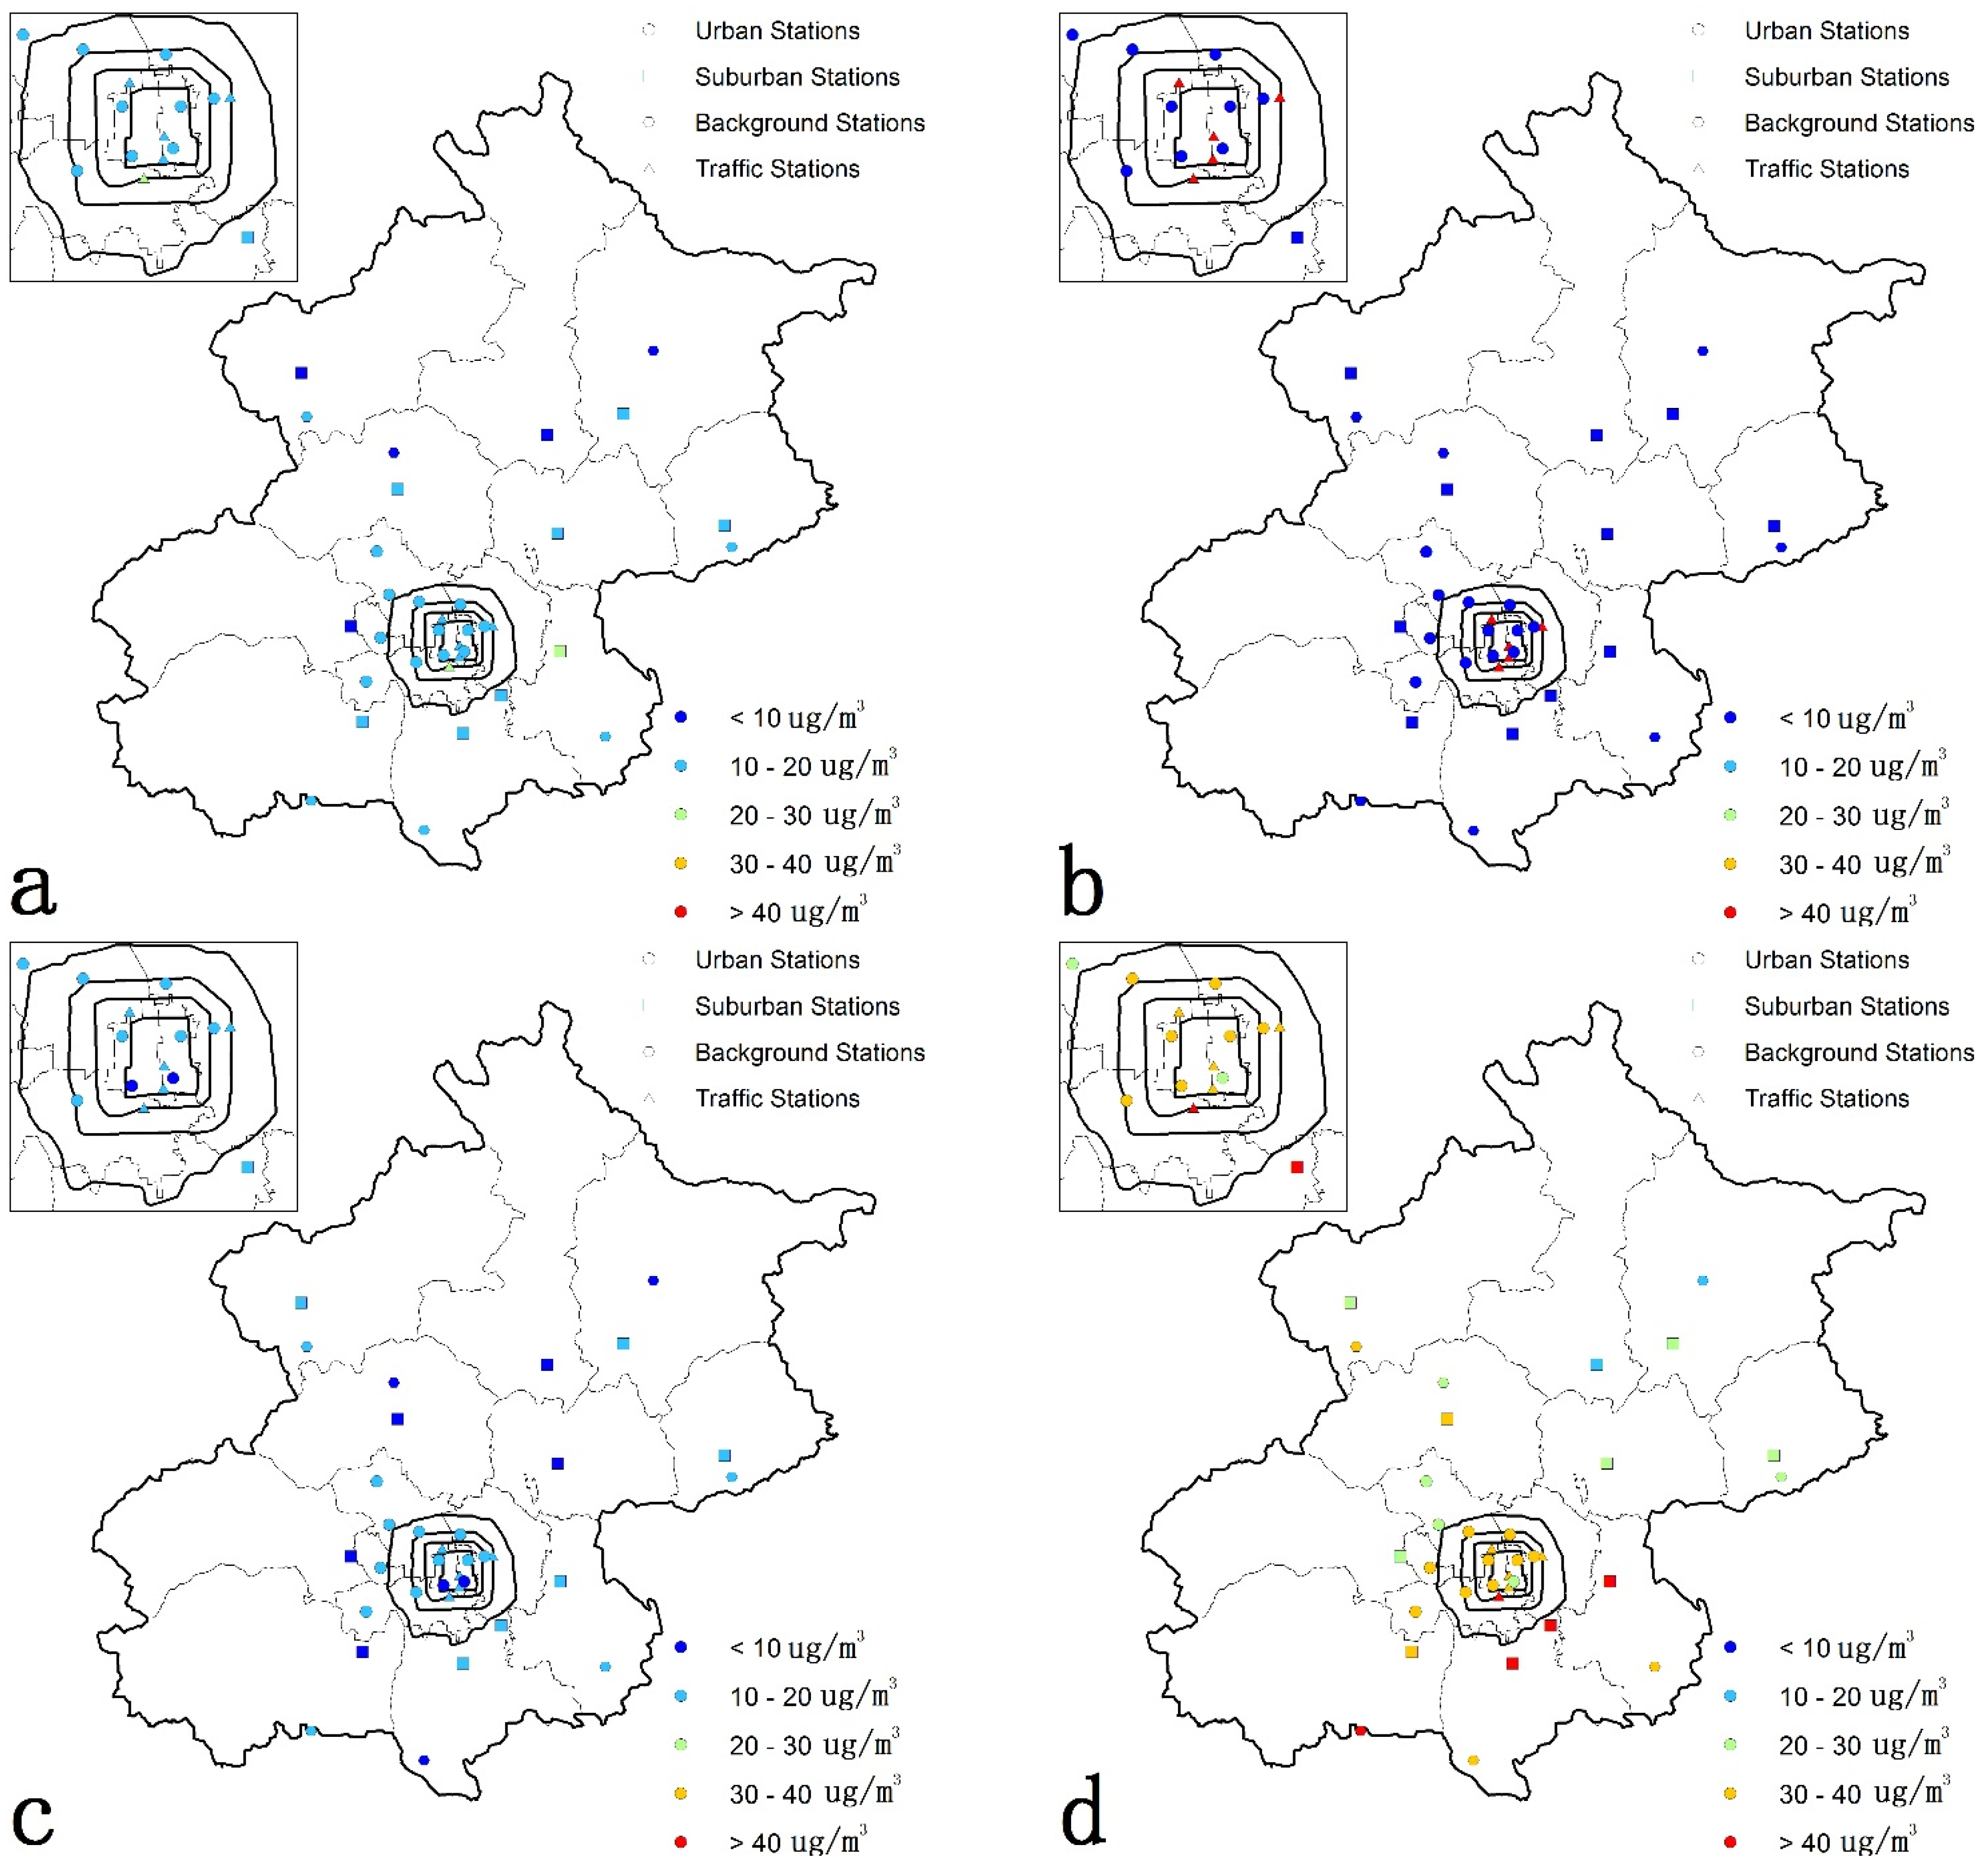
The annual mean concentrations of the five pollutants and mean daily maximum O3 concentrations for the 35 monitoring stations were shown in Figure 4. The spatial patterns of PM2.5 and PM10 are similar to that of AQI: South and southeast stations were the most polluted while the north stations had the lower PM2.5 and PM10 concentrations. For O3, the situation is different and no obvious spatial pattern could be obtained except that the O3 concentrations for all five traffic monitoring stations were all significantly lower than their nearby stations. For SO2, the spatial pattern is similar to that of PM10 as shown in Figure 4d. Although the southeast stations had the higher concentrations of SO2, they were all far less than 50 µg/m3, with IAQI less than 50, suggesting that SO2 has not been the major pollutants. NO2, a kind of vehicle exhaust, has a different spatial pattern that traffic monitoring stations and those stations near the main ring roads have had higher concentrations. For the rest stations, north stations have obvious lower concentrations of NO2 than those of south stations. The pattern of CO is similar to that of PM10: stations at the urban, south and southeast had higher concentrations of CO than those north stations. However, the annual average CO of all 35 stations were less than 2 mg/m3, with IAQI of CO less than 50 according to Table 2. The spatial distribution of the six pollutants suggested that annual O3, SO2 and CO concentrations were all qualified according to NAAQS-2012. PM2.5, PM10 and NO2, were the major pollution pollutants as some monitoring stations’ annual concentrations of these three pollutants exceeded the level of attainment (IAQI > 100).
Figure 4. Annual average concentrations of six pollutants ((a) PM2.5; (b) PM10; (c) O3; (d) SO2; (e) NO2; (f) CO) of the 35 monitoring stations.
Atmosphere 06 01753 g004

3.3. Seasonal Variations of AQI

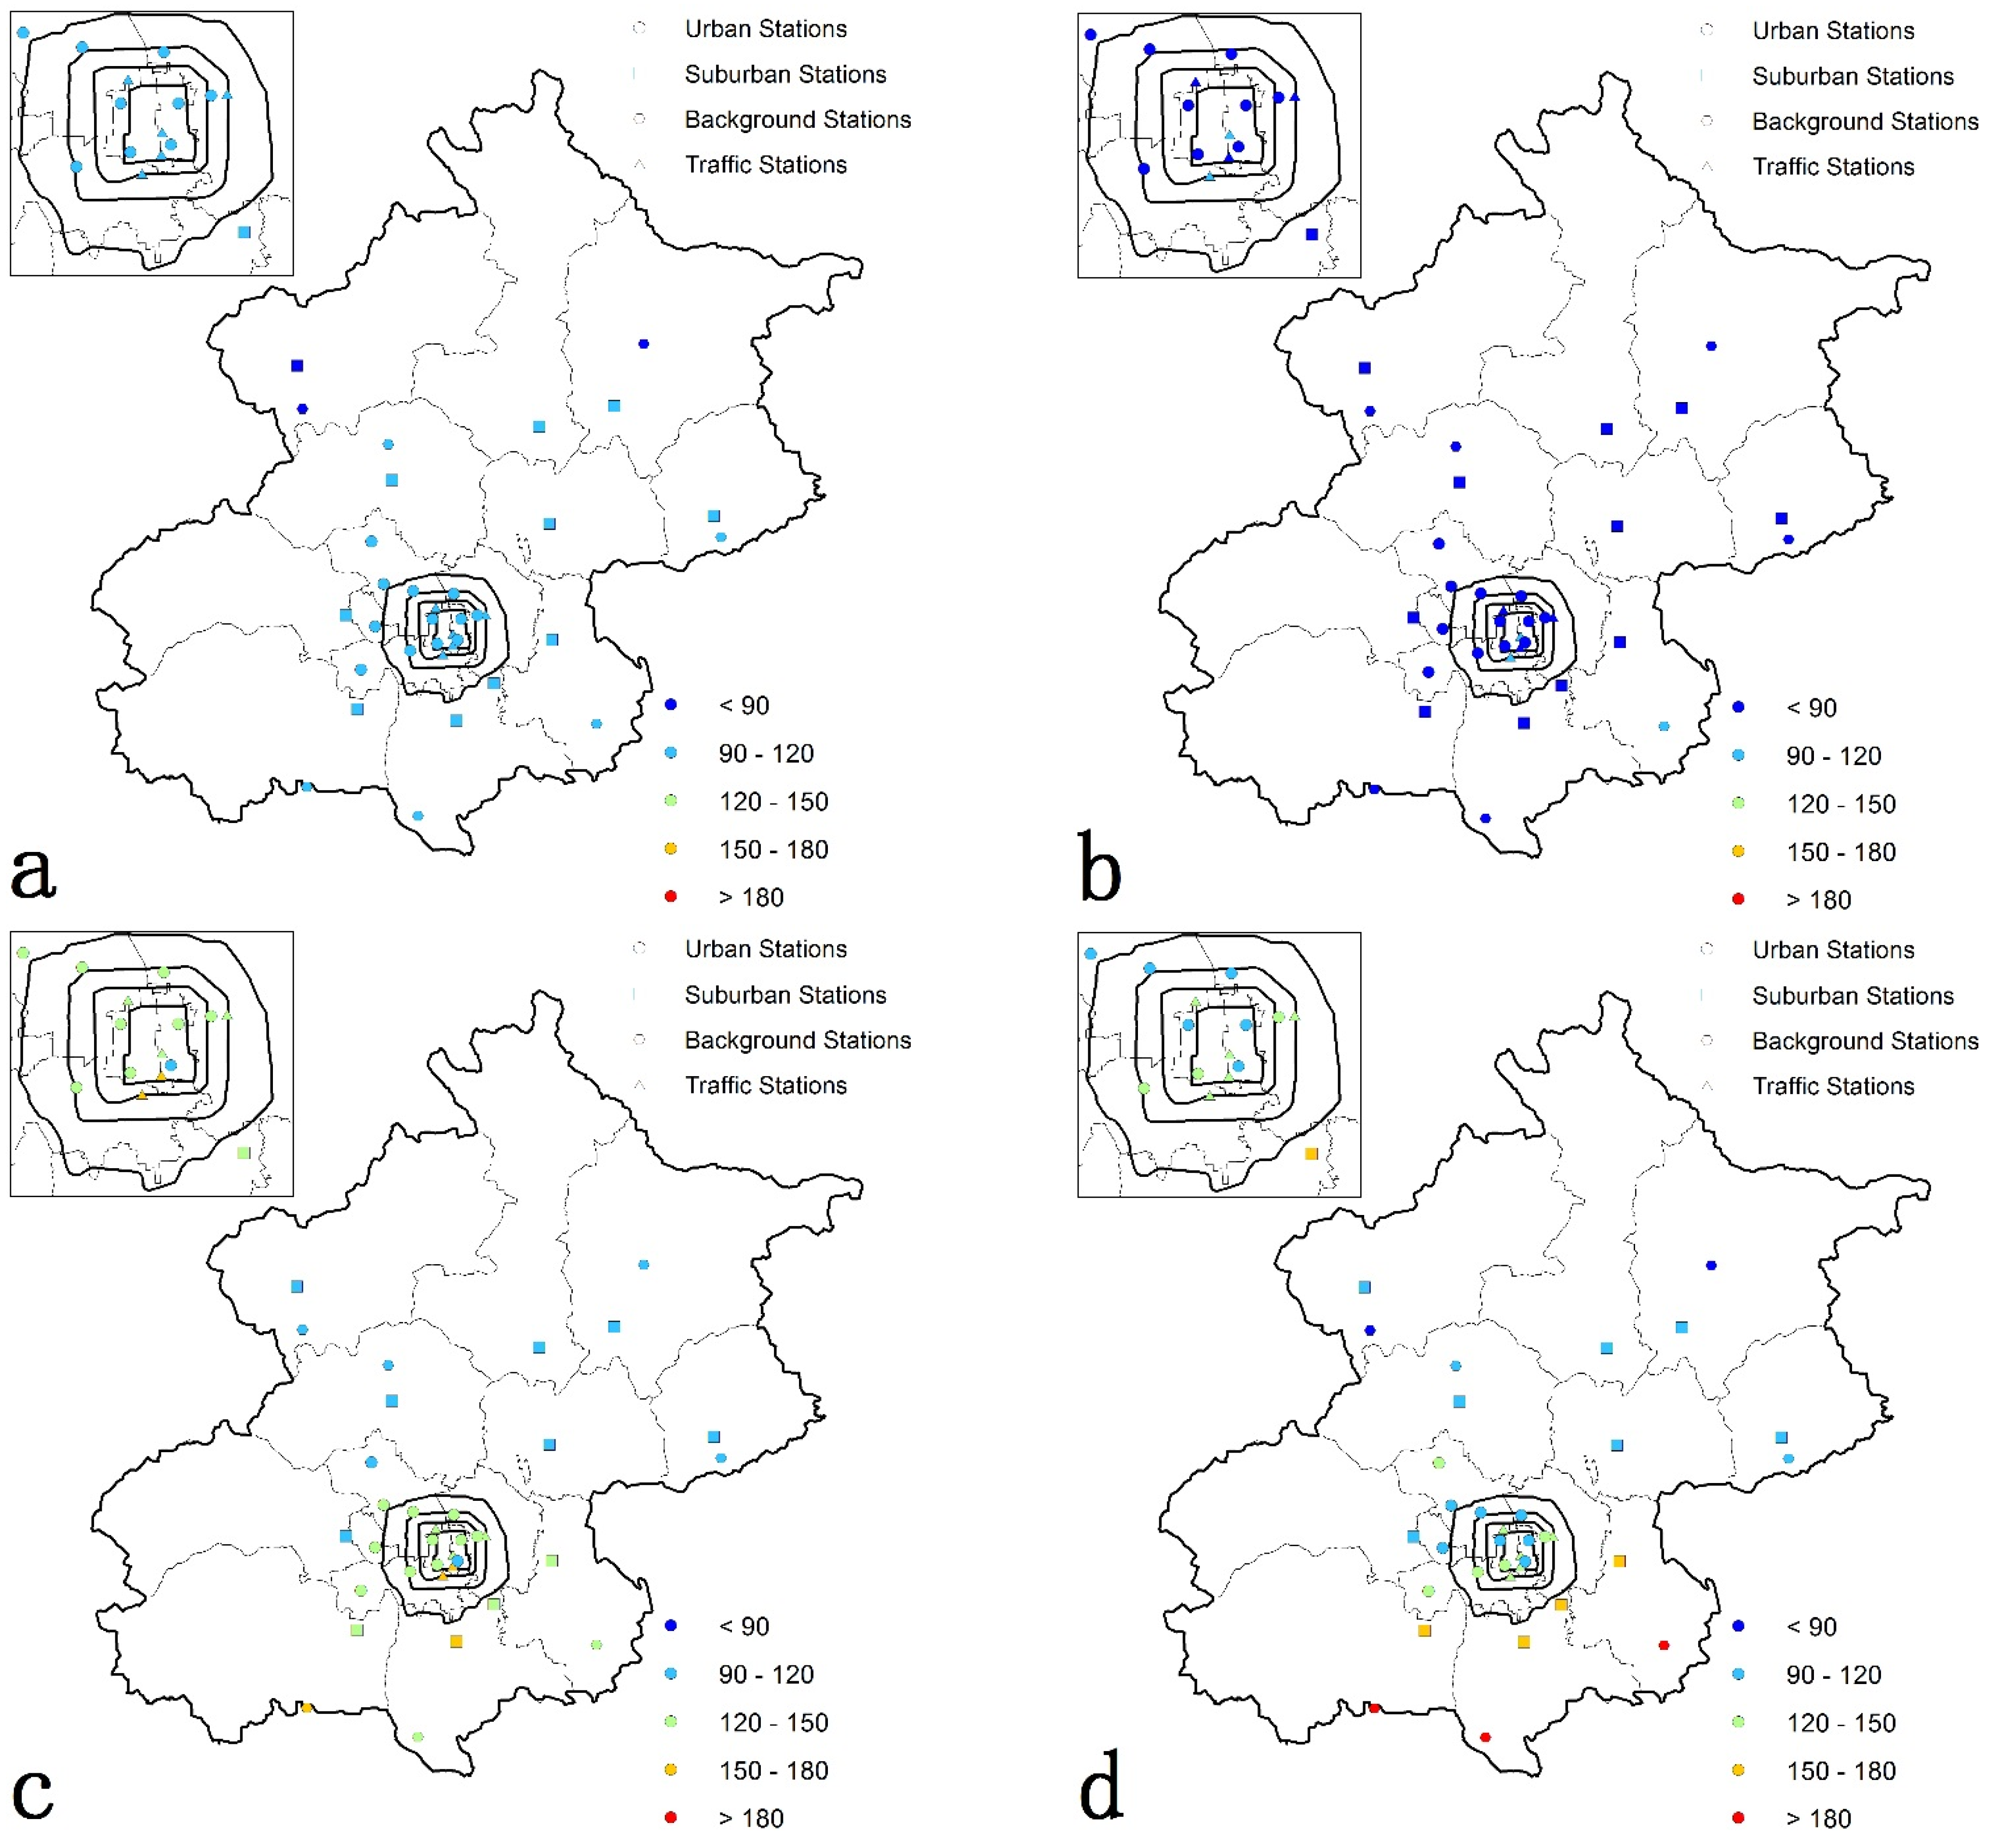
The air quality of Beijing shows an obvious seasonal pattern as in Figure 5. Summer had the best air quality with nearly all monitoring stations’ average AQI less than 100. Spring followed with most stations average AQI in the range of 90–120. Air quality in winter deteriorated as most urban and south stations’ air quality rose to larger than 120 with four even greater than 150. Winter’s air quality had become even worse with southeast stations’ air quality rising to more than 180.
Figure 5. Seasonal variations of AQI for the 35 air quality monitoring stations ((a) spring; (b) summer; (c) autumn; (d) winter).
Atmosphere 06 01753 g005

3.4. Seasonal Variations of PM2.5

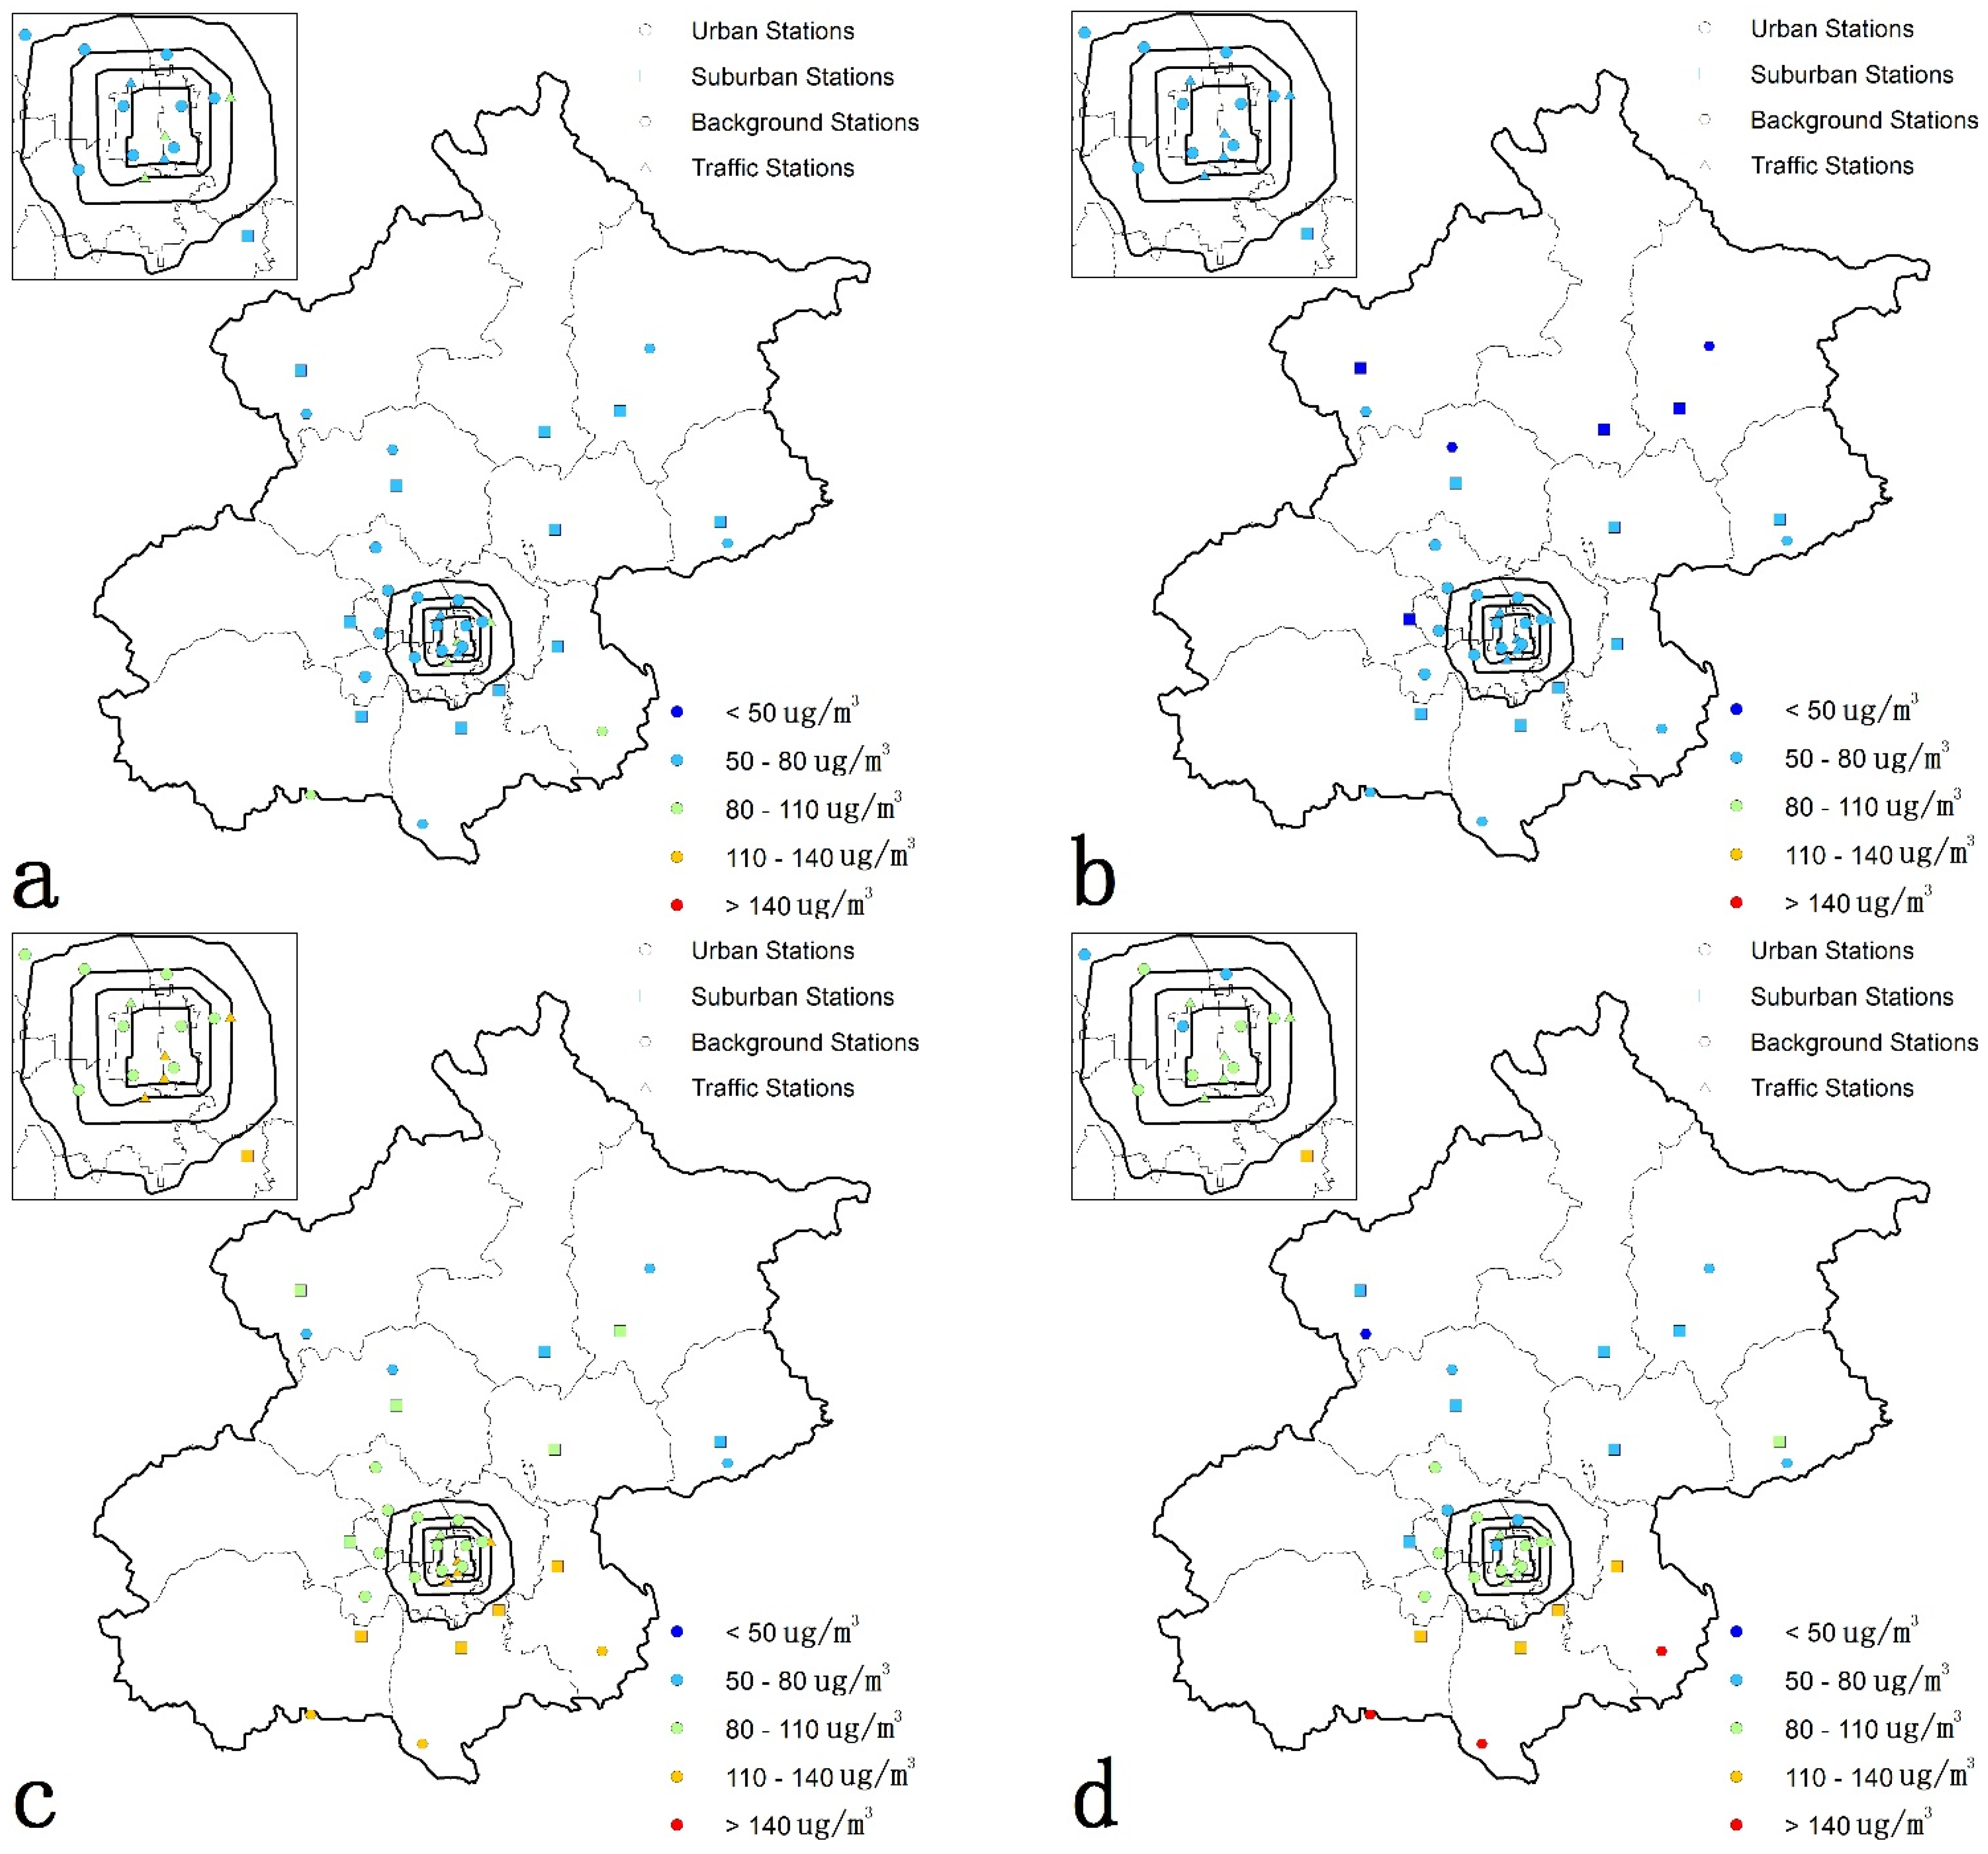
The seasonal average PM2.5 concentrations of all monitoring stations were less than 80 μg/m3, three suburban stations in the north, one suburban station in the west and two background stations in the north even had seasonal average PM2.5 concentrations less than 50 μg/m3 as shown in Figure 6a,b. PM2.5 concentrations increased sharply in autumn: most stations’ PM2.5 concentrations increased to more than 80 μg/m3 except six stations in the north as shown in Figure 6c. Stations in the south and southeast even had seasonal average PM2.5 concentrations in the range of 110–140 μg/m3. In the winter, PM2.5 concentrations in the north background stations and suburban stations decreased while those in southeast and south background stations increased with three stations PM2.5 concentrations greater than 140 μg/m3.
Figure 6. Seasonal variations of PM2.5 concentrations for the 35 air quality monitoring stations ((a) spring; (b) summer; (c) autumn; (d) winter).
Atmosphere 06 01753 g006

3.5. Seasonal Variations of PM10

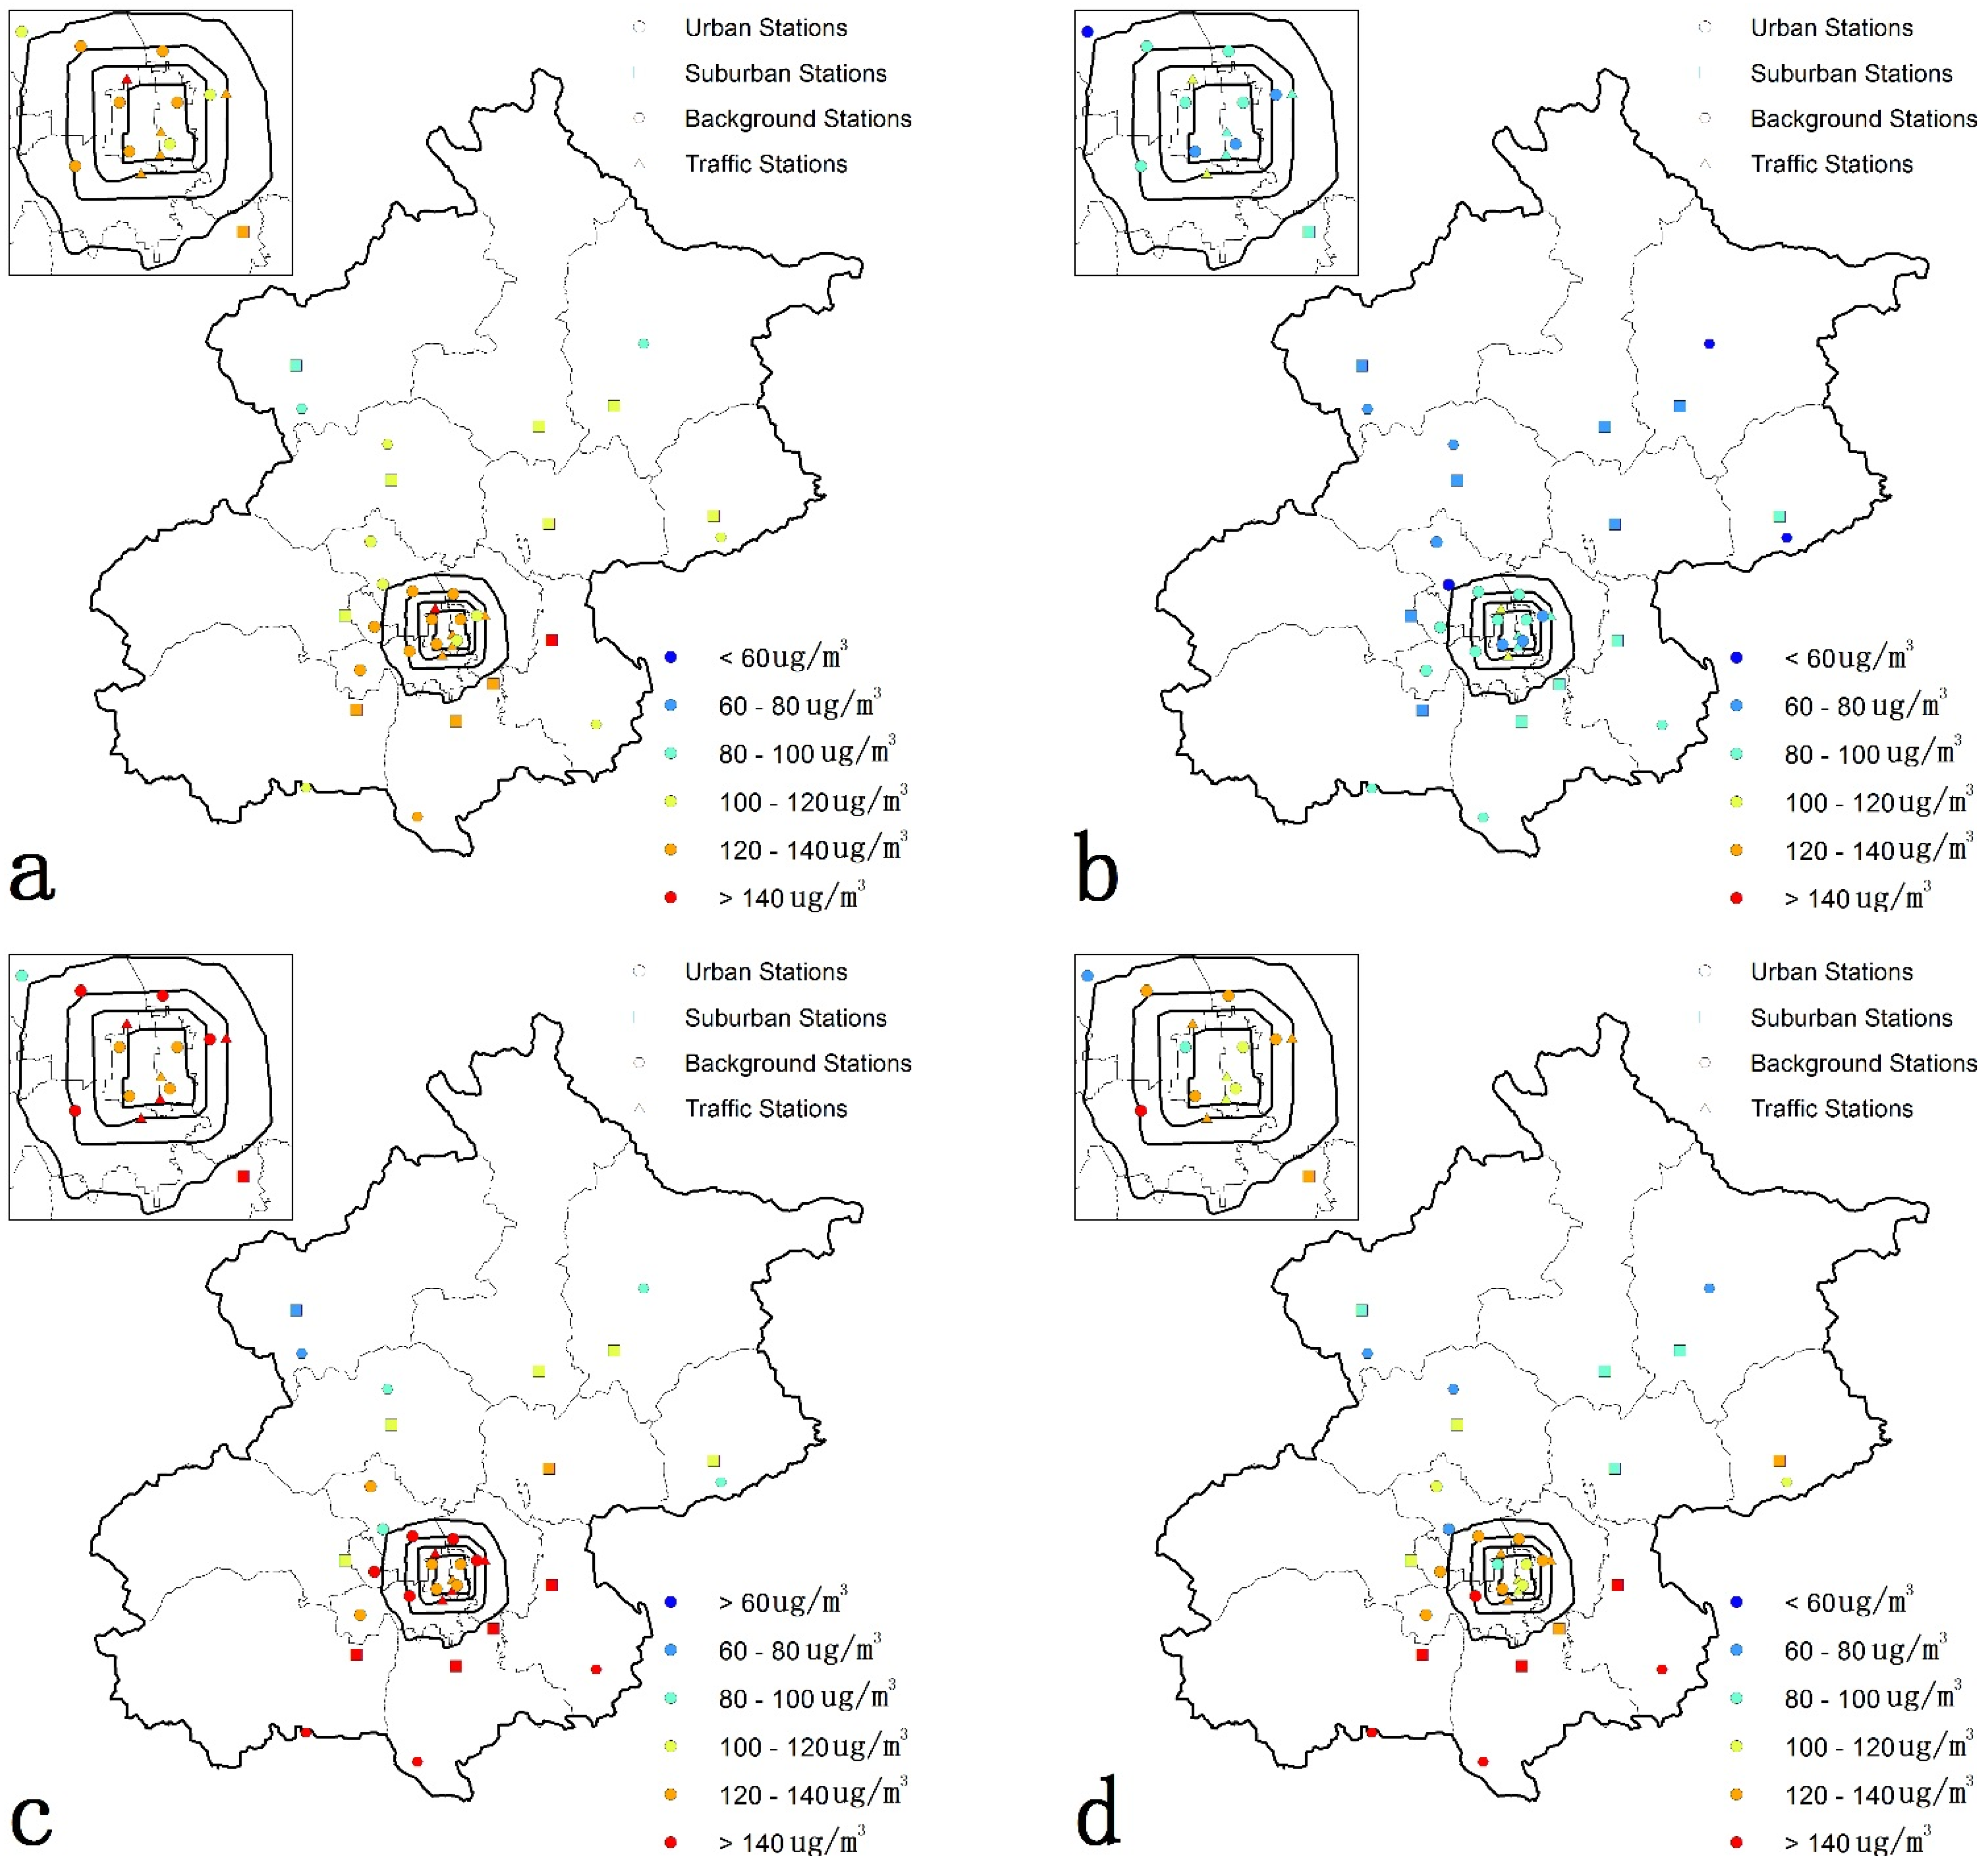
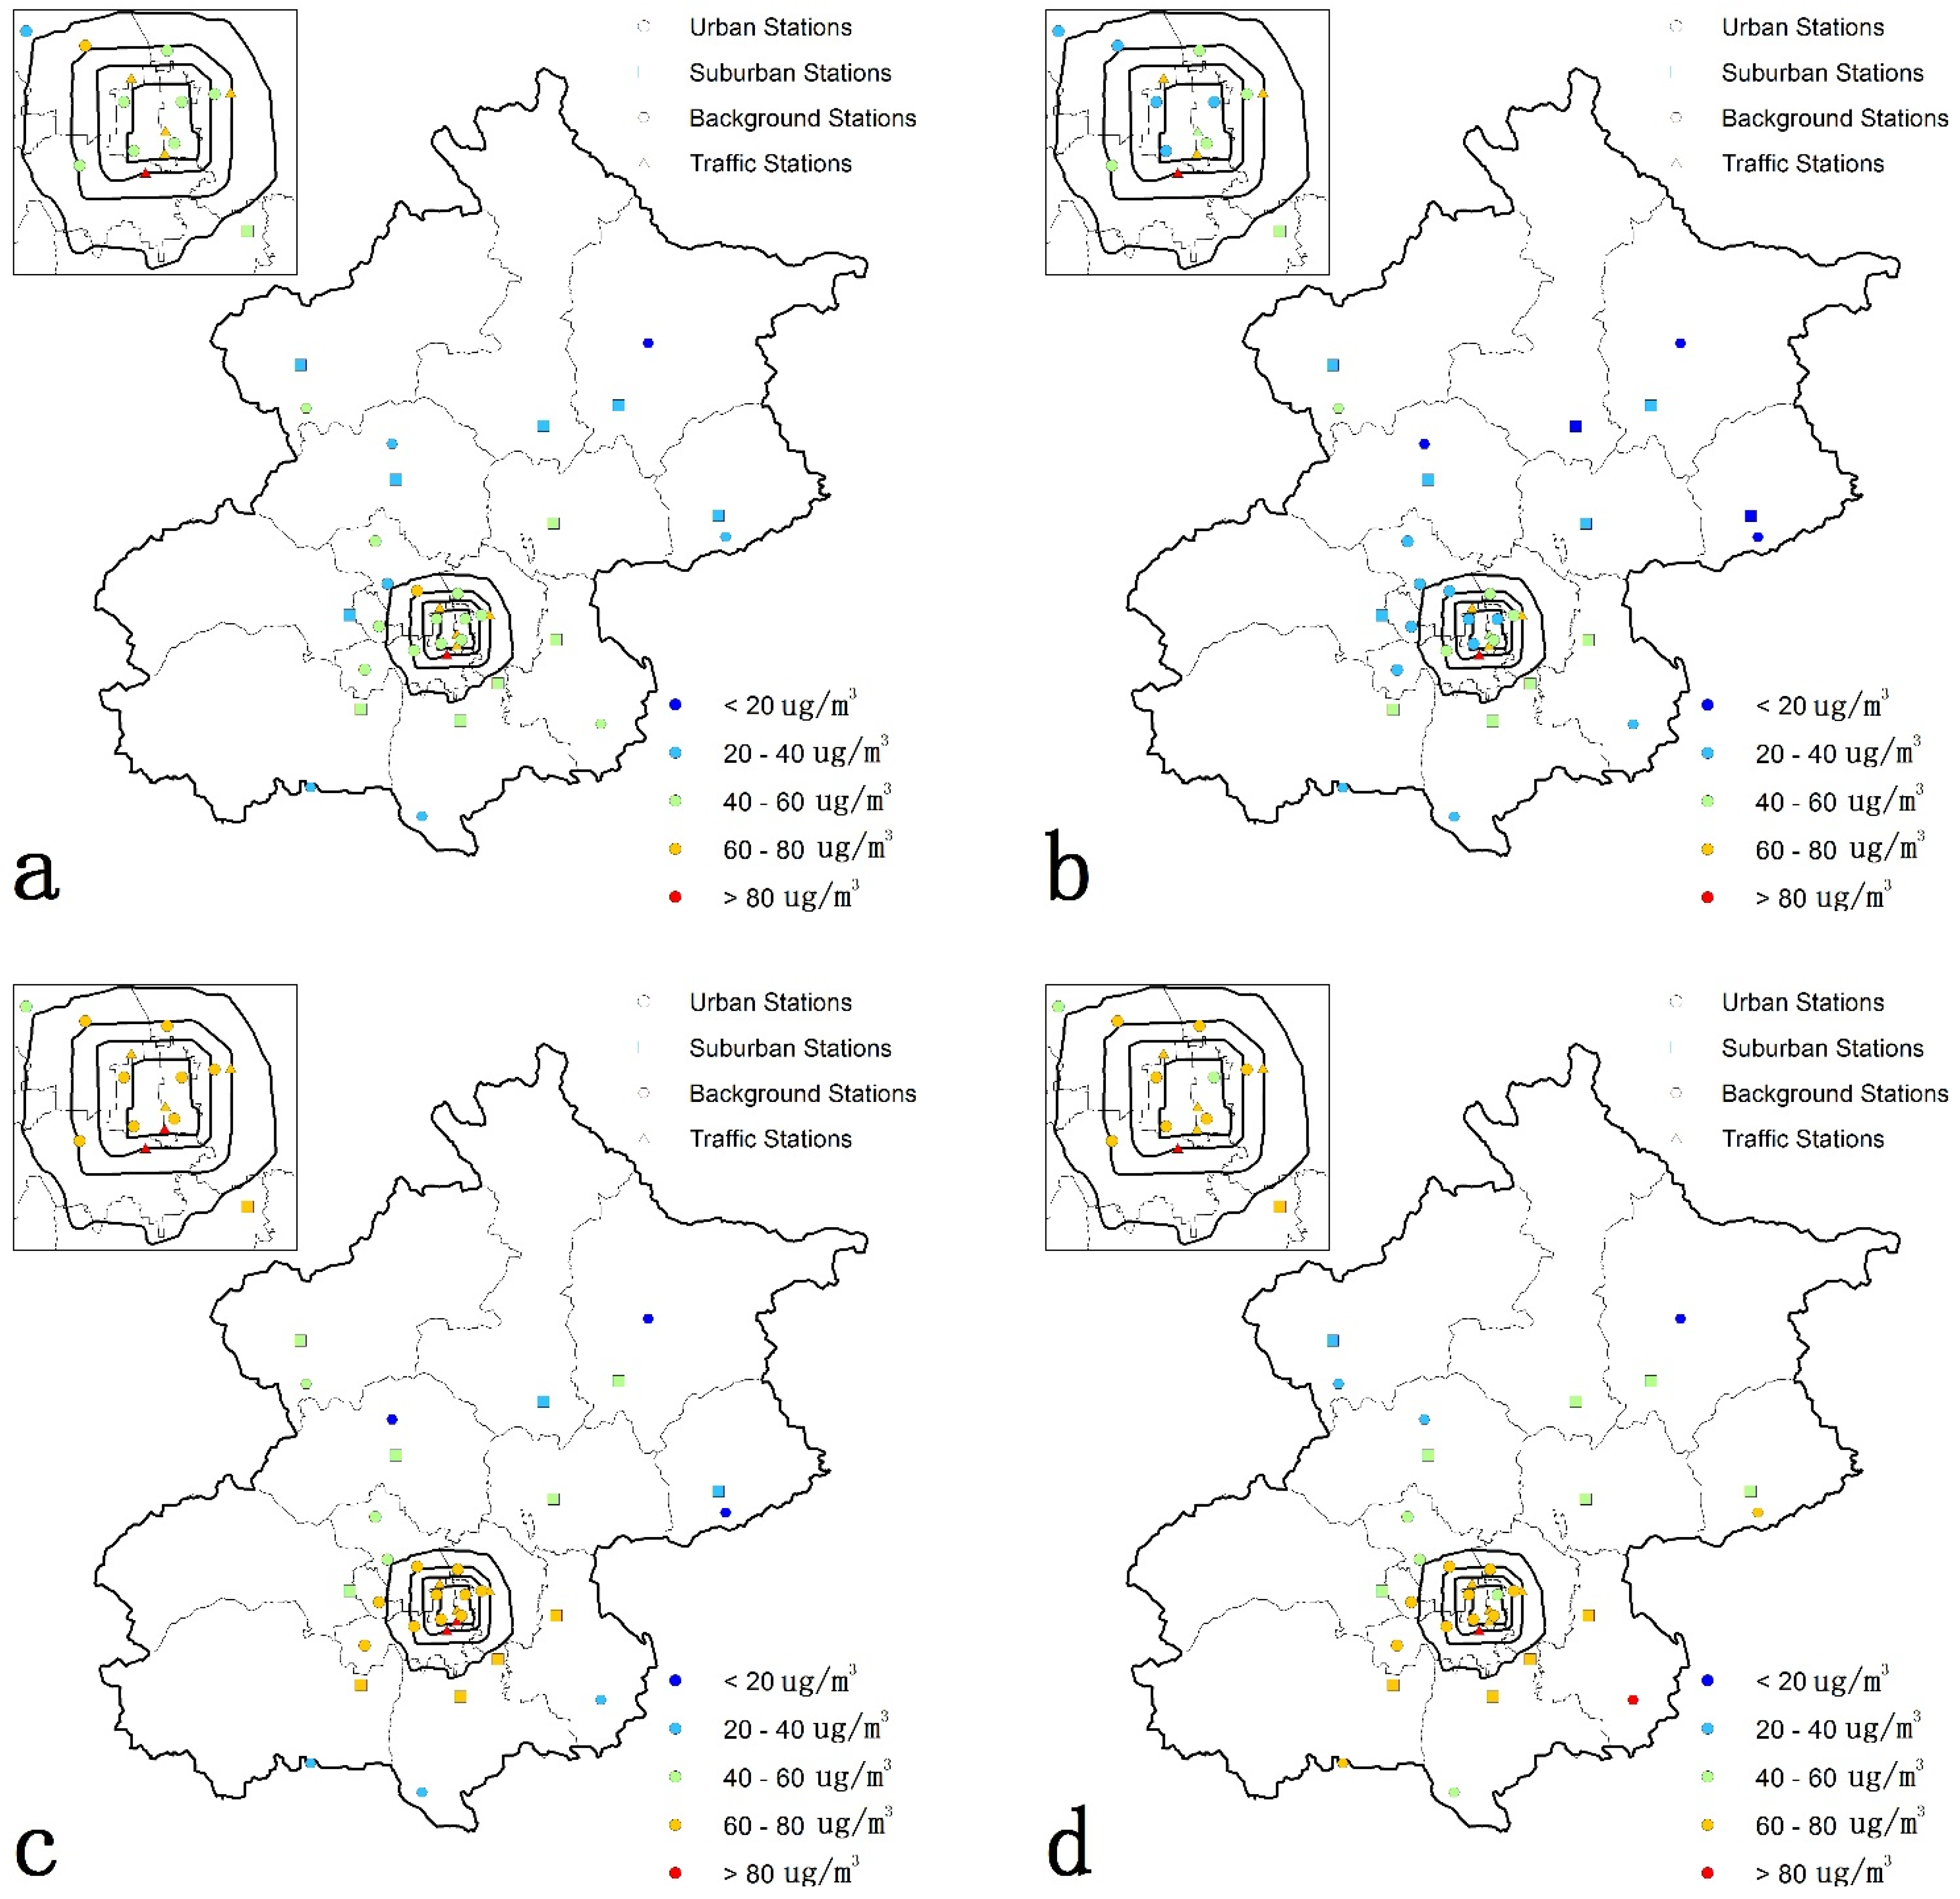
Most stations’ PM10 concentrations in summer were less than 100 µg/m3 except two traffic monitoring stations, as shown in Figure 7b. South stations, urban stations and traffic monitoring stations tended to have higher PM10 concentrations than north stations. Spring had higher average PM10 concentrations than summer with most stations’ average PM10 concentrations greater than 100 µg/m3. Autumn and winter, shown in Figure 7c,d had higher PM10 concentrations than those of summer and spring, with most urban and south stations’ average PM10 concentrations higher than 140 µg/m3. By comparing winter and autumn, autumn was more seriously polluted by PM10.
Figure 7. Seasonal variations of PM10 concentrations for the 35 air quality monitoring stations ((a) spring; (b) summer; (c) autumn; (d) winter).
Atmosphere 06 01753 g007

3.6. Seasonal Variations of O3

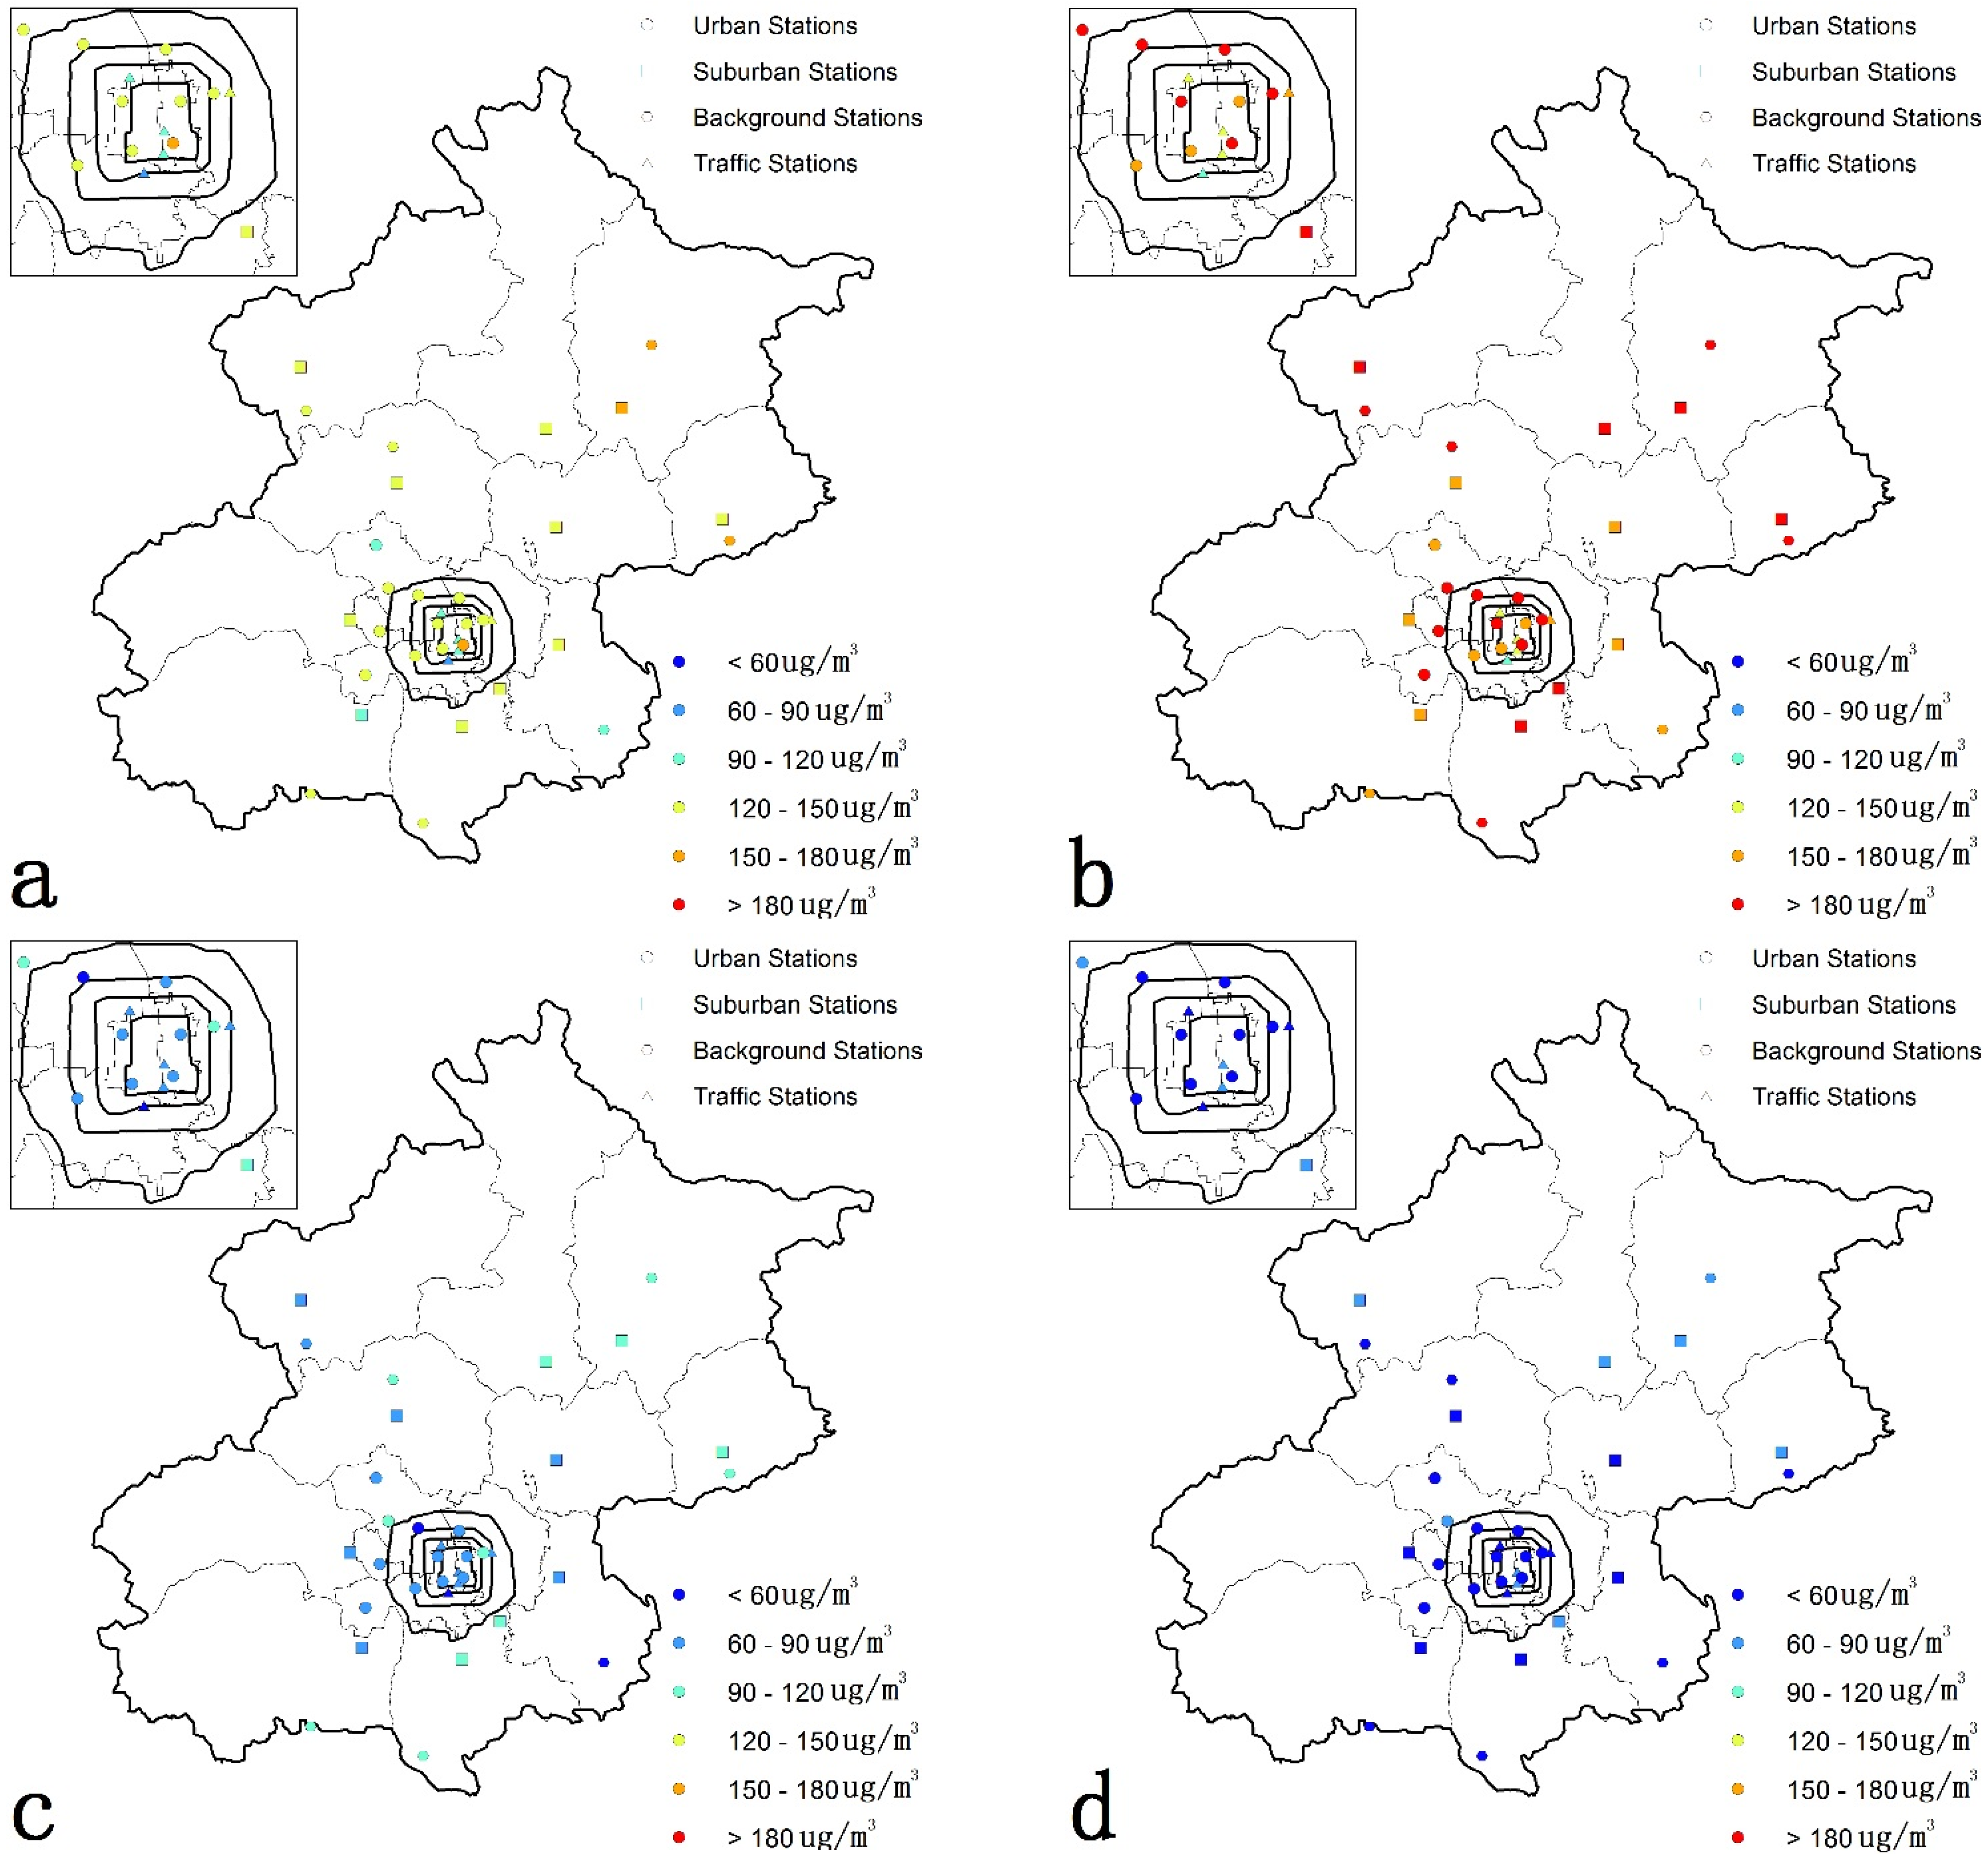
Seasonal variations of O3 were different to those of PM2.5 and PM10. Summer was the most polluted by O3 with most stations’ averaged maximum daily O3 concentrations higher than 150 µg/m3. Only four traffic monitoring stations’ averaged maximum daily O3 concentrations lower than 120 µg/m3 shown in Figure 8b. Spring’s averaged maximum daily O3 concentrations had fallen to less than 120 µg/m3 for most stations. Traffic monitoring stations and two stations in the west had the lowest O3 concentrations as shown in Figure 8a. The O3 concentrations dropped significantly to less than 90 µg/m3 for autumn and even 60 µg/m3 for winter.
Figure 8. Seasonal variations of O3 concentrations for the 35 air quality monitoring stations ((a) spring; (b) summer; (c) autumn; (d) winter).
Atmosphere 06 01753 g008

3.7. Seasonal Variations of SO2

Figure 9 shows the seasonal variations of SO2 concentrations for the 35 monitoring stations in Beijing. Concentrations of SO2 in spring, summer and autumn were all very low to less than 20 µg/m3. Spring and autumn had comparable SO2 concentrations while summer had the lowest SO2 concentrations with most stations’ SO2 concentrations lower than 10 µg/m3 except the five traffic monitoring stations whose average SO2 concentrations higher than 40 µg/m3. Winter time was the most SO2 polluted season with most stations’ SO2 concentrations higher than 20 µg/m3 which is consistent with the heating period in Beijing during the winter time with large amount of coal combustion. The south and southeast stations were affected most by SO2 pollution with average SO2 concentrations higher than 30 or even 40 µg/m3.
Figure 9. Seasonal variations of SO2 concentrations for the 35 air quality monitoring stations ((a) spring; (b) summer; (c) autumn; (d) winter).
Atmosphere 06 01753 g009

3.8. Seasonal Variations of NO2

Autumn and winter had higher NO2 concentrations than those of spring and summer as shown in Figure 10. In autumn and winter, NO2 concentrations were higher in south stations and traffic monitoring stations than the rest stations in the north. In spring and summer, most stations’ NO2 concentrations were less than 40 µg/m3 except the traffic monitoring stations and stations. It is obvious that stations in the south were more polluted by NO2 than those in the north as the southern parts of Beijing were more affected by the traffic.
Figure 10. Seasonal variations of NO2 concentrations for the 35 air quality monitoring stations ((a) spring; (b) summer; (c) autumn; (d) winter).
Atmosphere 06 01753 g010

3.9. Seasonal Variations of CO

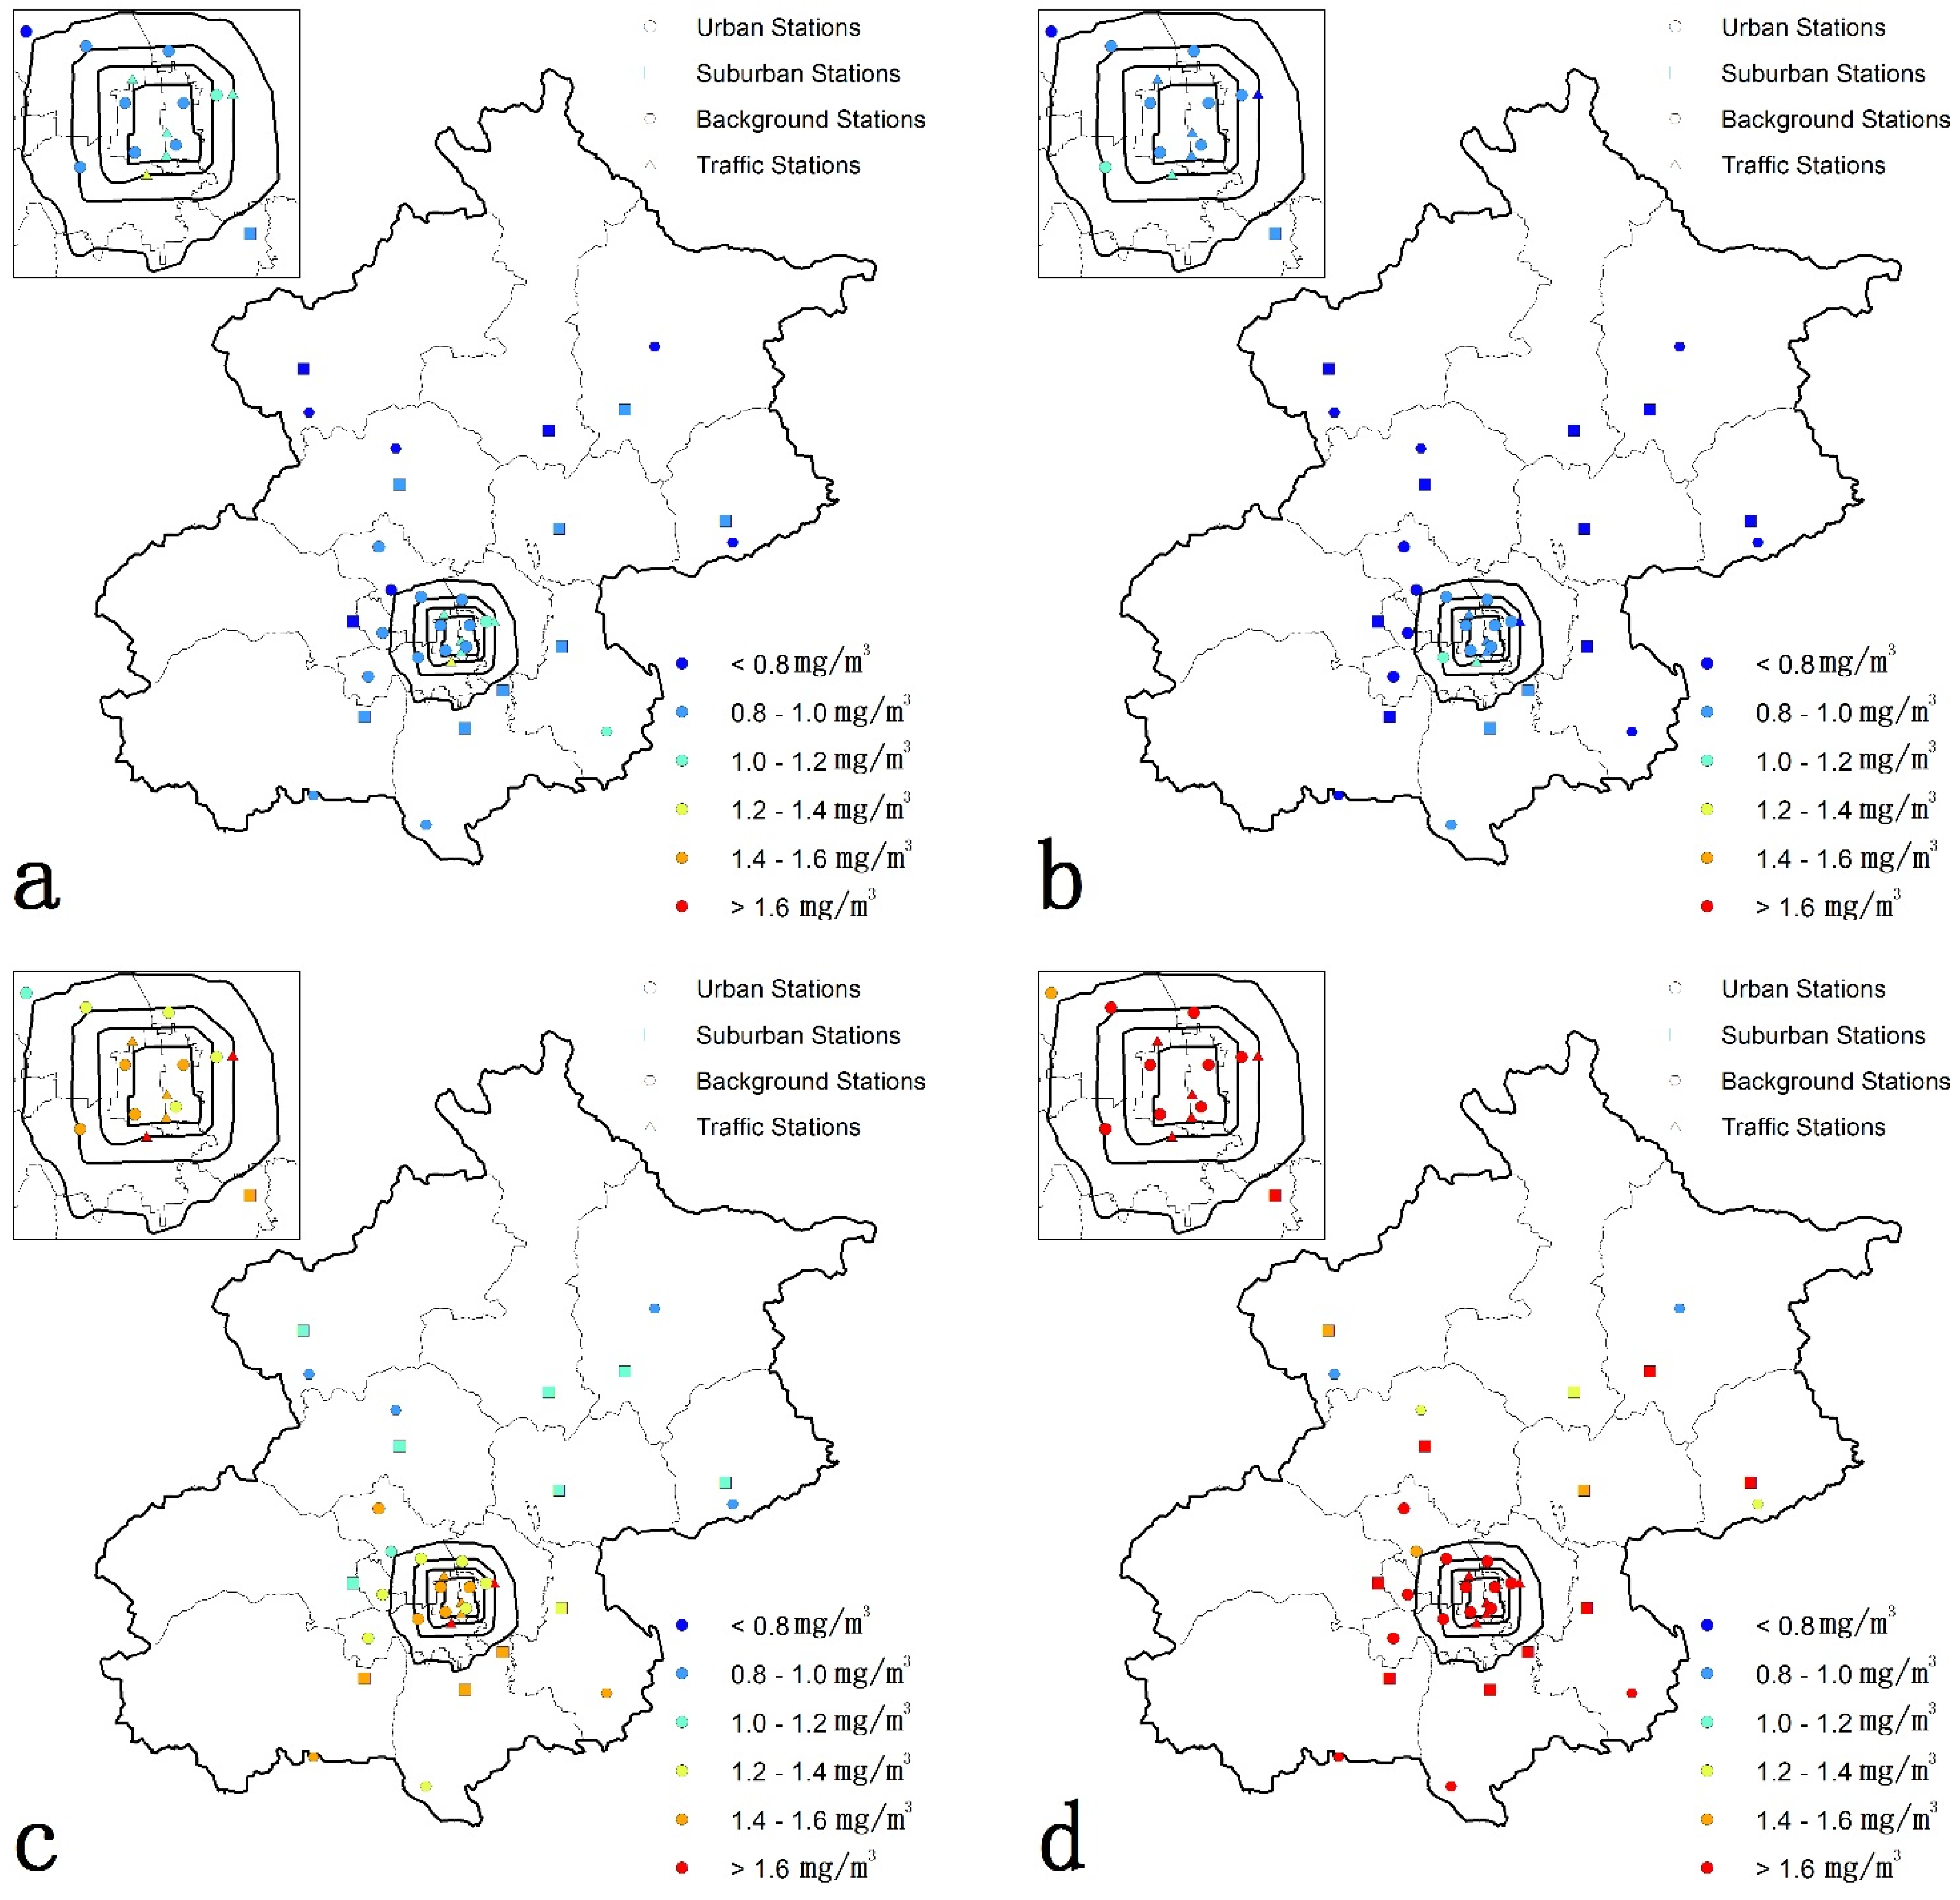
CO concentrations in spring and summer were very low to less than 1.0 mg/m3 or even 0.8 mg/m3 as shown in Figure 11. CO concentrations began to rise from winter to more than 1.2 mg/m3 for most monitoring stations in south area shown in Figure 11c. Winter was the most CO polluted season with most monitoring stations having average CO concentrations higher than 1.6 mg/m3 except seven stations in the north. The Maximum average CO concentration even reached 4.1 mg/m3, suggesting that the heating period in winter brought a lot of CO pollution for Beijing.
Figure 11. Seasonal variations of CO concentrations for the 35 air quality monitoring stations ((a) spring; (b) summer; (c) autumn; (d) winter).
Atmosphere 06 01753 g011

4. Discussion

The real-time release of atmospheric pollution concentrations and air qualities for 35 permanent monitoring stations on the web-platform provided a powerful data source for governments and researchers to investigate the air pollution situations and make policies to deal with air pollutions. New ambient air quality standard has brought PM2.5, O3 and CO into the air quality monitoring system. First of all, the introduction of PM2.5 in the standard had brought down the air quality attainment rate by 15% to 22% for all monitoring stations, which is really a great problem for the evaluation of the work of local government as the air quality attainment rates have dropped to less than 70% for most monitoring stations.
Different to the daily report of API without concentration of each pollutant under NAAQS-1996, Beijing municipal government provided real-time concentrations of all six pollutants to the public. These public data, although sometimes with some missing data due to internet transfer or data error, could help researchers to insightfully investigate the atmospheric pollution situations. As the most frequent primary pollutants, PM2.5 and PM10 shew similar spatial and seasonal patterns that south and southeast stations were polluted most during autumn and winter while the pollutions in summer and spring were reduced to a fairly good level. Except O3, the rest of the five pollutants showed similar temporal patterns that summer had the lowest pollutants concentrations while autumn and winter were the most polluted. O3 concentrations tend to increase in humid summer time with strong solar radiations under strong photo-chemical reactions in the atmosphere. In dry winter and autumn, O3 concentrations dropped greatly. Additionally, O3 concentrations are higher in north stations without traffic activities, which is the major contribution to the NO2 in the atmosphere. The high concentrations of nitrogen oxides in the regions with heavy traffic monitoring have greatly reduced the concentrations of O3 by the chemical reaction process , while for those stations far away from traffic (mainly in north stations), the O3 concentrations are higher with less concentrations of nitrogen monoxide as a catalyst. SO2, NO2 and CO concentrations’ spatial and temporal distributions were similar as south and south stations in winter were most serious polluted while spring and summer were less polluted. As a kind of vehicle exhaust, NO2 concentrations of traffic monitoring stations just next to main streets were higher than other stations, demonstrating the impact of traffic. SO2 and CO, usually considered to be products of coal combustion, were higher in the winter heating season and probably transported from the south neighboring province.
Table 2 shows the current operating air quality stand with its limits. By comparing the limit with qualified level (IAQI < 100), we would find that under most situations, the concentrations of CO and SO2 fall in the range of IAQI < 100 or even 50, suggesting that CO and SO2, although included in the air quality monitoring system, were not the major reason for the air pollution. NO2 and O3, however, sometimes would exceed the daily limits (concentrations when IAQI = 100). Particulate matter, especially PM2.5, was the frequent pollutant over the limit for south and southeast stations during winter and autumn. These results demonstrated that under the new ambient air quality standard, PM2.5 is the major reason for the deterioration of air quality in Beijing. The high concentrations of PM2.5 in south and southeast stations also suggested that except for a local source, the transportation of south neighboring province could not be neglected.
Wind fields play an important role in the dispersion of atmospheric pollutants, especially under the conditions of heavy pollution. In this paper, we selected the top 15% concentrations of all pollutants for one selected station (The situations of the rest stations are similar). The top 15% concentrations of the six pollutants with their associations with wind speed and wind directions of Station 1 (Dongsi, an urban station) are shown in Figure 12. The results suggest that the top 15% concentrations of all pollutants (high heavy pollutant concentrations) mainly occurred under the situation of low wind speed (less than 1.5 m/s) except for O3. For PM2.5, south and east low wind speed situations have the highest possibility of high PM2.5 concentrations. For PM10, the situation is similar except that some large northwest wind speed may bring high PM10 concentrations indicating that the dust source of PM10. For O3, SO2, NO2 and CO, high pollutants’ concentrations mainly occurred under southwest and east low speed wind conditions. These results suggested that low wind speed, with southwest or east wind situations have the most frequent heavy polluted occurrences in Beijing.
Figure 12. Wind profiles of the top 15% measurements of each pollutant for Station 1: Dongsi in urban Beijing ((a) PM2.5, (b) PM10, (c) O3, (d) SO2, (e) NO2, and (f) CO).
Atmosphere 06 01753 g012

5. Conclusions

Beijing, the capital of China, has endured serious air pollution problems in the past decade. However, the previous air quality standard (NAAQS-1996) suggested that the air quality was fairly good which is inconsistent with residents’ feelings and the frequent fog-haze events after 2011. Therefore, China has released new air quality standards (NAAQS-2012) by adding PM2.5, O3 and CO besides PM10, SO2 and NO2 into the air quality standards with real time requests. In this study, we collected the annual monitoring data of all six pollutants from September 2014 to August 2015 to have a comprehensive evaluation of the seasonal and spatial situations of the atmospheric pollution in Beijing.
Temporal distributions of the air pollutants demonstrated that autumn and winter were the season most polluted by PM2.5, PM10, SO2, NO2 and CO while summer was the one having the best air quality. O3 showed an obviously different pattern that summer was polluted most by O3 as the abundant solar radiation, and a humid atmosphere helped the generation of O3 in the afternoon. Spatial distribution of these air pollutants suggested the stations in south and southeast areas were more seriously polluted by PM2.5, PM10, SO2 and CO in winter and autumn, while the atmospheric pollution concentrations in north stations were far lower. This kind of spatial pattern of air pollution demonstrated the transportation from south and southeast directions. Extra wind profile analysis with heavy pollution situations indicates that low speed southwest or east wind situations have the higher possibility of heavy pollution, suggesting that it is highly possible that long-range transportation of air pollutants from south or east sources could not be neglected. NO2 concentrations of traffic monitoring stations were higher. The monitoring results revealed that PM2.5 and PM10 were the major contributors to the air pollution and that NO2 and O3 remained relatively important pollutants but not comparable to particulate matter. SO2, a kind of pollutant that used to be high in concentration at the beginning of 21st century, has become a pollutant with low concentration well under the air quality standard qualification. CO concentrations, with winter higher than the rest of the seasons, were qualified under most circumstances. Therefore, the major challenge for government of Beijing to deal with the serious problems of air pollution is how to reduce the concentrations of PM2.5 both locally and transported a long way from southerly directions.

Acknowledgments

This work was supported by the Fundamental Research Funds for the Central Universities (Grant No. 2014QD02).

Author Contributions

All authors contributed a lot. Wei Chen defined the major working scheme, collected the data and wrote the paper. Lei Yan provided some key data of air pollution. Haimeng Zhao processed and analyzed the aerosol data.

Conflicts of Interest

The authors declare no conflicts of interest

References

  1. Li, R.; Li, Z.; Gao, W.; Ding, W.; Xu, Q.; Song, X. Diurnal, seasonal, and spatial variation of PM2.5 in Beijing. Sci Bull. 2015, 60, 387–395. [Google Scholar] [CrossRef]
  2. Guo, Y.; Feng, N.; Christopher, S.A.; Kang, P.; Zhan, F.B.; Hong, S. Satellite remote sensing of fine particulate matter (PM2.5) air quality over Beijing using MODIS. Int. J. Remote Sens. 2014, 35, 6522–6544. [Google Scholar] [CrossRef]
  3. Zhang, R.; Jing, J.; Tao, J.; Hsu, S.C.; Wang, G.; Cao, J.; Shen, Z. Chemical characterization and source apportionment of PM2.5 in Beijing: Seasonal perspective. Atmos. Chem. Phys. 2013, 13, 7053–7074. [Google Scholar] [CrossRef]
  4. Zhang, A.; Qi, Q.; Jiang, L.; Zhou, F.; Wang, J. Population exposure to PM2.5 in the urban area of Beijing. Plos One 2013, 8, E63486. [Google Scholar] [CrossRef] [PubMed]
  5. Wang, J.F.; Hu, M.G.; Xu, C.D.; Christakos, G.; Zhao, Y. Estimation of citywide air pollution in Beijing. Plos One 2013, 8, E53400. [Google Scholar] [CrossRef] [PubMed]
  6. Andrews, S.Q. Inconsistencies in air quality metrics: ‘Blue Sky’ days and PM10 concentrations in Beijing. Environ. Res. Lett. 2008, 3, 034009. [Google Scholar] [CrossRef]
  7. Liu, Z.R.; Hu, B.; Liu, Q.; Sun, Y.; Wang, Y.S. Source apportionment of urban fine particle number concentration during summertime in Beijing. Atmos. Environ. 2014, 96, 359–369. [Google Scholar] [CrossRef]
  8. Baccarelli, A.A.; Zheng, Y.; Zhang, X.; Chang, D.; Liu, L.; Wolf, K.R.; Hou, L. Air pollution exposure and lung function in highly exposed subjects in Beijing, China: A repeated-measure study. Part. Fibre Toxicol. 2014, 11, 51. [Google Scholar] [CrossRef] [PubMed]
  9. Wang, L.; Zhang, P.; Tan, S.; Zhao, X.; Cheng, D.; Wei, W.; Pan, X. Assessment of urban air quality in China using air pollution indices (APIs). J. Air Waste Manag. Assoc. 2013, 63, 170–178. [Google Scholar] [CrossRef] [PubMed]
  10. Xu, P.; Chen, Y.F.; Ye, X.J. Haze, air pollution, and health in China. Lancet 2013, 382, 2067. [Google Scholar] [CrossRef]
  11. Gao, H.; Chen, J.; Wang, B.; Tan, S.C.; Lee, C.M.; Yao, X.; Shi, J. A study of air pollution of city clusters. Atmos. Environ. 2011, 45, 3069–3077. [Google Scholar] [CrossRef]
  12. Zhao, H.; Che, H.; Ma, Y.; Xia, X.; Wang, Y.; Wang, P.; Wu, X. Temporal variability of the visibility, particulate matter mass concentration and aerosol optical properties over an urban site in Northeast. China. Atmos. Res. 2015, 166, 204–212. [Google Scholar] [CrossRef]
  13. San Martini, F.M.; Hasenkopf, C.A.; Roberts, D.C. Statistical analysis of PM2.5 observations from diplomatic facilities in China. Atmos. Environ. 2015, 110, 174–185. [Google Scholar] [CrossRef]
  14. You, M.Q. Addition of PM2.5 into the national ambient air quality standards of China and the contribution to air pollution control: The case study of Wuhan, China. Sci. World J. 2014, 2014, 768405. [Google Scholar] [CrossRef] [PubMed]
  15. Hu, J.; Ying, Q.; Wang, Y.; Zhang, H. Characterizing multi-pollutant air pollution in China: comparison of three air quality indices. Environ. Int. 2015, 84, 17–25. [Google Scholar] [CrossRef] [PubMed]
  16. Zhang, H.; Wang, Y.; Hu, J.; Ying, Q.; Hu, X.M. Relationships between meteorological parameters and criteria air pollutants in three megacities in China. Environ. Res. 2015, 140, 242–254. [Google Scholar] [CrossRef] [PubMed]
  17. Distribution of real time air quality of Beijing. Available on line: http://zx.bjmemc.com.cn/ (accessed on 12 November 2015).