Abstract
Columnar aerosol volume size distributions from March 2012 to February 2013 in Wuhan, China, were investigated with a focus on monthly and seasonal variations in the aerosol optical depths (AODs) and Ångström exponents. AOD is wavelength dependent, and for AOD at, for example, 500 nm, the seasonal averaged AOD value decreased in the order of winter (~0.84), spring (~0.83), summer (~0.76) and autumn (~0.55). The Ångström exponent suggested that the aerosol sizes in summer (~1.22), winter (~1.14), autumn (~1.06) and spring (~0.99) varied from fine to coarse particles. The Ångström exponent and AOD could provide a qualitative evaluation of ASD. Moreover, aerosol size distribution (ASD) was larger in winter than the other three seasons, especially from 1.0 µm to 15 µm due to heavy anthropogenic aerosol and damp climate. The ASD spectral shape showed a bimodal distribution in autumn, winter, and spring, with one peak (<0.1) in the fine mode range and the other (>0.14) in the coarse mode range. However, there appeared to be a trimodal distribution during summer, with two peaks in the coarse mode, which might be due to the hygroscopic growth of the local particles and the generation of aerosol precursor resulting from the extreme-high temperature and relative humidity.
1. Introduction
Aerosols play a crucial role in global and regional climate change [1], the atmosphere [2], and human health [3]. They have a strong impact on the formation of clouds [4], dust, and fog [5], as well as the global radiation balance [6]. The aerosol size distributions (ASDs), aerosol optical depths (AODs) and Ångström exponents are all vitally important optical properties. ASD determines AOD and is an indication of environmental quality, and the effects of atmospheric aerosols on human health fundamentally depend on aerosol size [7]. Despite many studies of aerosol, aerosol optical properties have been the focus of research and a large source of uncertainties in assessment and predictions of climate change [8]. Therefore, without a good understanding of ASD, AOD, and Ångström exponent, aerosol optical properties and magnitudes effect on climate change would remain highly uncertain.
To better understand anthropogenic activities and meteorology influence on aerosol properties, several global ground-based aerosol observation networks have been established such as AERONET (Aerosol Robotic Network), PHOTONS and so on [9,10]. At present there are more than 20 AERONET sites located in China. To improve understanding of aerosol optical properties in China, the China Aerosol Remote Sensing Network (CARSNET) and the Chinese Sun Hazemeter Network (CSHNET) was established in 2002 and 2004 respectively. In recent years, many aerosol-related investigations and scientific studies have been conducted using ground–based data. Aerosol optical properties over the Loess Plateau in Semi-Arid Climate were reviewed by observations of Environment Observatory of Lanzhou University (SACOL) [11]; dust aerosol direct radiative forcing using MFRSR and AERONET data in northwestern China was also investigated [12]. Che H.Z. et al. analyzed aerosol optical properties and optical properties validation in several sites of CARSNET [13]; Xin J.Y. et al. also made a detailed analysis of AOD and Ångström exponent observed by CSHNET [14] and also discussed optical properties and ASDs of dust aerosol in Northern China [15]; aerosol optical properties in Chinese Yangtze Delta Region were analyzed and compared using Cimel Sun Photometer data at five sites including Pudong, Dongtan, Lin’an, ZFU and Taihu [16]. Investigations of ASDs have been performed in many cities in China, including Beijing, China [17,18], and Guangzhou, China [19] and so on, however, ASD here was measured by Aerodynamic Particle Sizer which measured ASD in the boundary layer not the total atmospheric column.
Due to spatiotemporal variety of aerosol and many aerosol-related studies focused on Jing-Jin-Tang Region, Pearl River Delta (PRD), Yangtze River Delta and Northwestern China, combined with few works dealing with optical properties and ASDs using sun photometers in Central China, it is vitally important to analyze optical properties and ASDs in Central China. Wuhan is a well-known urban area in central China, and a center of industry, transport and the regional economy. As far as I am aware, AERONET, CARSNET and CSHNET do not have sites in Wuhan. Therefore, our works in Wuhan could improve our knowledge of aerosol effects on climate change in Central China.
In this study, columnar aerosol volume size distributions were obtained by the relationship between AOD and ASD using an inversion calculation based on the traditional light extinction method. Therefore, long-term observations were carried out using a sun photometer located in Wuhan to obtain AOD, and from that, ASD. We analyzed the monthly and seasonal variations in AOD and Ångström exponents, as well as the seasonal variations in ASD and studied the relationship between optical properties and ASD.
2. Site, Instrument and Method
2.1. Site and Meteorology
The instrument is installed at the Faculty of Information of Wuhan University (30°32'N, 114°21ʹE), which is located in downtown of Wuhan, China. Wuhan is the capital city of Hubei province, and is located in central China at the confluence of the Yangtze and Han rivers (Figure 1) [20]. Wuhan is the most industrialized city of Central China and its dramatic process of urbanization has been witnessed during the past decades. This region has a subtropical monsoon climate, with abundant rainfall and high temperatures during the summer and abundant cloud cover, relatively great air humidity and low temperatures during winter. Due to sustained extreme-high in summer, Wuhan is known as one of China’s four furnaces.
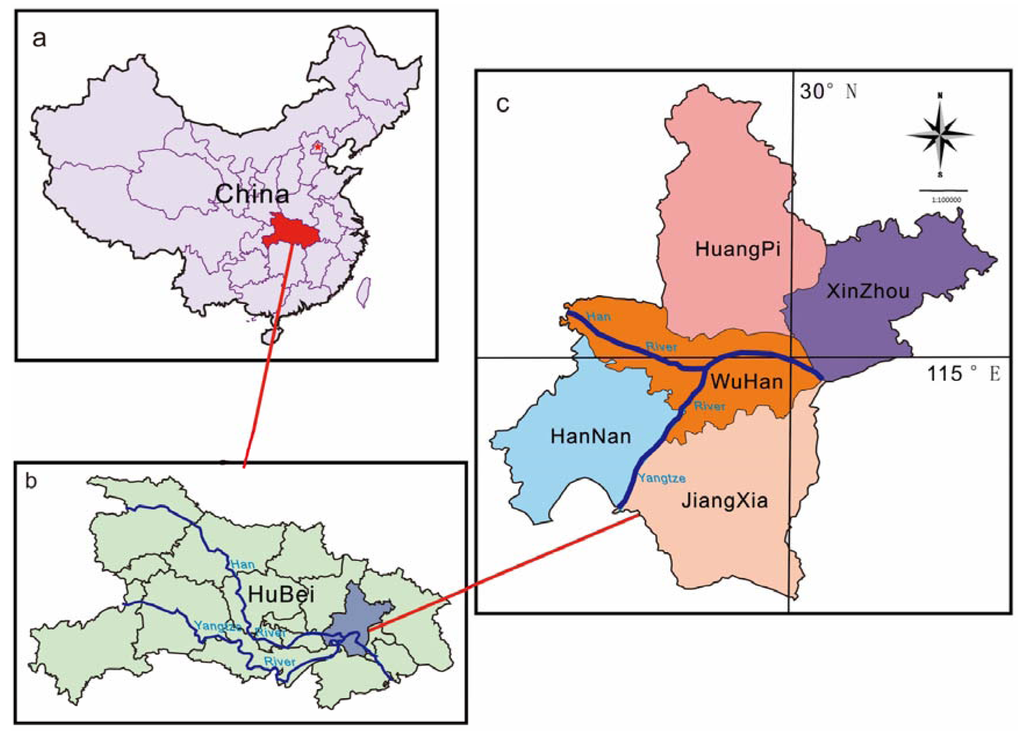
Figure 1.
Location of Wuhan, China: (a) location of Hubei Province in China; (b) location of Wuhan in Hubei Province; and (c) geographical distribution in Wuhan.
2.2. Instrument and Method
The CE318 sun photometer shown in Figure 2 is a sun-sky scanning spectral radiometer. The instrument has nine spectral channels in visible and infrared wavelengths centered at 340 nm, 380 nm, 440 nm, 500 nm, 670 nm, 870 nm, 936 nm, 1,020 nm, and 1,640 nm. It measures direct solar radiation by automatically tracking the sun position, and can characterize aerosol properties from the solar almucantar. Solar radiation data measured by the CE318 sun photometer can also derive atmospheric transmittance, extinction optical thickness, AOD, precipitation column amounts, and the ozone concentration. The sky-scan data can retrieve the ASD and aerosol phase function. These data can then be used for dust monitoring, environmental pollution detection, and satellite sensor calibration. The 340 nm and 936 nm channels were used for deriving the ozone concentration and precipitation column amounts, respectively, and the other seven wavelengths were used to measure aerosols [9].
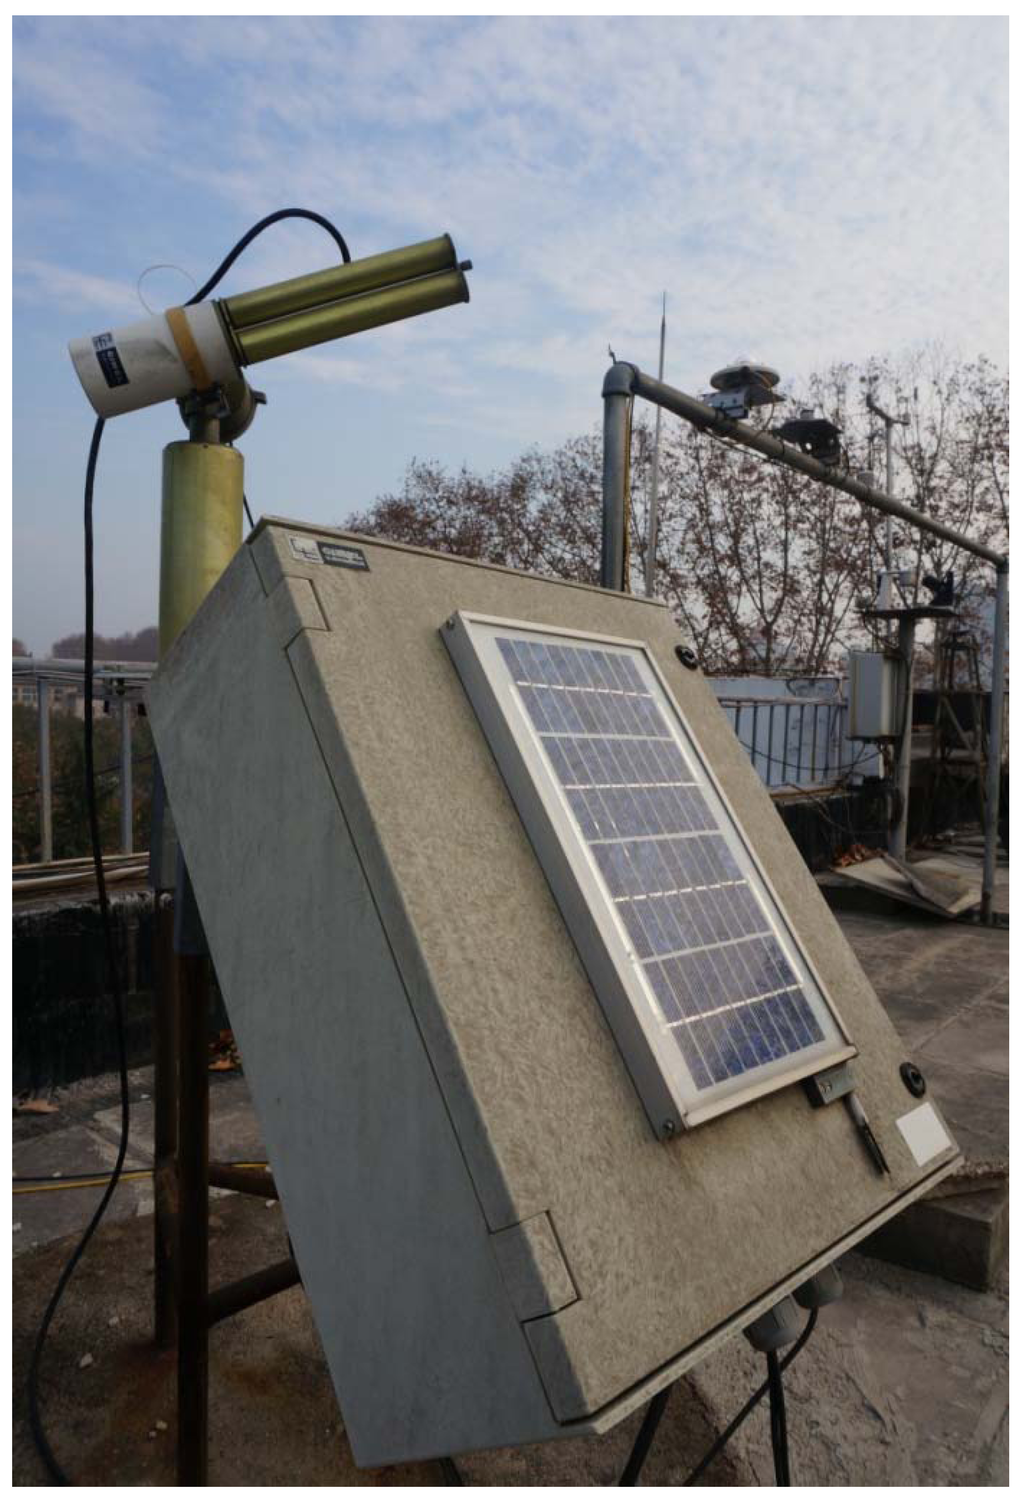
Figure 2.
The sun photometer at Wuhan University.
The instrument is calibrated following the AERONET calibration protocol method once a year to ensure the accuracy and reliability of the observed data. A detailed description of the instrument calibration is presented by Holben et al. [9,21]. AOD accuracy is better or at round 0.01, radiance is better than 4%–5% with the standard laboratory integrating sphere [22]. The AODs and Ångström exponents are calculated using the ASTPwin software, this software is used to calculate Level 1.0 AOD (raw result without cloud screening), Level 1.5 AOD (cloud-screened result), and Ångström exponent between 440 nm and 870 nm. The Ångström exponent different from AERONET is a two wavelength computation [23].
The aerosol optical thickness of multiple wavelengths was determined by light extinction measured by the sun photometer, and the extinction spectrum contained the weight information of the ASD. The equation that relates AOD to ASD [24] can be written as


where r is the radius of the aerosol particle; rmax and rmin are the maximum radius and the minimum radius of the radius range, respectively; m is the complex refractive exponent; λ is the wavelength of the incident illumination; Qe (r, λ, m) is the extinction efficiency factor from the Mie theory, which is the function of particle size parameter x and the complex refractive exponent m with x = 2π r/λ ; and n(r) is the unknown columnar ASD.
In this study, the inversion method is based on the method of King et al. [24], but the difference is that the rapidly varying function is assumed to have a lognormal distribution; the radius range is from 0.05 µm to 15 µm. Thus, using AOD at 1,640 nm, 1,020 nm, 870 nm, 670 nm, 500 nm, 440 nm, and 380 nm, the columnar aerosol volume size distribution can be calculated. In this paper, we use Level 1.5 AOD data. In order to ensure more accurate inversion data, the regular routine maintenance for the sun photometer has been performed seriously. To analyze the seasonal variations in ASD, AOD and Ångström exponent, we collected data over one year, from March 2012 to February 2013.
3. Results and Analysis
In this paper, March, April, and May are considered “spring”; June, July, and August are “summer”; September, October, and November are “autumn”; and December, January, and February are “winter.” Some data from 11 June to 15 June were removed owing to the brownish-yellow smog from straw burning in northern China reported in China Daily, thus these data were unrepresentative; Seasonally averaged AOD of each channel and Ångström exponent are showed in Table 1. These values below were all calculated from the daily average observed values. The AOD of each channel was highest in spring, while in summer, the AOD was smaller than that in spring. The AOD was the lowest in autumn, and less than 1.0 in each channel. During winter, the AOD was similar to but less than that in spring. It also can be seen in Table 1 that AOD became smaller with increasing wavelength. The Ångström exponent value peaked in summer and declined in spring. Additionally, the Ångström exponent values were above 1.1 during summer and winter, and close to 1.0 during spring and autumn.

Table 1.
Seasonally averaged aerosol optical depths (AOD) of each channel (nm) and Ångström exponent values.
| Season | AOD (Channel in nm) | Ångström Exponent | Day | ||||||
|---|---|---|---|---|---|---|---|---|---|
| 380 | 440 | 500 | 670 | 870 | 1020 | 1640 | |||
| Spring | 1.05 | 0.94 | 0.83 | 0.60 | 0.47 | 0.40 | 0.27 | 0.99 | 16 |
| Summer | 0.98 | 0.87 | 0.76 | 0.51 | 0.36 | 0.29 | 0.17 | 1.22 | 22 |
| Autumn | 0.75 | 0.64 | 0.55 | 0.37 | 0.27 | 0.24 | 0.16 | 1.06 | 28 |
| Winter | 1.04 | 0.95 | 0.84 | 0.59 | 0.44 | 0.37 | 0.21 | 1.14 | 28 |
Figure 3 shows the seasonal statistics of AOD at 500 nm. The averaged value in summer (~0.84) was larger than that in autumn (~0.55), which was partially attributed to the higher temperature and the stagnation from low even no winds during summer and relatively clear, dry weather, and dispersion and deposition of air pollutants during autumn. The mean AOD in spring (~0.83) was close to that in winter (~0.84), which might be due to residence time of particles and particle loading from surrounding regions. The maximum seasonal value peaked in summer and decreased in the other three seasons, which could due to great water vapor content in the atmosphere in Wuhan. The maximum values for the other three seasons ranged from 1 to 2. The minimum value in each season was less than 0.5, which may have been influenced by clear weather and in the case of summer, the plentiful rainfall.
Figure 4 shows the monthly statistics of AOD at 500 nm that explains which month plays a key role in the corresponding season. The monthly average values varied with air quality and water vapor content. The minimum value ~0.25 appeared in July and September, which may have been due to abundant rainfall. The monthly maximum value ~2.2 also occurred in July and was lower in the other months, which could be possibly due to the great water vapor content in the atmosphere on certain days. As we can see, the maximum value was ~2.2 and the minimum value was ~0.25 but the minimum mean value was ~0.6 in July, which demonstrated clear days accounted for the vast majority; this could explain why the maximum value in summer (Figure 3) occurred in July.
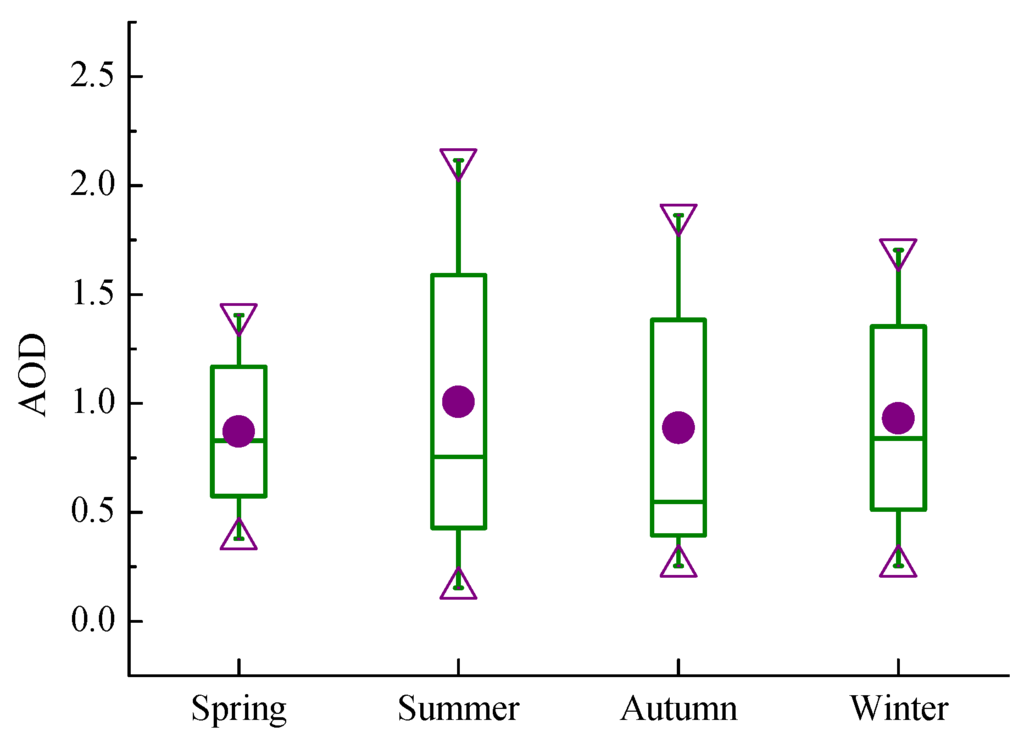
Figure 3.
Seasonal statistics of AOD at 500 nm. The purple dot represents the AOD mean of the maximum and minimum in each season; the box is 25 and 75 percentiles; the triangles represent the maximum and the minimum, respectively, and the short horizontal line represents the seasonal averaged AOD value.
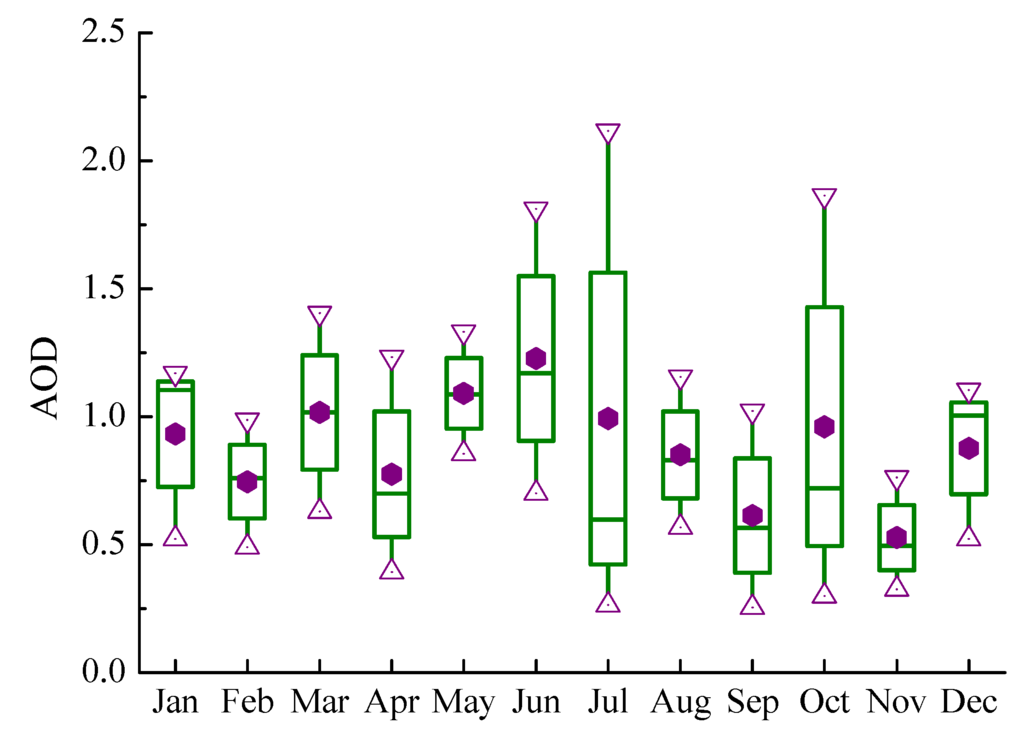
Figure 4.
Monthly statistics of AOD at 500 nm. The purple dot represents the AOD mean of the maximum and minimum in each month; the triangles represent the maximum and the minimum of monthly AOD, respectively; the short horizontal line represents the monthly averaged AOD value.
Figure 5 shows the seasonal statistics of Ångström exponents in Wuhan. The Ångström exponent decreased with increasing aerosol particle size. The annual averaged Ångström exponent was 1.11. The mean Ångström exponent reached a maximum value in summer (~1.22) and minimum value in spring (~0.99), which suggested that the fine particles contributed a much larger aerosol fraction during summer and the coarse particles were main parts during spring. However, the mean Ångström exponent was 1.06 and 1.14, respectively, which might imply an indication of mixed aerosol types. During summer, the highest value was ~1.5, the lowest ~0.4,but the mean ~1.22, it might indicate that the clear weather was dominant.
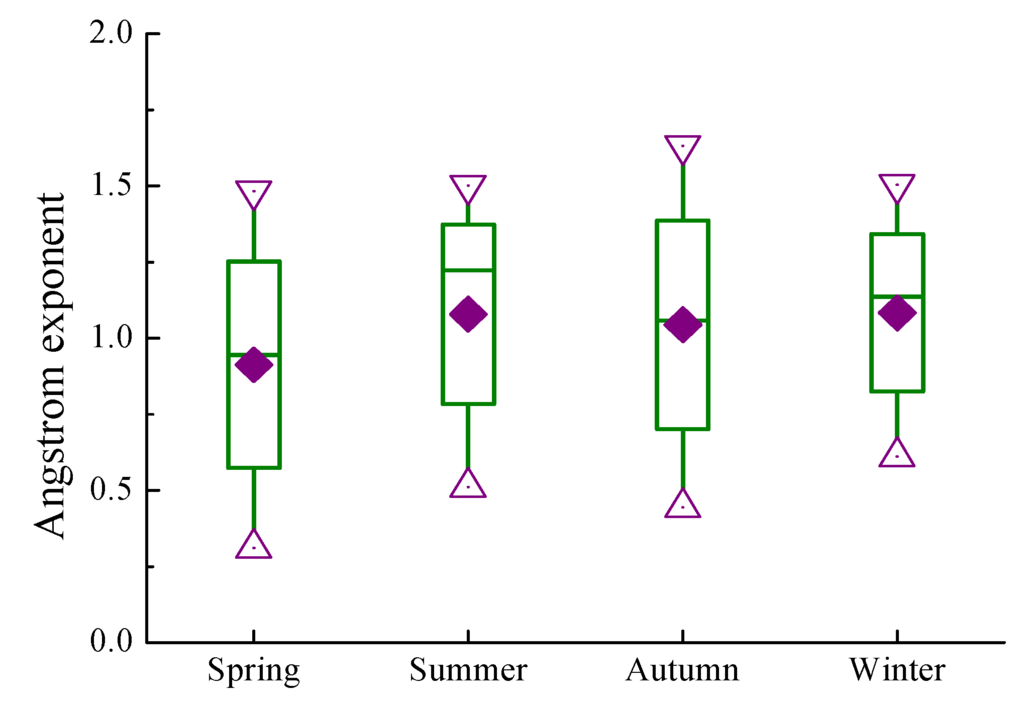
Figure 5.
Seasonal statistics of Ångström exponents. The purple diamond represents the mean of the maximum and minimum; the box is 25 and 75 percentiles; the triangles represent the maximum and the minimum, respectively; the short horizontal line represents the seasonal averaged Ångström exponent value.
Figure 6 shows the monthly statistics of Ångström exponents in Wuhan which indicates every month contributes to the corresponding season. This primarily shows the monthly differences in particle size. The monthly averaged Ångström exponent decreased from ~1.25 in January to ~0.7 in April, and fluctuated around 1.0 from July to October. The monthly averaged Ångström exponent value was highest in May and June (~1.4) and lowest in April (~0.7). In other words, the fine particles were more prevalent in May and June, while coarse particles were more prevalent in April. During summer, the seasonal averaged value was ~1.22 (Figure 5), and the monthly mean values were about 1.4, 1.2, and 1.15 for June, July, and August, respectively. It suggested that June made a largest contribution to summer. Similarly, in July, the monthly mean was about 1.15 and the maximum was about 1.5, the minimum was about 0.5, which implied that the clear days were in the majority.
Figure 7 shows the seasonal variations in ASD, with a bimodal distribution in spring, autumn, and winter, and a trimodal distribution in summer. In the bimodal distributions, the fine mode ranged from 0.1 µm to 1 µm, with the peak centered on approximately 0.2 µm; the coarse mode ranged from 1 µm to 10 µm with a peak centered on approximately 4 µm. And the bimodal aerosol size distributions were dominated by coarse particles. During winter, the ASD value was larger than that of the other three seasons in the coarse mode range due to its highest AOD (~0.84) and the larger Ångström exponent (~1.14), which might be attributed to cold and wet air, amount of building construction, huge population and aerosol accumulation resulting from wind or precipitation, although, it is unlike other coal-fired heating cities in northern China. However, there were little difference among four seasons in the fine mode range and all values were less than 0.1, which implied that the fine particles were from local natural sources and its content was relatively stable. Summer showed a distinct pattern due to a slightly higher AOD (~0.76) and the highest Ångström exponent (~1.22), which was possibly due to plentiful precipitation leading to the removal of coarse particles and reduction in the number of fine particles. Another peak of about 0.02 appeared at a radius of about 7 µm, and this might be owing to the hygroscopic growth of the existing local particles and the production of aerosol precursor resulting from the extreme-high temperature and high humidity.
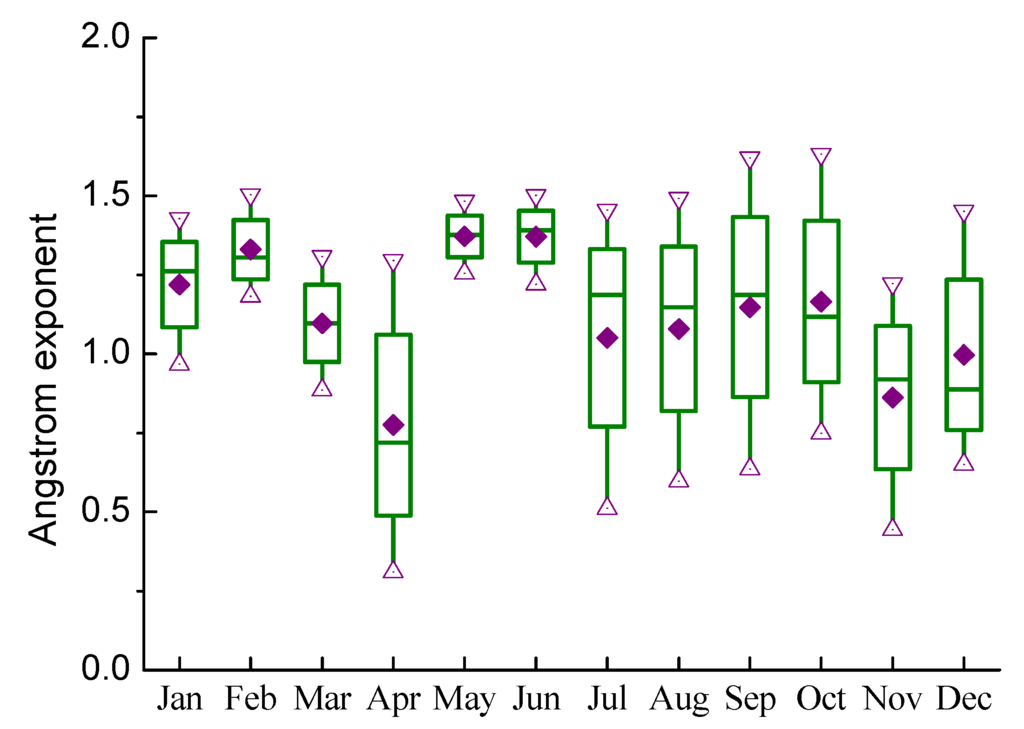
Figure 6.
Monthly statistics of Ångström exponents. The purple diamond represents the mean of the monthly maximum and monthly minimum; the triangles represent the maximum and the minimum of each month, respectively; the short horizontal line represents the monthly averaged Ångström exponent value.
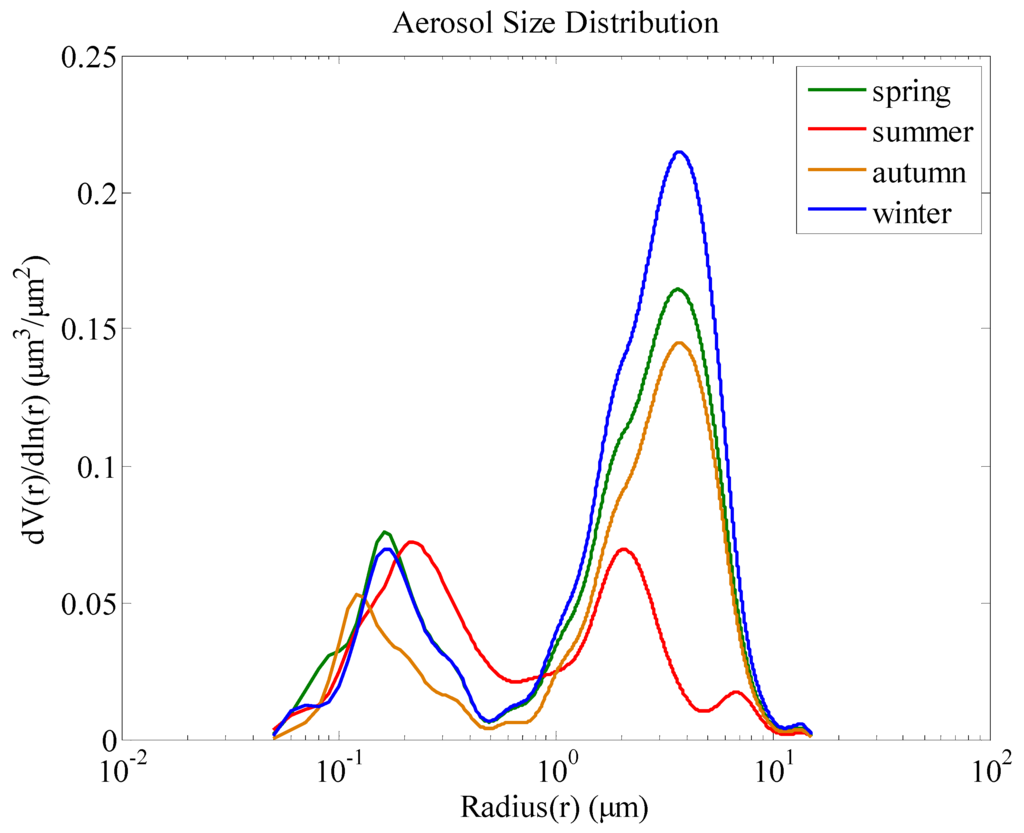
Figure 7.
Seasonal variations of aerosol size distributions (ASD) in Wuhan from March 2012 to February 2013.
4. Conclusions
Sun photometer measurements were used to calculate seasonal ASD over one year in Wuhan, China. We used 500 nm as the optimal wavelength for our analysis. Wuhan is the most developed area in Central China with many factories and a large population, so the seasonally averaged AOD values were relatively large. The minimum monthly AOD mean value appeared in July, possibly due to the large amount of precipitation and extreme-high temperature, while the maximum monthly AOD mean value occurred in January and was possibly due to cold and wet air, heavy anthropogenic aerosol derived from building construction and manufacturing industry, and stagnant weather. The monthly averaged Ångström exponent peaked in May and June and was lowest in December and April. Based on this, fine particles appeared to be more prevalent in the summer while coarse particles dominated during spring and winter. Seasonal ASD differences were obtained based on the inversion calculation from corresponding seasonal AOD, and we found that ASD could partially be explained using AOD and Ångström exponent, with AOD reflecting the air quality and Ångström exponent corresponding to particle size. The ASD spectrum showed a bimodal distribution during all seasons except for summer. During summer, the spectrum showed a distinct trimodal pattern, Ångström exponents indicated that fine particles were most prevalent, and the AOD values indicated poor air quality. Potential reasons for this result included the hygroscopic growth of local particles and the production of aerosol precursor during summer.
This study investigated the monthly and seasonal variations in AOD and Ångström exponents as well seasonal variations in ASD in Wuhan, China. The relationships we observed among AODs, Ångström exponents, and ASD showed that further study of aerosol properties and atmospheric environmental protection is still needed. However, the characterization of aerosol type in Wuhan is also quite difficult and long-term observed data are required in order to improve our understanding of aerosol effects on the climate and atmospheric environment.
Acknowledgments
This work was supported financially by 973 Program (2011CB707106) and NSFC Program (10978003 and 41127901). We express our sincere gratitude to all members of Lidar group in LIESMARS, Wuhan University, China.
Author Contributions
The work presented here was carried out in collaboration between all authors. Wei Gong, Yingying Ma and Shanshan Zhang defined the research theme and edited the manuscript. Shanshan Zhang and Yingying Ma designed methods and experiments. Shanshan Zhang carried out experiments, analyzed the data, interpreted the results and wrote the paper. Wei Gong provided data and approved the final paper. All authors have contributed to, seen and approved the manuscript.
Conflicts of Interest
The authors declare no conflict of interest.
References
- Charlson, R.J.; Schwartz, S.E.; Hales, J.M.; Cess, D.; Coakley, J.A.; Hansen, J.E. Climate forcing by anthropogenic aerosols. Science 1992, 255, 423–430. [Google Scholar]
- Chow, J.C.; Watson, J.G.; Fujita, E.M.; Lu, Z.Q.; Lawson, D.R. Temporal and spatial variations of PM2.5 and PM10 aerosol in the Southern California air quality study. Atmos. Environ. 1994, 28, 2061–2080. [Google Scholar] [CrossRef]
- Dockery, D.W.; Pope, C. Acute respiratory effects of particulate air pollution. Annu. Rev. Publ. Health 1994, 15, 107–132. [Google Scholar] [CrossRef]
- Koren, I.; Kaufman, Y.J.; Remer, L.A.; Martins, J.V. Measurement of the effect of Amazon smoke on inhibition of cloud formation. Science 2004, 303, 1342–1345. [Google Scholar] [CrossRef]
- Hallett, J.; Hudson, J.; Rogers, C. Characterization of combustion aerosols for haze and cloud formation. Aerosol. Sci. Tech. 1989, 10, 70–83. [Google Scholar] [CrossRef]
- Coakley, J.A.; Cess, R.D.; Yurevich, F.B. The effect of tropospheric aerosols on the earth’s radiation budget: A parameterization for climate models. J. Atmos. Sci. 1983, 40, 116–138. [Google Scholar] [CrossRef]
- Mohanraj, R.; Solaraj, G.; Dhanakumar, S. PM2.5 and PAH concentrations in urban atmosphere of Tiruchirappalli, India. Bull. Environ. Contam. Toxicol. 2011, 87, 330–335. [Google Scholar] [CrossRef]
- Hansen, J.; Sato, M.; Ruedy, R.; Lacis, A.; Oinas, V. Global warming in the Twenty-First Century: An alternative scenario. Proc. Natl. Acad. Sci. USA 2000, 97, 9875–9880. [Google Scholar] [CrossRef]
- Holben, B.N.; Eck, T.F.; Slutsker, I.; Tanre, D.; Buis, J.P.; Setzer, A.; Vermote, E.; Reagan, J.A.; Kaufman, Y.J.; Nakajima, T. AERONET—A federated instrument network and data archive for aerosol characterization. Remote Sens. Environ. 1998, 66, 1–16. [Google Scholar] [CrossRef]
- Goloub, P.; Li, Z.; Dubovik, O.; Blarel, L.; Podvin, T.; Jankowiak, I.; Lecoq, R.; Deroo, C.; Chatenet, B.; Morel, J.P.; Cuevas, E.; Ramos, R. PHOTONS/AERONET sunphotometer network overview: Description, activities, results. Proc. SPIE 2008, 6936, 69360V:1–69360V:15. [Google Scholar]
- Huang, J.P.; Zhang, W.; Zuo, J.Q.; Bi, J.R.; Shi, J.S.; Wang, X.; Chang, Z.L.; Huang, Z.W.; Yang, S.; Zhang, B.D.; et al. An overview of the semi-arid climate and environment research observatory over the Loess Plateau. Adv. Atmos. Sci. 2008, 25, 906–921. [Google Scholar] [CrossRef]
- Ge, J.M.; Huang, J.P.; Su, J.; Bi, J.R.; Fu, Q. Shortwave radiative closure experiment and direct forcing of dust aerosol over northwestern China. Geophys. Res. Lett. 2011, 38, L24803. [Google Scholar]
- Che, H.Z.; Yang, Z.F.; Zhang, X.Y.; Zhu, C.Z.; Ma, Q.L.; Zhou, H.G.; Wang, P. Study on the aerosol optical properties and their relationship with aerosol chemical composition over three regional background stations in China. Atmos. Environ. 2009, 43, 1093–1099. [Google Scholar] [CrossRef]
- Xin, J.Y.; Wang, Y.S.; Li, Z.Q.; Wang, P.C.; Hao, W.M.; Nordgren, B.L.; Wang, S.G.; Liu, G.R.; Wang, L.L.; Wen, T.X.; et al. Aerosol optical depth (AOD) and Ångström exponent of aerosols observed by Chinese Sun Hazemeter Network from August 2004 to September 2005. J. Geophys. Res. 2007. [Google Scholar] [CrossRef]
- Xin, J.Y.; Wang, Y.S.; Wang, S.G.; Yuan, J.Y.; Zhang, W.Y.; Sun, Y. Optical properties and size distribution of dust aerosol over the Tengger Desert in Northern China. Atmos. Environ. 2005, 39, 5971–5978. [Google Scholar] [CrossRef]
- Pan, L.; Che, H.Z.; Geng, F.H.; Xia, X.G.; Wang, Y.Q.; Zhu, C.Z.; Chen, M.; Guo, J.P. Aerosol optical properties based on ground measurements over the Chinese Yangtze Delta Region. Atmos. Environ. 2010, 44, 2587–2596. [Google Scholar] [CrossRef]
- Cheng, Y.F.; Heintzenberg, J.; Wehner, B.; Wu, Z.J.; Su, H.; Hu, M.; Mao, J.T. Traffic restrictions in Beijing during the Sino-Africa summit 2006: Aerosol size distribution and visibility compared to long-term in situ observations. Atmos. Chem. Phys. 2008, 8, 7583–7594. [Google Scholar] [CrossRef]
- Yue, D.L.; Hu, M.; Wu, Z.J.; Wang, Z.B.; Guo, S.; Wehner, B.; Nowak, A.; Achtert, P.; Wiedensohler, A.; Jung, J.S.; et al. Characteristics of aerosol size distributions and new particle formation in the summer in Beijing. J. Geophys. Res. 2009, 114, D00G12. [Google Scholar]
- Lin, Z.J.; Tao, J.; Chai, F.H.; Fan, S.J.; Yue, J.H.; Zhu, L.H.; Ho, K.F.; Zhang, R.J. Impact of relative humidity and particles number size distribution on aerosol light extinction in the urban area of Guangzhou. Atmos. Chem. Phys. 2013, 13, 1115–1128. [Google Scholar] [CrossRef]
- Wang, L.C.; Gong, W.; Ma, Y.Y.; Zhang, M. Modeling regional vegetation NPP variations and their relationships with climatic parameters in Wuhan, China. Earth Interact. 2003, 12, 1–20. [Google Scholar]
- Holben, B.N.; Tanre, D.; Smirnov, A.; Eck, T.F.; Slutsker, I.; Abuhassan, N.; Zibordi, G. An emerging ground-based aerosol climatology: Aerosol optical depth from AERONET. J. Geophys. Res. 2001, 106, 12067–12097. [Google Scholar] [CrossRef]
- Eck, T.F.; Holben, B.N.; Reid, J.S.; Dubovik, O.; Smirnov, A.; O’Neill, N.T.; Slutsker, I.; Kinne, S. Wavelength dependence of the optical depth of biomass burning, urban, and desert dust aerosols. J. Geophys. Res. 1999, 104, 31333–31349. [Google Scholar] [CrossRef]
- Che, H.Z.; Zhang, X.Y.; Chen, H.B.; Damiri, B.; Goloub, P.; Li, Z.Q.; Zhang, X.C.; Wei, Y.; Zhou, H.G.; Dong, F.; et al. Instrument calibration and aerosol optical depth validation of the China Aerosol Remote Sensing Network. J. Geophys. Res. 2009, 114, D03206. [Google Scholar]
- King, M.D.; Byrne, D.M.; Herman, B.M.; Reagan, J.A. Aerosol size distributions obtained by inversion of spectral optical depth measurements. J. Atmos. Sci. 1978, 22, 2153–2167. [Google Scholar]
© 2014 by the authors; licensee MDPI, Basel, Switzerland. This article is an open access article distributed under the terms and conditions of the Creative Commons Attribution license (http://creativecommons.org/licenses/by/3.0/).