A Study on the Use of a Statistical Analysis Model to Monitor Air Pollution Status in an Air Quality Total Quantity Control District


Abstract
:1. Introduction

| Pollutant | PM10 | SO2 | CO | O3 | NO2 |
|---|---|---|---|---|---|
| Statistics | 24-hour average | 24-hour average | Maximum 8-hour average within a 24-hour period | Maximum and minimum within a 24-hour period | Maximum and minimum within a 24-hour period |
| Unit | μg/m3 | ppb | ppm | ppb | ppb |
| PSI | |||||
| 50 | 50 | 30 | 4.5 | 60 | |
| 100 | 150 | 140 | 9 | 120 | |
| 200 | 350 | 300 | 15 | 200 | 600 |
| 300 | 420 | 600 | 30 | 400 | 1,200 |
| 400 | 500 | 800 | 40 | 500 | 1,600 |
| 500 | 600 | 1,000 | 50 | 600 | 2,000 |
2. Methodology
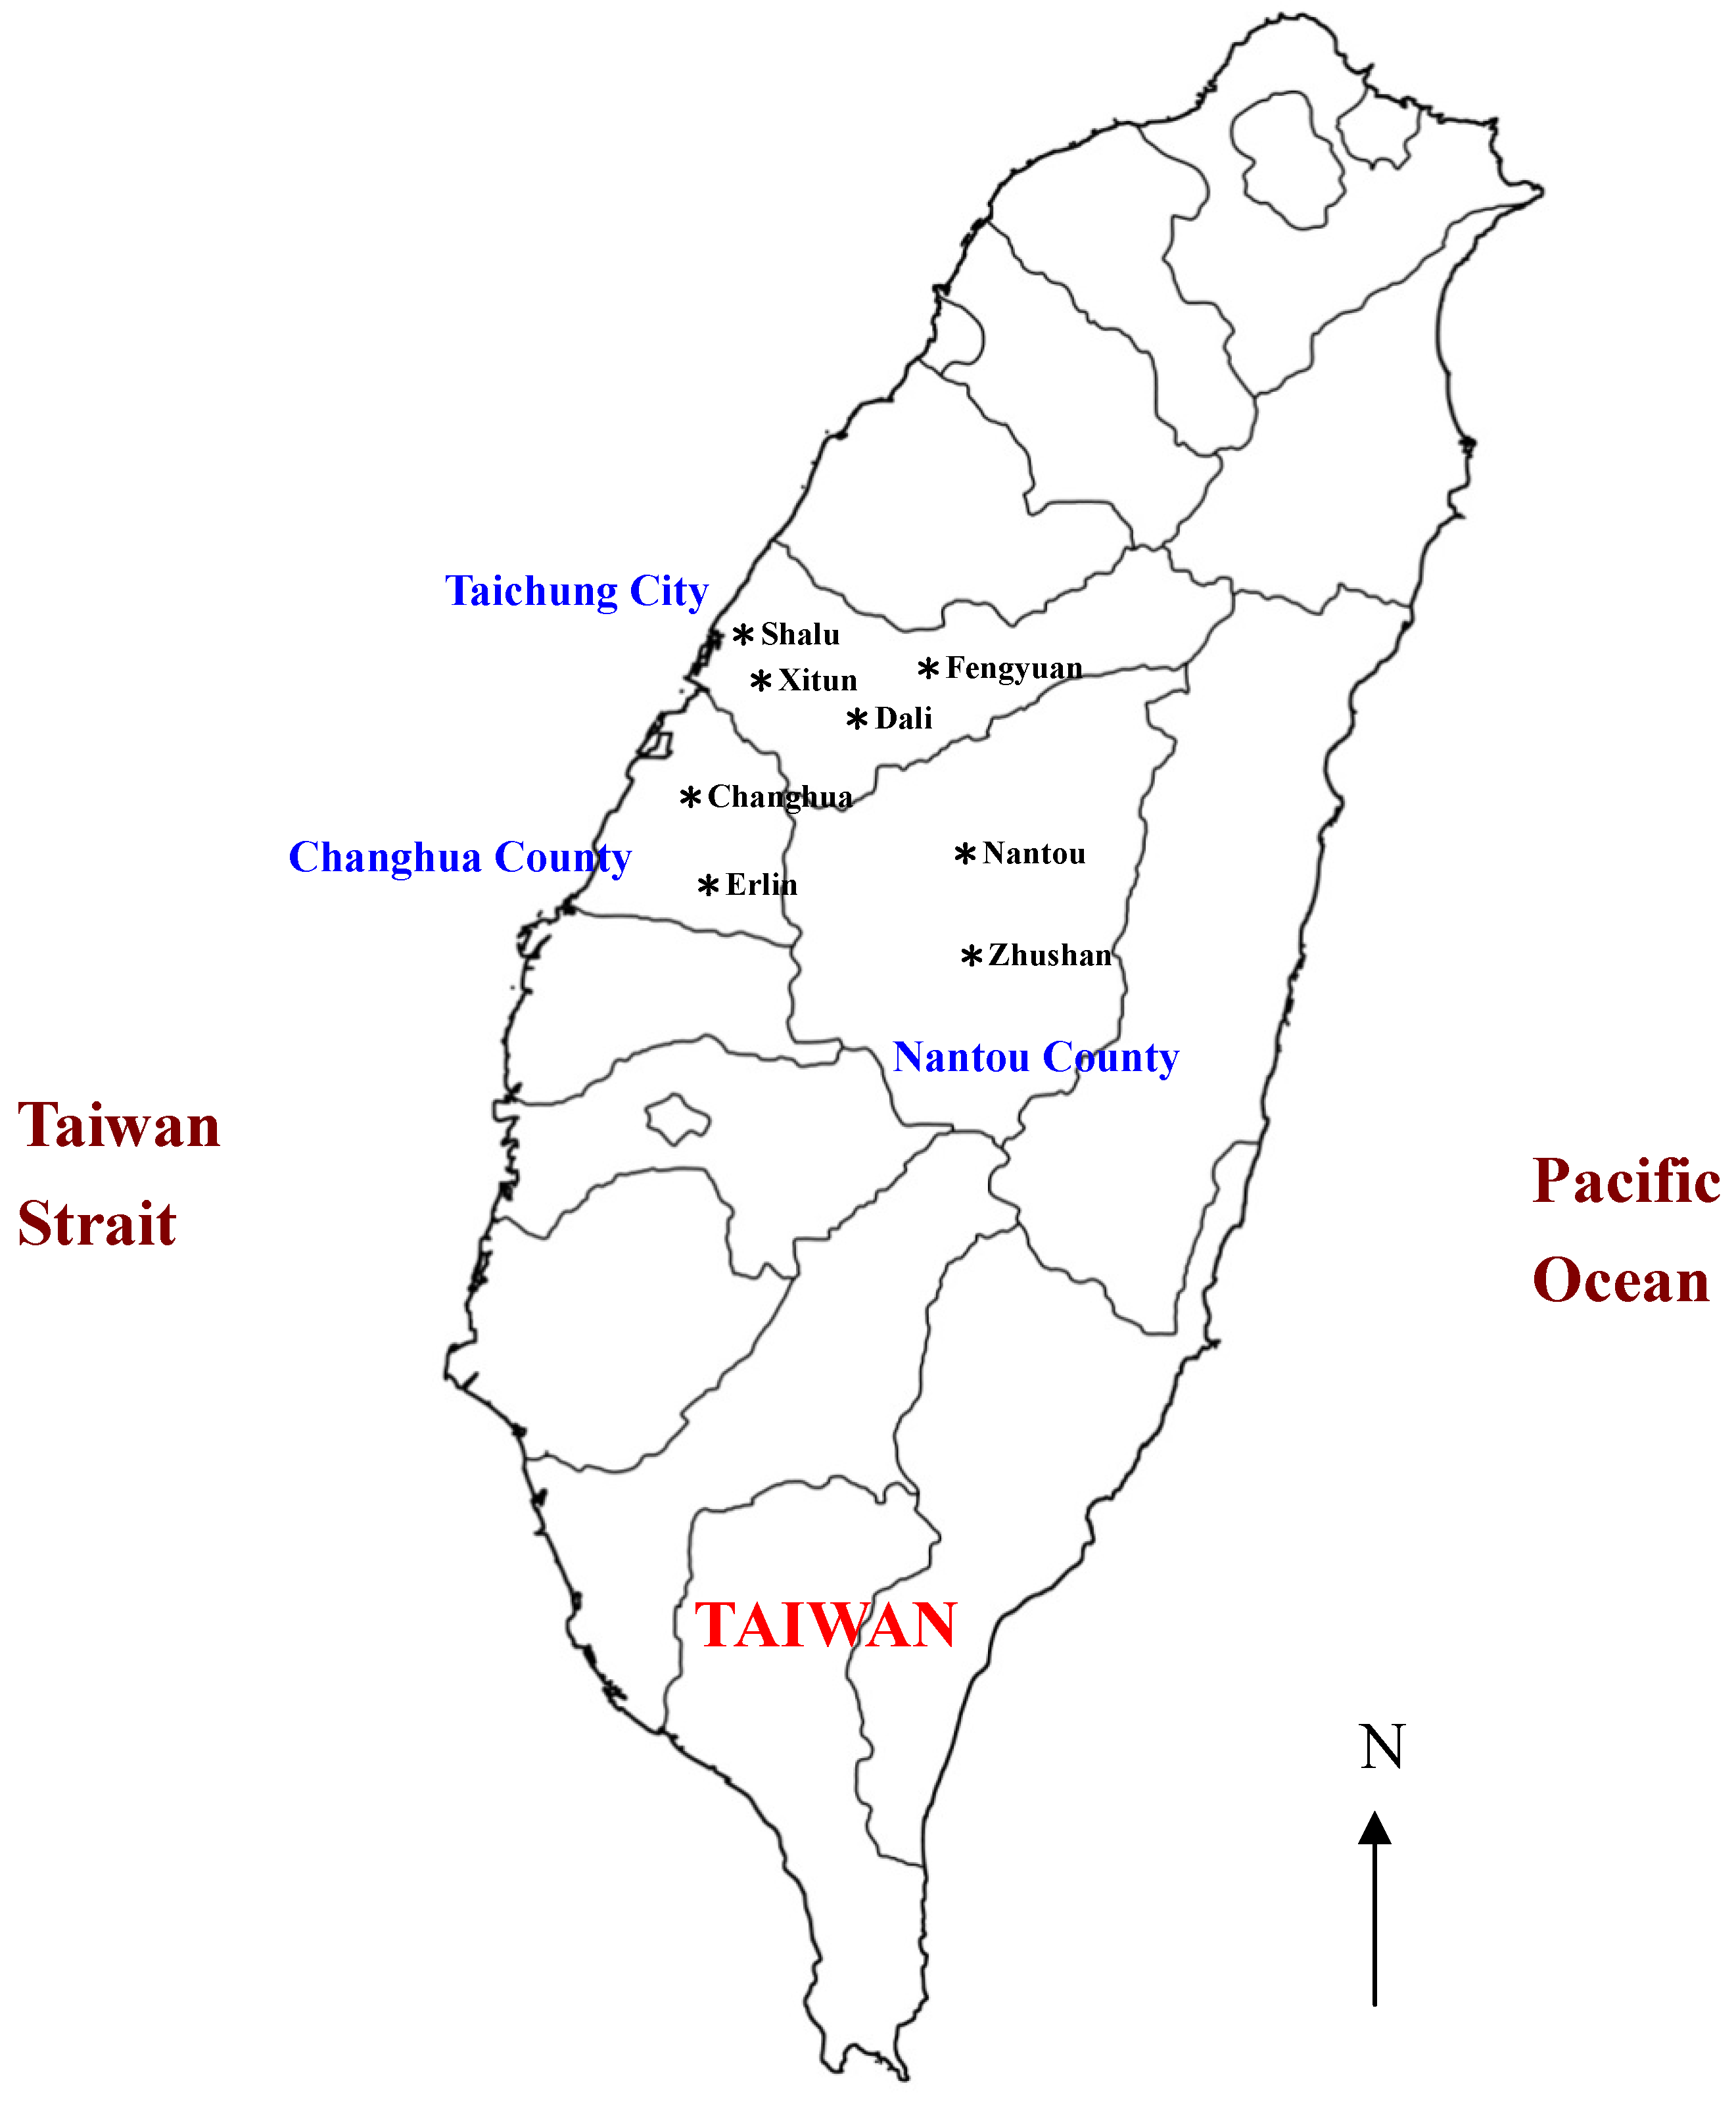
2.1. Selection of the Air Quality Monitoring Stations
2.2. Statistical Analyses—Factor Analysis
2.3. Cluster Analysis
2.4. Discriminant Analysis

3. Results and Discussion
3.1. Selection Time and Range of Monitoring Data
3.2. Results of the Factor Analysis
3.2.1. Selecting the Factor Analysis Results
| Components | Initial Eigenvalues | % of Total Variance | Cumulative Variance % |
|---|---|---|---|
| 1 | 1.837 | 27.931 | 27.931 |
| 2 | 1.522 | 22.563 | 50.494 |
| 3 | 1.013 | 15.718 | 66.212 |
| 4 | 0.945 | 10.750 | 76.962 |
| 5 | 0.750 | 9.807 | 86.769 |
| 6 | 0.578 | 7.114 | 93.883 |
| 7 | 0.287 | 6.117 | 100.000 |
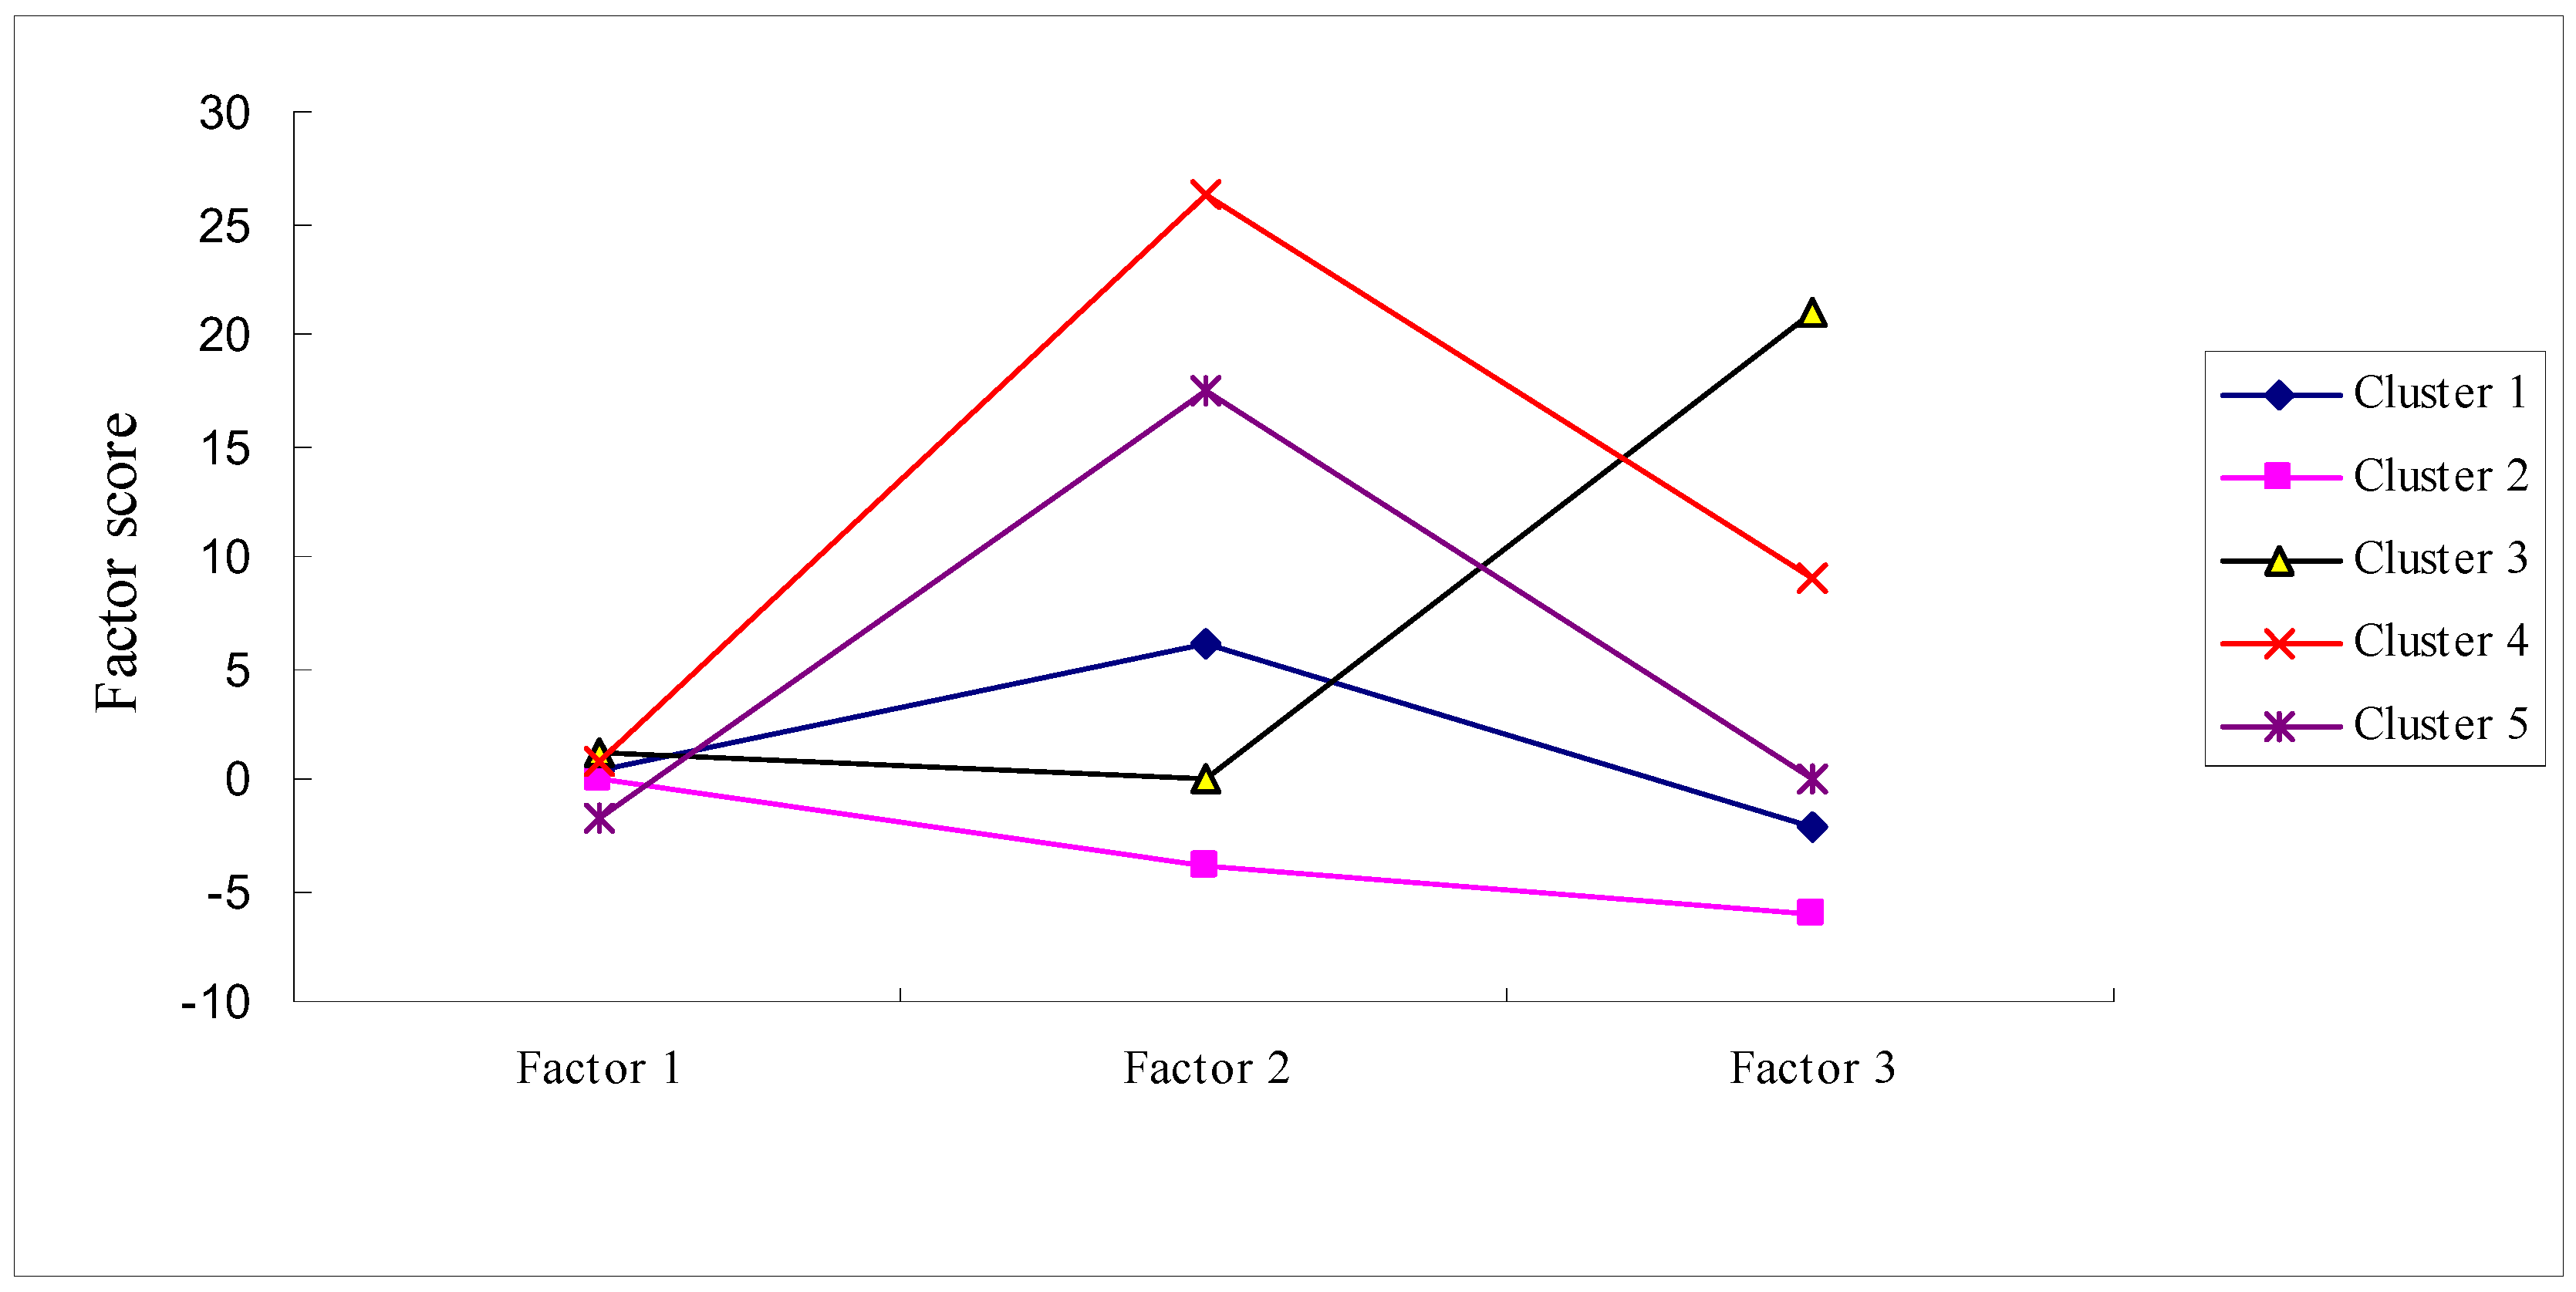
3.2.2. Determination of Factors
| Pollutants | Factors | ||
|---|---|---|---|
| 1 | 2 | 3 | |
| NMHC | 0.876 | −8.159E-02 | −7.255E-02 |
| THC | 0.807 | 0.146 | 0.466 |
| NO2 | 7.034E-02 | 0.866 | 4.625E-02 |
| PM10 | 9.265E-02 | 0.751 | −5.322E-03 |
| O3 | −4.046E-02 | 0.691 | 7.378E-02 |
| SO2 | 5.873E-02 | −0.139 | 0.872 |
| CO | −1.309E-02 | 0.232 | 0.754 |
Factor 1
Factor 2
Factor 3
3.3. Analysis of Air Pollution Characteristics—Cluster and Discriminant Analysis
3.3.1. Cluster 1
| Cluster | Cluster 1 | Cluster 2 | Cluster 3 | Cluster 4 | Cluster 5 |
|---|---|---|---|---|---|
| Number | |||||
| Item | |||||
| O3(ppb) | 34.87 | 23.89 | 42.34 | 37.16 | 165.91 |
| 5~74.9 | 0.15~92.45 | 7.07~89.71 | 1.46~98.64 | 93.50~398.35 | |
| NO2(ppb) | 422.14 | 38.28 | 48.40 | 74.69 | 56.81 |
| 264.5~497.9 | 0.15~212.05 | 0.65~97.92 | 0.81~236.90 | 15.16~117.23 | |
| PM10(μg/m3) | 98.97 | 78.36 | 107.99 | 167.03 | 125.91 |
| 48~157.3 | 1.02~136.12 | 45.36~217.05 | 99.54~458.18 | 59.46~230.51 | |
| SO2(ppb) | 20.74 | 19.32 | 102.27 | 27.88 | 19.79 |
| 7.59~35.38 | 0.2~88.55 | 48.62~324.90 | 2.69~100.39 | 6.04~38.82 | |
| CO(ppm) | 1.13 | 1.17 | 1.42 | 1.62 | 1.39 |
| 0.6~1.74 | 0.01~8.60 | 0.75~4.07 | 0.45~25.86 | 0.72~6.10 | |
| THC(ppb) | 2.18 | 2.02 | 2.09 | 2.22 | 2.06 |
| 1.32~2.94 | 0.6~6.64 | 1.23~3.35 | 0.68~3.86 | 1.06~3.03 | |
| NMHC(ppb) | 0.49 | 0.60 | 0.75 | 0.64 | 0.51 |
| 0.17~0.94 | 0.008~5.44 | 0.24~1.78 | 0.006~2.15 | 0.11~1.52 | |
| Air Quality Standards | Good ~ Unhealthful | Good ~ Meoderate | Moderate ~ Very Unhealthful | Moderate~ Hazardous | Moderate ~ Very Unhealthful |
| Daily Statistics | 12 | 305 | 37 | 236 | 20 |
3.3.2. Cluster 2
3.3.3. Cluster 3
3.3.4. Cluster 4
3.3.5. Cluster 5
3.3.6. Discriminant Analysis
| Discriminant Analyses | Cluster 1 | Cluster 2 | Cluster 3 | Cluster 4 | Cluster 5 | Discriminant Accuracy% | |
|---|---|---|---|---|---|---|---|
| Actual Cluster | |||||||
| Cluster 1 | 12 | 0 | 0 | 0 | 0 | 12/12*100 = 100 | |
| Cluster 2 | 0 | 285 | 7 | 13 | 0 | 285/305*100 = 93.44 | |
| Cluster 3 | 0 | 2 | 32 | 3 | 0 | 32/37*100 = 86.48 | |
| Cluster 4 | 1 | 2 | 3 | 230 | 0 | 230/236*100 = 97.45 | |
| Cluster 5 | 0 | 0 | 0 | 1 | 19 | 19/20*100 = 95.00 | |
| Total | 13 | 289 | 42 | 247 | 19 | 578/610*100 = 94.75 | |
4. Conclusion
Acknowledgments
Conflicts of Interest
References
- Shirodkar, P.V.; Mesquita, A.; Pradhan, U.K.; Verlekar, X.M.; Babu, M.T.; Vethamony, P. Factors controlling physico-chemical characteristics in the coastal waters off Mangalore—A multivariate approach. J. Environ. Res. 2009, 109, 245–257. [Google Scholar] [CrossRef]
- Stenberg, M.; Linusson, A.; Tysklind, M.; Andersson, P.L. A multivariate chemical map of industrial chemicals: Assessment of various protocols for identification of chemicals of potential concern. Chemosphere 2009, 76, 878–884. [Google Scholar] [CrossRef]
- Zhang, X.; Wang, Q.; Liu, Y.; Wu, J. Application of multivariate statistical techniques in the assessment of water quality in the Southwest New Territories and Kowloon, Hong Kong. Environ. Monit. Assess. 2011, 173, 17–27. [Google Scholar] [CrossRef]
- Martinez, M.A.; Caballero, P.; Carrillo, O.; Mendoza, A.; Mejia, G.M. Chemical characterization and factor analysis of PM2.5 in two sites of monterrey, Mexico. J. Air Waste Manag. Assoc. 2012, 62, 817–827. [Google Scholar] [CrossRef]
- Charlton, A.J.; Robb, P.; Donarski, A.J.; Godward, J. Non-targeted detection of chemical contamination in carbonated soft drinks using NMR spectroscopy, variable selection and chemometrics. Anal. Chim. Acta. 2008, 618, 196–203. [Google Scholar] [CrossRef]
- Tobiszewski, M.; Tsakovski, S.; Simeonov, V.; Namieśnik, J. Surface water quality assessment by the use of combination of multivariate statistical classification and expert information. Chemosphere 2010, 80, 740–746. [Google Scholar] [CrossRef]
- Liu, P.W.G. Establishment of a Box-Jenkins multivariate time-series model to simulate ground-level peak daily one-hour ozone concentrations at Ta-Liao in Taiwan. J. Air Waste Manag. Assoc. 2007, 57, 1064–1074. [Google Scholar]
- Pires, J.C.M.; Sousa, S.I.V.; Pereira, M.C.; Alvim-Ferraz, M.C.M.; Martins, F.G. Management of air quality monitoring using principal component and cluster analysis-part II: CO, NO2 and O3. Atmos. Environ. 2008, 42, 1261–1274. [Google Scholar]
- Yalcin, M.G.; Tumuklu, A.; Sonmez, M.; Erdag, D.S. Application of multivariate statistical approach to identify heavy metal sources in bottom soil of the Seyhan River (Adana), Turkey. Environ. Monit. Assess. 2010, 164, 311–322. [Google Scholar] [CrossRef]
- Murena, F. Measuring air quality over large urban areas: Development and application of an air pollution index at the urban area of Naples. Atmos. Environ. 2004, 38, 6195–6202. [Google Scholar] [CrossRef]
- EPA (Environmental Protection Agency). Measuring Air Quality. The Pollutant Standards Index; EPA 451/K-94–001; EPA: Research Triangle Park, NC, USA, 1994; p. 73. [Google Scholar]
- Cairncross, E.K.; John, J.; Zunckel, M. A Novel Air pollution index based on the relative risk of daily mortality Associated with Short-term Exposure to Common Air Pollutants. Atmos. Environ. 2007, 41, 8442–8454. [Google Scholar] [CrossRef]
- Cheng, W.; Chen, Y.; Zhang, J.; Lyons, T.J.; Pai, J.; Chang, S. Comparison of revised air quality index with the PSI and AQI indices. Sci. Total Environ. 1999, 382, 191–198. [Google Scholar]
- Collier, K.J. Linking multimetric and multivariate approaches to assess the ecological condition of streams. Environ. Monit. Assess. 2009, 157, 113–124. [Google Scholar] [CrossRef]
- Yang, Y.H.; Zhou, F.; Guo, H.C.; Sheng, H.; Liu, H.; Dao, X.; He, C.J. Analysis of spatial and temporal water pollution patterns in Lake Dianchi using multivariate statistical methods. Environ. Monit. Assess. 2010, 170, 407–416. [Google Scholar] [CrossRef]
- Arrebola, J.P.; Mutch, E.; Cuellar, M.; Quevedo, M.; Claure, E.; Mejía, L.M.; Fernández-Rodríguez, M.; Freire, C.; Olea, N.; Mercado, L.A. Factors influencing combined exposure to three indicator polychlorinated biphenyls in an adult cohort from Bolivia. J. Environ. Res. 2012, 116, 17–25. [Google Scholar] [CrossRef]
- Serpil, Y.K.; Semra, G.T. Source apportionment of atmospheric trace element deposition. Environ. Eng. Sci. 2008, 25, 1263–1271. [Google Scholar] [CrossRef]
- Ratola, N.; Amigo, J.M.; Alves, A. Comprehensive assessment of pine needles as bioindicators of PAHs using multivariate analysis. The importance of temporal trends. Chemosphere 2010, 81, 1517–1525. [Google Scholar] [CrossRef]
- Einax, J.W.; Truckenbrodt, D.; Kampe, O. River pollution data interpreted by means of chemometric methods. Microchem. J. 1998, 58, 315–324. [Google Scholar] [CrossRef]
- McKenna, J.E., Jr. An enhanced cluster analysis program with bootstrap significance testing for ecological community analysis. Environ. Model. Softw. 2003, 18, 205–220. [Google Scholar] [CrossRef]
- Vega, M.; Pardo, R.; Barrado, E.; Deban, L. Assessment of seasonal and polluting effects on the qualityof river water byex ploratory data analysis. Water Res. 1998, 32, 3581–3592. [Google Scholar] [CrossRef]
- Wunderlin, D.A.; Diaz, M.P.; Arne, M.V.; Pesce, S.F.; Hued, A.C.; Bistoni, M.A. Pattern recognition techniques for the evaluation of spatial and temporal variations in water quality: A case study: Suquia river basin (Cordoba-Argentina). Water Res. 2001, 35, 2881–2894. [Google Scholar] [CrossRef]
- Chang, S.C.; Lee, C.T. Secondary aerosol formation through photochemical reactions rstimated by using air quality monitoring data in Taipei city from 1994 to 2003. Atmos. Environ. 2007, 41, 4002–4017. [Google Scholar] [CrossRef]
- McElory, W.J.; Waygood, W.J. Oxidation of formaldehyde by the hydroxyl radical in aqueous solution. J. Chem. Soc. 1991, 87, 1513–1521. [Google Scholar]
- Chou, T.G. The Research of Air Quality Management in Fine Particulate Matters; (in Chinese). Academia Sinica Research Weekly 1276; Central Office of Administration: Taiwan, 2010. [Google Scholar]
- Chen, W.K.; Lee, C.T. The Establishment of Aerosol Control Mode Based on the Photochemical Reaction Mechanism; (in Chinese). NSC-1999-EPA-Z-231–001; National Science Council: Taiwan, 1999. [Google Scholar]
© 2013 by the authors; licensee MDPI, Basel, Switzerland. This article is an open access article distributed under the terms and conditions of the Creative Commons Attribution license (http://creativecommons.org/licenses/by/3.0/).
Share and Cite
Wu, E.M.-Y.; Kuo, S.-L. A Study on the Use of a Statistical Analysis Model to Monitor Air Pollution Status in an Air Quality Total Quantity Control District. Atmosphere 2013, 4, 349-364. https://doi.org/10.3390/atmos4040349
Wu EM-Y, Kuo S-L. A Study on the Use of a Statistical Analysis Model to Monitor Air Pollution Status in an Air Quality Total Quantity Control District. Atmosphere. 2013; 4(4):349-364. https://doi.org/10.3390/atmos4040349
Chicago/Turabian StyleWu, Edward Ming-Yang, and Shu-Lung Kuo. 2013. "A Study on the Use of a Statistical Analysis Model to Monitor Air Pollution Status in an Air Quality Total Quantity Control District" Atmosphere 4, no. 4: 349-364. https://doi.org/10.3390/atmos4040349
APA StyleWu, E. M.-Y., & Kuo, S.-L. (2013). A Study on the Use of a Statistical Analysis Model to Monitor Air Pollution Status in an Air Quality Total Quantity Control District. Atmosphere, 4(4), 349-364. https://doi.org/10.3390/atmos4040349