Article

Heat Impact of Urban Sprawl: How the Spatial Composition of Residential Suburbs Impacts Summer Air Temperatures and Thermal Comfort

by
Mahmuda Sharmin
1,2,*,
Manuel Esperon-Rodriguez
2,3,
Lauren Clackson
2,
Sebastian Pfautsch
4 and
Sally A. Power
2
1
Department of Forestry and Environmental Science, Shahjalal University of Science and Technology, Sylhet 3114, Bangladesh
2
Hawkesbury Institute for the Environment, Western Sydney University, Locked Bag 1797, Penrith, NSW 2751, Australia
3
School of Science, Western Sydney University, Locked Bag 1797, Penrith, NSW 2751, Australia
4
Urban Transformations Research Centre, Western Sydney University, Locked Bag 1797, Penrith, NSW 2751, Australia
*
Author to whom correspondence should be addressed.
Atmosphere 2025, 16(8), 899; https://doi.org/10.3390/atmos16080899
Submission received: 26 May 2025 / Revised: 11 July 2025 / Accepted: 18 July 2025 / Published: 23 July 2025
(This article belongs to the Section Biometeorology and Bioclimatology)

Abstract

Urban residential design influences local microclimates and human thermal comfort. This study combines empirical microclimate data with remotely sensed data on tree canopy cover, housing lot size, surface permeability, and roof colour to examine thermal differences between three newly built and three established residential suburbs in Western Sydney, Australia. Established areas featured larger housing lots and mature street trees, while newly developed suburbs had smaller lots and limited vegetation cover. Microclimate data were collected during summer 2021 under both heatwave and non-heatwave conditions in full sun, measuring air temperature, relative humidity, wind speed, and wet-bulb globe temperature (WBGT) as an index of heat stress. Daily maximum air temperatures reached 42.7 °C in new suburbs, compared to 39.3 °C in established ones (p < 0.001). WBGT levels during heatwaves were in the “extreme caution” category in new suburbs, while remaining in the “caution” range in established ones. These findings highlight the benefits of larger green spaces, permeable surfaces, and lighter roof colours in the context of urban heat exposure. Maintaining mature trees and avoiding dark roofs can significantly reduce summer heat and improve outdoor thermal comfort across a range of conditions. Results of this work can inform bottom-up approaches to climate-responsive urban design where informed homeowners can influence development outcomes.

1. Introduction

Over recent decades, climate change has increasingly shaped urban environments, particularly through its impact on temperature regimes and the frequency of extreme heat events [1,2]. Average global temperatures have risen by approximately 1.1 °C above pre-industrial levels [3] and climate projections suggest that this warming trend will intensify, especially in already hot regions such as Australia [4,5]. This climatic shift demands urgent attention to the quality of urban living environments. Cities act as heat traps due to the urban heat island (UHI) effect, where built-up areas experience significantly higher temperatures than surrounding rural regions [6,7]. The UHI is exacerbated by widespread cover of impervious surfaces, reduced vegetation, high building density, and anthropogenic heat emissions [8]. The global trend of increasing urbanization is set to continue [9], with the United Nations projecting that 68% of the world’s population will reside in urban areas by 2050 [10]. As cities grow, more people will be exposed to the combined risks that threaten human thermal comfort, public health, and overall urban livability.
Urban thermal comfort—i.e., the state of physical and psychological satisfaction with the surrounding thermal environment—is a critical factor in designing sustainable and resilient cities [11,12]. Outdoor thermal comfort, in particular, is influenced by the interaction of climatic parameters (e.g., solar radiation, wind, humidity), physiological factors, and urban morphology [11,13]. The presence of green infrastructure— including trees, shrubs, lawns and green roofs—can lower surface and air temperatures through shading and evapotranspiration [14,15]. Moreover, urban configuration influences wind flow and heat accumulation, which are key parameters for human thermal regulation [16]. In cities with hot climates, shade provision, vegetation cover, modifying albedo and ventilation corridors can enhance outdoor thermal comfort [17,18]. Therefore, creating thermally comfortable urban spaces requires careful integration of urban design, landscape planning, and climate-sensitive urban configuration.
Studies have found that the amount of tree canopy in a neighborhood can significantly influence local microclimates [19,20]. For instance, tree shade can reduce land surface temperatures by up to 29 °C during peak summer days [21]. Another contributing factor to diminished thermal comfort is the widespread use of heat-absorbing materials [22]. In many newly developed urban suburbs around the world, rooftops, pavements and roads are commonly constructed using dark, impervious materials with high thermal inertia [23]. These materials absorb solar radiation during the day and release it slowly at night, prolonging heat exposure and impeding nocturnal cooling. The thermal mass of such materials, combined with limited vegetation and poor ventilation, can push outdoor temperatures beyond human tolerance thresholds, particularly during heatwaves. Physiologically, exposure to ambient temperatures above 37 °C overwhelms the body’s natural cooling mechanisms, leading to dehydration, increased heart rate, and a higher risk of heat-related illnesses [24,25].
Despite the scientific evidence, many cities continue to expand without adequate consideration of thermal resilience. Western Sydney, Australia, is a region that exemplifies the challenges of balancing rapid urban development with climate adaptation. Since 1910, Australia has warmed by 1.4 °C, and Western Sydney has become particularly prone to frequent and intense heatwaves [26]—defined as five consecutive days with temperatures exceeding 35 °C [27,28,29]. These climatic conditions make the region a valuable testbed for studying how urban design affects human thermal comfort.
Western Sydney is undergoing one of the fastest urban expansions in Australia, driven by high levels of immigration and internal population growth [30]. Australia’s population is projected to reach 39 million by 2060, with Greater Sydney accommodating much of this growth [31]. Around 550,000 new homes are needed to be built in Sydney by 2041 [32], raising concerns about the climate resilience of such developments. While this expansion is necessary to ensure housing availability, it also raises important questions about the long-term livability and climate adaptability of these emerging residential landscapes [33,34]. The denser new developments prioritize useable floor space over thermal performance. Recent data from the Australian Bureau of Statistics [35] reveal that the average lot size in Greater Sydney has decreased by 18% from 2012 to 2021, and private yard space has dropped to as little as 20–35% of the lot, with only 10–25% being pervious surface. As a result, there has been a 30% decline in residential tree cover over the past decade, contributing to the formation of “hot suburbs” [34]. Without intervention, this trend could create pockets of thermal inequity where certain populations—especially low-income families—are disproportionately exposed to heat stress [36,37].
The present study aims to compare outdoor thermal comfort during heatwave and non-heatwave conditions in established and newly developed suburbs in Western Sydney. We hypothesize that human thermal comfort is significantly lower in newly residential areas than in established areas, especially during heatwave events. This is primarily attributed to low tree canopy coverage and increased prevalence of impervious surfaces in new housing developments, relative to established areas.

2. Materials and Methods
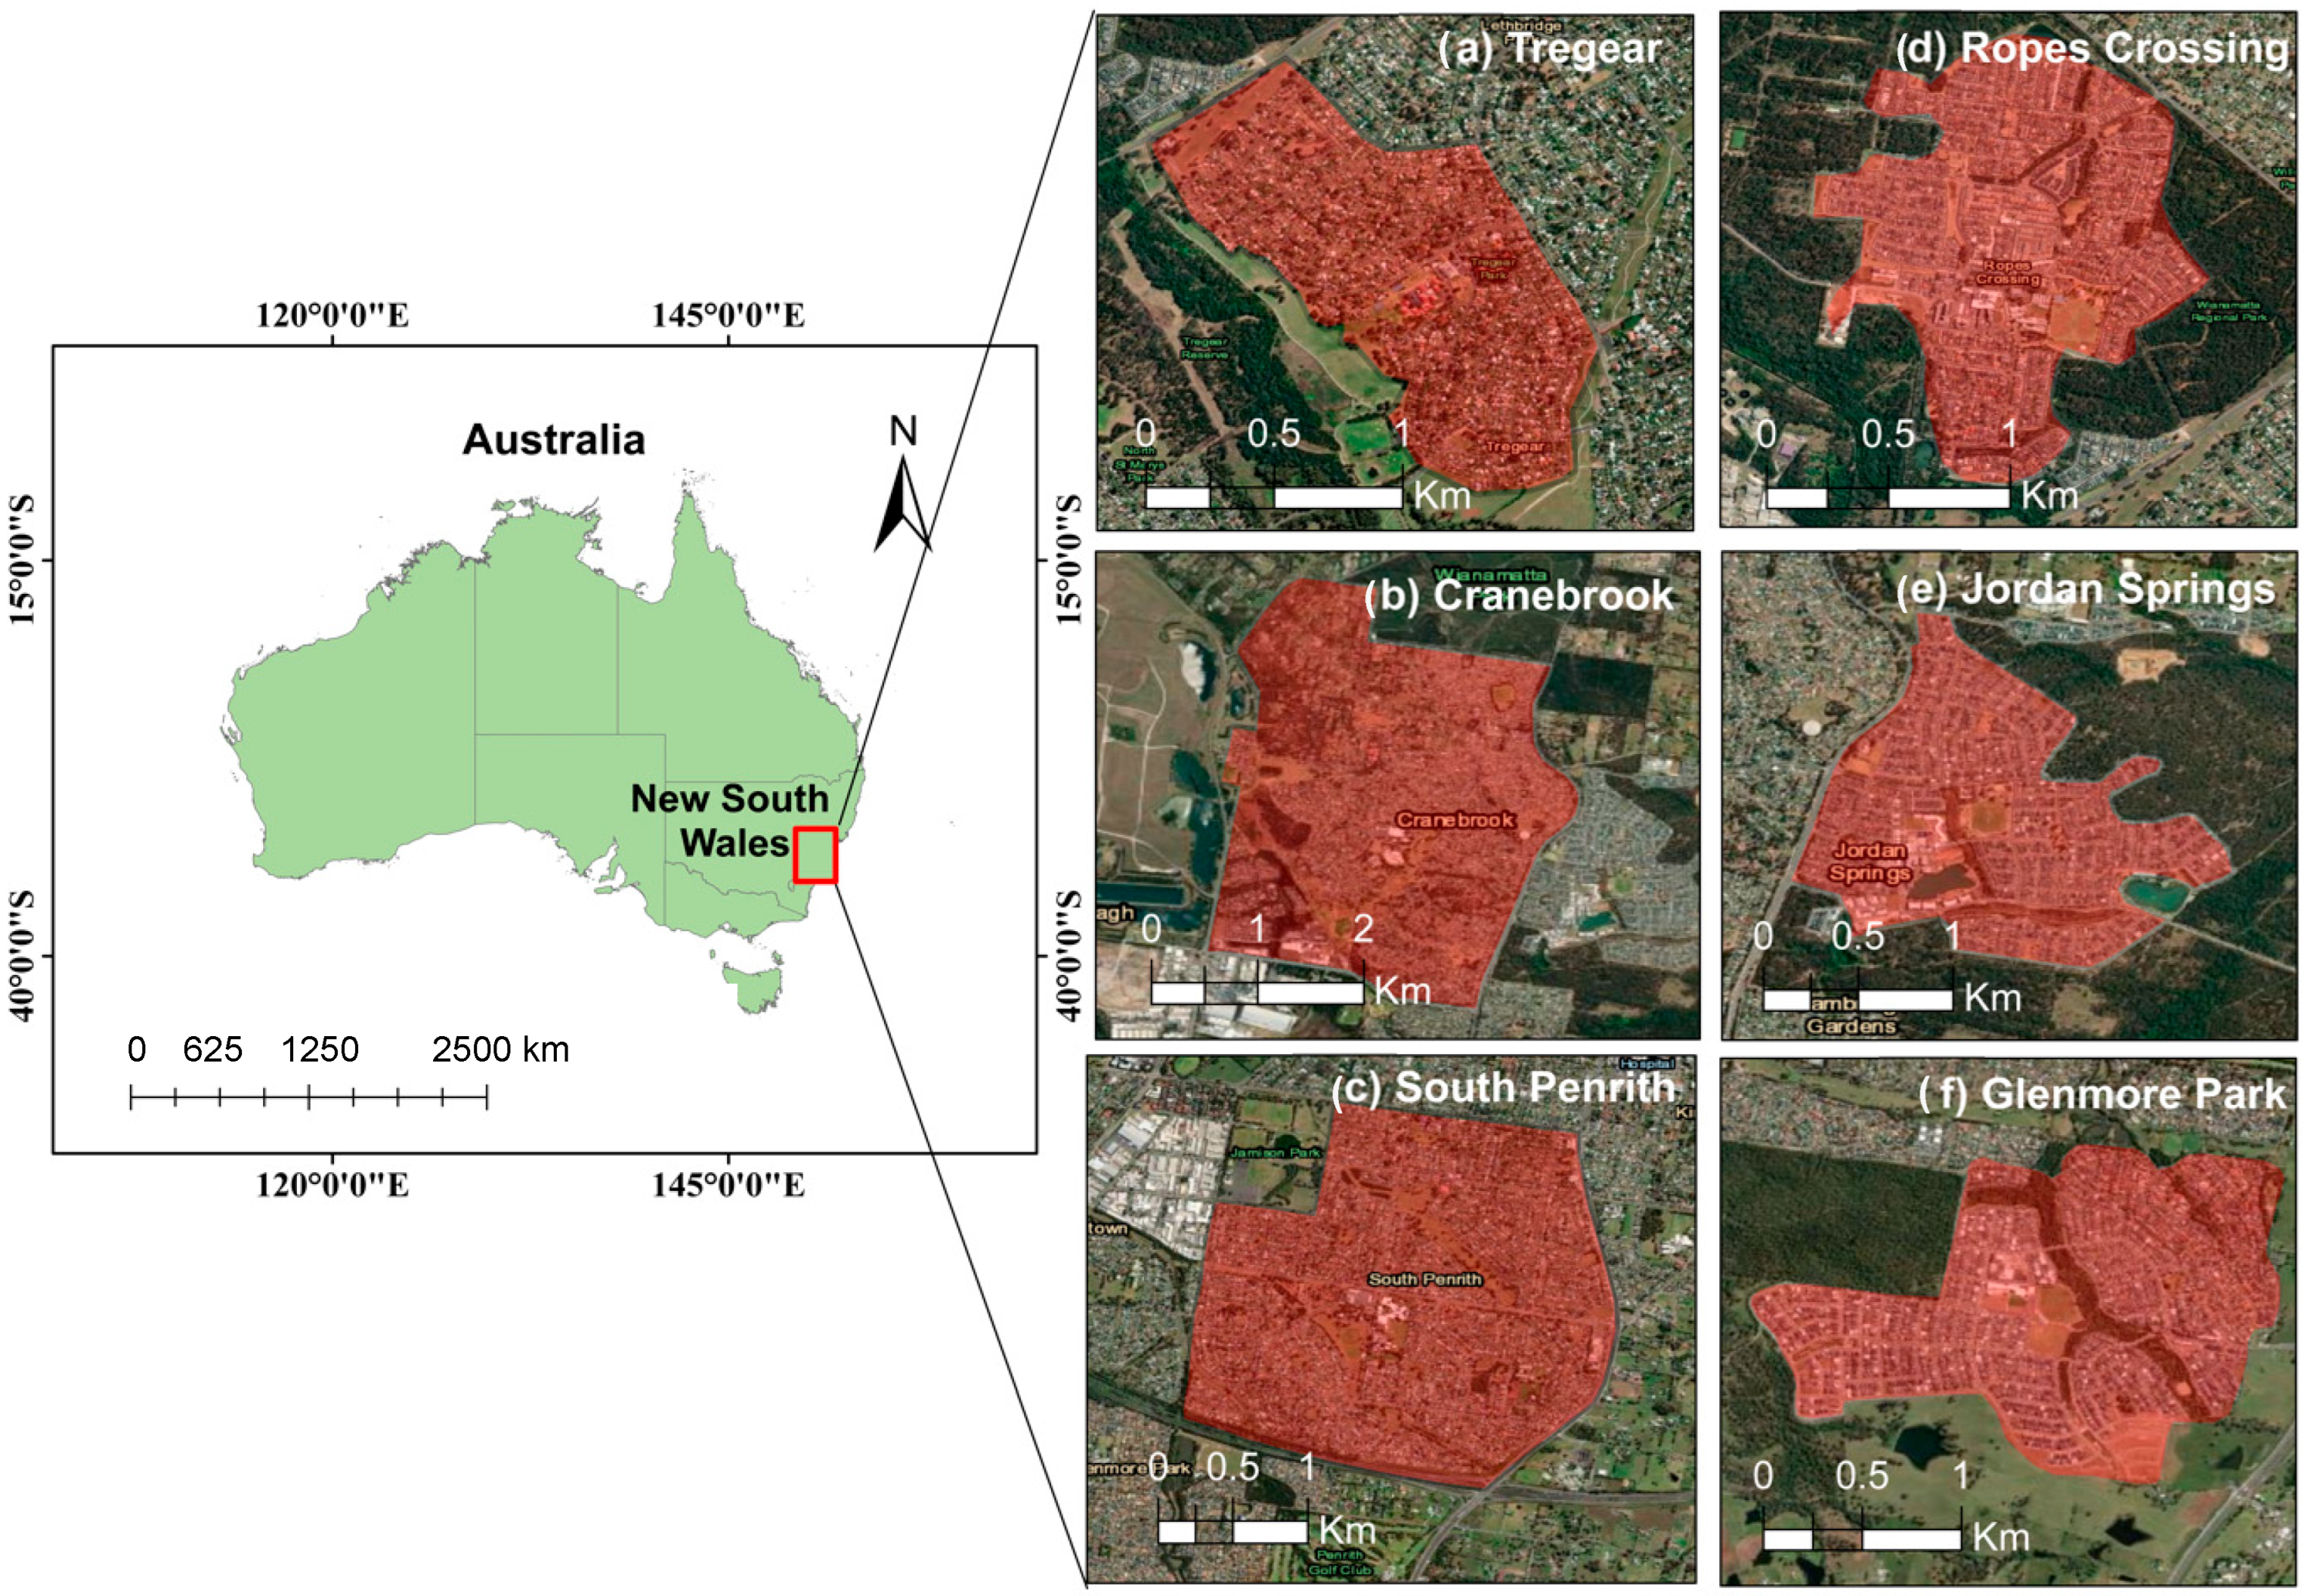
2.1. Study Area

This study took place in six suburbs of two local government areas (LGAs) in Western Sydney, New South Wales (NSW), Australia. LGAs comprise suburbs, towns, municipalities, regions, shires and districts that are managed as a unit to the extent permitted by local legislation [38]. The estimated population of Western Sydney is approximately 2.6 million residents and the region covers approximately 9000 km2 and extends 90 km N-S and 60 km E-W. This study focused on the LGAs of Blacktown and Penrith. According to 2021 census data, 397,000 residents lived in Blacktown and 218,000 in Penrith [39]. By 2036, the region is projected to have a population of 3.2 million [40].
The region represents a study site where the issue of extreme heat and thermal comfort has been flagged by several studies [8,26,41]. The summer climate of Western Sydney is sub-tropical and characterized by hot air temperatures during the austral summer from November to February, with January being the warmest month. During summer, winds come from the desert, bringing hot and dry air to the region [42]. Penrith has an annual mean maximum temperature of 26.6 °C, mean minimum temperature of 12.4 °C and a mean annual rainfall of 734 mm (average between 1995–2020 Bureau of Meteorology, www.bom.gov.au, accessed on 17 June 2024). On 4 January 2020, Penrith experienced a record-breaking temperature of 48.9 °C, making it the hottest place on Earth that day [43]. Blacktown has an annual mean maximum temperature of 23.3 °C, a mean minimum temperature of 12.3 °C and mean annual rainfall of 926 mm (average between 1990–2020 Bureau of Meteorology, www.bom.gov.au, accessed on 23 June 2024).
This study focused on low-density residential zones, excluding city centers, industrial areas, and agricultural land. Residential suburbs developed prior to 1990 were classified as “established,” while those built post-1990 were designated as “new”. In recent years, residential areas across Blacktown and Penrith have expanded as new housing developments have emerged to accommodate NSW’s growing population [32]. Three pairs of residential areas were chosen for this study —two pairs in Penrith and one pair in Blacktown (Figure 1; Table 1). These six study areas are located within a 14 km radius, with each “established-new” pair situated less than 3 km apart. This selection ensured that all sites experienced similar climates and were influenced by the same regional environmental conditions, minimizing variability due to broader geographic or climatic differences.

2.2. Data Collection

2.2.1. Micrometeorological Measurements

Our study took place during the 2020–2021 austral summer. Microclimatic data—air temperature and a measurement of human thermal comfort—were collected in two phases. In the first phase, data were collected from 23 to 25 January 2021, during a five-day long heatwave (days 2–4 of heatwave) with daily maximum air temperatures above 35 °C (www.bom.gov.au). In the second phase, data were collected on 4 March and 10 and 15 April 2021, with maximum daily temperatures of 29.7, 24.1 and 26.9 °C, respectively (www.bom.gov.au) (Table 2).
Two Kestrel 5400 heat stress trackers were used to measure the meteorological variables of air temperature (°C), wind speed (m/s), relative humidity (%) and wet bulb globe temperature (WBGT), to derive heat stress index that integrates air temperature, humidity, wind speed, and solar radiation as an estimate of thermal strain on the human body, particularly during outdoor exposure. The Kestrel 5400 was calibrated in the field before measurements of each day; two meter readings were taken, with an accuracy within 0.2 °C. The Kestrel 5400 instruments include dry bulb (range −40–100 °C; Accuracy ±1.4 °C), wet bulb (4–80 °C; ±0.7) and 1-inch diameter globe temperature (−30–120 °C; ±0.1) probes, as well as sensors for humidity (1–90%; ±2) and wind speed (0–50 m/s; larger of 3% of reading). Extreme heat conditions were defined as days where forecast maximum temperatures (for five consecutive days) were exceeding 35 °C, accompanied by clear skies and low wind speeds. For non-heatwave conditions—where the maximum daily temperature remained below 35 °C, or exceeded 35 °C for fewer than five consecutive days, data were collected on randomly selected days characterized by clear skies and low wind speeds.
Microclimatic data were collected at all six study sites, with five sampling locations purposefully selected along streets within each suburb (Figure 2). In the newly developed suburbs, the landscape was relatively homogeneous in terms of built form and land cover, which resulted in less spatial dispersion of sampling points. In contrast, the established areas exhibited greater variability in structure and vegetation, allowing for a more dispersed sampling layout, as seen in Figure 2c. Measurements were conducted under full sun exposure at a standardized height of 1.5 m above ground level. On five of the six days of data collection, measurements were taken over a four-hour period, while on 4 March, data collection extended to five hours. For each measurement point, five readings were recorded, resulting in 25 records per hour per suburb. This yielded a total of 200 measurements per day and 250 measurements on March 4 across both the established and newly developed suburbs.
To maintain uniformity in environmental conditions and minimize temporal variation, all sampling points within each site were positioned in close proximity, enabling data collection to be completed within a short timeframe. Two trained data collectors simultaneously recorded microclimatic variables for each pair of residential areas. Prior to data logging at each site, both heat stress trackers underwent a five-minute equilibration period to ensure sensor stability. At the beginning of each hour—typically within the first 15 min—a minimum of five readings were obtained at each sampling location.

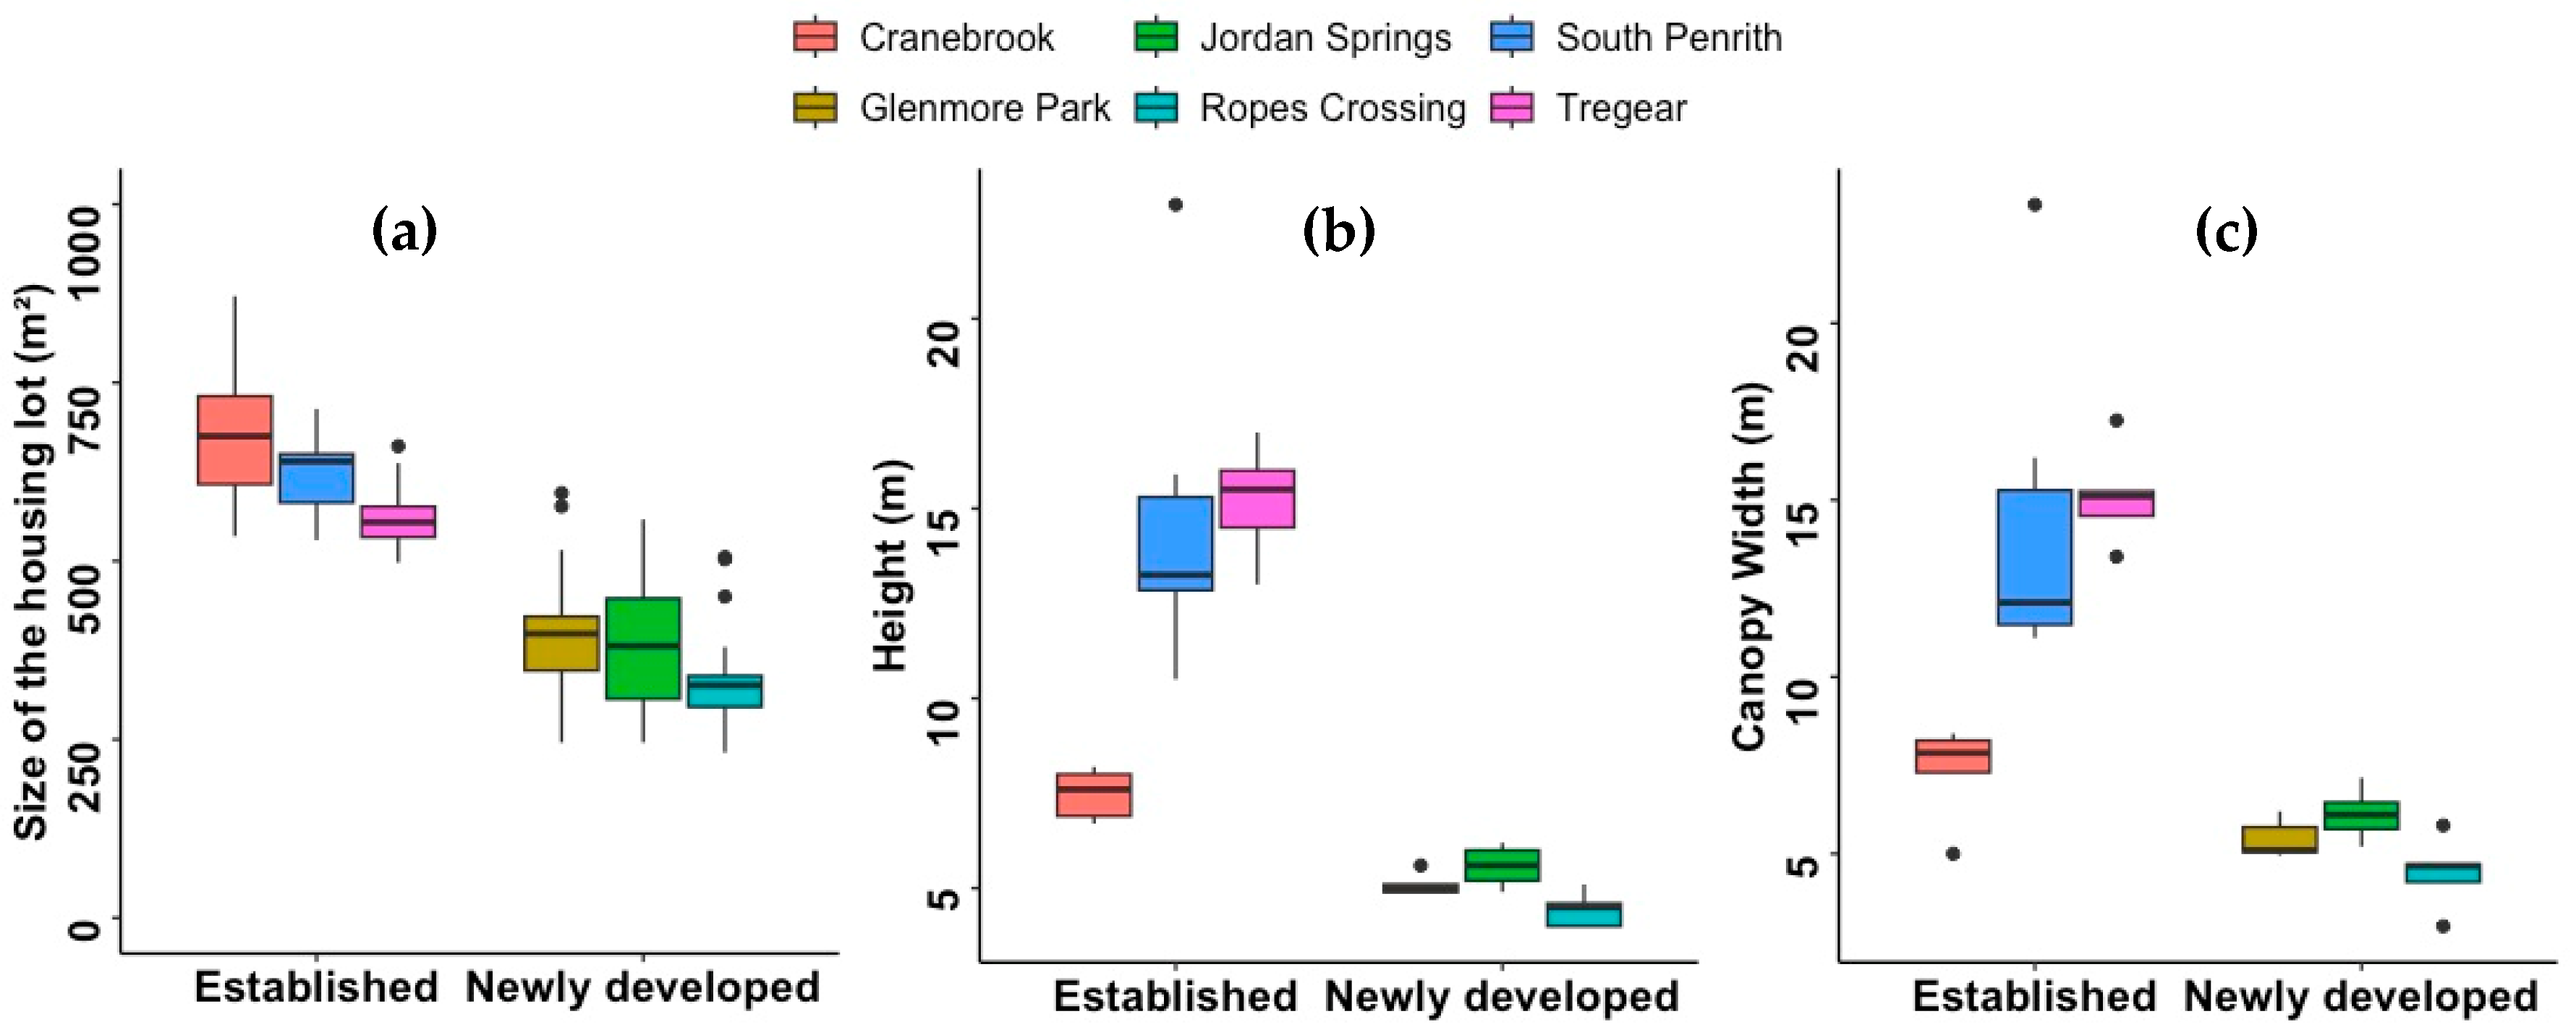
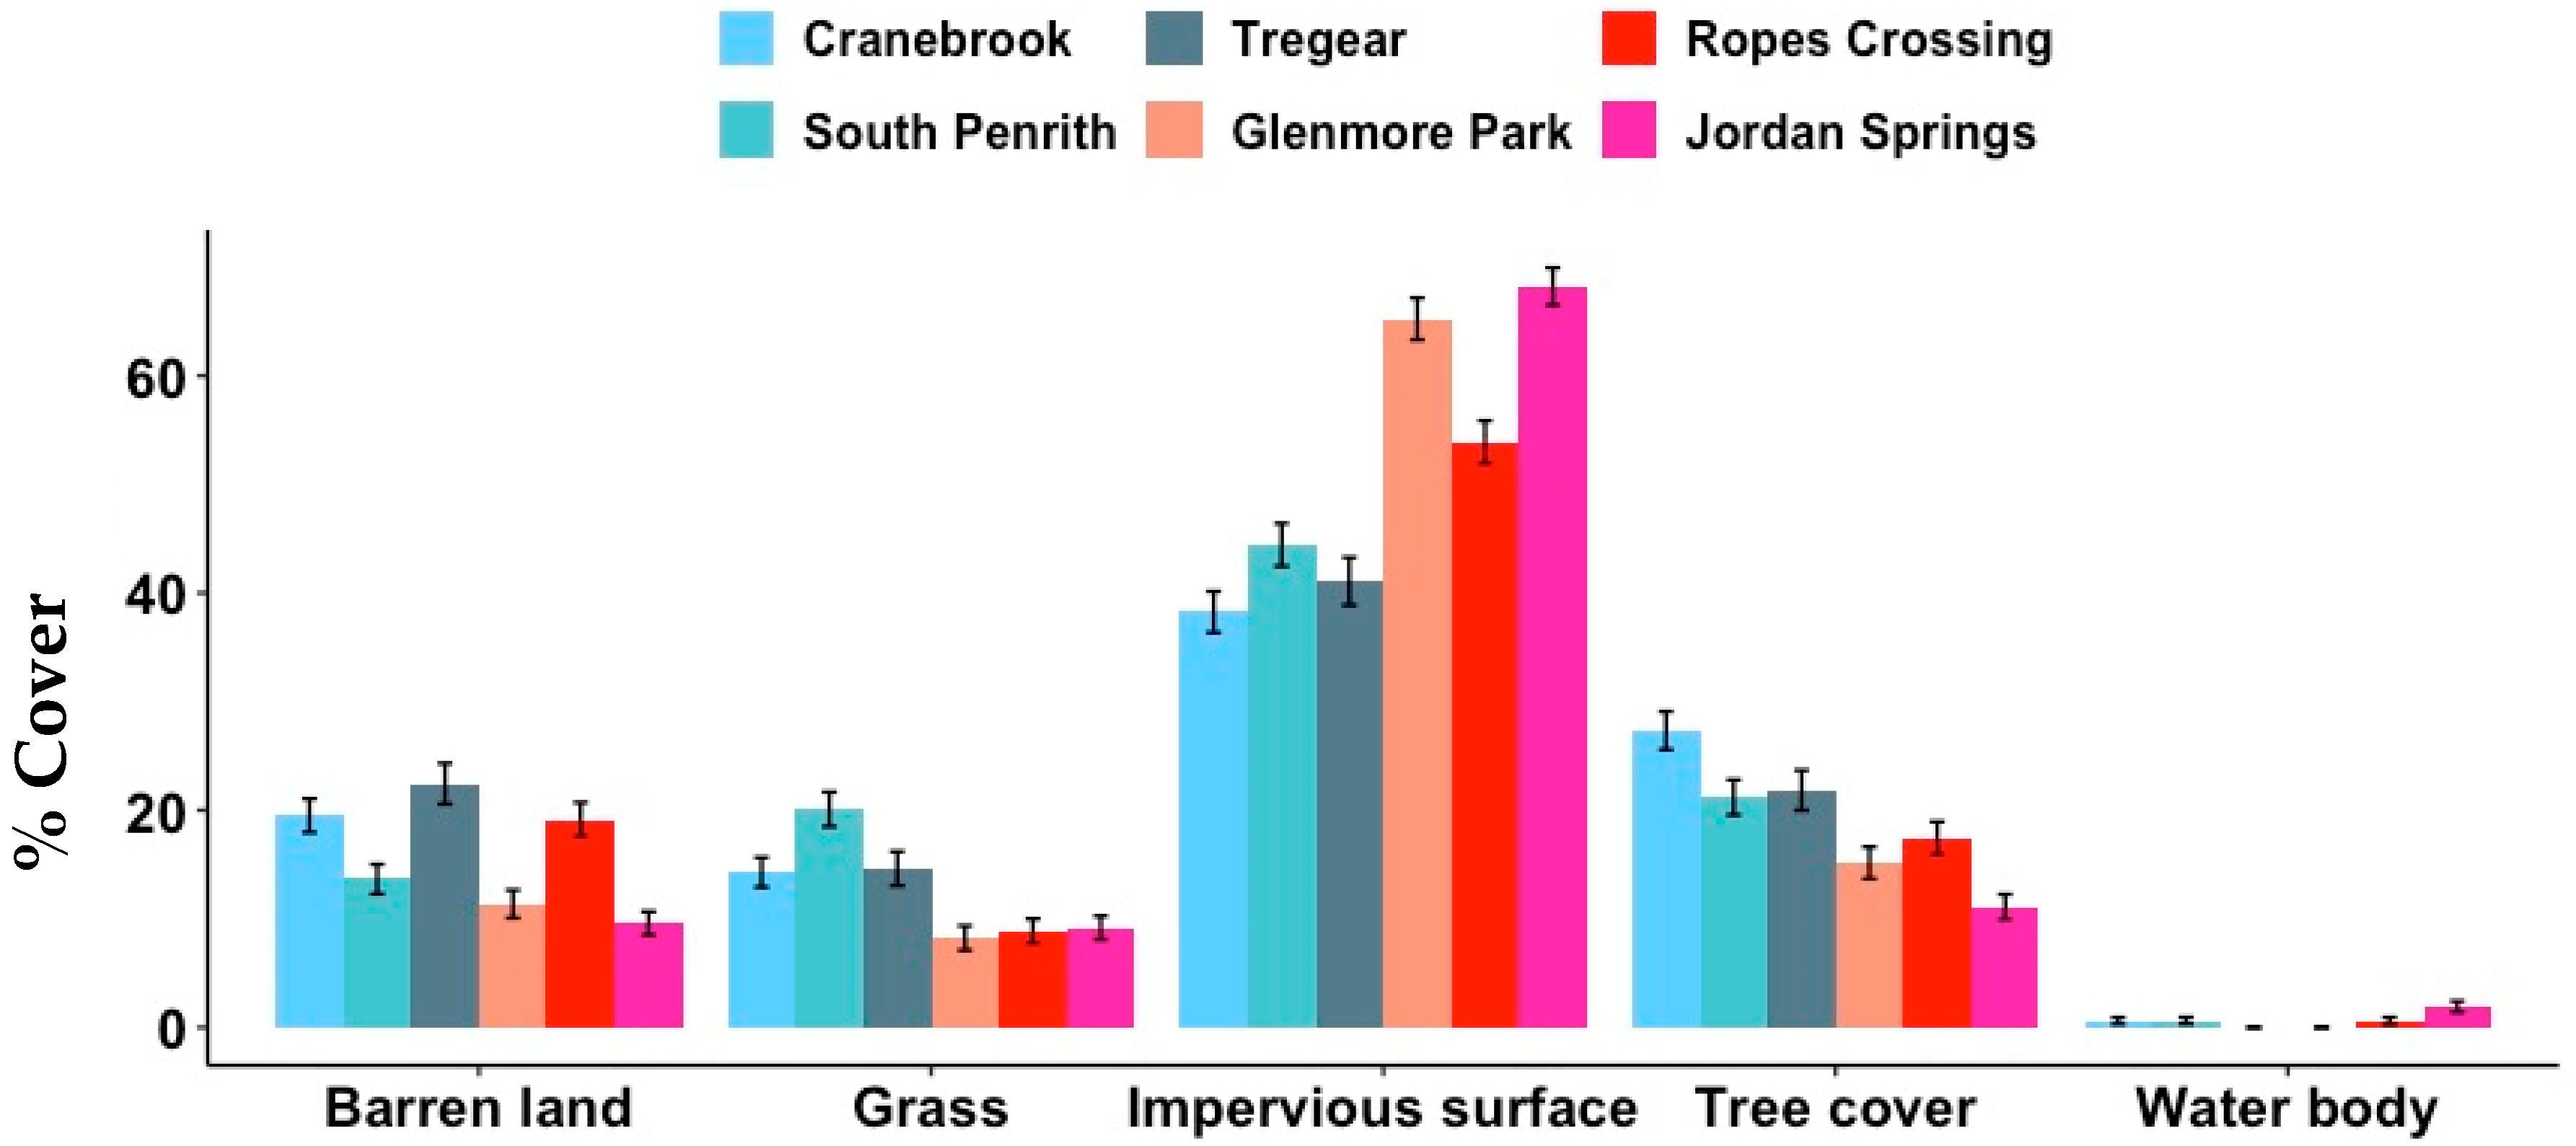
2.2.2. Tree Canopy Cover and Size of the Housing Lots

At each measurement point within the six residential suburbs, nearby trees were identified to species level. A Haglöf laser meter (L400, Haglöf Sweden AB, Långsele, Sweden) with a height resolution of 0.1 m, angle resolution of 0.1 and accuracy of 0.1 was used to measure height. Crown width measurements were taken as the length of x and y orthogonal axes from edge to edge for the widest and narrowest points through the crown center and then averaged.
The percentage of tree canopy cover and area of impervious surfaces were estimated using i-Tree Canopy, which was developed by the USDA Forest Service (itreetools.org). Due to its simplicity and minimal data requirements, this method has been widely adopted internationally [44,45,46]. It involves manually classifying randomly sampled points as either ‘tree’ or ‘non-tree’ to estimate the tree canopy within a defined area. The precision of this estimation is quantified using the standard error (SE), which indicates the level of uncertainty in the tree canopy measurement. The SE decreases as the number of random sample points increases, enhancing the accuracy of the estimation [47]. For consistency, images from summer 2022 were used to classify the study areas into five categories—barren land (areas that lack vegetation cover), grass, tree cover, impervious surface and water body. At least 500 sample points were taken through interpretation of satellite images in Google Maps to improve the precision required in the estimation of area. The i-Tree Canopy tool calculates the statistical estimates (as a percentage) of the area. It divides the number of points hitting the cover class by the total number of points analyzed among all cover classes. The standard error (ES) of the estimate is calculated as [48]:
E S = p q N
where p is the proportion of positive samples (e.g., points falling on tree canopy), q is 1 − p, points not falling on tree canopy) and N is the total number of samples or points assessed. In this study, we used the web-based i-Tree Canopy tool V7.1 (canopy.itreetools.org).
Average size of the housing lots for each residential area was estimated using imagery from New South Wales’s Spatial Digital Twin (SDT), Explorer (spatial.nsw.gov.au). Images of SDT Explorer undergo spherical correction and orthorectification to produce accurate orthomosaics, removing distortions from terrain and lens effects (spatial.nsw.gov.au). Measurement accuracy was within ±2.5 m 95% confidence level, with an RMSEr of 1.73 m on bare open ground. Georeferencing was based on precise GPS coordinates and projections such as GDA94 to ensure high spatial accuracy. Using the property boundary layer explorer, the sizes of 50 housing lots near the sampling points were measured for each residential area to estimate the average lot size.

2.2.3. Thermal Comfort Measurement

We chose to use WBGT to express human thermal comfort conditions in the residential areas and Kestrel 5400 provides the calculated value of the index. The WBGT is a commonly used index across the literature for predicting human thermal comfort in urban environments [49,50]. The Kestrel estimated WBGT has been tested previously and showed a high degree of accuracy [51]. WBGT in external environments is calculated by
W B G T = 0.7 × T w + 0.2 × T g + 0.1 × T a
where Tw, Tg and Ta represent the wet bulb temperature, black globe temperature and dry bulb temperature, respectively. These variables allow for consideration of air temperature, humidity, wind speed and solar radiation [52]. WBGT has five categories of heat stress for individuals who have not been acclimatized by training in the heat for a minimum period of 3 weeks, namely (1) Safe (<27.8 °C); (2) Caution (27.9–30.5 °C); (3) Extreme caution (30.6–32.2 °C); (4) Danger (32.3–33.3 °C) and (5) Extreme Danger (>33.4 °C) [53,54]. The WBGT index is comprehensive compared to other more common measurements such as the Heat Index, that solely relies on temperature and relative humidity [55]. The mean radiant temperature (°C, Tmrt) was calculated using the globe temperature and wind speed according to the equation [56]:
T m r t = T g + 273.15 4 + 1.10 × 10 8 × V a 0.6 ε g × D 0.4 T g T a 1 / 4 273.15 1 + x n
where Tg is the globe temperature (°C), Ta is the air temperature (°C), V is the wind speed (ms−1), ε is the globe emissivity (0.95), and D is the globe diameter (mm). The empirically derived parameter (1.1 × 10⁸) and the wind exponent (Va0.6) together represent the globe’s mean convection coefficient (1.1 × 10⁸ × Va0.6).

2.3. Data Analysis

To examine the differences in physical characteristics between established and newly developed residential areas under both heatwave and non-heatwave conditions, t-tests were conducted on building density, land cover types, tree height and canopy width. The normality of the data was assessed using the Shapiro-Wilk test. Additionally, non-parametric Kruskal-Wallis test were used to compare meteorological variables—including air temperature (Ta), relative humidity (RH), wind speed, and mean radiant temperature (Tmrt)—between established and newly developed residential areas during both heatwave and non-heatwave days. All analyses were evaluated at a 95% confidence interval with a significance level of p < 0.05. To calculate effect sizes, eta squared (η2) was used to complement p-values. Effect sizes were categorized as small (0.01–<0.06), moderate (0.06–<0.14), and large (≥0.14). Data processing and analysis was carried out using RStudio, with R version 4.2.0.

3. Results

We found that housing lot sizes were smaller in all three new residential areas (t = 28.47; p < 0.001) than in the established ones (Table 3; Figure 3). Among the established areas, Cranebrook had the largest average housing plot size at 672.31 ± 92.1 m2, while Ropes Crossing had the smallest at 327.38 ± 54 m2. Street trees within the established suburbs were mainly composed of large, mature trees. In South Penrith these included Liquidambar styraciflua and Corymbia citriodora, while in Tregear C. citriodora and Eucalyptus macrocarpa were prevalent, and in Cranebrook medium sized, mature-statured Pyrus calleryana were the dominant street trees. New residential suburbs typically had small to medium statured, young trees, including, for example, Waterhousia floribunda and Tristaniopsis laurina in Ropes Crossing (Table 3).
The measured tree height (t = 6.7, p < 0.01) and canopy width (t = 6.0, p < 0.01) were significantly greater in established areas compared to newly developed ones. In established suburbs, median tree height ranged from ~10 to 18 m, with South Penrith (13.25 m) and Tregear (15.5 m) having the tallest trees. In contrast, trees in new suburbs had a median height below 7 m, with minimal variation among suburbs. Canopy width followed a similar trend, with established suburbs having larger tree canopies (~8–18 m) compared to new areas (~5 m) (Figure 3).
Newly developed residential suburbs—Ropes Crossing, Jordan Springs and Glenmore Park—had an average tree canopy cover of 14.6% ± 3.2, significantly lower (t = −3.3; p < 0.03) than the 23.5% ± 3.4 observed in established areas. Similarly, grass coverage was nearly twice as high in established residential areas (16.3% ± 3.3) compared to newly developed ones (8.8% ± 0.5). Impervious surfaces dominated the landscape in new areas, averaging around 62.45% ± 7.6 of the land cover, whereas in established areas, they accounted for approximately 42% ± 3.1 (Figure 4).
Across the studied period, newly established suburbs consistently exhibited higher mean air temperatures (Ta) and WBGT values compared to established suburbs. During heatwave periods, air temperature reached 42.7 °C in new areas, whereas established suburbs recorded lower peaks (e.g., 39.3 °C in Cranebrook). Relative humidity was generally lower in new suburbs although these areas had higher WBGT readings—indicating greater thermal stress. On non-heatwave days, all sites showed reduced thermal load; compared to heatwave days; however, established suburbs continued to exhibit comparatively lower WBGT and higher relative humidity (Table 4).
During the three heatwave days, Ta was significantly (p < 0.05) higher in new residential areas than in established ones (Figure 5; Table 5). The peak temperature difference of 3.8 °C was observed at 14:00 h in Ropes Crossing, compared to Tregear, on 25 January 2021. Both Jordan Springs—Cranebrook and Glenmore Park—South Penrith pairs exhibited similar patterns, with established areas having slower increases in temperature during the day compared to new areas. During heatwave days, the mean WBGT values for all three established residential areas remained in the ‘caution’ category. In contrast, mean WBGT values of the new residential areas were classified as ‘extreme caution’ that at 14:00, the WBGT in all three new residential areas exceeded the upper threshold for ‘caution’ on heatwave days.
During two of the three non-heatwave days there were significantly higher Ta in new areas than in established ones. Both Jordan Springs and Glenmore Park experienced more rapid increases in temperature than their more established counterparts (Cranebrook and South Penrith, respectively) (Figure 6). The WBGT values for all three pairs of residential areas remained in the ’safe’ category during non-heatwave days, although values were generally higher in newly developed suburbs than in established ones. During non-heatwave days, the mean temperature differences between new and established residential areas ranged from −1.18 to 5.18 °C, with the former warming faster compared to established areas in two of the three comparisons (Figure 6 and Figure 7).

4. Discussion

This study investigated differences in human thermal comfort between newly developed and established residential suburbs in Western Sydney, Australia, during heatwave and non-heatwave conditions. Our findings showed significantly higher air temperatures, mean radiant temperatures and lower thermal comfort in newly developed suburbs, which likely reflect their lower tree cover, smaller housing lot size, and greater cover of impervious surfaces, relative to older, more established suburbs.
Many studies have investigated outdoor thermal comfort worldwide, yet only a few have addressed how this differs between heatwaves and non-heatwave days (but see [57]). Here we demonstrate that new residential areas in Western Sydney consistently exhibited higher air temperatures during both heatwave and non-heatwave days compared to established residential areas. This trend of microclimatic differences aligns with previous studies highlighting the UHI effect, where urban areas, especially those with high building density and low greenspace, tend to experience higher temperatures due to factors such as reduced albedo and low vegetation cover [58,59,60]. A comparison of urban neighborhoods in Knoxville, Tennessee, US, reported that areas with a higher percentage of impervious surfaces tended to have higher air temperatures [61], which is consistent with our findings. Additionally, the use of dark-colored roofing materials contributes to increased surface heat absorption, intensifying local UHI effects. Dark roofs reflect less solar radiation and instead retain heat, raising ambient temperatures [8]. All three newly developed residential suburbs in our study have dark roofs (authors personal observation) and experienced higher air temperatures and thermal stress. Given the association between roof color/albedo and local temperature [62] and inference from our study, the recent NSW government decision to reverse a proposed ban on the use of black roofs will likely increase human thermal stress in new housing developments over the coming years [63].
The focus of the current study on the outdoor thermal comfort index (WBGT) provides a comprehensive evaluation of the thermal challenges faced by urban residents in Western Sydney. Slower temperature increases, lower maximum temperatures and lower WBGT (“caution”) category were found in established residential areas, which have larger residential plot sizes and greater tree cover. New residential areas, on the other hand, which were characterized by smaller housing lots, a high cover of impermeable surfaces and small trees, had significantly higher air temperatures (and generally more rapid increases in temperature) as well as WBGT values classified as requiring “extreme caution” during heatwave days, indicating that conditions were potentially dangerous for outdoor activities in those areas. This aligns with previous studies showing that urban densification and reduced vegetation cover contribute to elevated temperatures [64,65] and low thermal comfort [66]. To enhance thermal resilience, urban design strategies, such as expanding tree canopy cover [67,68] and using reflective materials [69], are urgently needed, given the observed association between elevated WBGT levels, smaller housing lots, and reduced vegetation.
Several studies from diverse climatic regions align with our findings from Western Sydney, reinforcing the role of spatial composition, in shaping urban microclimates and thermal comfort. Studies by Khorat et al. [62] and Chen et al. [70] highlight the effectiveness of cool roofs in reducing surface and ambient temperatures, while Coutts et al., [71] underscores the cooling benefits of increased tree canopy and larger lot sizes in urban neighborhoods. Similarly, Jacob et al. [72] demonstrate the heat-mitigating potential of reflective roofing and green infrastructure. However, many of these studies rely heavily on modeling, simulation, or remote sensing, and tend to generalize across broader urban typologies rather than focus specifically on residential suburbs. Few studies offer data-driven, on-the-ground microclimate measurements under varying heat conditions, particularly in residential environments.
Our study contributes to this growing body of knowledge by showing how thermal comfort in lower in newly developed residential suburbs that represent the types of housing developments that are springing up across the globe, including in Western Sydney. While our study was conducted in Western Sydney, the research design and key variables—tree canopy cover, surface permeability, lot size and roof color—are relevant to residential developments in other cities with similar climates and urban forms. The mechanisms and mitigation strategies identified in our study are likely to apply to other regions with similar climatic conditions, urban densities, and development patterns. However, the magnitude of effects and the specific relationships with landscape variables may vary depending on local factors such as weather patterns and extremes, urban morphology, building materials, and socio-economic conditions. With projections suggesting that urban populations will continue to rise [10] it is crucial to consider the thermal impacts of urban densification on human health in future planning decisions. As Lam et al. [73] highlighted, poor outdoor thermal comfort can drive people indoors, reducing opportunities for physical activity and social interaction. This, in turn, can have long-term implications for public health, particularly during heatwaves when the risk of heat-related illnesses and mortality is elevated [74,75,76]. Our results show a clear disparity in thermal comfort between new and established residential areas and indicate that urban heat stress is a growing issue that needs to be addressed through both short-term and long-term planning strategies. Increasing urban greenspaces through tree planting, green roofs and pocket parks can provide immediate cooling benefits and enhance thermal comfort [15]. Long-term strategies should integrate urban greenspace into city planning by enforcing green coverage policies, expanding urban forests, and designing climate-adaptive landscapes [77].
Environmental education should emphasize the connections between urban design features, human thermal comfort, and energy savings, thereby helping to build public support for—and acceptance of—heat-sensitive planning. This includes raising awareness about the benefits of increasing tree canopy cover, enhancing surface albedo (e.g., with reflective roofs), and reducing the extent of impervious surfaces. Research shows that tree canopy covers exceeding approximately 40% (at the scale of a typical city block) can significantly reduce daytime air temperatures, effectively counterbalancing the heat absorbed by impervious surfaces [78]. Furthermore, studies have demonstrated that combining vegetation with high-albedo materials (reflective roofs, pavements) can yield even greater reductions in urban heat, sometimes lowering daily maximum temperatures by over 3 °C [70]. By translating these empirical insights into accessible public messaging, environmental education can empower communities, not only to support, but to actively engage in climate-responsive urban design, reinforcing the social sustainability and livability of urban neighborhoods. The literature provides abundant support for the value of such bottom-up, participatory approaches to urban design increase community resilience and adaptation to climate change impacts (e.g., [79,80,81]).

5. Limitations and Caveats

We acknowledge some limitations and caveats of our study. First, due to the limited number of weather stations, climate variables were recorded from only a few locations within each sampling site over a 5–6 h period. A continuous 24-h dataset over an extended timeframe would have provided a more comprehensive understanding of climate variability [82]. However, even within this short measurement window, data successfully captured differences in climate metrics and human thermal comfort between established and new residential areas during both heatwave and non-heatwave conditions. The selection of WBGT in our study may overlook nuances captured by different indices like Physiologically Equivalent Temperature (PET) or Predicted Mean Vote (PMV), which better integrate radiation and humidity effects [12,83]. This limits direct comparison with studies using alternative metrics. Another limitation of this study is the exclusion of certain meteorological variables, such as cloud cover, precipitation and wind speed, which to some degree can also influence urban microclimates and thermal comfort. However, earlier studies have shown that air temperature is the single most important meteorological variable when analyzing the impact of heatwaves on metropolitan Sydney [42]. Areas where the extreme heat is felt most frequently are those in the west, north-west and south-west of the city [26], reflecting the influence of hot and very dry westerly winds that originate in the Central Desert region of Australia. Hence, human thermal comfort in the study region is mostly driven by air temperature, and much less so by relative humidity or cloud cover and associated exposure to direct solar radiation.
While noting roof color differences, our analysis did not quantify albedo variations in paving materials or vegetation types, which significantly affect radiative loading [84]. The properties of surface materials are key drivers of UHIs but were not comprehensively measured here. Furthermore, our study focused on biophysical metrics but excluded subjective thermal perception surveys. Comfort thresholds vary culturally and demographically [85] and physiological indices like WBGT may not fully align with resident-reported experiences. Another consideration is that the newly developed vs. established residential suburbs classification assumes static urban forms. However, tree growth in both new and established residential areas could alter thermal performance over time, highlighting the need for longitudinal studies. While highlighting differences between suburb types, our findings are specific to Western Sydney’s urban morphology and climate. Cities with distinct urban geometries (e.g., high-rise vs. low-density) or different climates may exhibit different thermal dynamics [16]. Finally, we recommend that future research incorporates modeling approaches (e.g., regression analysis) to explore the predictive relationships between microclimatic variables and thermal comfort. Our findings provide a useful basis for such research and for the development of urban heat mitigation strategies.

6. Conclusions

Our study emphasizes the importance of considering human thermal comfort in urban planning, particularly in new suburban areas. Given the increasing frequency of heatwaves and the urbanization of areas like Western Sydney, it is crucial to incorporate climate-responsive urban designs that prioritize cooling through increased greenspace, appropriate building materials, and sustainable planning strategies. This will ensure that urban areas are not only livable but also resilient to the challenges posed by a warming climate. Further research should continue to explore the relationships among urban geometry, green infrastructure and thermal comfort to guide future urban design policies that can better protect residents from the impacts of heat stress.

Author Contributions

M.S. designed the study, collected and analyzed the data and drafted the manuscript. L.C. collected the data. M.E.-R., S.A.P. and S.P. conceptualized and designed the study and contributed to manuscript revision. All authors have read and agreed to the published version of the manuscript.

Funding

MER received funding from the Research Theme Program from Western Sydney University. LC received a summer scholarship from Western Sydney University.

Institutional Review Board Statement

Not applicable.

Informed Consent Statement

Not applicable.

Data Availability Statement

The data presented in this study are available on request from the corresponding author. The data are not publicly available due to privacy.

Conflicts of Interest

The authors declare that the research was conducted in the absence of any commercial or financial relationships that could be construed as a potential conflict of interest.

References

  1. Liu, Z.; Li, J.; Wu, Y.; Qin, C.; Liu, Y. Temporal Trend of the Frequency and Maximum Durations of Surface Urban Heat Islands over Global Cities. Nat. Cities 2024, 120, 106141. [Google Scholar] [CrossRef]
  2. Grant, L.; Vanderkelen, I.; Gudmundsson, L.; Fischer, E.; Seneviratne, S.I.; Thiery, W. Global Emergence of Unprecedented Lifetime Exposure to Climate Extremes. Nature 2025, 641, 374–379. [Google Scholar] [CrossRef] [PubMed]
  3. IPCC. Summary for Policymakers; Lee, H., Romero, J., Eds.; IPCC: Geneva, Switzerland, 2023; pp. 1–34. [Google Scholar]
  4. Coates, L.; van Leeuwen, J.; Browning, S.; Gissing, A.; Bratchell, J.; Avci, A. Heatwave Fatalities in Australia, 2001–2018: An Analysis of Coronial Records. Int. J. Disaster Risk Reduct. 2022, 67, 102671. [Google Scholar] [CrossRef]
  5. Perkins-Kirkpatrick, S.E.; White, C.J.; Alexander, L.V.; Argüeso, D.; Boschat, G.; Cowan, T.; Evans, J.P.; Ekström, M.; Oliver, E.C.J.; Phatak, A.; et al. Natural Hazards in Australia: Heatwaves. Clim. Change 2016, 139, 101–114. [Google Scholar] [CrossRef]
  6. Oke, T.R.; Mills, G.; Christen, A.; Voogt, J.A. Cities and Global Climate Change. In Urban Climates; Cambridge University Press: Cambridge, UK, 2017; pp. 360–384. [Google Scholar]
  7. Morabito, M.; Crisci, A.; Messeri, A.; Orlandini, S.; Raschi, A.; Maracchi, G.; Munafò, M. The Impact of Built-up Surfaces on Land Surface Temperatures in Italian Urban Areas. Sci. Total Environ. 2016, 551–552, 317–326. [Google Scholar] [CrossRef] [PubMed]
  8. Santamouris, M.; Haddad, S.; Fiorito, F.; Osmond, P.; Ding, L.; Prasad, D.; Wang, R. Urban Heat Island and Overheating Characteristics in Sydney, Australia. An Analysis of Multiyear Measurements. Sustainability 2017, 9, 712. [Google Scholar] [CrossRef]
  9. Huang, K.; Li, X.; Liu, X.; Seto, K.C. Projecting Global Urban Land Expansion and Heat Island Intensification through 2050. Environ. Res. Lett. 2019, 14, 114037. [Google Scholar] [CrossRef]
  10. United Nation 68% of the World Population Projected to Live in Urban Areas by 2050, Says UN. Available online: https://www.un.org/uk/desa/68-world-population-projected-live-urban-areas-2050-says-un (accessed on 20 January 2024).
  11. Rupp, R.F.; Vásquez, N.G.; Lamberts, R. A Review of Human Thermal Comfort in the Built Environment. Energy Build. 2015, 105, 178–205. [Google Scholar] [CrossRef]
  12. Jamei, E.; Rajagopalan, P. Urban Development and Pedestrian Thermal Comfort in Melbourne. Sol. Energy 2017, 1, 681–698. [Google Scholar] [CrossRef]
  13. Lai, D.; Liu, W.; Gan, T.; Liu, K.; Chen, Q. A Review of Mitigating Strategies to Improve the Thermal Environment and Thermal Comfort in Urban Outdoor Spaces. Sci. Total Environ. 2019, 661, 337–353. [Google Scholar] [CrossRef] [PubMed]
  14. Sharmin, M.; Tjoelker, M.G.; Pfautsch, S.; Esperón-Rodriguez, M.; Rymer, P.D.; Power, S.A. Tree Traits and Microclimatic Conditions Determine Cooling Benefits of Urban Trees. Atmosphere 2023, 14, 606. [Google Scholar] [CrossRef]
  15. Bowler, D.E.; Buyung-Ali, L.; Knight, T.M.; Pullin, A.S. Urban Greening to Cool Towns and Cities: A Systematic Review of the Empirical Evidence. Landsc. Urban Plan. 2010, 97, 147–155. [Google Scholar] [CrossRef]
  16. Johansson, E. Urban Thermal Comfort in the Tropics. In Urban Climate Challenges in the Tropics: Rethinking the Design Basis and Opportunities; Emmanuel, R., Ed.; Imperial College Press: London, UK, 2016; pp. 163–204. ISBN 9781783268405. [Google Scholar]
  17. Ng, E.; Cheng, V. Urban Human Thermal Comfort in Hot and Humid Hong Kong. Energy Build. 2012, 55, 51–65. [Google Scholar] [CrossRef]
  18. Wang, Y.; de Groot, R.; Bakker, F.; Wörtche, H.; Leemans, R. Thermal Comfort in Urban Green Spaces: A Survey on a Dutch University Campus. Int. J. Biometeorol. 2017, 61, 87–101. [Google Scholar] [CrossRef] [PubMed]
  19. Klemm, W.; Heusinkveld, B.G.; Lenzholzer, S.; van Hove, B. Street Greenery and Its Physical and Psychological Impact on Thermal Comfort. Landsc. Urban Plan. 2015, 138, 87–98. [Google Scholar] [CrossRef]
  20. Kong, F.; Yin, H.; James, P.; Hutyra, L.R.; He, H.S. Effects of Spatial Pattern of Greenspace on Urban Cooling in a Large Metropolitan Area of Eastern China. Landsc. Urban Plan. 2014, 128, 35–47. [Google Scholar] [CrossRef]
  21. Sharmin, M.; Tjoelker, M.G.; Pfautsch, S.; Esperon-Rodriguez, M.; Rymer, P.D.; Power, S.A. Tree Crown Traits and Planting Context Contribute to Reducing Urban Heat. Urban For. Urban Green. 2023, 83, 127913. [Google Scholar] [CrossRef]
  22. Gatto, E.; Buccolieri, R.; Aarrevaara, E.; Ippolito, F.; Emmanuel, R.; Perronace, L.; Santiago, J.L. Impact of Urban Vegetation on Outdoor Thermal Comfort: Comparison between a Mediterranean City (Lecce, Italy) and a Northern European City (Lahti, Finland). Forests 2020, 11, 228. [Google Scholar] [CrossRef]
  23. Mohajerani, A.; Bakaric, J.; Jeffrey-Bailey, T. The Urban Heat Island Effect, Its Causes, and Mitigation, with Reference to the Thermal Properties of Asphalt Concrete. J. Environ. Manag. 2017, 197, 522–538. [Google Scholar] [CrossRef] [PubMed]
  24. Hughes, L.H.E.F.J. The Silent Killer: Climate Change and the Health Impacts of Extreme Heat; Climate Council of Australia Limited: Sydney, NSW, Australia, 2016. [Google Scholar]
  25. Haynes, V.; Calgaro, E.; Dominey-Howes, D. The Future of Our Suburbs: Analyses of Heatwave Vulnerability in a Planned Estate. Geogr. Res. 2022, 60, 152–167. [Google Scholar] [CrossRef]
  26. Pfautsch, S.; Wujeska-Klause, A.; Walters, J.R. Spatiotemporal Variation of Intra-Urban Heat and Heatwaves across Greater Sydney, Australia. Weather Clim. Extrem. 2025, 47, 100741. [Google Scholar] [CrossRef]
  27. Cowan, T.; Purich, A.; Perkins, S.; Pezza, A.; Boschat, G.; Sadler, K. More Frequent, Longer, and Hotter Heat Waves for Australia in the Twenty-First Century. J. Clim. 2014, 27, 5851–5871. [Google Scholar] [CrossRef]
  28. CSIRO. Australia’s Changing Climate. 2024. Available online: https://www.csiro.au/en/research/environmental-impacts/climate-change/State-of-the-Climate/Australias-Changing-Climate (accessed on 10 April 2025).
  29. CSIRO. Bureau of Meteorology, State of the Climate. 2024. Available online: https://www.csiro.au/en/research/environmental-impacts/climate-change/State-of-the-Climate (accessed on 10 April 2025).
  30. Moallemi, M.; Melser, D. The Impact of Immigration on Housing Prices in Australia. Pap. Reg. Sci. 2020, 99, 773–786. [Google Scholar] [CrossRef]
  31. NSW Productivity Commission. Building More Homes Where Costs Less. Comparing the Marginal Costs of Servicing Growth in Different Areas of Sydney; NSW Productivity Commission: Sydney, NSW, Australia, 2023. [Google Scholar]
  32. NSW Government. A Metropolis of Three Cities: Great Open Space Places, Greater Housing Choice, Shorter Commutes and World Class Job Opportunities; NSW Government: Sydney, NSW, Australia, 2018. [Google Scholar]
  33. Uddin, F.K.; Piracha, A. Repeating History, Repeating Failure: A Study of the Sustainability-Related Urban Planning Policy Reforms in NSW, Australia. Aust. Plan. 2024, 60, 44–57. [Google Scholar] [CrossRef]
  34. Rouhollahi, M.; Behrend, M.; Boland, J. Optimising Tree Arrangement Policy in Australian Small-Scale Residential Settings. Sustain. Cities Soc. 2024, 102, 105232. [Google Scholar] [CrossRef]
  35. Australian Bureau of Statistics. New Houses Being Built on Smaller Blocks. Available online: https://www.abs.gov.au/articles/new-houses-being-built-smaller-blocks (accessed on 26 January 2024).
  36. Grimmond, S. Urbanization and Global Environmental Change: Local Effects of Urban Warming. Geogr. J. 2007, 173, 83–88. [Google Scholar] [CrossRef]
  37. Rahmani, N.; Sharifi, A. Urban Heat Dynamics in Local Climate Zones (LCZs): A Systematic Review. Build. Environ. 2025, 267, 112225. [Google Scholar] [CrossRef]
  38. Cat No. 1270.0.55.004; ASGA Australian Statistical Geography Standard. Volume 4—Significant Urban Areas, Urban Centres and Localities, Section of State. Australian Sign and Graphics Association: Epping, NSW, Australia, 2011.
  39. Australian Bureau of Statistics. Population Projections, Australia 2023. Available online: https://www.abs.gov.au/statistics/people/population/population-projections-australia/latest-release (accessed on 10 April 2025).
  40. Centre for Western Sydney. Western Sydney University Unveils Ambitious Economic Plan for the Region. Available online: https://www.westernsydney.edu.au/cws/media/western-sydneys-economic-plan (accessed on 18 March 2025).
  41. Penrith City Council. Resilient Penrith Action Plan: 2021–2030; Penrith City Council: Penrith, NSW, Australia, 2021. [Google Scholar]
  42. Khan, H.S.; Santamouris, M.; Kassomenos, P.; Paolini, R.; Caccetta, P.; Petrou, I. Spatiotemporal Variation in Urban Overheating Magnitude and Its Association with Synoptic Air-Masses in a Coastal City. Sci. Rep. 2021, 11, 6762. [Google Scholar] [CrossRef] [PubMed]
  43. Bureau of Meteorology New South Wales in January 2020. Available online: https://www.bom.gov.au/climate/current/month/nsw/archive/202001.summary.shtml (accessed on 10 May 2025).
  44. Ghorbankhani, Z.; Zarrabi, M.M.; Ghorbankhani, M. The Significance and Benefits of Green Infrastructures Using I-Tree Canopy Software with a Sustainable Approach. Environ. Dev. Sustain. 2024, 26, 14893–14913. [Google Scholar] [CrossRef]
  45. Jacobs, B.; Mikhailovich, N.; Delaney, C. Benchmarking Australia’s Urban Tree Canopy: An i-Tree Assessment; University of Technology Sydney: Ultimo, NSW, USA, 2014. [Google Scholar]
  46. Selim, S.; Dönmez, B.; Kilçik, A. Determination of the Optimum Number of Sample Points to Classify Land Cover Types and Estimate the Contribution of Trees on Ecosystem Services Using the I-Tree Canopy Tool. Integr. Environ. Assess. Manag. 2023, 19, 726–734. [Google Scholar] [CrossRef] [PubMed]
  47. Parmehr, E.G.; Amati, M.; Taylor, E.J.; Livesley, S.J. Estimation of Urban Tree Canopy Cover Using Random Point Sampling and Remote Sensing Methods. Urban For. Urban Green. 2016, 20, 160–171. [Google Scholar] [CrossRef]
  48. USDA. United States Department of Agriculture Forest Service, i-Tree Tools, i-Tree Canopy; USDA: Washington, DC, USA, 2021. [Google Scholar]
  49. Kamal, A.S.M.M.; Fahim, A.K.F.; Shahid, S. Changes in Wet Bulb Globe Temperature and Risk to Heat-Related Hazards in Bangladesh. Sci. Rep. 2024, 14, 10417. [Google Scholar] [CrossRef] [PubMed]
  50. Ohashi, Y.; Kawabe, T.; Shigeta, Y.; Hirano, Y.; Kusaka, H.; Fudeyasu, H.; Fukao, K. Evaluation of Urban Thermal Environments in Commercial and Residential Spaces in Okayama City, Japan, Using the Wet-Bulb Globe Temperature Index. Theor. Appl. Clim. 2009, 95, 279–289. [Google Scholar] [CrossRef]
  51. Carter, A.W.; Zaitchik, B.F.; Gohlke, J.M.; Wang, S.; Richardson, M.B. Methods for Estimating Wet Bulb Globe Temperature from Remote and Low-Cost Data: A Comparative Study in Central Alabama. Geohealth 2020, 4, e2019GH000231. [Google Scholar] [CrossRef] [PubMed]
  52. Yaglou, C.P.; Minard, D. Control of Heat Casualties at Military Training Centers. Arch. Ind. Health 1957, 16, 302–316. [Google Scholar]
  53. Department of the Army and Air Force. Heat Stress Control and Heat Casualty Management. Tech. Bull. Med. 2003, 507, 48–152. [Google Scholar]
  54. Havenith, G.; Fiala, D. Thermal Indices and Thermophysiological Modeling for Heat Stress. Compr. Physiol. 2016, 6, 1134. [Google Scholar] [CrossRef]
  55. Shin, J.Y.; Kim, K.R.; Ha, J.C. Intensity-Duration-Frequency Relationship of WBGT Extremes Using Regional Frequency Analysis in South Korea. Environ. Res. 2020, 190, 109964. [Google Scholar] [CrossRef] [PubMed]
  56. ISO 7726; Ergonomics of the Thermal Environment—Instruments for Measuring Physical Quantities. ISO: Geneva, Switzerland, 1998.
  57. Lam, C.K.C.; Gallant, A.J.E.; Tapper, N.J. Perceptions of Thermal Comfort in Heatwave and Non-Heatwave Conditions in Melbourne, Australia. Urban Clim. 2018, 23, 204–218. [Google Scholar] [CrossRef]
  58. Morabito, M.; Crisci, A.; Guerri, G.; Messeri, A.; Congedo, L.; Munafò, M. Surface Urban Heat Islands in Italian Metropolitan Cities: Tree Cover and Impervious Surface Influences. Sci. Total Environ. 2021, 751, 142334. [Google Scholar] [CrossRef] [PubMed]
  59. Shahfahad; Rihan, M.; Naikoo, M.W.; Ali, M.A.; Usmani, T.M.; Rahman, A. Urban Heat Island Dynamics in Response to Land-Use/Land-Cover Change in the Coastal City of Mumbai. J. Indian Soc. Remote Sens. 2021, 49, 2227–2247. [Google Scholar] [CrossRef]
  60. Sanaieian, H.; Tenpierik, M.; Van Den Linden, K.; Mehdizadeh Seraj, F.; Mofidi Shemrani, S.M. Review of the Impact of Urban Block Form on Thermal Performance, Solar Access and Ventilation. Renew. Sustain. Energy Rev. 2014, 38, 551–560. [Google Scholar] [CrossRef]
  61. Howe, D.A.; Hathaway, J.M.; Ellis, K.N.; Mason, L.R. Spatial and Temporal Variability of Air Temperature across Urban Neighborhoods with Varying Amounts of Tree Canopy. Urban For. Urban Green. 2017, 27, 109–116. [Google Scholar] [CrossRef]
  62. Khorat, S.; Das, D.; Khatun, R.; Aziz, S.M.; Anand, P.; Khan, A.; Santamouris, M.; Niyogi, D. Cool Roof Strategies for Urban Thermal Resilience to Extreme Heatwaves in Tropical Cities. Energy Build. 2024, 302, 113751. [Google Scholar] [CrossRef]
  63. Pfautsch, S.; Paolini, R. If You’ve Got a Dark Roof, You’re Spending Almost $700 Extra a Year to Keep Your House Cool. Available online: https://www.unsw.edu.au/newsroom/news/2024/03/dark-roof-spending-almost-700-extra-year-keep-house-cool (accessed on 2 May 2025).
  64. Santamouris, M.; Cartalis, C.; Synnefa, A.; Kolokotsa, D. On the Impact of Urban Heat Island and Global Warming on the Power Demand and Electricity Consumption of Buildings—A Review. Energy Build. 2015, 98, 119–124. [Google Scholar] [CrossRef]
  65. Erlwein, S.; Pauleit, S. Trade-Offs between Urban Green Space and Densification: Balancing Outdoor Thermal Comfort, Mobility, and Housing Demand. Urban Plan. 2021, 6, 5–19. [Google Scholar] [CrossRef]
  66. van Hove, L.W.A.; Jacobs, C.M.J.; Heusinkveld, B.G.; Elbers, J.A.; Van Driel, B.L.; Holtslag, A.A.M. Temporal and Spatial Variability of Urban Heat Island and Thermal Comfort within the Rotterdam Agglomeration. Build. Environ. 2015, 83, 91–103. [Google Scholar] [CrossRef]
  67. Grilo, F.; Pinho, P.; Aleixo, C.; Catita, C.; Silva, P.; Lopes, N.; Freitas, C.; Santos-Reis, M.; McPhearson, T.; Branquinho, C. Using Green to Cool the Grey: Modelling the Cooling Effect of Green Spaces with a High Spatial Resolution. Sci. Total Environ. 2020, 724, 138182. [Google Scholar] [CrossRef] [PubMed]
  68. Ren, Z.; Zhao, H.; Fu, Y.; Xiao, L.; Dong, Y. Effects of Urban Street Trees on Human Thermal Comfort and Physiological Indices: A Case Study in Changchun City, China. J. For. Res. 2022, 33, 911–922. [Google Scholar] [CrossRef]
  69. Qin, Y.; Liang, J.; Tan, K.; Li, F. A Side by Side Comparison of the Cooling Effect of Building Blocks with Retro-Reflective and Diffuse-Reflective Walls. Sol. Energy 2016, 133, 172–179. [Google Scholar] [CrossRef]
  70. Chen, X.; Jeong, S.; Zheng, Y.; Park, H.; Park, C.-E.; Joo, J.; Choi, W.; Chen, X.; Zheng, C. Evaluation of Different Roof Materials for the Mitigation of Urban Warming in a Subtropical Monsoon Climate. J. Geophys. Res. Atmos. 2020, 125, e2019JD031972. [Google Scholar] [CrossRef]
  71. Coutts, A.M.; Beringer, J.; Tapper, N.J. Impact of Increasing Urban Density on Local Climate: Spatial and Temporal Variations in the Surface Energy Balance in Melbourne, Australia. J. Appl. Meteorol. Clim. 2007, 46, 477–493. [Google Scholar] [CrossRef]
  72. Jacobs, S.J.; Gallant, A.J.E.; Tapper, N.J.; Li, D. Use of Cool Roofs and Vegetation to Mitigate Urban Heat and Improve Human Thermal Stress in Melbourne, Australia. J. Appl. Meteorol. Climatol. 2018, 57, 1747–1764. [Google Scholar] [CrossRef]
  73. Lam, C.K.C.; Loughnan, M.; Tapper, N. Visitors’ Perception of Thermal Comfort during Extreme Heat Events at the Royal Botanic Garden Melbourne. Int. J. Biometeorol. 2018, 62, 97–112. [Google Scholar] [CrossRef] [PubMed]
  74. Baccini, M.; Biggeri, A.; Accetta, G.; Kosatsky, T.; Katsouyanni, K.; Analitis, A.; Anderson, H.R.; Bisanti, L.; D’Iippoliti, D.; Danova, J.; et al. Heat Effects on Mortality in 15 European Cities. Epidemiology 2008, 19, 711–719. [Google Scholar] [CrossRef] [PubMed]
  75. De Troeyer, K.; Bauwelinck, M.; Aerts, R.; Profer, D.; Berckmans, J.; Delcloo, A.; Hamdi, R.; Van Schaeybroeck, B.; Hooyberghs, H.; Lauwaet, D.; et al. Heat Related Mortality in the Two Largest Belgian Urban Areas: A Time Series Analysis. Environ. Res. 2020, 188, 109848. [Google Scholar] [CrossRef] [PubMed]
  76. Mitchell, D.; Heaviside, C.; Vardoulakis, S.; Huntingford, C.; Masato, G.; Guillod, B.P.; Frumhoff, P.; Bowery, A.; Wallom, D.; Allen, M. Attributing Human Mortality during Extreme Heat Waves to Anthropogenic Climate Change. Environ. Res. Lett. 2016, 11, 074006. [Google Scholar] [CrossRef]
  77. Gill, S.E.; Handley, J.F.; Ennos, A.R.; Pauleit, S. Adapting Cities for Climate Change: The Role of the Green Infrastructure. Built Environ. 2007, 33, 115–133. [Google Scholar] [CrossRef]
  78. Ziter, C.D.; Pedersen, E.J.; Kucharik, C.J.; Turner, M.G. Scale-Dependent Interactions between Tree Canopy Cover and Impervious Surfaces Reduce Daytime Urban Heat during Summer. Proc. Natl. Acad. Sci. USA 2019, 116, 7575–7580. [Google Scholar] [CrossRef] [PubMed]
  79. Tamminga, K.; Cortesão, J.; Bakx, M. Convivial Greenstreets: A Concept for Climate-Responsive Urban Design. Sustainability 2020, 12, 3790. [Google Scholar] [CrossRef]
  80. Chitsa, M.; Sivapalan, S.; Singh, B.S.M.; Lee, K.E. Citizen Participation and Climate Change within an Urban Community Context: Insights for Policy Development for Bottom-Up Climate Action Engagement. Sustainability 2022, 14, 3701. [Google Scholar] [CrossRef]
  81. Özdamar, E.; Önay, E. An Overview of Transdisciplinary and Bottom-up Approach for Urban Resilience: The Case of Turkey. Environ. Sci. Sustain. Dev. 2024, 9, 1–16. [Google Scholar] [CrossRef]
  82. Kirkpatrick, J.B.; Daniels, G.D.; Davison, A. Temporal and Spatial Variation in Garden and Street Trees in Six Eastern Australian Cities. Landsc. Urban Plan. 2011, 101, 244–252. [Google Scholar] [CrossRef]
  83. Grifoni, R.C.; Passerini, G.; Pierantozzi, M. Assessment of Outdoor Thermal Comfort and Its Relation to Urban Geometry. WIT Trans. Ecol. Environ. 2013, 1, 3–14. [Google Scholar] [CrossRef]
  84. Aghamolaei, R.; Azizi, M.M.; Aminzadeh, B.; O’Donnell, J. A Comprehensive Review of Outdoor Thermal Comfort in Urban Areas: Effective Parameters and Approaches. Energy Environ. 2023, 34, 2204–2227. [Google Scholar] [CrossRef]
  85. Wang, Z.; de Dear, R.; Luo, M.; Lin, B.; He, Y.; Ghahramani, A.; Zhu, Y. Individual Difference in Thermal Comfort: A Literature Review. Build. Environ. 2018, 15, 181–193. [Google Scholar] [CrossRef]
Figure 1. Study area in Western Sydney, Australia. The left panel shows Australia with the study region highlighted. The right panels display satellite images of six suburbs, with urban extents outlined in red, representing established (ac) and newly developed (df) residential areas.
Atmosphere 16 00899 g001
Figure 2. Aerial image (a) and street view (b) of Glenmore Park (Clackson, 2021), with aerial (c) and street views (d) of South Penrith. Red dots in (a,c) indicate measurement locations.
Atmosphere 16 00899 g002
Figure 3. Difference in the size of housing lots (m2) (a), tree height (m) (b) and canopy width (m) (c) between established and newly developed residential suburbs. Boxplots display the median (horizontal line), interquartile range (25th–75th percentile—box) and variability outside the upper and lower quartiles (whiskers).
Atmosphere 16 00899 g003
Figure 4. Comparison of land cover types across six residential suburbs, including established areas (Cranebrook, South Penrith, Tregear) and newly developed ones (Glenmore Park, Ropes Crossing and Jordan Springs). Error bars represent standard error of the mean.
Atmosphere 16 00899 g004
Figure 5. Comparison of air temperature (°C), relative humidity (%) and outdoor thermal comfort index, and wet bulb globe temperature (WBGT) on heatwave days between established and new residential areas in Western Sydney, Australia. Orange color represents newly developed suburbs and blue color represents established suburbs. The dotted lines on the WBGT plots indicate thermal stress categories: safe, caution, extreme caution, danger and extreme Danger.
Atmosphere 16 00899 g005
Figure 6. Comparison of air temperature (°C), relative humidity (%) and wet bulb globe temperature (WBGT) on non-heatwave days between established and new residential areas in Western Sydney, Australia. Orange color represents newly developed suburbs, and blue color represents established suburbs. The dotted lines on the WBGT plots indicate thermal stress categories: Safe, Caution, Extreme caution, Danger and Extreme Danger.
Atmosphere 16 00899 g006
Figure 7. Pattern of air temperature differences (ΔT in °C) on heatwave (ac) and non-heatwave (df) days between new and established residential areas in Western Sydney, Australia.
Atmosphere 16 00899 g007
Table 1. Description of established and new residential suburbs that were used as focus areas in the present study to compare thermal comfort between suburbs.
Residential Areas
(Suburb, Postcode, LGA)
Construction AgeArea
(km2)
Distance from the CBD (km)
Established suburbs
Cranebrook, 2749, City of Penrith 1980 14.9650
South Penrith, 2750, City of Penrith19705.0755
Tregear, 2770, City of Blacktown19601.6347
Newly developed suburbs
Jordan Springs, 2747, City of Penrith20215.153
Glenmore Park, 2745, City of Penrith201811.254
Ropes Crossing, 2760, City of Blacktown20154.549
Table 2. Weather conditions on fieldwork days in paired residential areas. Monthly temperatures were derived from the nearby meteorological stations of Penrith (Station name: Penrith Lakes AWS; ID 0671113; Lat: −33.72; Lon: 150.68; Height: 24.7 m) and Blacktown (Station name: Prospect Reservoir; ID: 67019; Lat: −33.82; Lon: 150.91; Elevation: 61 m).
Fieldwork Date Residential SuburbsDaily Max Monthly Mean
Heatwave (LGA)EstablishedNewly DevelopedTemp (°C)Temp (°C)
23 January 2021 (Penrith)CranebrookJordan Springs38.134.9
24 January 2021 (Penrith)South PenrithGlenmore Park39.934.9
25 January 2021 (Blacktown)TregearRopes Crossing40.034.9
Non-heatwave (LGA)
4 March 2021 (Penrith)South PenrithGlenmore Park29.730.5
10 April 2021 (Blacktown)TregearRopes Crossing24.128.6
15 April 2021 (Penrith)CranebrookJordan Springs26.928.6
Table 3. Characteristics of residential areas and list of the tree species from streets where microclimate data were recorded.
Residential AreasRoof
Color
Mean Size of
Housing Lots (m2) *
Most Abundant
Tree Species
Established
CranebrookLight662.32Pyrus calleryana
South PenrithLight623.92Liquidambar styraciflua
Corymbia citriodora
TregearLight559.55Corymbia citriodora
Eucalyptus microcarpa
Newly developed
Glenmore ParkDark389.08Cupaniopsis anacardiodes
Jordan SpringsDark380.76Melaleuca linariifolia
Waterhousia floribunda
Ropes CrossingLight and Dark 327.38Waterhousia floribunda
Tristaniopsis laurina
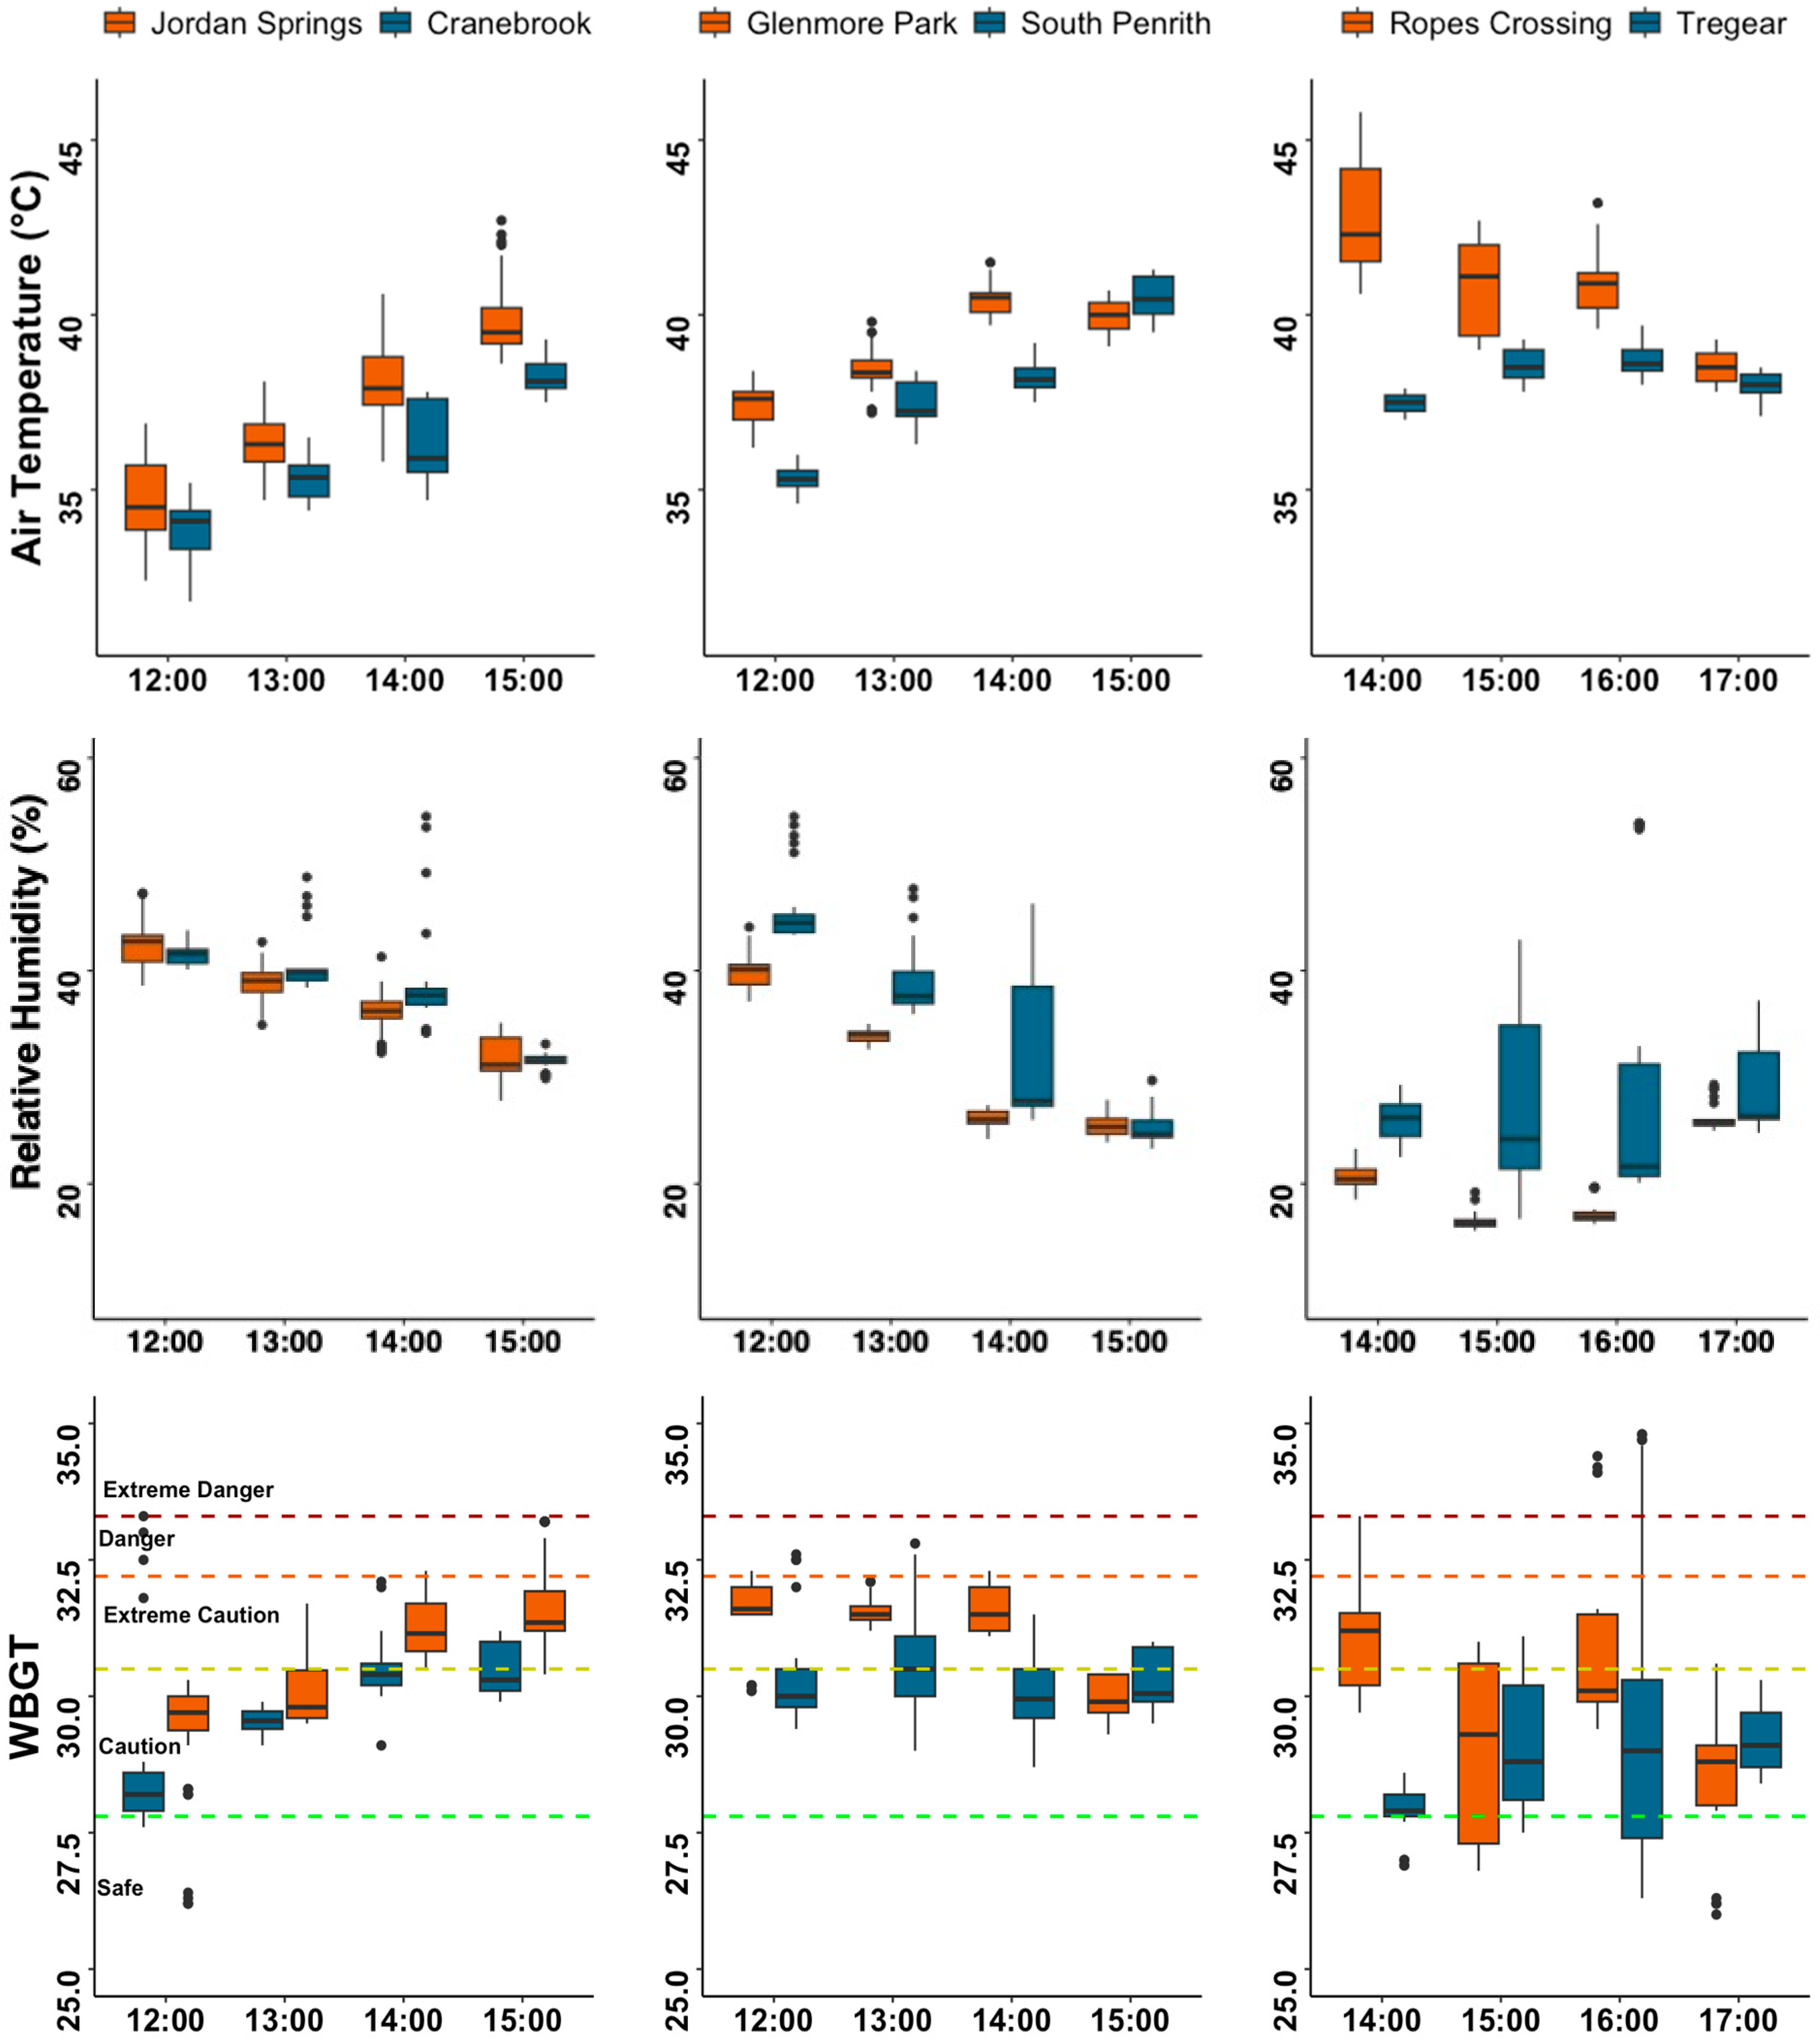
* Estimated using New South Wales’s Spatial Digital Twin (SDT), Explorer (spatial.nsw.gov.au).
Table 4. Air temperature (Ta), relative humidity (RH), windspeed, and outdoor thermal comfort index represented by wet black globe temperature (WBGT) summarized across both heatwave and non-heatwave conditions at established and newly residential suburbs in Western Sydney, Australia. Mean air temperatures (Ta) were 36.8 °C, 38.4 °C and 39.3 °C during three-consecutive heatwave days, and mean Ta were 24.79, 27 and 29.90 °C during non-heatwave days across the six residential areas (i.e., both new and established suburbs).
Heatwave Days/SuburbsArea TypeTaRHWind SpeedWBGT
Mean ± SD
(Range)
Mean ± SD
(Range)
Mean ± SD
(Range)
Mean ± SD
(Range)
Jan 23
Jordan Springs
New37.27 ± 2.13
(32.4–42.7)
37.18 ± 4.37
(27.8–47.3)
0.87 ± 0.68
(0.0–3.6)
30.63 ± 1.20
(26.20–33.2)
Jan 23
Cranebrook
Established35.75 ± 1.92
(31.8–39.3)
40.07 ± 9.18
(29.9–80.6)
0.72 ± 0.51
(0.0–2.0)
29.75 ± 1.25
(27.6–33.3)
Jan 24
Glenmore Park
New38.35 ± 1.77
(34.6–41.5)
33.93 ± 8.10
(23.2–62.5)
0.82 ± 0.53
(0.0–2.2)
30.71 ± 0.96
(28.70–32.8)
Jan 24
South Penrith
Established37.79 ±1.91
(34.6–41.3)
35.82 ± 9.19
(23.2–62.5)
0.79 ± 0.50
(0.0–2.1)
30.33 ± 0.90
(28.7–32.8)
Jan 25
Tregear
New40.73 ±1.91
(37.8–45.8)
20.00 ± 4.05
(15.6–29.3)
0.85 ± 0.56
(0.0–2.7)
29.86 ± 1.90
(26.0–34.4)
Jan 25
Ropes Crossing
Established38.21 ± 0.65
(37.0–39.7)
27.35 ± 7.89
(16.7–53.9)
0.68 ± 0.56
(0.0–2.7)
28.94 ± 1.63
(26.3–34.8)
Non-heatwave days/Suburbs
March 4
Glenmore Park
New31.50 ± 1.8
(26.9–35.7)
35.89 ± 3.03
(29.1–44)
0.58 ± 0.53
(0.0–2.3)
25.80 ± 1.5
(24.2–31.4)
March 4
South Penrith
Established28.64 ± 2.36
(24.5–32.7)
45.73 ± 13.58
(33.0–100)
0.89 ±0.63
(0.0–2.9)
23.58 ± 1.30
(19.6–27.8)
April 10
Ropes Crossing
New24.84 ± 1.11
(23.0–28.1)
32.13 ± 2.06
(28.2–36.4)
1.82 ± 0.80
(0.4–4.0)
20.69 ± 0.92
(18.5–22.8)
April 10
Tregear
Established24.73 ± 0.81
(23.0–26.2)
39.91 ± 11.70
(32.5–76.2)
1.10 ± 0.60
(0.0–3.1)
20.1 ± 1.26
(17.8–22.8)
April 15
Jordan Springs
New27.47 ± 1.46
(24.9–30.8)
39.30 ± 13.54
(28.8–89.4)
0.67 ± 0.52
(0.0–1.6)
22.74 ± 1.30
(20.3–26.2)
April 15
Cranebrook
Established26.64 ± 1.16
(24.3–30.8)
62.95 ± 25.63
(35.0–100)
0.44 ± 0.51
(0.0–2.3)
23.37 ± 2.93
(19.3–28.4)
Table 5. Summary statistics for suburb comparisons for air temperature (Ta), relative humidity (RH), wind speed, mean radiant temperature (Tmrt) and wet bulb globe temperature (WBGT). Values are Chi-squared values from Kruskal-Wallis tests, with effects sizes (eta squared (η2) in brackets below. Data collected during heatwave and non-heatwave days in the austral summer of 2020–2021, in Western Sydney, Australia.
Heatwave DaysTaRHWind SpeedTmrtWBGT
Jordan Springs/Cranebrook
Jan 23
29.00 ***6.90 **1.9721.00 **32.25 ***
(0.10)(0.02)(0.00)(0.07)(0.11)
Glenmore Park/South Penrith
Jan 24
19.84 ***11.82 **0.9623.79 ***34.78 ***
(0.10)(0.06)(0.12)(0.18)
Ropes Crossing/Tregear
Jan 25
96.39 ***64.33 ***4.0121.89 ***20.60 ***
(0.48)(0.32)(0.02)(0.10)(0.10)
Non-heatwave days
Glenmore Park/South Penrith
March 4
97.88 ***117.96 ***20.21 **13.00 **168.74 ***
(0.32)(0.39)(0.06)(0.04)(0.55)
Ropes Crossing/Tregear
April 10
0.0489 ***43.20 **124.88 ***50.91 ***
(0.00)(0.45)(0.22)(0.63)(0.26)
Jordan Spring/Cranebrook
April 15
10.28 ***94.47 ***11.04 *70.37 ***0.84
(0.44)(0.44)(0.05)(0.32)(0.00)
Kruskal-Wallis test significance levels: *** p < 0.001, ** p < 0.01, * p < 0.05.
Disclaimer/Publisher’s Note: The statements, opinions and data contained in all publications are solely those of the individual author(s) and contributor(s) and not of MDPI and/or the editor(s). MDPI and/or the editor(s) disclaim responsibility for any injury to people or property resulting from any ideas, methods, instructions or products referred to in the content.

