1. Introduction
The detection of trace gases, defined by volume concentrations in the ppm (parts per million) range, plays a crucial role in various fields, including atmospheric monitoring, exhaust emission analysis, respiratory diagnostics, and other related applications [
1,
2]. In the past decade, photoacoustic spectroscopy (PAS) has emerged as a focal point of research owing to its superior selectivity and reduced detection limit [
3]. In PAS, upon absorption of modulated laser light by a gas, acoustic waves are generated during the de-excitation process. By analyzing these acoustic waves, the concentration of trace gases can be deduced. Consequently, the acoustic detection element is the most crucial component in PAS [
4]. In conventional PAS, a commercial microphone is typically employed to detect faint acoustic signals carrying gas-related information. However, the microphone’s limited response frequency, which is below 4 kHz, fails to effectively isolate ambient noise, thereby significantly hindering the advancement of PAS [
5,
6]. In 2002, the quartz tuning fork (QTF) was pioneeringly utilized as an acoustic detection element for trace gas sensing, marking the inception of quartz-enhanced photoacoustic spectroscopy (QEPAS) [
7,
8]. The resonant frequency of commercial QTF is usually 32.768 kHz, which compensates for the limitations of traditional microphones due to its superior noise shielding. The quality factor of the QTF is ~13,000 at atmospheric pressure, which contributes to the high sensitivity of the QEPAS [
9,
10].
To effectively capture the photoacoustic signal resulting from the interaction between gas molecules and the excitation light source, the excitation light source is typically focused on the midpoint between the prongs of the QTF. With a typical prong spacing of 300 μm, the QTF allows high-quality laser beams to pass through the prongs without making contact, thereby ensuring efficient detection [
11,
12,
13]. However, the stray light usually radiates on the QTF surface when the laser with poor beam quality is used as the excitation light source (blue lasers, erbium-doped fiber-amplified lasers…), which causes inevitable thermal noise and lower sensitivity. Although the lasers with poor beam quality can be collimated by multiple optical devices, this method greatly reduces the portability and stability of the QEPAS sensor. Therefore, custom QTFs were designed to expand the practical application of the QEPAS sensors [
14,
15]. The innovative design of the custom QTF mainly lies in (a) a large spacing of the prongs (600–800 μm) for combining with the poor beam quality laser; (b) a lower resonant frequency (5–15 kHz) for high sensitivity detection of slow relaxation time gases (NO, CH
4…). Moreover, custom QTFs have been combined with blue laser, mid-infrared laser, and terahertz sources to achieve trace gas detection [
16,
17].
Typically, the bare QTF is paired with an acoustic micro-resonator (AmR) into a spectrophone for high sensitivity of trace gas sensors [
18,
19]. To match the mm
3-sized QTF, the stainless-steel cylindrical hollow tube is utilized as the AmR in QEPAS, and it can produce varying levels of photoacoustic signal amplification depending on the size and coupling mechanism of the AmR. To date, various coupling mechanisms have been reported in practical applications [
20,
21]. The most fundamental coupling mechanism is the on-beam configuration, which is assembled by two identical tubes perpendicular to the QTF. The off-beam configuration, which is assembled by one tube parallel to the QTF, has also been reported as another simple coupling mechanism for beam collimation of the lasers with poor beam quality. There are still multiple coupling mechanisms, but they come at the cost of a more intricate spectrophone structure and optical path alignment. Furthermore, the spectrophone obtains a strong acoustic coupling efficiency when the excitation light source passes through the AmR.
The ideal dimension and coupling mechanism of the AmR must be optimized with the development of high-performance custom QTFs because custom QTFs with varied resonant frequencies are tailored to different dimensions, which are significantly different from commercial QTFs. The preferable dimension of the AmR based on the on-beam configuration has been established in recent work, resulting in a signal-to-noise gain factor of >30. In particular, the single-tube on-beam configuration as a unique coupling mechanism was proposed by Lin et al. [
22], which consists of a single stainless-steel tube threaded through a larger spacing prong of the custom QTF. The results revealed that the detection sensitivity of the QEPAS sensor with the single-tube on-beam QEPAS spectrophone was two orders of magnitude higher than that of the bare custom QTF [
23,
24]. Despite the fact that the on-beam configuration has a high enhancement factor and the design of the custom QTF has increased the distance between the prongs, the radiation noise is still caused by the lasers with more stray light. Nevertheless, the off-beam configuration can reduce optical confinement because the laser does not have to pass through the custom QTF prongs. As a result, optimizing AmR based on the off-beam configuration is essential to evaluation for further expanding the application of QEPAS sensors with the custom QTFs.
In this paper, we illustrate an off-beam spectrophone in a QEPAS sensor, which consists of an AmR and a custom QTF. The AmR was made up of a single stainless-steel tube with a slit in its center that allows the custom QTF to respond to the antinode of the longitudinal acoustic pressure. A custom QTF with a resonant frequency of 7.2 kHz was utilized as the acoustic response element. The concentration of water vapor (H2O) was monitored in order to optimize the AmR parameters for the off-beam spectrophone.
2. Experiment Apparatus
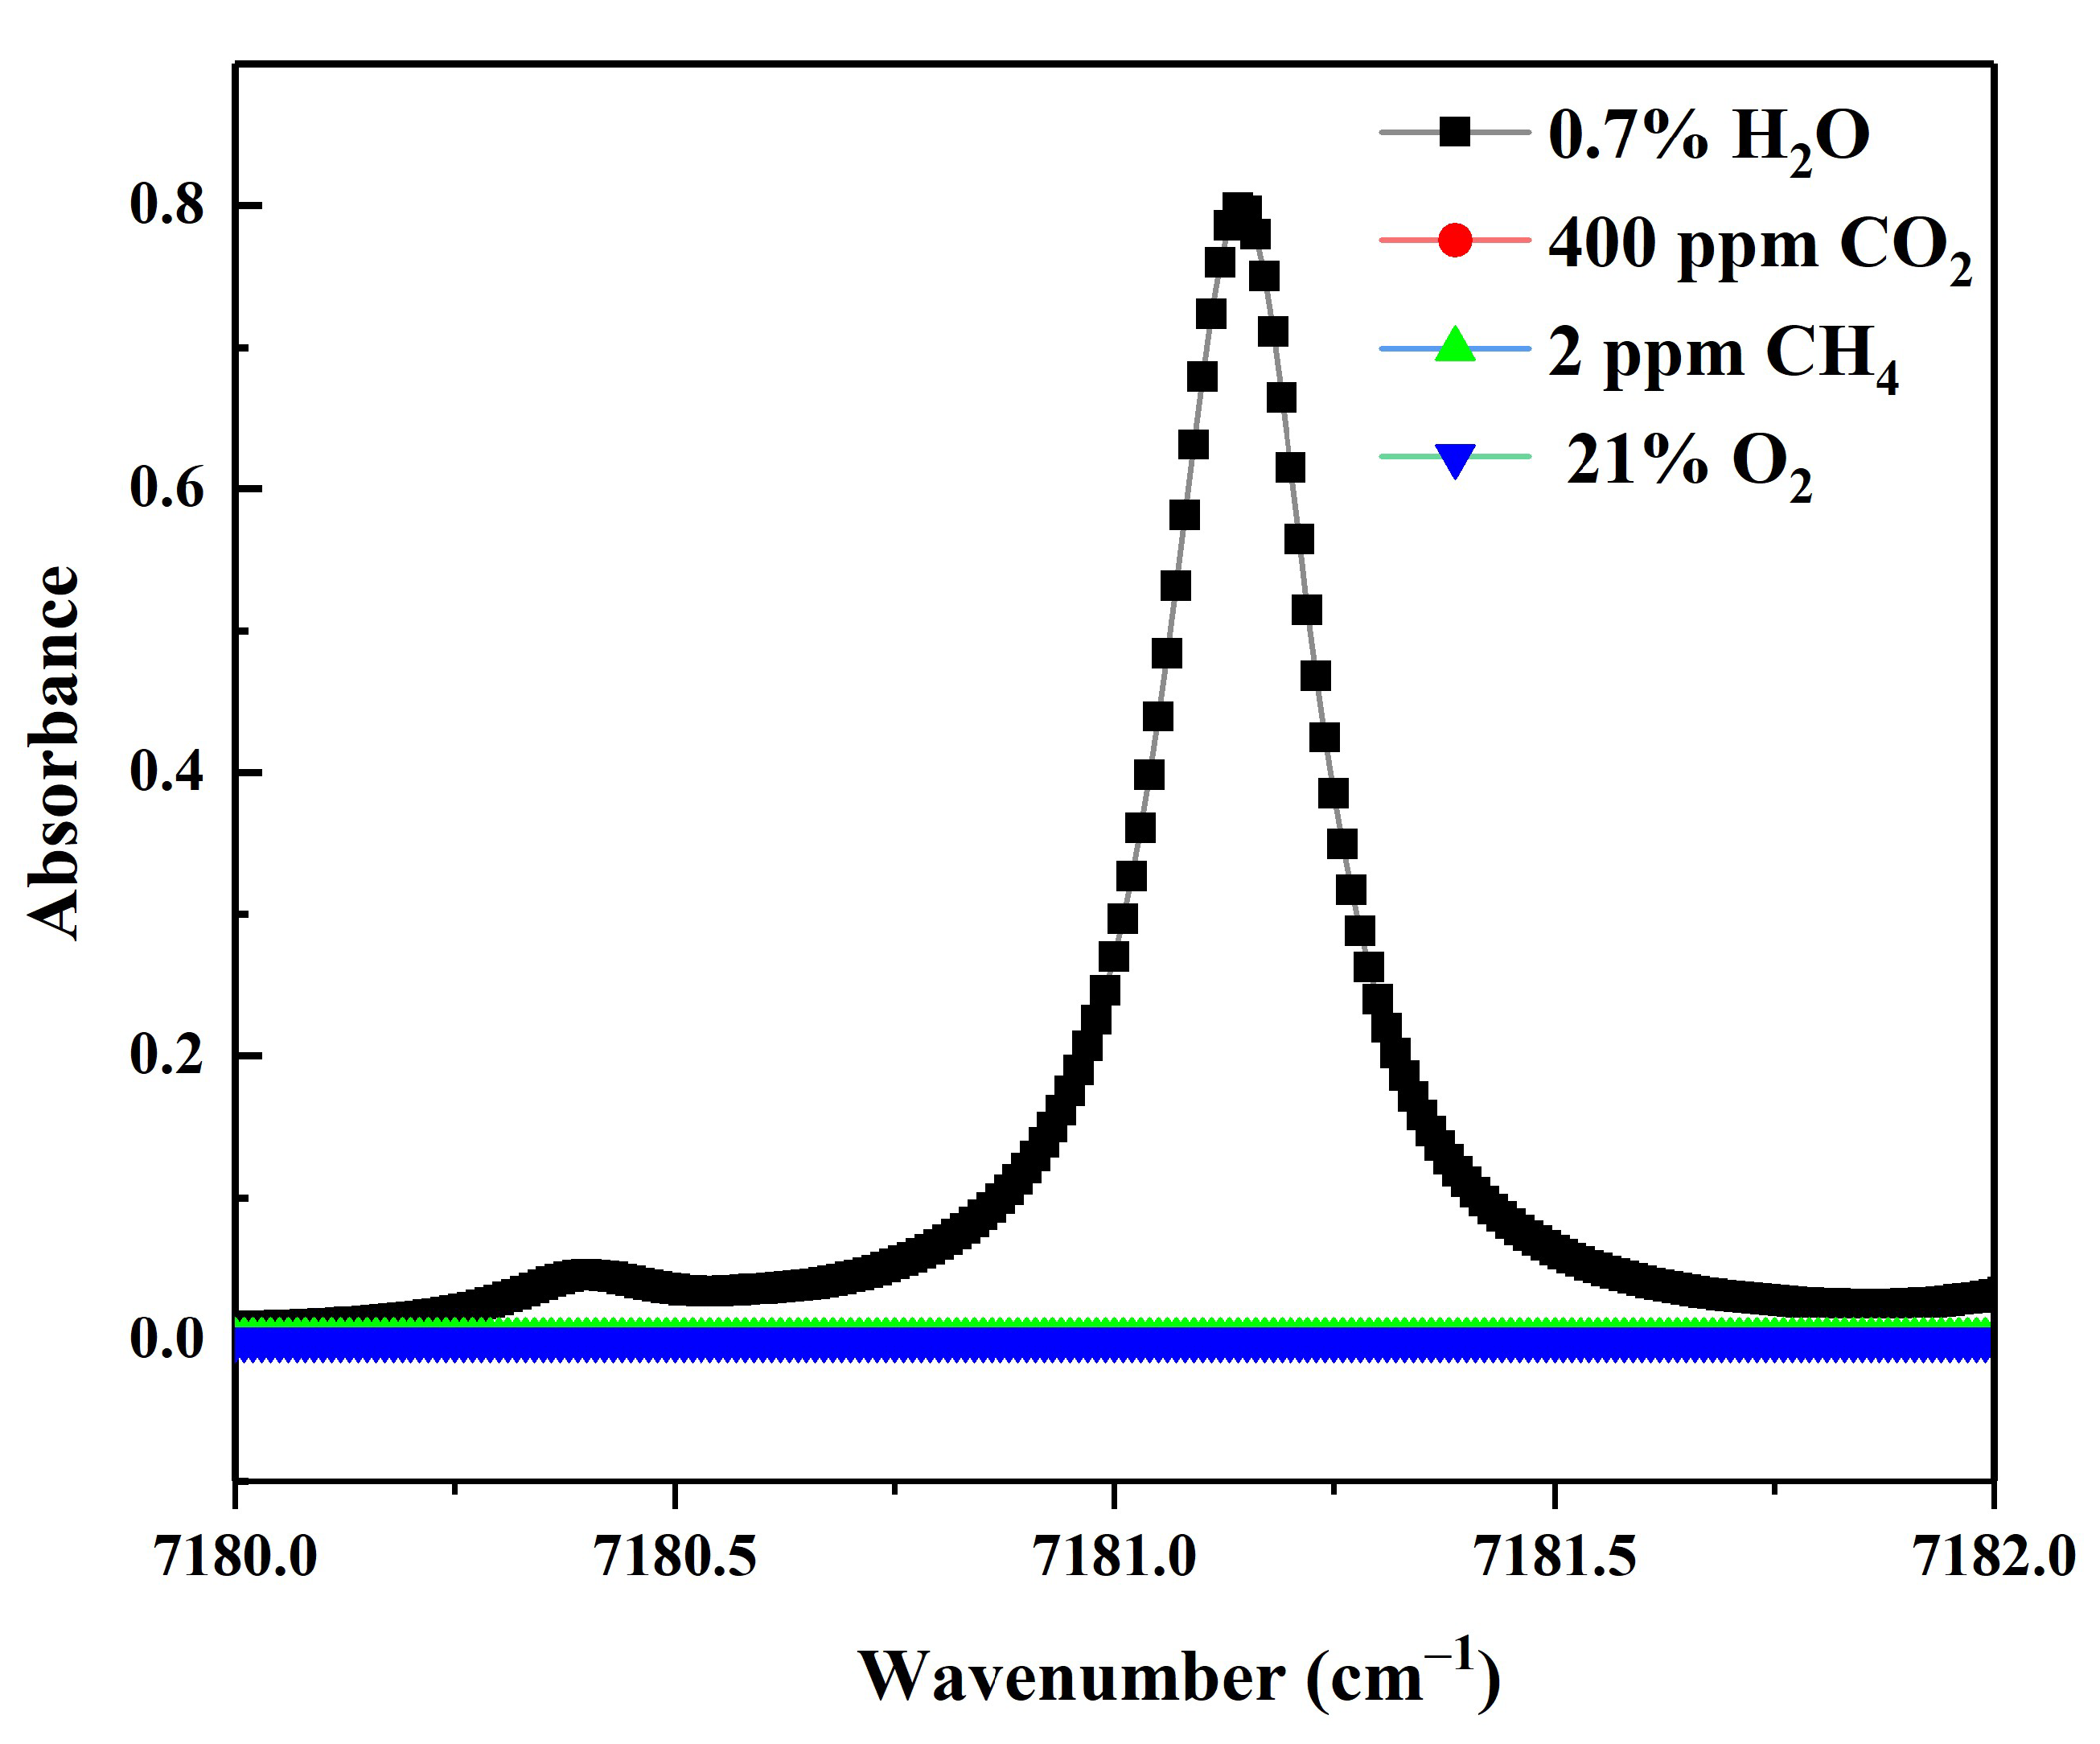
A near-infrared distributed feedback laser (DFB) with a center wavelength of 1392.5 nm was utilized as the excitation light source, which was packaged in a 14-pin butterfly fiber-coupled package with TEC. The optimization experiments were carried out by comparing the photoacoustic signal of the target gas (a mixture of N
2 and 2.5% H
2O in atmospheric pressure). In order to calculate the sensitivity of the device, 7007 ppm water vapor was used as the target gas for follow-up experiments. As shown in
Figure 1, the characteristic absorption line with the center wavenumber of 7181.15 cm
−1, which is not disturbed by other gases, was chosen based on the HITRAN spectral database for the photoacoustic signal detection of H
2O. The operating temperature and the substrate current of the DFB laser were set to 33 °C and 115 mA, which were tuned using a custom-driven board, and the corresponding output power was 11.8 mW.
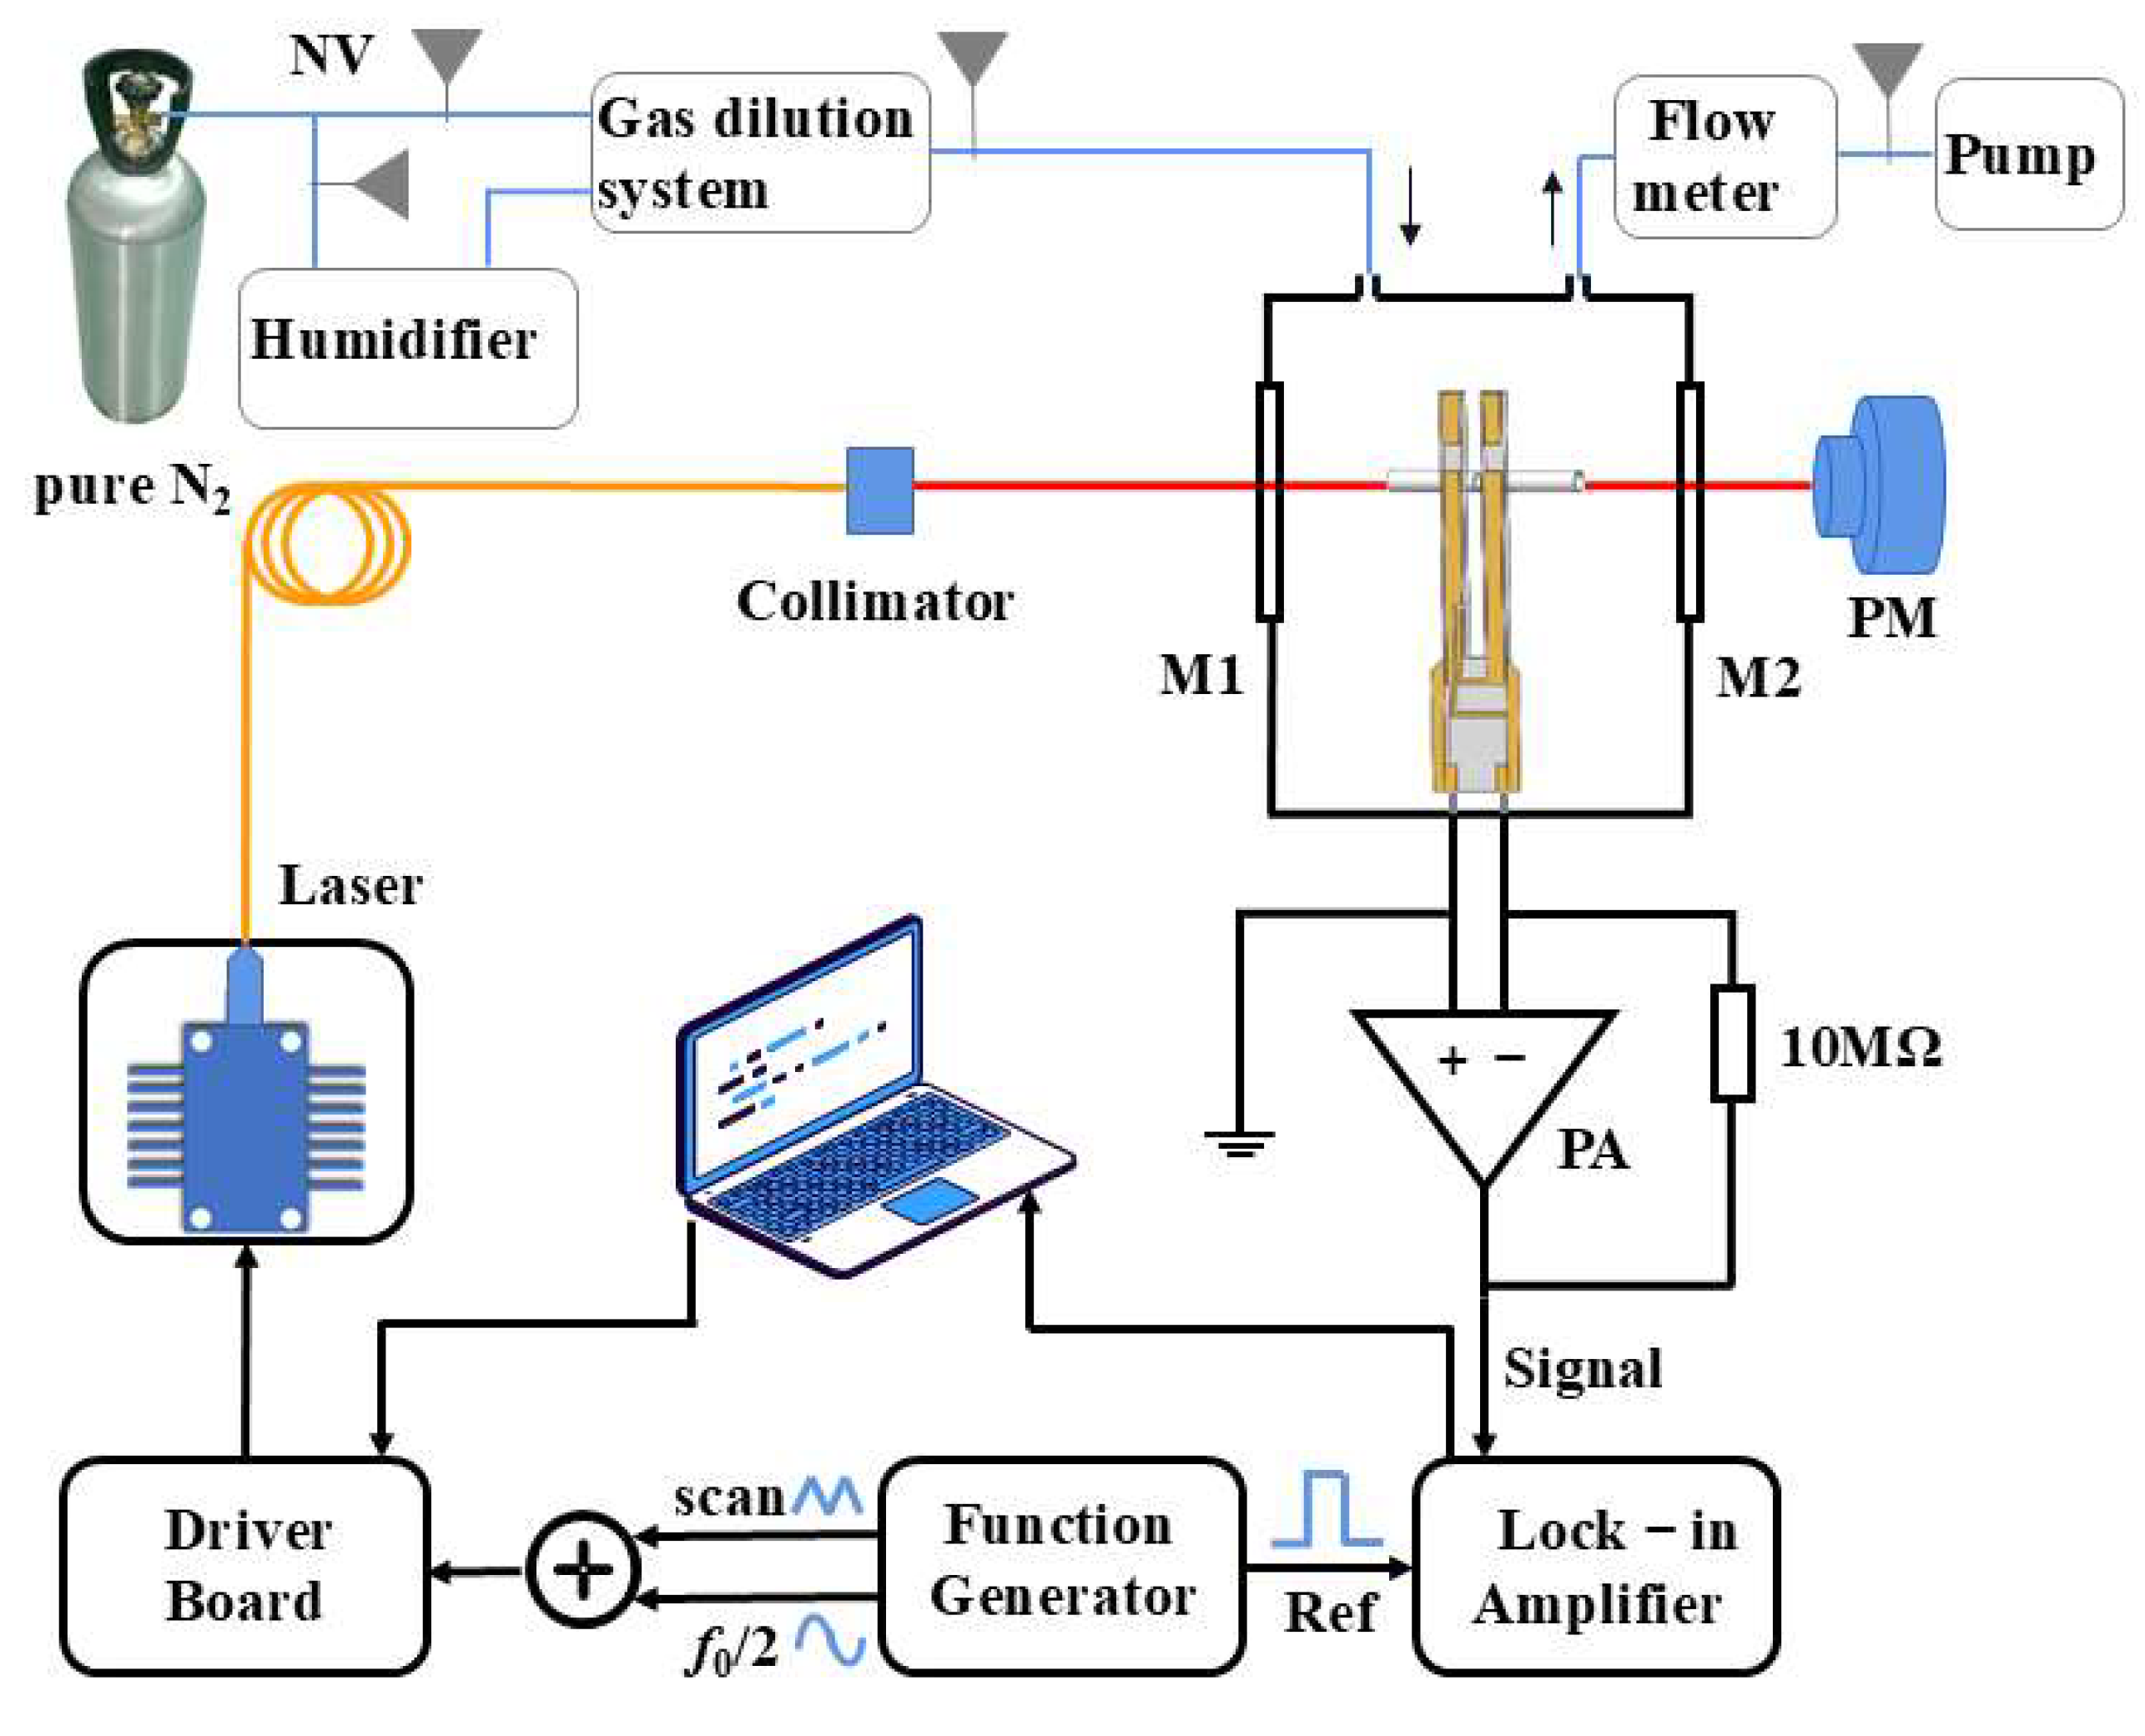
A 2f wavelength modulation spectroscopy (WMS) approach is usually applied in the QEPAS sensors because of the effective ability to suppress background noise. Therefore, a dual-channel arbitrary function generator (Model AFG3102, Tektronix, OR, USA) was employed to provide the modulation signal and the sweep signal, which were combined in an adder and then sent into the custom driver board, causing the change in the output wavenumber of the DFB laser. The frequency of the modulation signal was adjusted to half the resonant frequency of the custom QTF, and the sweep signal was applied to change the output wavenumber of the DFB laser in the range of 7180.14 cm−1–7181.76 cm−1, which is able to cover the whole absorption line of H2O.
The schematic diagram of the QEPAS sensor with off-beam spectrophone was constructed as shown in
Figure 2. The light output from the pigtail of the DFB laser was collimated to a beam with a diameter of 200 μm and a divergence angle of 9° using a fiber collimator (Model LPC-01, OZ optics Ltd., Ottawa, ON, Canada) in order to match the small size of the off-beam spectrophone. The beam output from the fiber collimator passed through the AmR of the off-beam spectrophone and then radiated on a power meter (Model 3AROHS, Ophir Optronics Solutions, Jerusalem, Israel) for real-time power monitor of the DFB laser. The off-beam spectrophone was sealed in a mechanical stainless-steel cavity to enable the sufficient absorption of the excitation light source by H
2O molecules. The custom QTF in the off-beam spectrophone was excited by a weak photoacoustic signal to generate mechanical vibration, which can be converted into an electrical signal due to the piezoelectric effect of the quartz material. The electrical signal was amplified by a preamplifier with a feedback resistor of 10 MΩ and then inputted into the lock-in amplifier (Model SR830, Stanford Research Systems, Sunnyvale, CA, USA) for signal demodulation. The reference signal of the lock-in amplifier is derived from the modulation signal synchronization port of the dual-channel arbitrary function generator. The photoacoustic signal was demodulation based on the 2
f mode with a filter slope of 12 dB/oct and a time constant of 300 ms, corresponding to a detection bandwidth of ∆
f = 0.833 Hz. Furthermore, the demodulated signal was analyzed on a computer using the LabView software (2013) for the inversion of H
2O concentration.
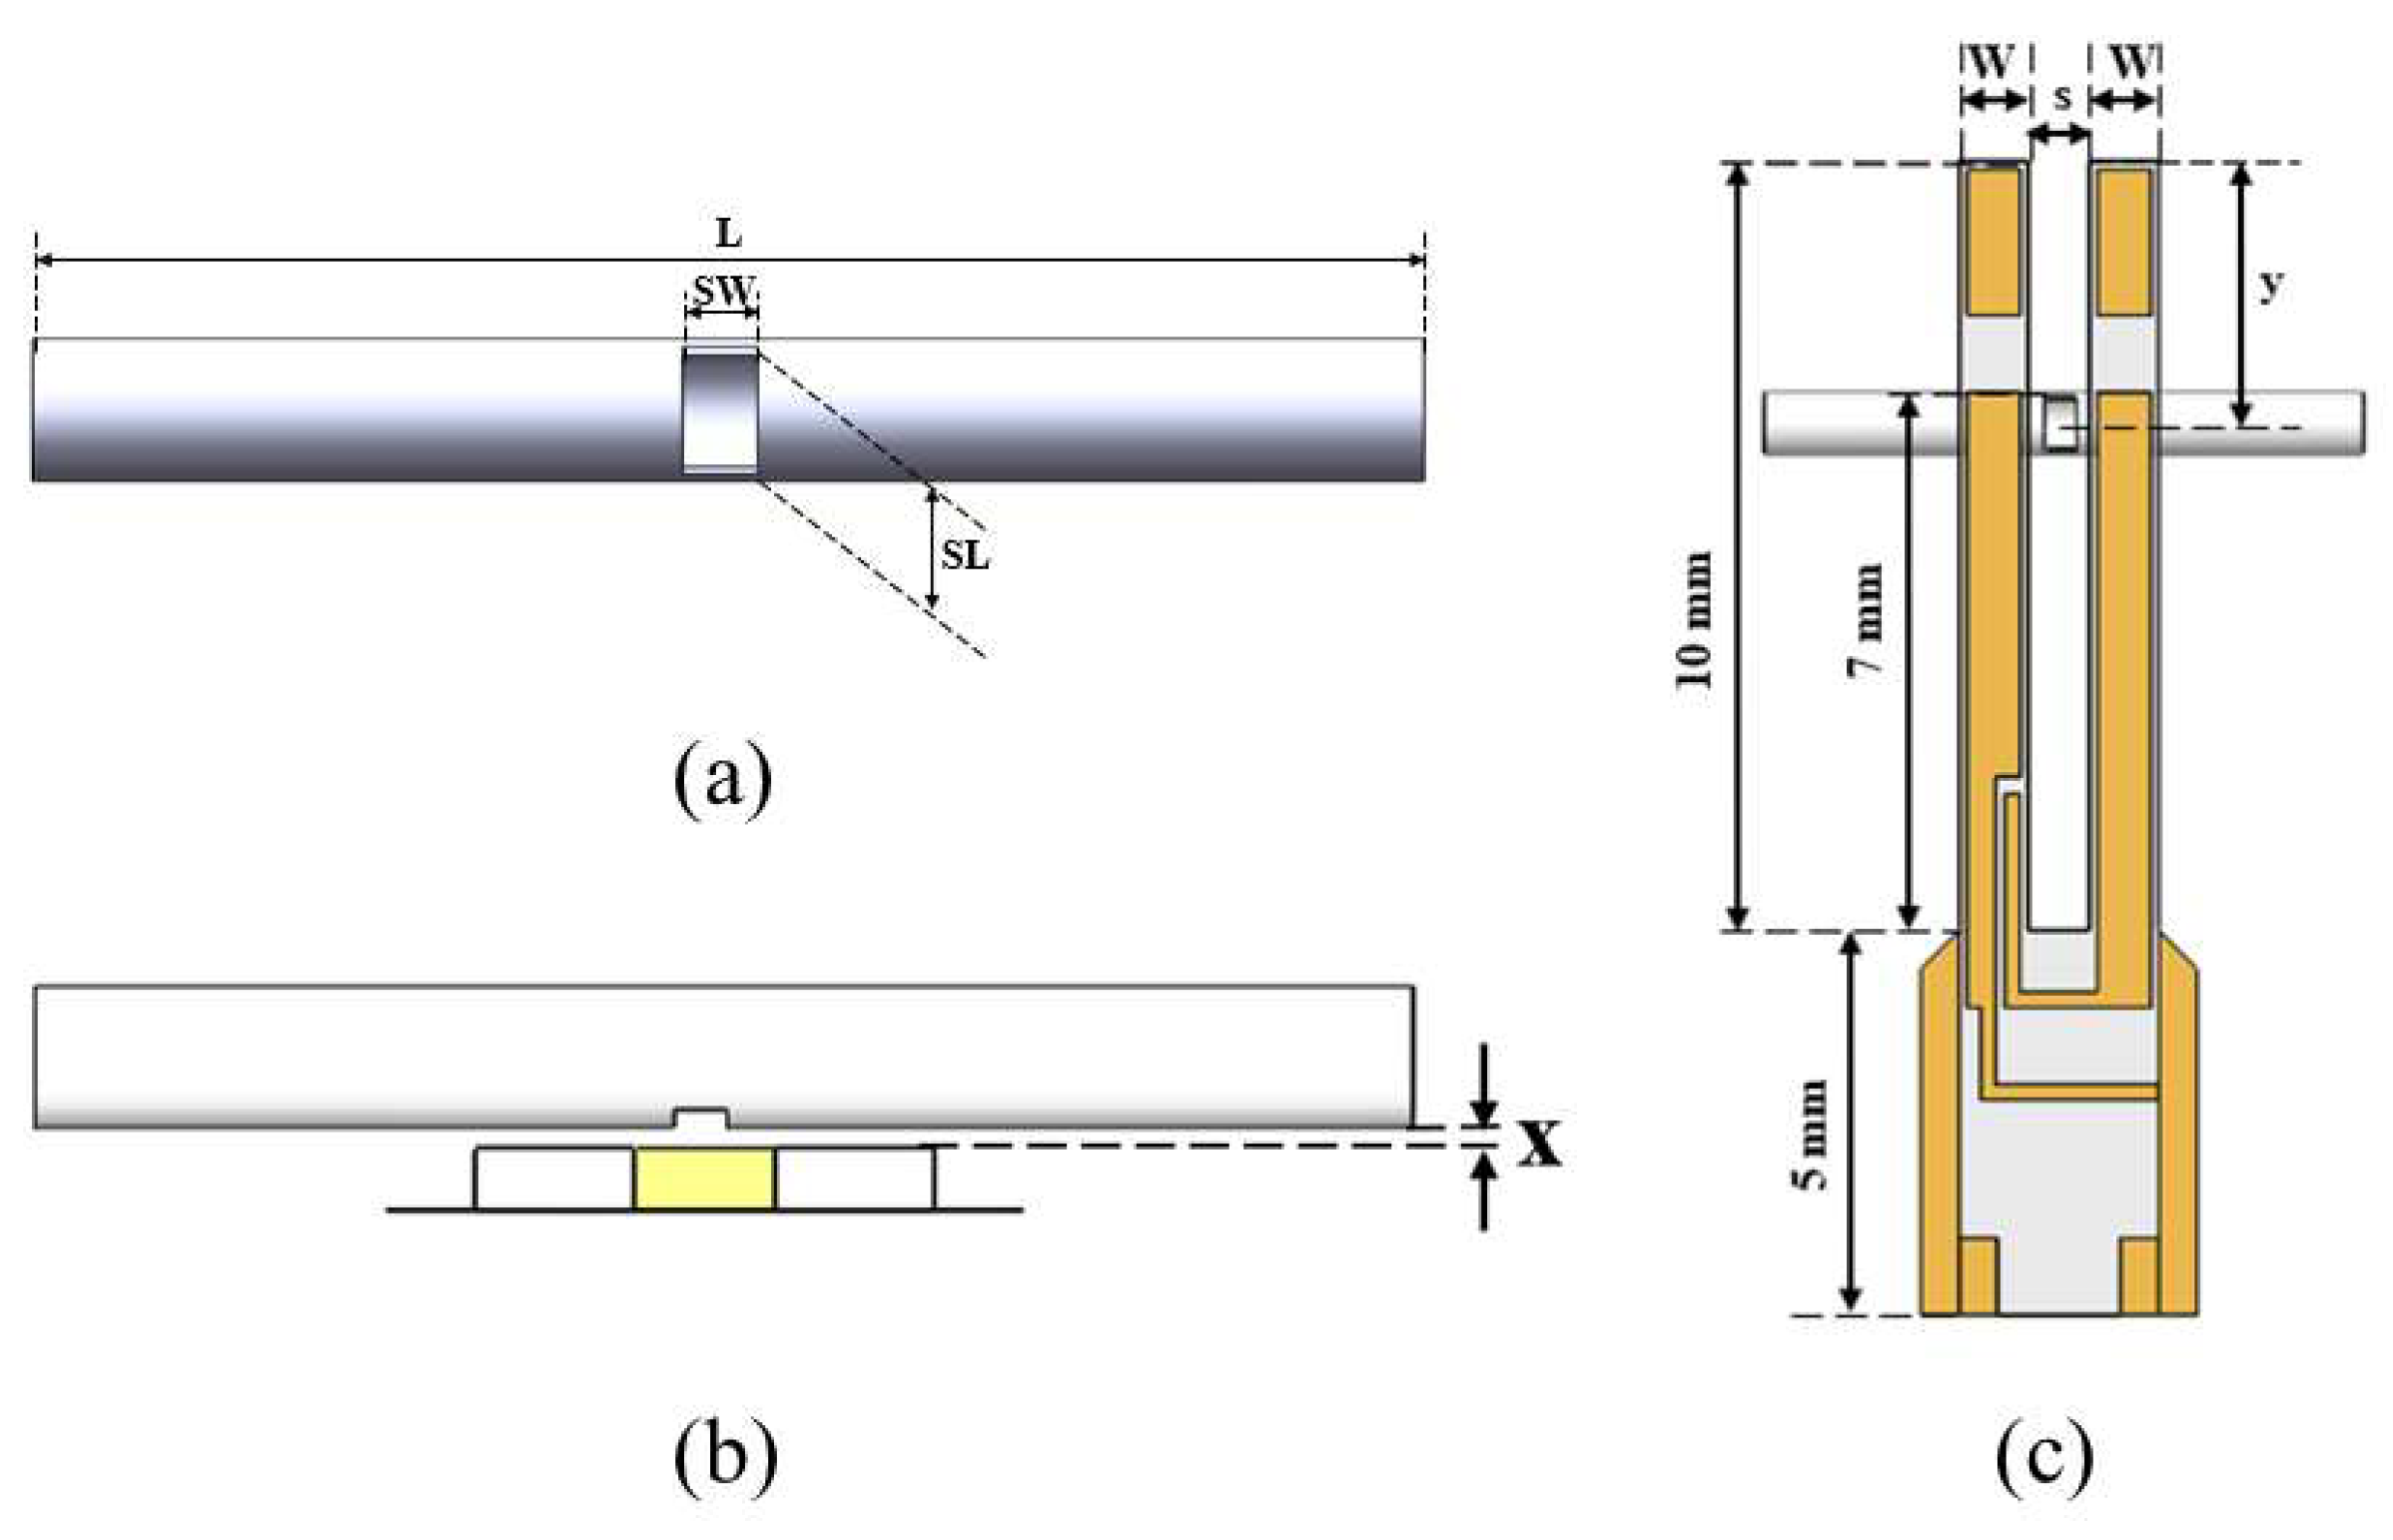
The typical off-beam spectrophone is constructed by coupling a single stainless-steel cylindrical tube as the AmR to a custom QTF. A custom QTF with geometric dimensions of 10 × 0.9 × 0.25 mm
3 was adopted as the acoustic detection element of the off-beam spectrophone, and the electronic parameter was determined based on the electric excitation method. As depicted in
Figure 3, the frequency response curve of this custom QTF was shown. According to the results, the resonance frequency and quality factor were 7.206 kHz and 8406 at atmospheric pressure, respectively.
Figure 4a shows the construction of the stainless-steel cylindrical tube with two open ends and a slit in the middle. The longitudinal acoustic standing waves can be formed in the stainless-steel cylindrical tube when the excitation light source interacts with gas molecules. The antinode of the longitudinal acoustic wave is at the center of the AmR; therefore, the slit was processed to release the acoustic wave for the real-time response of the custom QTF. The stainless-steel cylindrical tube was parallel to the custom QTF for off-beam configuration, as shown in
Figure 4b,c. The slit was aligned with the center of the custom QTF prongs. It is worth noting that the smaller the distance between the stainless-steel cylindrical tube and the custom QTF, the more obvious the response of the custom QTF. The incredibly short distance, however, caused a lower quality factor of the custom QTF, which means it will exhibit a poor signal response. Therefore, a lateral distance x of 0.4 mm was chosen for optimum response sensitivity, which is much smaller than the prong spacing of the custom QTF. Moreover, the optimal vertical distance y of the stainless-steel cylindrical tube relative to the top of this custom QTF prong was 1.2 mm [
25].
3. Results and Discussion
The signal-to-noise ratio (SNR) is a critical performance parameter for gas sensors. It is defined as the ratio of the signal to the 1σ noise, where the 1σ noise is calculated as the standard deviation of the QEPAS signal when the laser emission wavelength is tuned away from the H
2O absorption line. The SNR is expressed as follows:
The minimum detection limit (MDL) is also one of the important parameters to measure the performance of the sensor system, and its expression is as follows:
For QEPAS systems, the detection sensitivity of the system can be measured by measuring the signal value of the sample gas with a known concentration (
C) and the noise without absorption information in the same case. The normalized noise equivalent absorption (NNEA) is the value obtained after the minimum absorption coefficient (
αmin) is normalized to the detection bandwidth (∆
f) and laser power (
P). Its unit is cm
−1·W·Hz
−1/2, and its expression is as follows:
The αmin can be queried directly from the HITRAN database.
The effective acoustic coupling efficiency of the AmR for off-beam spectrophone is mainly determined by the length L, slit length SL, and slit width SW, as shown in
Figure 4a. The maximum acoustic resonance usually occurs when the length of the AmR is close to the acoustic wavelength
λ. Additionally, it has been demonstrated experimentally that the optimal length of the AmR is in the range of
λ/2~
λ. Hence, the length of the AmR ranging from 25 to 46 mm was experimentally evaluated based on the formula
λ = v/f, where
v and
f represent the sound speed in N
2 and the resonant frequency of the custom QTF, respectively. The prong spacing of the custom QTF is 0.8 mm, making it difficult for it to respond to a weak sound signal leaking from a narrower slit. Furthermore, a wider slit tends to scatter the sound signal, making it hard for it to capture sound in time. Therefore, the ideal slit width for matching this custom QTF has been experimentally established to be 0.43 mm. The slit length and the length of the AmR tend to depend on the inner diameter of the AmR. Hence, the performance of the AmRs (AmR#1, AmR#2, and AmR#3) with three various inner diameters was evaluated in order to obtain the excellent length and slit length shown in
Table 1. The optimal slit lengths were confirmed experimentally to be 0.56 mm for AmR#1 and 0.68 mm for AmR#2 and AmR#3, respectively.
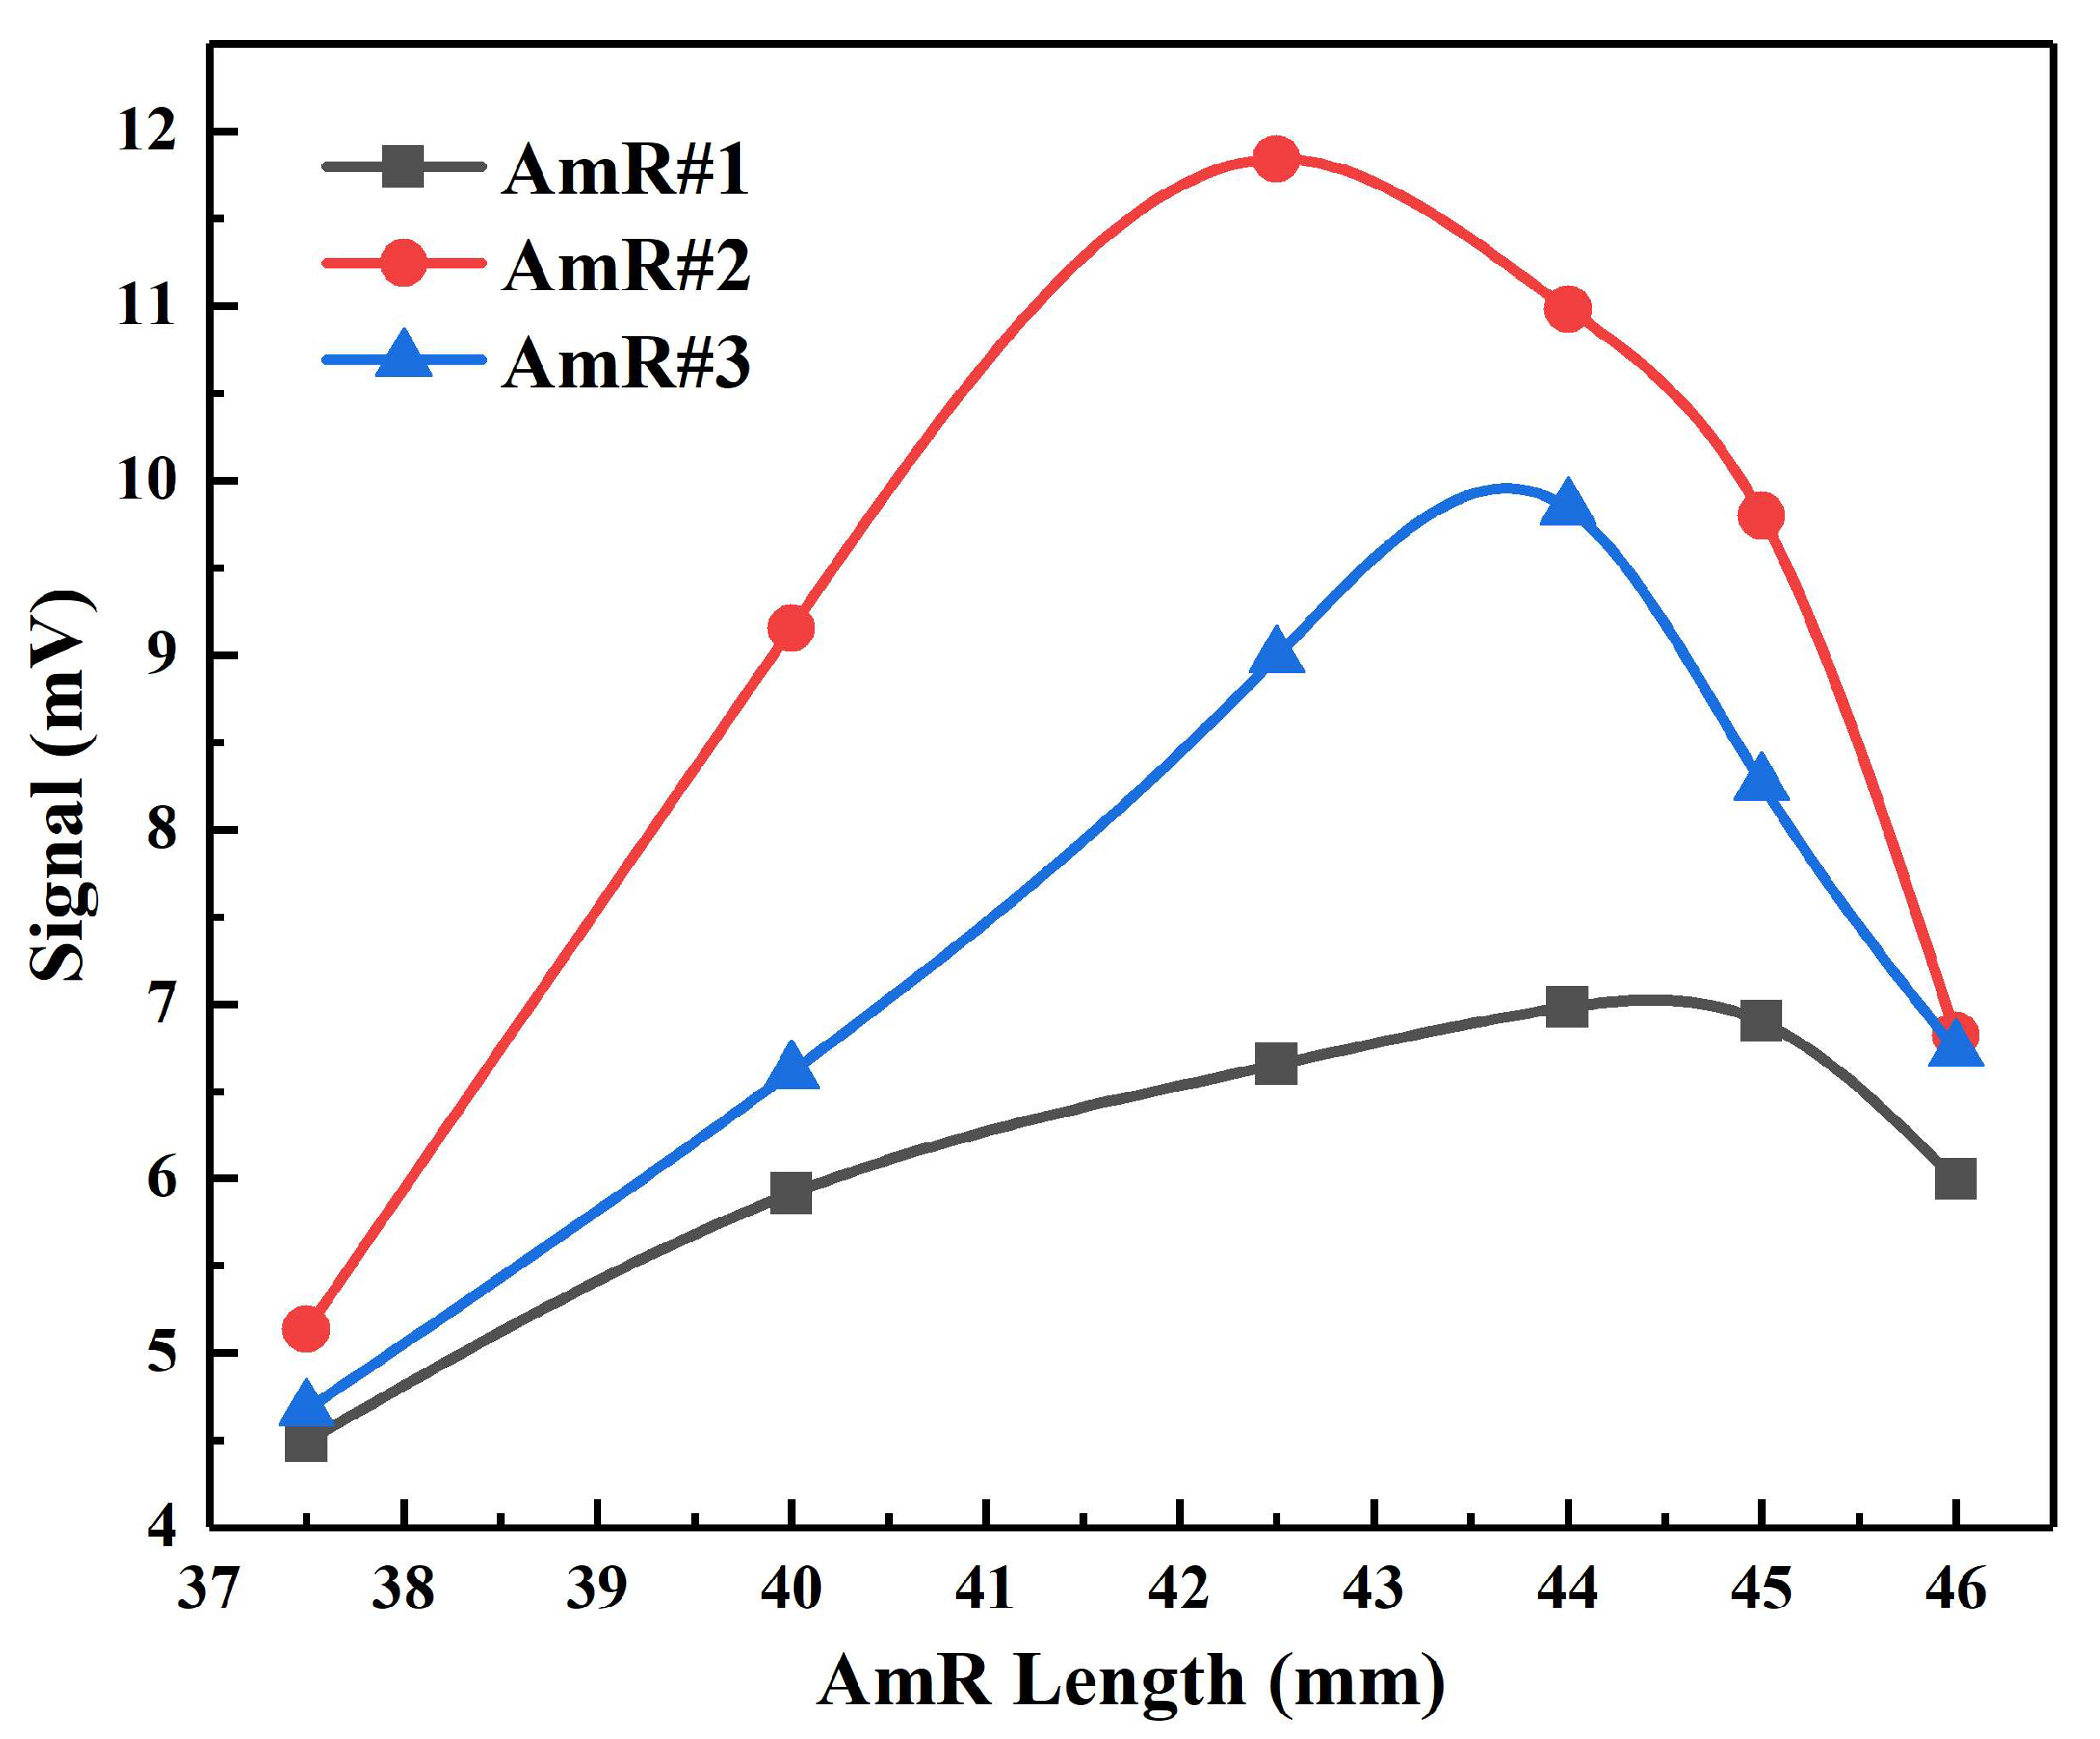
The influence of the inner diameter and length of the AmR on the photoacoustic signal is shown in
Figure 5. The signal amplitude increased and subsequently declined with increasing the length of the AmR, and the abscissa of the inflection point was the appropriate length for the same inner diameter. The results revealed that the maximum photoacoustic signal amplitudes for AmR#1, AmR#2, and AmR#3 were acquired at lengths of 44 mm, 42.5 mm, and 44 mm, respectively. The enhancement impact of AmR#2 was found to be stronger than that of AmR#1 and AmR#3 by comparing the signals of different inner diameters.
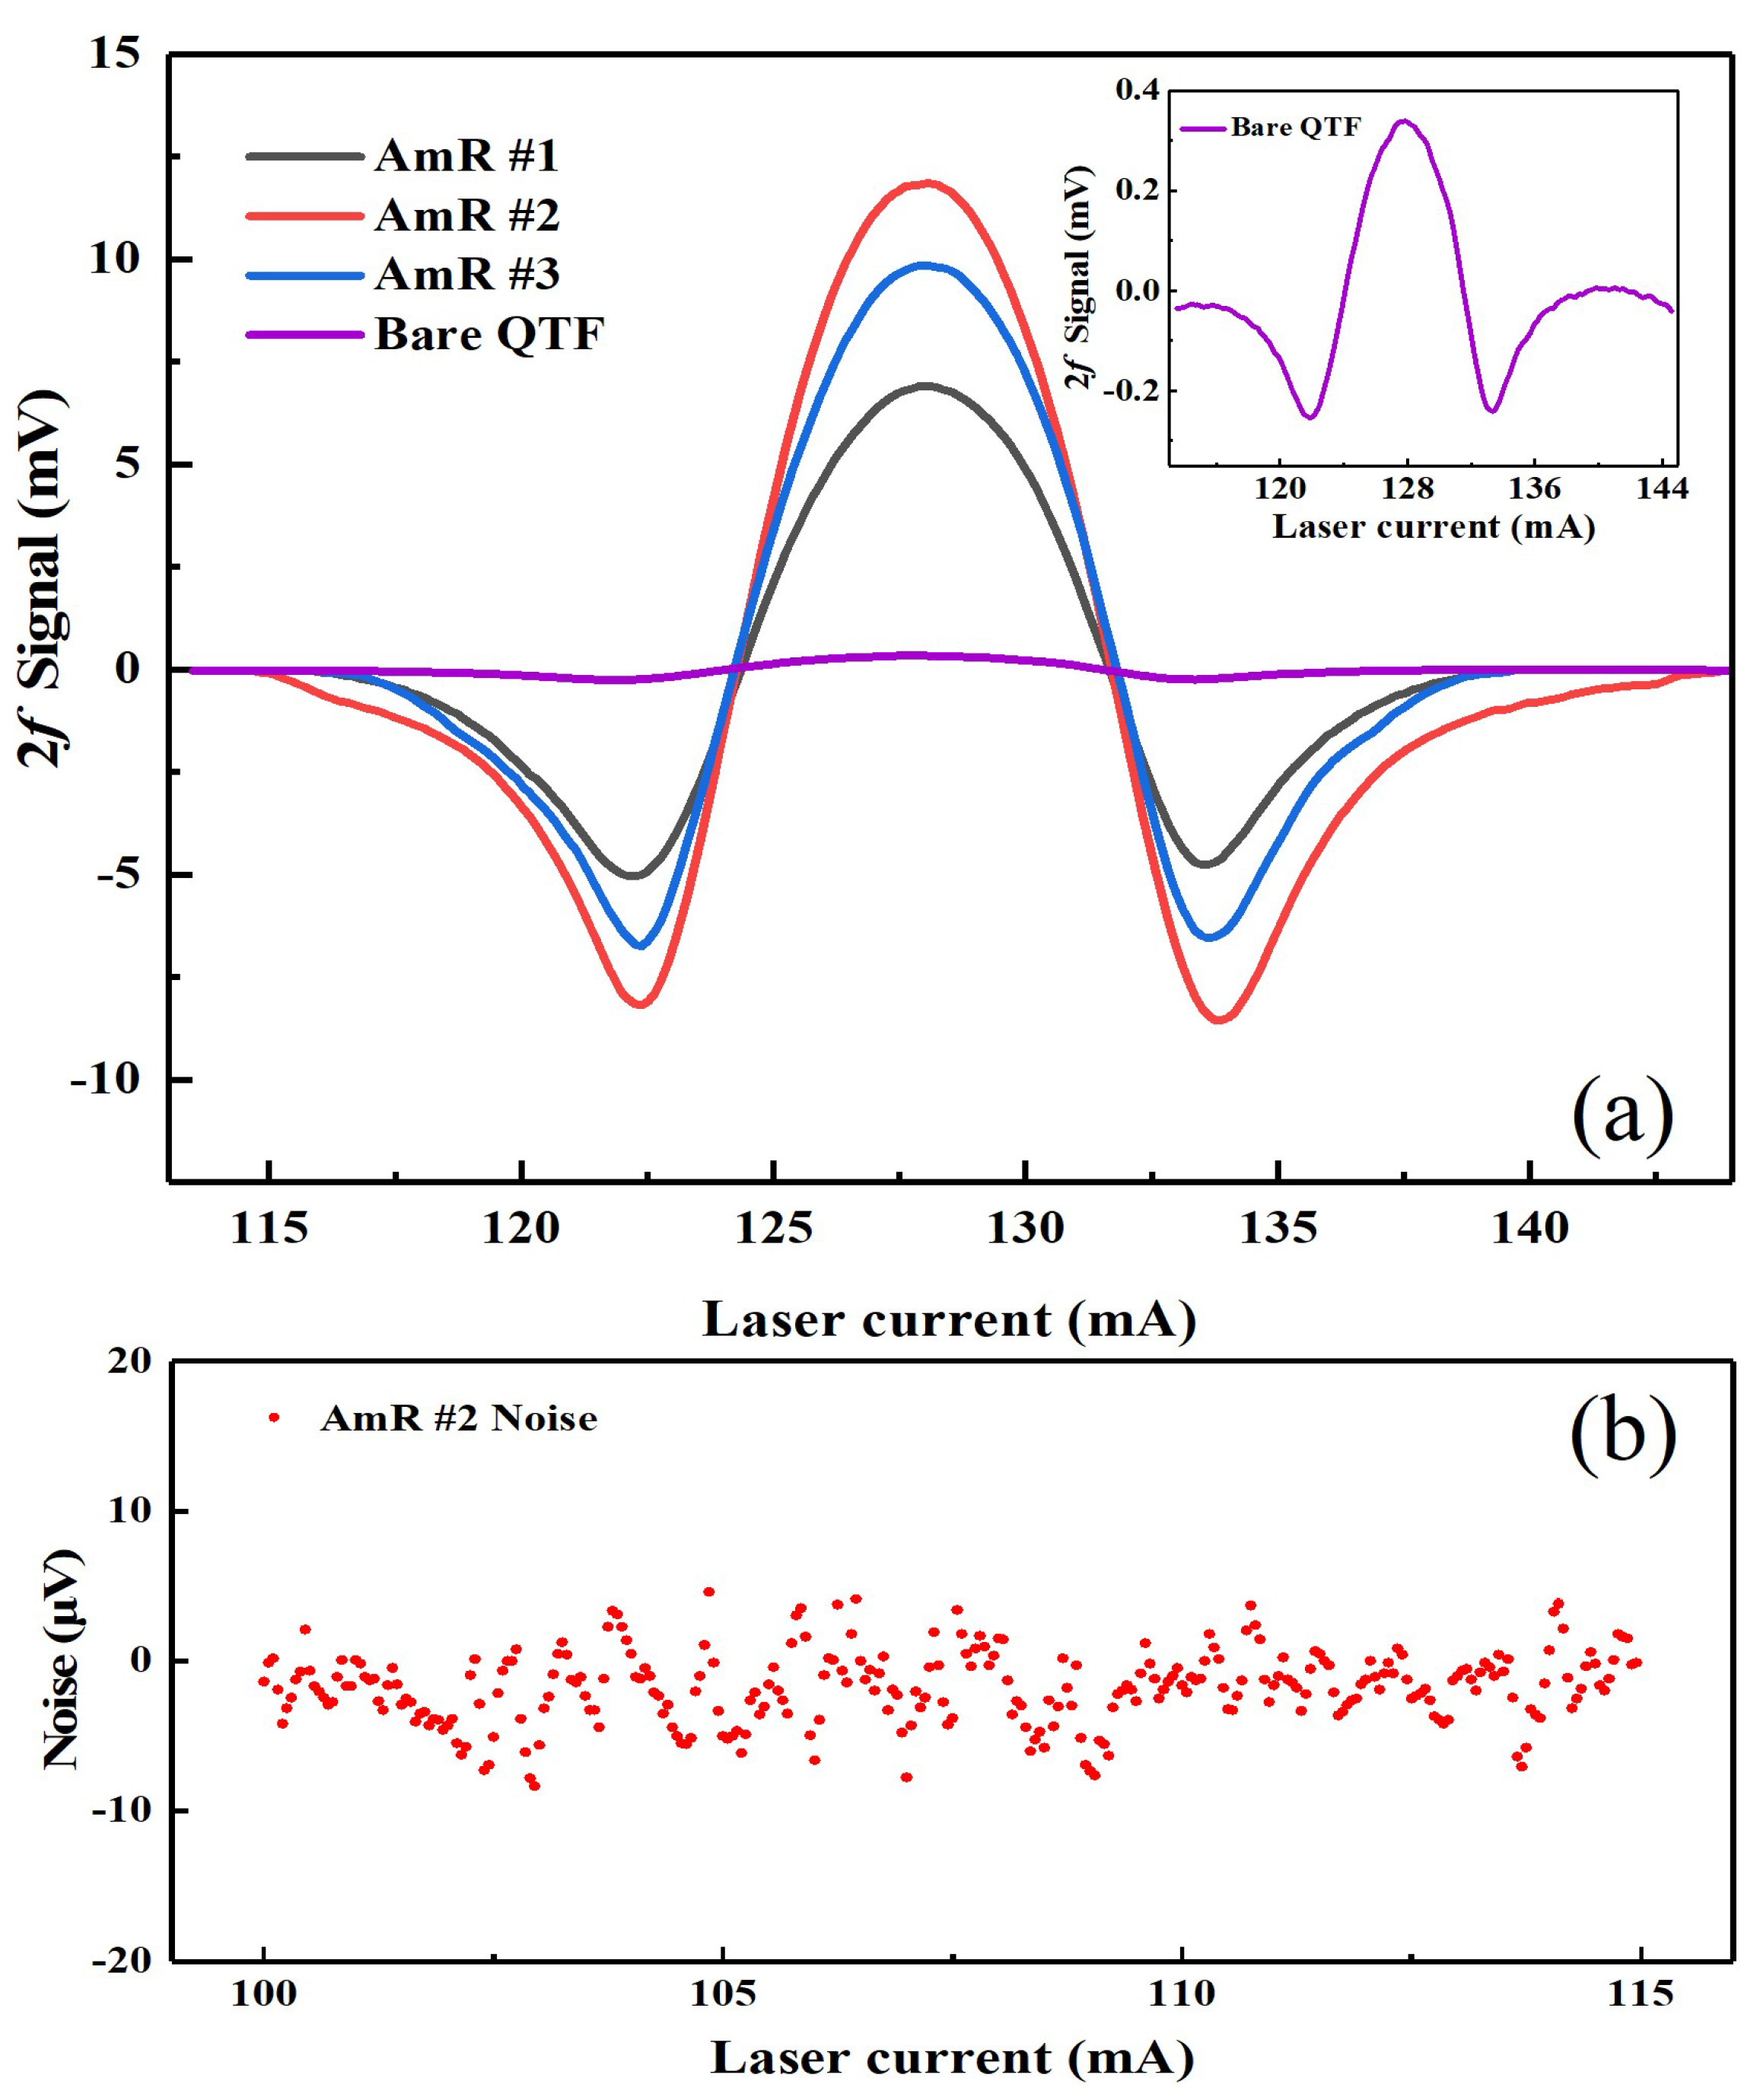
Figure 6a depicts the acquired complete 2
f photoacoustic signal based on an off-beam spectrophone with the optimal AmR#1, AmR#2, and AmR#3. The desirable geometric dimensions of the AmRs shown in
Table 1 were as follows: ID = 0.7 mm, L = 44 mm (AmR#1); ID = 0.9 mm, L = 42.5 mm (AmR#2); ID = 1.1 mm, L = 44 mm (AmR#3). The 2
f photoacoustic signal based on the bare custom QTF was also presented in
Figure 6a to visually demonstrate the gain effect of the AmRs. The greatest signal amplitude based on the off-beam spectrophone with the AmR#2 was 11.8 mV, which was 24 times more than that of the bare custom QTF. Moreover, the background noise was obtained by tuning the output wavelength of the DFB laser in the gas-free absorption waveband. The noise level of the QEPAS sensor based on the off-beam spectrophone with the AmR#2 is shown in
Figure 6b. The calculated standard deviation (1σ) was 6 μV, and the signal-to-noise ratio (SNR) was 1856, resulting in a normalized noise equivalent absorption coefficient (NNEA) of 5.7 × 10
−8 cm
−1·W·Hz
−1/2. Furthermore, the performance parameters of QEPAS sensor based on the bare custom QTF and the off-beam spectrophone with the AmR#1, AmR#2, and AmR#3 were obtained as shown in
Table 1.
According to the experimental results in
Table 1, the off-beam QEPAS spectrophone with AmR#1, AmR#2, and AmR#3 all exhibited distinct gains factors compared to the bare custom QTF, even though the decrease in the quality factor owing to the coupling of the AmR to the custom QTF. Although the length of 44 mm for AmR#1 and AmR#3 was closer to the acoustic wavelength, the AmR with a long length tended to produce more background noise due to the complex light alignment. In order to match this custom QTF, the excellent AmR parameters were OD = 1.2 mm, ID = 0.9 mm, L = 42.5 mm, SL = 0.68 mm, and SW = 0.43 mm. The SNR gain factor of 16 was obtained by comparing it with that of the bare custom QTF.


 ,
, 


