Abstract
Atmospheric aerosols significantly influence climate systems and hydrological processes, but their impacts on evapotranspiration remain insufficiently understood, particularly in tropical savanna regions. This study investigates the direct and indirect effects of aerosol optical depth (AOD) on reference evapotranspiration () in the Mato Grosso Cerrado, Brazil, a biome characterized by pronounced seasonal climatic variations. Using data collected from the AERONET network at Fazenda Miranda, AOD was analyzed alongside meteorological variables such as air temperature, global radiation, and , estimated using the FAO Penman–Monteith method. The results reveal distinct seasonal patterns, with aerosols having a more pronounced influence during the dry season. Positive correlations were observed between AOD and air temperature, while negative correlations were found between AOD and global radiation, especially during the dry season. The relationship between AOD and varied between years and seasons, with significant reductions in linked to high aerosol concentrations during the dry period. These findings demonstrate that aerosols play a critical role in modulating evapotranspiration and radiation balance, particularly in regions affected by biomass burning. This study provides valuable insights into the interplay between aerosols, climate variables, and hydrological processes, contributing to a better understanding of aerosols’ impacts on tropical ecosystems.
1. Introduction
Atmospheric aerosols, composed of solid and liquid particles suspended in the air, play a pivotal role in shaping Earth’s climate and environmental processes [1,2,3]. These particles originate from both natural sources, such as wildfires, volcanic eruptions, and desert dust, and anthropogenic activities, including biomass burning, fossil fuel combustion, and agricultural practices. Additionally, atmospheric aerosols can be formed through the photo-oxidation of volatile organic compounds (VOCs), such as alkenes and aldehydes, emitted by vegetation. Once released by plants, these compounds undergo photochemical reactions in the atmosphere, leading to the formation of secondary organic aerosols (SOAs). These SOAs significantly influence atmospheric chemistry, affecting cloud formation and the planet’s radiative balance [4]. Aerosols influence atmospheric dynamics through their effects on air quality, visibility, cloud formation, precipitation, and energy balance [2,5,6,7]. Despite extensive research, their impacts on hydrological processes, particularly evapotranspiration, remain insufficiently understood, especially in tropical regions like the Cerrado biome.
The Cerrado, a tropical savanna located in central Brazil, is a biodiversity hotspot and a region of significant agricultural and ecological importance. However, it is increasingly affected by deforestation, land-use changes, and biomass burning, which elevate aerosol concentrations, particularly during the dry season [8,9,10]. These aerosols influence the radiation balance by scattering and absorbing solar radiation, which can alter evapotranspiration rates, an essential process for regional water cycling and agricultural planning [11,12]. Understanding the interactions between aerosols, radiation, and evapotranspiration is critical for evaluating their broader impacts on climate and ecosystem functioning.
While previous studies have explored the effects of aerosols on radiation and temperature, research focused on their influence on reference evapotranspiration (), a key indicator of atmospheric demand for water, has been limited [13]. integrates climatic variables such as solar radiation, air temperature, and wind speed, making it a valuable parameter for assessing the impacts of aerosols on hydrological processes. However, the seasonal variability of aerosol’s effects on in regions like the Cerrado remains poorly documented [14,15,16,17,18].
This study aims to analyze the direct and indirect effects of aerosol optical depth (AOD) on in the Mato Grosso Cerrado. By examining seasonal patterns and interannual variability, this research provides insights into the role of aerosols in modulating evapotranspiration and radiation dynamics in a tropical savanna environment. The findings contribute to a better understanding of the interactions between aerosols, climate variables, and hydrological processes, offering valuable implications for climate modeling and sustainable resource management in the region.
2. Materials and Methods
2.1. Study Area
This study was conducted at Fazenda Miranda (15°17′ S, 56°06′ W), situated in the municipality of Cuiabá, Mato Grosso, Brazil (Figure 1). The vegetation in this region is primarily composed of grasses and sparse shrubs, classified locally as Cerrado or ‘campo sujo’. According to Köppen’s climate classification, the region falls under the Aw category, characterized by a tropical savanna climate. The average annual precipitation is approximately 1420 mm, and the mean annual air temperature is 26.5 °C. The dry season extends from May to October. The study site is located on flat terrain at an altitude of 157 m [19].

Figure 1.
Location of Fazenda Miranda [19].
For this study, the classification of dry and rainy seasons followed the methodology proposed by [15], which is based on the optical properties of aerosols. The dry season was defined as the period during which fire emissions significantly altered aerosols’ optical properties, covering the months from July to October. The remaining months were categorized as the rainy season.
2.2. AOD Measurements
AOD data at 500 nm were obtained using a photometer from the AERONET (Aerosol Robotic Network), installed at Fazenda Miranda and manufactured by CIMEL, France. This device measures AOD at various wavelengths. The AERONET is a global network of standardized automatic spectral radiometers designed for solar disk observation. It provides near-real-time measurements of AOD, particle size distribution, and water vapor content across diverse aerosol regimes worldwide. Data collected by the AERONET undergo a rigorous processing workflow, including real-time data acquisition, preliminary calibration, final calibration (approximately six months post-collection), and quality assurance. These datasets are subsequently made available through NASA’s central repositories [20,21].
2.3. Estimation of Reference Evapotranspiration
Reference evapotranspiration () was estimated using the Penman–Monteith (PM) equation, following the guidelines established by the Food and Agriculture Organization (FAO). This method is well-documented, extensively validated, and widely applicable across various climates and land-use scenarios [19,22]. The PM equation is expressed as follows:
where : reference evapotranspiration (mm day−1); : net radiation (MJ m−2 day−1); G: soil heat flux density (MJ m−2 day−1); T: mean daily air temperature (°C); : wind speed at 2 m height (m s−1); : saturation vapor pressure deficit (kPa); : slope of the vapor pressure curve (kPa °C−1; : psychrometric constant (kPa °C−1).
2.4. Statistical Analyses
The dataset, comprising daily averages of AOD at 500 nm, black carbon (BC), micrometeorological variables, and estimates, was segmented into two periods: the dry season (July to October) and the wet season (the remaining months). Descriptive statistics, including minimum, maximum, mean, and standard deviation values, were calculated to summarize the data distribution. Pearson correlation coefficients were used to assess relationships between variables, with statistical significance determined at p-values < 0.05.
3. Results and Discussion
Figure 2 (black) illustrates the seasonal variation in AOD. The gray-shaded area represents the dry season (July to October), during which a notable increase in AOD levels was observed across all years analyzed. In all study years, AOD levels rose significantly during the dry season, with 2010 having the highest peak throughout the entire time series. In other years, although AOD levels during the dry season were elevated, they were not as pronounced as in 2010. This seasonal pattern of increased AOD is strongly associated with biomass emissions during the dry season, characterized by vegetation burning. Supporting this relationship, ref. [23] analyzed the elemental composition of aerosols in the Pantanal, a region near the Cerrado in the state of Mato Grosso. The study indicated that 99% of emissions during the 2022 dry season were attributed to a mixture of BC and dust, with significant concentrations of iron (Fe), sulfur (S), and potassium (K)—key indicators of biomass burning. Additionally, it was noted that in the fine fraction of aerosols, biomass burning emissions were responsible for high levels of potassium (K), sulfur (S), and magnesium (Mg).
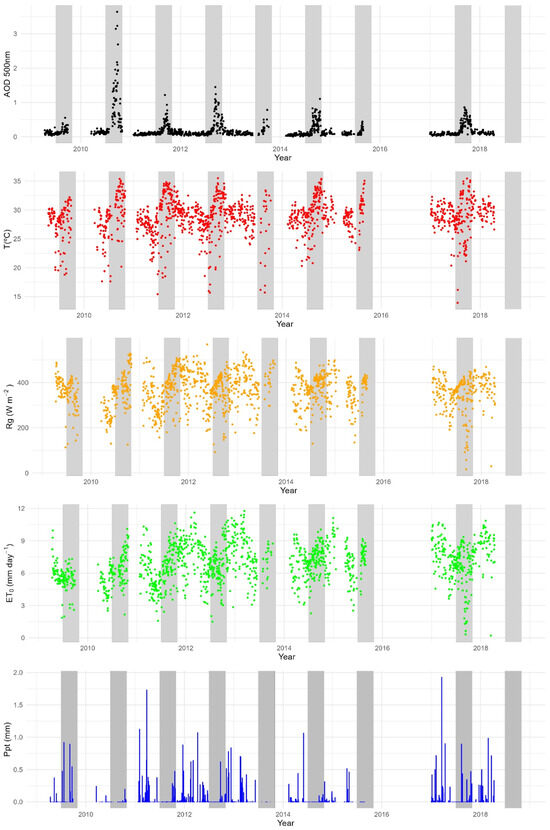
Figure 2.
Interannual variations in aerosol optical depth at 500 nm (black), air temperature (red), global radiation (yellow), reference evapotranspiration (green), and precipitation (blue) from 2009 to 2018.
Table 1 summarizes the monthly minimum, maximum, mean, and standard deviation values of AOD. The average AOD values exhibited seasonal variations, with the highest values observed in August and September. The highest average AOD was recorded in September, at 0.67, followed by August, at 0.24. These values suggest that there were higher atmospheric particle concentrations during these months, which is likely linked to an increase in fires, which is typical of the dry season in the region. Previous studies, such as those by [14,24], highlight that the dry season in the Amazon is marked by a substantial increase in atmospheric particles due to biomass burning, which aligns with the results observed at Fazenda Miranda. This aerosol increase during the dry season is also a common phenomenon in various regions of South America, where burning activities affect air quality and contribute to regional climate changes [25].

Table 1.
Observational statistics of aerosol optical depth (500 nm) from 2009 to 2018.
In contrast, the lowest average AOD values were recorded in February and March, with averages of 0.08. These months correspond to the wet season, during which rainfall plays a crucial role in aerosol removal. The scientific literature emphasizes the importance of rainfall in reducing aerosol concentrations, particularly in tropical regions, which explains the lower AOD values during the rainy season [18,26].
As detailed in Table 1, the maximum AOD values were highest in September, with a peak of 3.64. Both August and October also showed significant maximum AOD values of 1.56 and 1.94, respectively, indicating considerable variability in aerosol concentrations during these months. On the other hand, the minimum AOD values were generally low across all months, with the lowest values recorded in April, May, and June, each at 0.01. This pattern suggests that the months preceding the dry season (April to June) experience lower aerosol concentrations, which increase sharply as the dry season progresses.
The highest standard deviation in AOD was observed in September (0.58), followed by October (0.26). These high values indicate considerable variability in aerosol concentrations, with some days showing extremely high levels and others showing lower concentrations. In contrast, the months of January, February, and March exhibited the lowest standard deviations (0.05, 0.04, and 0.04, respectively), suggesting more stable aerosol concentrations during the rainy season.
To further examine these seasonal differences, the AOD data were separated into dry and rainy seasons, as presented in Table 2. During the rainy season, the average AOD for the entire study period was 0.10. The minimum AOD recorded during this period was 0.01, while the maximum reached 0.58. In contrast, the dry season exhibited a significantly higher average AOD of 0.35. The minimum AOD in the dry season was 0.02, much higher than the minimum observed during the rainy season, while the maximum value reached 3.64, indicating that some days had extremely high aerosol concentrations. This seasonal AOD pattern reflects both human activities, such as biomass burning during the dry season, and regional weather conditions. The absence of rainfall in the dry season hinders the removal of aerosols from the atmosphere, contributing to the elevated AOD values [9,15].
Table 2.
Observational statistics of AOD for the rainy and dry seasons.
Air temperature also showed a clear seasonal pattern, with the highest temperatures being recorded during the dry period, as seen in Figure 2 (red). Table 3 indicates that September and October had the highest average air temperatures, reaching 30.47 °C and 31.26 °C, respectively. These months also recorded the highest maximum temperatures, with September reaching 35.51 °C and October 35.40 °C. In contrast, June had the lowest average temperature (26.99 °C), followed closely by July (27.07 °C) and May (27.19 °C). These months also saw lower minimum temperatures, with the lowest temperatures being recorded in June and July, at 15.42 °C and 13.93 °C, respectively.
Table 3.
Observational statistics of air temperature (°C) for the period from 2009 to 2018.
August exhibited a notable temperature range, with values varying from 15.71 °C to 35.06 °C, resulting in an average of 29.70 °C. This month also recorded the highest standard deviation of all months (3.98 °C), indicating considerable temperature variability. September and July also showed high standard deviations of 3.59 °C and 3.60 °C, respectively, reflecting significant temperature fluctuations during these months.
In contrast, January, February, and March displayed lower thermal variability, with the lowest standard deviations recorded at 1.58 °C, 1.36 °C, and 1.51 °C, respectively. The minimum and maximum temperatures during these months were relatively close, with January ranging from 24.97 °C to 32.28 °C.
During the rainy season (Table 4), the temperature ranged from 15.42 °C to 33.26 °C, with an average of 28.37 °C. The standard deviation of 2.32 °C suggests moderate temperature variation. These milder temperatures are likely influenced by cloud cover and frequent precipitation, which moderate both daytime and nighttime temperatures. In contrast, the dry season temperatures were more extreme, ranging from 13.93 °C to 35.51 °C, with a higher average of 29.53 °C. The greater standard deviation of 3.87 °C reflects a more substantial daily temperature range, typical of a tropical savanna climate during the dry season, with cooler nights and hotter days.
Table 4.
Observational statistics of air temperature (°C) for the rainy and dry seasons.
The variation in air temperatures in tropical savanna areas tends to be greater during the dry season compared to the rainy season, primarily due to the influence of frequent cold fronts moving from the south. These cold fronts can cause abrupt weather changes, resulting in significant temperature fluctuations. Despite these temporary coolings, the dry season is generally characterized by higher temperatures due to the lower presence of clouds and humidity. September exhibited the highest standard deviation in global radiation, at 96.95 W/m2, indicating significant fluctuations in radiation relative to the average. In contrast, June recorded the lowest standard deviation, at 55.81 W/m2, suggesting more stable radiation levels throughout the month. During the rainy season, high humidity and convection act as stabilizing factors, minimizing temperature fluctuations [19,27].
The monthly analysis of radiation values showed significant variation throughout the year in both minimum and maximum values, as well as in monthly averages and standard deviations (Table 5). February recorded the highest average global radiation (Rg) at 401.66 W/m2, followed closely by November with 400.60 W/m2. In contrast, May recorded the lowest average radiation at 316.81 W/m2.
Table 5.
Observational statistics of global radiation (W.m2) for the period from 2009 to 2018.
Regarding extreme values, the highest Rg was recorded in October, at 528.25 W/m2, while the lowest minimum value was observed in September, at 16.6 W/m2. The significant variation in September suggests a high radiation amplitude, with a substantial difference between the minimum and maximum values. May and January also exhibited wide variations, with maximum values reaching 568.53 W/m2 and 478.01 W/m2, respectively.
September exhibited the highest standard deviation at 96.95 W/m2, indicating significant fluctuations in radiation compared to the average for that month. In contrast, June recorded the lowest standard deviation at 55.81 W/m2, suggesting more stable radiation levels throughout the month. The interannual analysis (Figure 2 (yellow)) showed variability in the Rg peaks, particularly during dry periods. Some years had higher values, while others showed a reduction in maximum radiation intensity.
During the rainy season (Table 6), the average Rg was 359.77 W/m2, with values ranging from 30.28 W/m2 to 568.53 W/m2. The standard deviation of 77.73 W/m2 reflects the moderate variability in radiation during this period. In the dry season, the average Rg increased to 372.94 W/m2, with a wider range from a minimum of 16.6 W/m2 to a maximum of 528.25 W/m2. The standard deviation of 75.47 W/m2 is similar to that of the rainy season, indicating moderate variability, although higher radiation levels generally occurred on dry days.
Table 6.
Observational statistics of global radiation (W.m2) for the rainy and dry seasons.
The amount of solar radiation in the Cerrado varies significantly between the rainy and dry seasons, with peaks occurring during the transitional periods between these seasons. These peaks are influenced by changes in climatic conditions and vegetation, which alter the absorption and reflection of solar energy [28,29].
The analysis of the reference evapotranspiration data () (Figure 2 (green)) reveals notable seasonal patterns. According to Table 7, February recorded the highest average evapotranspiration, at 8.41 mm/day, while May had the lowest average, at 5.80 mm/day. The highest individual value occurred in March, reaching 11.77 mm/day, whereas the lowest minimum value was observed in September at 0.32 mm/day. Variability in , as reflected by the standard deviation, was highest in March, at 2.00 mm/day, while June exhibited the lowest standard deviation, at 1.26 mm/day.
Table 7.
Observational statistics of reference evapotranspiration (mm/day) for the period from 2009 to 2018.
During the rainy season (Table 8), the average was 7.01 mm/day, with a minimum value of 0.21 mm/day and a maximum of 11.77 mm/day. The standard deviation of 1.90 mm/day indicates relatively high variability in the values. In the dry season, the average was slightly lower, at 6.71 mm/day, with a minimum value of 0.32 mm/day, a maximum of 10.72 mm/day, and a standard deviation of 1.68 mm/day.
Table 8.
Observational statistics of reference evapotranspiration (mm/day) for the rainy and dry seasons.
The differences observed between the rainy and dry seasons are characteristic of the tropical savanna climate. Solar radiation significantly influences , contributing to the annual and seasonal variations in in tropical and subtropical regions, including the Cerrado [30]. During the dry season, rates are affected by factors such as water stress on plants, reduced vegetation cover (which decreases transpiration capacity), as well as lower air humidity and solar radiation [31].
Relative humidity (RH) is a key factor in controlling evapotranspiration and is directly linked to local atmospheric dynamics. The RH graph over the years (see Figure A1), reveals a distinct seasonality, with the minimum values observed between August and September. These months correspond to the period of the highest AOD levels, highlighting the interaction between aerosol concentrations and atmospheric processes. RH significantly influences the hygroscopic growth of aerosols, which refers to their ability to absorb water and increase in size under humid conditions. Climatic seasonality directly affects , with hygroscopic aerosols enhancing atmospheric humidity by absorbing water vapor, thereby reducing the availability of water for evapotranspiration [32,33]. Although the AOD in this study is used as a global indicator of aerosol load in the atmospheric, it is well-established that aerosols in the region predominantly originate from biomass burning, such as BC. While BC itself is not hygroscopic, it is often associated with hygroscopic compounds like sulfates and nitrates, which influence the ability of aerosols to interact with atmospheric moisture.
Correlation Between AOD, , and Meteorological Parameters
As shown in Figure 3, the correlation between AOD and air temperature during the rainy season was statistically significant in four specific years: 2012 (r = 0.32), 2013 (r = 0.31), 2014 (r = 0.33), and 2017 (r = 0.32). In contrast, the dry season showed stronger correlations, with statistically significant values in 2010 (r = 0.38), 2012 (r = 0.48), 2013 (r = 0.48), 2014 (r = 0.52), and 2015 (r = 0.38). Although the observed correlations ranged from moderate values of approximately 0.3 to 0.5, their consistency over the years and across seasons highlights a persistent pattern. The positive correlations suggest that increases in AOD levels are associated with rises in air temperature. This finding indicates a greater influence of aerosols on temperature variations during periods of low precipitation. Additionally, the MSE values recorded during the rainy season were generally lower, reflecting less dispersion in the data, while the higher MSE values during the dry season suggest greater variability. This difference underscores the distinct atmospheric conditions and aerosol effects across seasons.
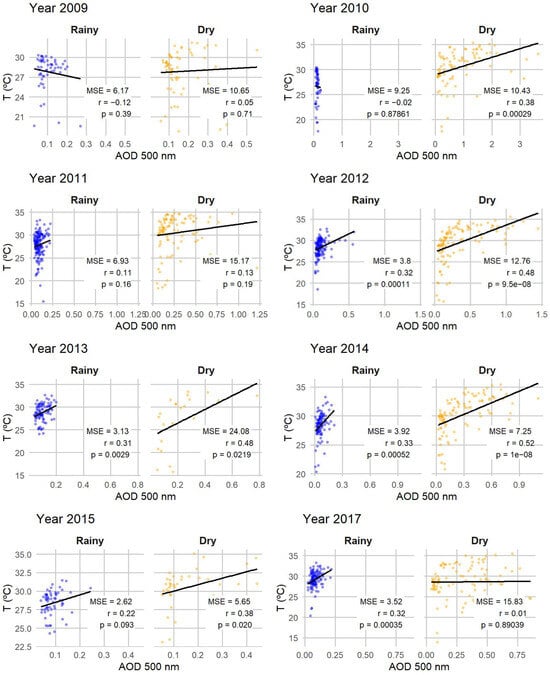
Figure 3.
Relationship between air temperature (T) and aerosol optical depth (AOD at 500 nm) during the rainy and dry periods in the years 2009, 2010, 2011, 2012, 2013, 2014, 2015, and 2017. The trend lines indicate the relationship between the variables, showing the correlation coefficient (r), mean square error (MSE), and significance value (p).
The influence of aerosol particles on atmospheric and surface temperatures depends on their chemical composition, shape, and size [34]. Aerosols from biomass burning, such as BC, primarily exert a warming effect on the atmosphere. The study area is significantly affected by these particles. While AOD is not a direct measure of aerosol concentration, previous studies suggest that the region is strongly impacted by BC particles, which absorb radiation and contribute to increased atmospheric temperatures [33]. Furthermore, higher temperatures can modify cloud formation and precipitation patterns, impacting the wet deposition of aerosols. Reduced precipitation results in a reduction in the removal of aerosols from the atmosphere, allowing for their accumulation and leading to increased AOD values.
A study conducted in India, focusing on the Ganges Basin, analyzed how variations in aerosol levels impact seasonal temperatures. The results revealed complex relationships between the variables. In this study, the relationship between AOD and temperature was generally negative in the northwestern part of India. However, during winter, temperatures in most parts of northern India showed a positive relationship with observed AOD levels. During winter, temperatures were more sensitive to AOD levels, likely due to reduced precipitation and prolonged aerosol accumulation in the atmosphere—similar phenomena may also have occurred during the dry season in the current study [35]. Ref. [3] suggests that high temperatures promote the formation of secondary aerosols through photochemical reactions, leading to increased AOD levels, which could explain the stronger correlations observed during the dry season.
When comparing the two seasons (Figure 4), it is evident that during the rainy season, only 2010 showed a statistically significant correlation between the AOD and Rg, with a correlation coefficient of r = −0.32. This negative value indicates a moderate inverse relationship, suggesting that in 2010, as the AOD increased, Rg tended to decrease. In contrast, the dry season showed statistically significant correlations in multiple years. The strongest correlation occurred in 2009, with r = −0.56, indicating a moderate to strong negative relationship. In 2010, the correlation was r = −0.39, which is still negative but weaker. In 2012, a weak negative correlation (r = −0.21) was observed, while 2017 showed a stronger negative correlation of r = −0.54. Furthermore, the analysis of mean square error (MSE) values indicated that data dispersion was higher during the rainy season, while the dry season exhibited lower MSE values, supporting the stronger correlations observed during this period.
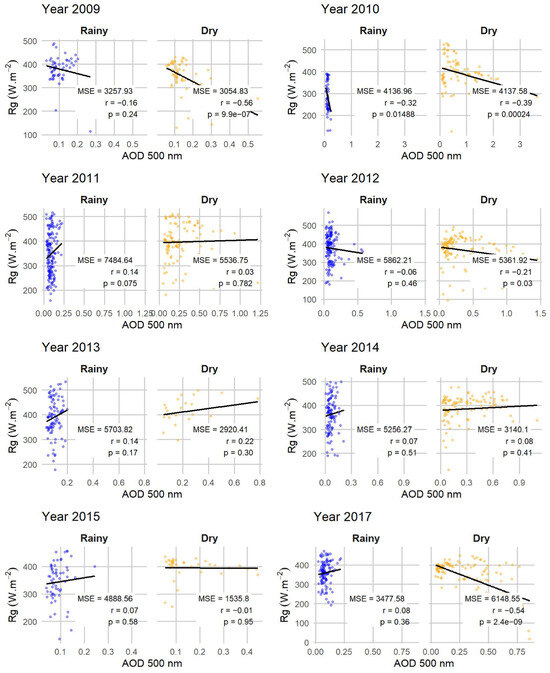
Figure 4.
Relationship between global radiation (Rg, in W.m²) and aerosol optical depth (AOD at 500 nm) during the rainy and dry periods in the years 2009, 2010, 2011, 2012, 2013, 2014, 2015, and 2017. The trend lines indicate the relationship between the variables, the correlation coefficient (r), the mean square error (MSE), and the significance value (p).
These findings suggest that the relationship between the AOD and Rg is more pronounced during the dry season, with several years showing significant negative correlations. In contrast, during the rainy season, this relationship is less consistent, with significant correlations limited to specific years, such as 2010. Although not all years showed statistically significant correlations, the years that did indicate the presence of a relationship, particularly in the dry season. The negative correlation between the AOD and Rg can be explained by the nature of aerosols and their interaction with solar radiation. Aerosols affect Rg both directly, by scattering and absorbing radiation, and indirectly, by modifying cloud properties. These processes lead to a reduction in the amount of solar radiation reaching the Earth’s surface [36,37].
During the rainy season (Figure 5), statistically significant correlations were observed in 2010 and 2013. In 2010, the negative correlation (r = −0.35) suggested that as aerosol concentrations increased, reference evapotranspiration () decreased. However, in 2013, a positive correlation (r = 0.29) was found, indicating a direct relationship between the AOD and . In the dry season, significant correlations were observed in 2010, 2014, and 2017. The negative correlation in 2010 (r = −0.33) mirrored the pattern observed in the rainy season of the same year, reinforcing the relationship between an increased AOD and reduced . In 2014, the correlation was weaker (r = 0.21), suggesting a less pronounced relationship between the AOD and . In 2017, the strongest negative correlation (r = −0.53) was found, indicating a particularly strong impact of aerosols in reducing that year. The MSE analysis also highlighted seasonal differences: during the rainy season, data dispersion was greater, while in the dry season, the values were generally lower.

Figure 5.
Relationship between reference evapotranspiration () and aerosol optical depth (AOD at 500 nm) during the rainy and dry periods in the years 2009, 2010, 2011, 2012, 2013, 2014, 2015, and 2017. The trend lines indicate the relationship between the variables, with the correlation coefficient (r), mean square error (MSE), and significance value (p).
The relationship between aerosols and can be explained through their interaction with solar radiation. High aerosol concentrations are associated with a decrease in , as aerosols enhance the scattering and absorption of solar radiation, reducing the energy available for the evapotranspiration process [17,38,39]. This reduction in is directly linked to the limited energy available for the process. Previous studies [40] support the observation that the presence of aerosols attenuates solar radiation, reducing . However, at moderate aerosol concentrations, recent studies suggest that increased diffuse radiation can intensify photosynthesis, which, in turn, can enhance transpiration. This effect was observed in 2013 and 2014, when the correlations between the AOD and were positive. This phenomenon is particularly evident in shaded plants, which benefit from increased diffuse radiation, resulting in higher transpiration and, consequently, greater [18,41].
Although moderate aerosol concentrations can have a positive effect on diffuse radiation, high aerosol levels generally reduce , with global reductions of up to 6.1 [7]. The droughts exacerbated by aerosols can further decrease both photosynthesis and , as studies have shown reductions in for leaves exposed to direct light under high aerosol concentrations [18,42].
The interaction between atmospheric aerosols and the biophysical processes of land surfaces is particularly complex in heterogeneous biomes like the Cerrado, where the diversity of phytophysiognomies leads to varied responses to environmental impacts. As highlighted by [43], vegetation cover plays a crucial role in modulating biophysical parameters such as the vegetation index (NDVI), albedo, surface temperature, and radiation balance. During the rainy season, areas with denser vegetation, such as Cerradão, exhibited significantly higher NDVI and radiation balance values, while albedo and surface temperature were lower. Atmospheric aerosols, by altering incident solar radiation, can directly impact these parameters, with significant implications for evapotranspiration. In surfaces with a higher NDVI, such as forests and Cerradão, the reduction in solar radiation caused by aerosols may have a more pronounced effect since these areas rely more heavily on direct radiation to sustain high fluxes. Conversely, in areas with pastures or sparser vegetation, such as Campo Limpo, where albedo is higher and vegetation density is lower, the aerosol effect may be less significant. Another important factor is the influence of land use and cover on the hydrological dynamics of the Cerrado. The conversion of native vegetation into agricultural areas, such as sugarcane plantations, has led to a decrease in annual ET and altered the hydrological cycle, reducing precipitation during both the dry and rainy seasons. This alteration can be exacerbated by aerosols, which, through influencing cloud formation and available solar radiation, amplify the negative effects of land-use changes [44].
A study conducted in the southern Amazon Basin analyzed the relationship between AOD and in different phases of the El Niño–Southern Oscillation (ENSO). The study concluded that, for AOD levels ranging from 0.10 to 1.5, aerosols had a positive effect on . However, when aerosol levels exceeded AOD > 1.5, there was a reduction in the solar radiation reaching the top of the tree canopy, leading to a decrease in [16].
The seasonal trends in the relationship between AOD and reflect significant variations in aerosol emission patterns and associated atmospheric conditions. During the dry season, the increase in atmospheric aerosol concentrations is largely driven by anthropogenic activities, such as biomass burning, gold mining, and transportation, consistent with observations in other regions of South America. These factors result in higher particle loads in the atmosphere, intensifying the scattering and absorption of solar radiation. Biomass burning, in particular, is a major source of aerosols in the region during the dry season, leading to higher AOD values. The formation of secondary aerosols and the presence of soot particles increase energy absorption, which can reduce the amount of Rg that reaches the surface. This reduction in Rg, in turn, negatively impacts ET, as less energy is available for the evapotranspiration process. In Brazil, the Cerrado (tropical savanna) accounts for up to 70% of the country’s annually burned area. The data presented in Figure A1 emphasize the intensification of fire activity during the dry season, particularly in August and September. These months show significant increases in fire outbreaks over the years analyzed, highlighting the seasonal impact of anthropogenic activities and climatic conditions on aerosol emissions. This seasonal pattern directly contributes to the observed dynamics in the relationship between AOD and [33,45].
4. Conclusions
This study highlights the critical role of atmospheric aerosols in influencing reference evapotranspiration () and associated climatic variables in the Mato Grosso Cerrado. The findings demonstrate distinct seasonal patterns, with aerosols exerting a more pronounced impact during the dry season, when biomass burning significantly increases aerosol concentrations.
Key results include strong positive correlations between aerosol optical depth (AOD) and air temperature during the dry season, suggesting that aerosols contribute to atmospheric warming through the absorption of solar radiation. Negative correlations between AOD and global radiation (Rg) were also more evident during the dry season, as aerosols scatter and absorb solar radiation, reducing the amount of energy that reaches the Earth’s surface. The relationship between AOD and revealed both positive and negative correlations depending on seasonal and interannual variations, highlighting the complex interplay between aerosols and evapotranspiration dynamics.
These findings underscore the dual role of aerosols in modulating evapotranspiration, with moderate aerosol levels enhancing the diffusion of radiation and photosynthesis, while higher concentrations reduce Rg and . The impacts of aerosols on hydrological and climatic processes in the Cerrado have potential implications for agricultural productivity, water resource management, and regional climate modeling.
Author Contributions
Conceptualization, H.J.A.d.S. and L.F.A.C.; methodology, H.J.A.d.S. and L.F.A.C.; software, H.J.A.d.S. and L.F.A.C.; validation, T.A.d.S.B., A.M.d.S.L., D.d.O.M., J.G.d.S., J.B.M., R.d.S.P., M.S.B. and N.G.M.; formal analysis, H.J.A.d.S., T.A.d.S.B., A.M.d.S.L., D.d.O.M., J.G.d.S., J.B.M., R.d.S.P., M.S.B., N.G.M. and L.F.A.C.; investigation, H.J.A.d.S., T.A.d.S.B., A.M.d.S.L., D.d.O.M., J.G.d.S., J.B.M., R.d.S.P., M.S.B., N.G.M. and L.F.A.C.; resources, L.F.A.C.; data curation, J.B.M., R.d.S.P., M.S.B. and L.F.A.C.; writing—original draft preparation, H.J.A.d.S.; writing—review and editing, H.J.A.d.S., T.A.d.S.B., A.M.d.S.L., D.d.O.M., J.G.d.S., J.B.M., R.d.S.P., M.S.B., N.G.M. and L.F.A.C.; visualization, H.J.A.d.S., T.A.d.S.B., A.M.d.S.L., D.d.O.M., J.G.d.S., J.B.M., R.d.S.P., M.S.B., N.G.M. and L.F.A.C.; supervision, L.F.A.C.; project administration, M.S.B. and L.F.A.C.; funding acquisition, M.S.B. and L.F.A.C. All authors have read and agreed to the published version of the manuscript.
Funding
This research was partially funded by Coordenação de Aperfeiçoamento de Pessoal de Nível Superior (CAPES), code 311541/2021-6, Conselho Nacional de Desenvolvimento Científico e Tecno-lógico (CNPq), code 311907/2021-0, Universidade Federal de Mato Grosso (UFMT), code 580/2023, and Programa de Grande Escala da Biosfera-Atmosfera na Amazônia (LBA), code (0004/2020).
Institutional Review Board Statement
Not applicable.
Informed Consent Statement
Not applicable.
Data Availability Statement
Data will be provided upon request.
Acknowledgments
The authors thank Aerosol Robotic Network (AERONET) to provide the data.
Conflicts of Interest
The authors declare no conflicts of interest. The funders had no role in the design of the study; in the collection, analyses, or interpretation of data; in the writing of the manuscript; or in the decision to publish the results.
Appendix A
The following figures complement the discussions in the main text. They highlight the minimum relative humidity values occurring between August and September, which coincide with the period of peak AOD levels and intensified fire activity.
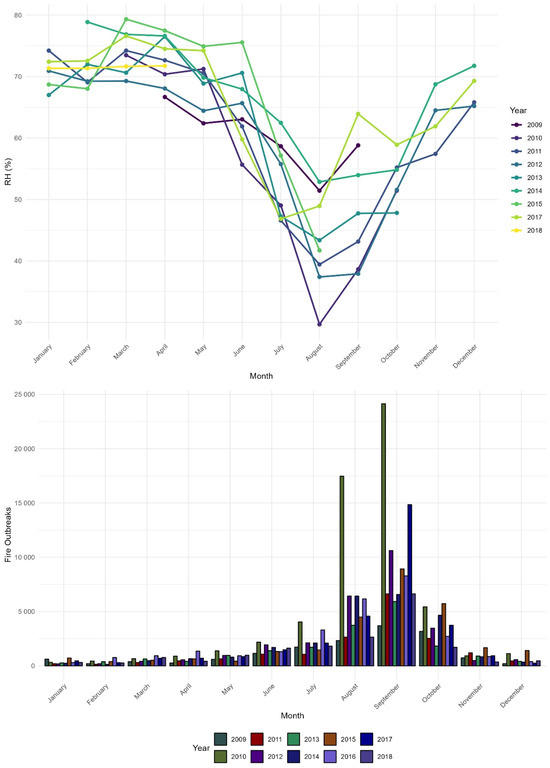
Figure A1.
Monthly average of relative humidity (2009–2018) and fire outbreaks in the state of Mato Grosso (2009–2018). Source: INPE.
References
- Hao, H.; Wang, K.; Zhao, C.; Wu, G.; Li, J. Visibility-derived aerosol optical depth over global land from 1959 to 2021. Earth Syst. Sci. Data 2024, 16, 3233–3260. [Google Scholar] [CrossRef]
- Ling, X.; Han, X. Aerosol Impacts on Meteorological Elements and Surface Energy Budget over an Urban Cluster Region in the Yangtze River Delta. Aerosol Air Qual. Res. 2019, 19, 1040–1055. [Google Scholar] [CrossRef]
- Torabi, S.E.; Amin, M.; Phairuang, W.; Lee, H.M.; Hata, M.; Furuuchi, M. High-Resolution Characterization of Aerosol Optical Depth and Its Correlation with Meteorological Factors in Afghanistan. Atmosphere 2024, 15, 849. [Google Scholar] [CrossRef]
- Alves, C.A.; Casimiro, A.P. Secondary Organic Compounds in Atmospheric Aerosols: Speciation and Formation Mechanisms. J. Braz. Chem. Soc. 2005, 16, 1017–1029. [Google Scholar] [CrossRef]
- Tariq, S.; Qayyum, F.; Ul-Haq, Z.; Mehmood, U. Long-term spatiotemporal trends in aerosol optical depth and its relationship with enhanced vegetation index and meteorological parameters over South Asia. Environ. Sci. Pollut. Res. 2022, 29, 30638–30655. [Google Scholar] [CrossRef]
- Jion, M.M.M.F.; Islam, A.R.M.T.; Shahrier, M.; Yousuf Mia, M.; Jannat, J.N.; Arfan Ali, M.; Al Masud, M.A.; Firoz Khan, M.; Bilal, M.; Idris, A.M.; et al. A critical review of NO2 and AOD in major Asian cities: Challenges, mitigation approaches and way forwards. Air Qual. Atmos. Health 2024, 18, 43–59. [Google Scholar] [CrossRef]
- Wang, B.; Yue, X.; Zhou, H.; Zhu, J. Impact of diffuse radiation on evapotranspiration and its coupling to carbon fluxes at global FLUXNET sites. Agric. For. Meteorol. 2022, 322, 109006. [Google Scholar] [CrossRef]
- Marengo, J.A.; Souza, C.M., Jr.; Thonicke, K.; Burton, K.T.C.; Halladay, K.; Betts, R.A.; Alves, L.M.; Soares, W.R. Changes in Climate and Land Use Over the Amazon Region: Current and Future Variability and Trends. Front. Earth Sci. 2018, 6, 228. [Google Scholar] [CrossRef]
- Jiang, K.; Xing, R.; Luo, Z.; Huang, W.; Yi, F.; Men, Y.; Zhao, N.; Chang, Z.; Zhao, J.; Pan, B.; et al. Pollutant emissions from biomass burning: A review on emission characteristics, environmental impacts, and research perspectives. Particuology 2024, 85, 296–309. [Google Scholar] [CrossRef]
- Morgan, W.T.; Allan, J.D.; Bauguitte, S.; Darbyshire, E.; Flynn, M.J.; Lee, J.; Liu, D.; Johnson, B.; Haywood, J.; Longo, K.M.; et al. Transformation and ageing of biomass burning carbonaceous aerosol over tropical South America from aircraft in situ measurements during SAMBBA. Atmos. Chem. Phys. 2020, 20, 5309–5326. [Google Scholar] [CrossRef]
- Correa, D.B.; Alcântara, E.; Libonati, R.; Massi, K.G.; Park, E. Increased burned area in the Pantanal over the past two decades. Sci. Total Environ. 2022, 835, 155386. [Google Scholar] [CrossRef]
- Marengo, J.A.; Cunha, A.P.; Cuartas, L.A.; Deusdará Leal, K.R.; Broedel, E.; Seluchi, M.E.; Michelin, C.M.; De Praga Baião, C.F.; Chuchón Angulo, E.; Almeida, E.K.; et al. Extreme Drought in the Brazilian Pantanal in 2019–2020: Characterization, Causes, and Impacts. Front. Water 2021, 3, 639204. [Google Scholar] [CrossRef]
- Srivastava, R.; Ramachandran, S.; Rajesh, T.A.; Kedia, S. Aerosol radiative forcing deduced from observations and models over an urban location and sensitivity to single scattering albedo. Atmos. Environ. 2011, 45, 6163–6171. [Google Scholar] [CrossRef]
- Liu, L.; Cheng, Y.; Wang, S.; Wei, C.; Pöhlker, M.L.; Pöhlker, C.; Artaxo, P.; Shrivastava, M.; Andreae, M.O.; Pöschl, U.; et al. Impact of biomass burning aerosols on radiation, clouds, and precipitation over the Amazon: Relative importance of aerosol—Cloud and aerosol–radiation interactions. Atmos. Chem. Phys. 2020, 20, 13283–13301. [Google Scholar] [CrossRef]
- Palácios, R.; Romera, K.; Rizzo, L.; Cirino, G.; Adams, D.; Imbiriba, B.; Nassarden, D.; Rothmund, L.; Siqueira, A.; Basso, J.; et al. Optical properties and spectral dependence of aerosol light absorption over the Brazilian Pantanal. Atmos. Pollut. Res. 2022, 13, 101413. [Google Scholar] [CrossRef]
- Palácios, R.; Castagna, D.; Barbosa, L.; Souza, A.P.; Imbiriba, B.; Zolin, C.A.; Nassarden, D.; Duarte, L.; Morais, F.G.; Franco, M.A.; et al. ENSO effects on the relationship between aerosols and evapotranspiration in the south of the Amazon biome. Environ. Res. 2024, 250, 118516. [Google Scholar] [CrossRef]
- Yao, L. Causative impact of air pollution on evapotranspiration in the North China Plain. Environ. Res. 2017, 158, 436–442. [Google Scholar] [CrossRef]
- Zhou, B.; Liu, D.; Yan, W. A Simple New Method for Calculating Precipitation Scavenging Effect on Particulate Matter: Based on Five-Year Data in Eastern China. Atmosphere 2021, 12, 759. [Google Scholar] [CrossRef]
- Valle Júnior, L.C.G.d.; Vourlitis, G.L.; Curado, L.F.A.; Palácios, R.d.S.; Nogueira, J.d.S.; Lobo, F.d.A.; Islam, A.R.M.T.; Rodrigues, T.R. Evaluation of FAO-56 Procedures for Estimating Reference Evapotranspiration Using Missing Climatic Data for a Brazilian Tropical Savanna. Water 2021, 13, 1763. [Google Scholar] [CrossRef]
- Holben, B.N.; Eck, T.F.; Slutsker, I.; Tanré, D.; Buis, J.P.; Setzer, A.; Vermote, E.; Reagan, J.A.; Kaufman, Y.J.; Nakajima, T.; et al. AERONET—A Federated Instrument Network and Data Archive for Aerosol Characterization. Remote Sens. Environ. 1998, 66, 1–16. [Google Scholar] [CrossRef]
- Wei, J.; Wang, Z.; Li, Z.; Li, Z.; Pang, S.; Xi, X.; Cribb, M.; Sun, L. Global aerosol retrieval over land from Landsat imagery integrating Transformer and Google Earth Engine. Remote Sens. Environ. 2024, 315, 114404. [Google Scholar] [CrossRef]
- de Oliveira, R.G.; Valle Júnior, L.C.G.; da Silva, J.B.; Espíndola, D.A.L.F.; Lopes, R.D.; Nogueira, J.S.; Curado, L.F.A.; Rodrigues, T.R. Temporal trend changes in reference evapotranspiration contrasting different land uses in southern Amazon basin. Agric. Water Manag. 2021, 250, 106815. [Google Scholar] [CrossRef]
- Ramos, L.C.; Brunelli, T.C.; Vicentin, F.C.; Curado, L.F.A.; Lima, A.M.d.S.; Morais, F.G.; Palácios, R.d.S.; de Oliveira, N.N.; Marques, J.B. Characterization of the Elemental Composition of Aerosols Emitted in the Dry Season of the Pantanal Wetland, Brazil. Atmosphere 2024, 15, 1361. [Google Scholar] [CrossRef]
- Reddington, C.L.; Morgan, W.T.; Darbyshire, E.; Brito, J.; Coe, H.; Artaxo, P.; Scott, C.E.; Marsham, J.; Spracklen, D.V. Biomass burning aerosol over the Amazon: Analysis of aircraft, surface and satellite observations using a global aerosol model. Atmos. Chem. Phys. 2019, 19, 9125–9152. [Google Scholar] [CrossRef]
- Andreae, M.O. Emission of trace gases and aerosols from biomass burning—An updated assessment. Atmos. Chem. Phys. 2019, 19, 8523–8546. [Google Scholar] [CrossRef]
- Hou, P.; Wu, S.; McCarty, J.L.; Gao, Y. Sensitivity of atmospheric aerosol scavenging to precipitation intensity and frequency in the context of global climate change. Atmos. Chem. Phys. 2018, 18, 8173–8182. [Google Scholar] [CrossRef]
- Machado, L.; Laurent, H.; Dessay, N.; Miranda, I. Seasonal and Diurnal Variability of Convection Over the Amazonia: A Comparison of Different Vegetation Types and Large Scale Forcing. Theor. Appl. Climatol. 2004, 78, 61–77. [Google Scholar] [CrossRef]
- dos Santos, W.R.; da Rosa Ferraz Jardim, A.M.; de Souza, L.S.B.; de Souza, C.A.A.; de Morais, J.E.F.; Alves, C.P.; do Nascimento Araujo Júnior, G.; da Silva, M.J.; da Silva Salvador, K.R.; da Silva, M.V.; et al. Can changes in land use in a semi-arid region of Brazil cause seasonal variation in energy partitioning and evapotranspiration? J. Environ. Manag. 2024, 367, 121959. [Google Scholar] [CrossRef]
- Zamadei, T.; Souza, A.; Almeida, F.; Escobedo, J. Radiação global e difusa diária na região de transição Cerrado-Amazônia brasileira. Ciênc. Nat. 2021, 43, e37. [Google Scholar] [CrossRef]
- Sabino, M.; de Souza, A.P. Global Sensitivity of Penman–Monteith Reference Evapotranspiration to Climatic Variables in Mato Grosso, Brazil. Earth 2023, 4, 714–727. [Google Scholar] [CrossRef]
- Giambelluca, T.W.; Scholz, F.G.; Bucci, S.J.; Meinzer, F.C.; Goldstein, G.; Hoffmann, W.A.; Franco, A.C.; Buchert, M.P. Evapotranspiration and energy balance of Brazilian savannas with contrasting tree density. Agric. For. Meteorol. 2009, 149, 1365–1376. [Google Scholar] [CrossRef]
- Titos, G.; Cazorla, A.; Zieger, P.; Andrews, E.; Lyamani, H.; Granados-Muñoz, M.J.; Olmo, F.J.; Alados-Arboledas, L. Effect of hygroscopic growth on the aerosol light-scattering coefficient: A review of measurements, techniques and error sources. Atmos. Environ. 2016, 141, 494–507. [Google Scholar] [CrossRef]
- Zhao, P.; Du, X.; Su, J.; Ding, J.; Dong, Q. Aerosol hygroscopicity based on size-resolved chemical compositions in Beijing. Sci. Total Environ. 2020, 716, 137074. [Google Scholar] [CrossRef]
- Amarillo, A.; Carreras, H.; Krisna, T.; Mignola, M.; Tavera Busso, I.; Wendisch, M. Exploratory analysis of carbonaceous PM2.5 species in urban environments: Relationship with meteorological variables and satellite data. Atmos. Environ. 2021, 245, 117987. [Google Scholar] [CrossRef]
- Roy, S.S. Impact of aerosol optical depth on seasonal temperatures in India: A spatio-temporal analysis. Int. J. Remote Sens. 2008, 29, 727–740. [Google Scholar] [CrossRef]
- Jung, J.; Souri, A.H.; Wong, D.C.; Lee, S.; Jeon, W.; Kim, J.; Choi, Y. The Impact of the Direct Effect of Aerosols on Meteorology and Air Quality Using Aerosol Optical Depth Assimilation During the KORUS-AQ Campaign. J. Geophys. Res. Atmos. 2019, 124, 8303–8319. [Google Scholar] [CrossRef] [PubMed]
- Ramanathan, V.; Crutzen, P.J.; Kiehl, J.T.; Rosenfeld, D. Aerosols, Climate, and the Hydrological Cycle. Science 2001, 294, 2119–2124. [Google Scholar] [CrossRef] [PubMed]
- Huang, Y.; Dickinson, R.E.; Chameides, W.L. Impact of aerosol indirect effect on surface temperature over East Asia. Proc. Natl. Acad. Sci. USA 2006, 103, 4371–4376. [Google Scholar] [CrossRef]
- Wang, S.; Xu, X.; Lei, L.; Gao, Y. Effects of Aerosol on Reference Crop Evapotranspiration: A Case Study in Henan Province, China. Agronomy 2023, 13, 82. [Google Scholar] [CrossRef]
- Liu, S.; Chen, M.; Zhuang, Q. Aerosol effects on global land surface energy fluxes during 2003–2010. Geophys. Res. Lett. 2014, 41, 7875–7881. [Google Scholar] [CrossRef]
- Lu, X.; Chen, M.; Liu, Y.; Miralles, D.G.; Wang, F. Enhanced water use efficiency in global terrestrial ecosystems under increasing aerosol loadings. Agric. For. Meteorol. 2017, 237–238, 39–49. [Google Scholar] [CrossRef]
- Zhang, J.; Ding, J.; Zhang, J.; Yuan, M.; Li, P.; Xiao, Z.; Peng, C.; Chen, H.; Wang, M.; Zhu, Q. Effects of increasing aerosol optical depth on the gross primary productivity in China during 2000–2014. Ecol. Indic. 2020, 108, 105761. [Google Scholar] [CrossRef]
- Oliveira, B.S.; Moraes, E.C.; Carrasco-Benavides, M.; Bertani, G.; Mataveli, G.A.V. Improved Albedo Estimates Implemented in the METRIC Model for Modeling Energy Balance Fluxes and Evapotranspiration over Agricultural and Natural Areas in the Brazilian Cerrado. Remote Sens. 2018, 10, 1181. [Google Scholar] [CrossRef]
- Caballero, C.B.; Ruhoff, A.; Biggs, T. Land use and land cover changes and their impacts on surface-atmosphere interactions in Brazil: A systematic review. Sci. Total Environ. 2022, 808, 152134. [Google Scholar] [CrossRef] [PubMed]
- Targino, A.C.; Krecl, P.; Oukawa, G.Y.; Mollinedo, E.M. A short climatology of black and brown carbon and their sources at a suburban site impacted by smoke in Brazil. J. Environ. Sci. 2024, 136, 498–511. [Google Scholar] [CrossRef]
Disclaimer/Publisher’s Note: The statements, opinions and data contained in all publications are solely those of the individual author(s) and contributor(s) and not of MDPI and/or the editor(s). MDPI and/or the editor(s) disclaim responsibility for any injury to people or property resulting from any ideas, methods, instructions or products referred to in the content. |
© 2025 by the authors. Licensee MDPI, Basel, Switzerland. This article is an open access article distributed under the terms and conditions of the Creative Commons Attribution (CC BY) license (https://creativecommons.org/licenses/by/4.0/).