Article

Volatile Organic Compounds in Early Childhood Education Facilities: Simultaneous Indoor and Outdoor Measurements in the Haifa Bay Area

Faculty of Civil and Environmental Engineering, Technion, Israel Institute of Technology, Haifa 32000, Israel
*
Author to whom correspondence should be addressed.
Atmosphere 2025, 16(2), 181; https://doi.org/10.3390/atmos16020181
Submission received: 30 December 2024 / Revised: 1 February 2025 / Accepted: 3 February 2025 / Published: 5 February 2025
(This article belongs to the Section Air Quality)

Abstract

:
Indoor air quality (IAQ) is of great importance, as people spend up to 90% of their time indoors, leading to significant exposure to air pollutants. The IAQ in early childhood education (ECE) facilities is of particular interest since young children are more vulnerable and poor air quality may have possible long-lasting impacts on them. In the present study, simultaneous indoor and outdoor VOC measurements were carried out in three ECE facilities in the Haifa Bay area, Israel. Three sampling campaigns were utilized, each lasted for a minimum of one week, encompassing four consecutive working days and at least one weekend. During working days, sampling was performed during daytime activity hours and at nighttime (off hours). Twenty-three VOCs were identified, quantified, and classified into six chemical groups—aromatic hydrocarbons, aliphatic alkanes, terpenes, alcohols, carbonyls, and “others”. The total outdoor VOC concentration was 23 μg m−3 during the daytime and 22 μg m−3 at night, with carbonyls and aromatic hydrocarbons accounting for ~80% of it. Despite the heterogeneity of the study area, outdoor concentrations depicted a smaller spatial and temporal variability than was observed indoors. In the ECE facilities, the total VOC reached 134 and 204 μg m−3 during the daytime and nighttime, respectively, and were strongly impacted by the air exchange rate. Carbonyls, alcohols, and terpenes were more prevalent indoors, accounting for 77.5–81.1% of the total. Their high indoor/outdoor ratios, especially for formaldehyde and limonene, suggest a significant contribution from indoor emission sources. Exposure calculations were compared to reference values for carcinogenic and non-carcinogenic effects. While the lifetime average daily dose (LADD) did not exceed the available reference values, the upper-limit estimates of continuous lifetime exposure to measured indoor levels indicate that formaldehyde and acetaldehyde surpassed their respective limits by factors of 10 and 3, respectively.

1. Introduction

Air quality holds great importance for human health and carries several environmental implications. Outdoor air pollution has been extensively discussed and regulated, but exposure to pollutants in indoor environments, where we spend up to 90% of our time [1,2,3], is equally important [4]. While interest in volatile organic compounds (VOCs) in the outdoor environment arises mainly from their contribution to tropospheric ozone and secondary organic aerosols (SOAs) production [5], concerns about indoor VOC levels primarily arise from their toxicity and/or their potential role as precursors for various secondary pollutants. Relative to the outdoor, the indoor environment accounts for long and continuous exposure to numerous VOCs alongside other pollutants such as particulate matter, CO, and NOx [6,7,8,9]. VOC exposure can occur by directly inhaling gaseous pollutants or by inhaling compounds absorbed by particulate matter such as dust [10]. Some of the commonly detected VOCs are defined as hazardous air pollutants with short-term and/or long-term adverse health effects. Besides the risk associated with carcinogenic compounds, exposure to various VOCs may cause other acute or chronic effects, including respiratory problems [11,12] as well as allergic sensitivities and chronic irritations [13]. The indoor air quality (IAQ) in early childhood education (ECE) facilities is of particular interest since most children spend 6–10 h a day in such facilities. Moreover, early-life exposure is crucial because young children are more vulnerable to chronic exposure to contaminants. Their immunological, physiological, and neurological systems are still developing [14,15], and they have a higher air-intake volume and frequency relative to their body weight [16,17]. As a result, such exposures may lead to long-lasting health impacts [16,17,18,19].
Indoor environments vary significantly in terms of their architecture design, operation conditions, occupancy level, and daily activity. The concentrations of pollutants indoors are influenced by the infiltration of outdoor pollutants, behavior-driven air exchange through natural and mechanical ventilation, and emissions from indoor sources and activities [20,21], as well as by multi-phase indoor chemistry between pollutants and with indoor surfaces [22]. Hence, occupants are typically exposed to complex mixtures of substances, with varying compositions according to location and time. The effect of ventilation on IAQ can be complex. While reducing the air exchange rate (AER) limits outdoor pollutant penetration, it increases the concentrations of pollutants emitted or chemically generated indoors. [22]. The indoor/outdoor (I/O) concentration ratio is often used as a screening tool to distinguish between pollutants of outdoor and indoor origin [23]. Generally, a low I/O ratio characterizes pollutants with dominant outdoor sources and/or good indoor ventilation (i.e., high AER), resulting in similar indoor and outdoor concentrations. In contrast, a high I/O may imply a significant indoor emission source, or infiltration from outdoors, along with a lack of ventilation. Accordingly, temporal variations in I/O ratios between activity and off-activity hours can provide additional information regarding the types of indoor emission sources. Active sources associated with human activities, such as the use of personal care products (PCPs), cleaning agents, and crafting materials, are expected to increase the I/O ratio primarily during daytime hours when these activities are most prevalent. Passive sources, including emissions from building materials and furnishings (e.g., VOCs released from paints, adhesives, and solvents), tend to dominate during off-activity hours. These emissions can significantly increase the I/O ratio, especially during the nighttime when ventilation rates are usually low. Previous studies, emphasizing the potentially harmful exposure to VOCs in educational facilities, showed that this indoor environment usually has a markedly higher VOC concentration than outdoor environments [23,24,25]. A wide range of VOC species has been identified indoors, often numbering in the tens, highlighting the complexity of indoor chemical environments [26]. Reported total VOC concentrations range from low values of ~10 μg m−3 up to ~2500 μg m−3 [25,27], with toluene, limonene, and formaldehyde often attracting attention due to their frequently elevated levels. As ECE facilities aim to promote children’s development in a safe environment, their daily routine is typically characterized by frequent cleaning activity and multiple arts-and-craft sessions. While both activities are highly beneficial, they have been shown to emit a complex profile of VOCs [15], which may elevate indoor concentrations during activity hours. Furthermore, high occupancy, often characteristic of ECE facilities, may also increase levels of VOCs related to emissions from humans (e.g., substances from personal care products, products of metabolic activity, or interactions of ozone with human skin) [28,29]. Childhood exposure to doses of several compounds, including formaldehyde and benzene, can exceed safe levels in pre-school facilities [7,26]. Interestingly, measured I/O ratios are regularly above unity, even for compounds such as aromatic and aliphatic hydrocarbons, with emission sources considered to be dominated by outdoor sources (industry/transportation) [23]. For pollutants with significant and predominant indoor sources, the I/O ratio typically ranges from 10 to 50 and is often greater than 50 [23].
Despite significant advances in IAQ research, specifically in educational facilities, research on VOCs often faces notable challenges. Studies monitoring multiple VOCs usually rely on a single-day measurement [7,26], while studies with a higher temporal frequency usually focus on total VOC measurements [25]. Simultaneous monitoring of both indoor and outdoor air quality, particularly at high spatial and temporal resolutions, can enable the distinction and classification of different sources, and yet is rarely performed. Additionally, most previous studies were conducted in regions with moderate climates, characterized by high ventilation rates during the summer and limited air exchange in the cold winter [24]. This ventilation pattern contrasts with that prevailing in the Mediterranean basin and other warmer regions, characterized by hot summers and mild winters. Very limited information is currently available about VOC exposure in ECE facilities in the Middle East [20,30]. In this study, a non-targeted simultaneous indoor and outdoor VOCs analysis was performed in three ECE facilities in the Haifa Bay Area (HBA), Israel, examining temporal and spatial variation within this heterogenous urban region, and estimate exposure doses.

2. Materials and Methods

2.1. Research Area

The Haifa Bay Area (HBA) is the only natural gulf along the Israeli coastline, spreading over 64.5 km2. Throughout modern history, it has evolved as the largest industrial zone in Israel. It includes a commercial port, a large petrochemical complex, and nearby heavy and light industries, with extensive anthropogenic activities contributing to considerable VOC emissions. Along with industrial development, the city of Haifa and its suburbs have grown dramatically (current sub-district population of about 600 K), creating high proximity between the industries and populated centers. The sharp relief of Mount Carmel in the south of Haifa Bay (Figure 1) and the Zevulun hills to its northeast affect the local meteorology and the resulting pollutant dispersion in the bay area. Prevailing winds are dominantly from the north-west and south-east, with sea breeze during daytime and land breeze during nighttime [31,32].
Indoor and outdoor air concentrations of VOCs were measured in pre-school facilities located in different areas of the Haifa metropolis: Nave Shaanan (NS), Merkaz-Horev (MH), and Kiryat-Haim (KH) (Figure 1). The facilities were enrolled according to their vicinity to varied potential polluting sources, the similarities in their architecture and operation regime, and their geographical locations, representative of the Haifa urban area. Three campaigns were conducted in summer 2018, winter 2019, and summer 2019 at these locations. Each sampling campaign extended for a minimum of one week, encompassing four consecutive working days and at least one weekend (Friday–Saturday), with a total of 39 sampling periods (Table S1). During working days, sampling was performed during the daytime (activity hours) and at nighttime (off hours).

2.2. Air Sampling System

Sample collection and analysis were carried out according to U.S. EPA Method TO-17 and U.S. EPA Method TO-11A, with a self-designed and self-assembled sampling system enclosed inside a closed metal box (Figure 2). The air sampling system consisted of a diaphragm pump (8K, Boxer GmbH, Ottobeuren, Germany) connected to three sampling lines with a rotameter on each line to regulate the flow rate. The sampled air was drawn directly into protruding adsorbers. Two lines were allocated for VOC adsorption on thermal desorption (TD) tubes, while another line was designated for carbonyl adsorption upon a DNPH cartridge. The flow rates for each sampling line were calibrated before and after each sampling using a portable mass-flow calibrator (Alicat Scientific, Tucson, AZ, USA). The indoor and outdoor sampling apparatuses were identical. Outdoor air samples were collected in the playground of each kindergarten at a height of about 0.75 m above ground. The indoor sampling system was situated at about 1 m height in the central activity room, which corresponds to the children’s breathing zone. Sampling was performed indoors and outdoors simultaneously, with separate sampling during daytime working hours (8:30–15:30) and at nighttime (22:30–05:30). Additional sampling was carried out in each location during weekends over the same time intervals but without sample exchange in between (i.e., 22:30–05:30 plus 8:30–15:30 on the following day) (Table S1).

2.3. Analytical Methods

VOCs: The sampling flow rate was set to 50 cm3 min−1. Air collection for VOCs was carried out on glass adsorbent tubes (Perkin-Elmer, Shelton, CT, USA) self-packed with Tenax TA (150 mg; 60/80 mesh size, Supelco, Bellefonte, PA, USA) and Carbopack™ X (100 mg; 40–60 mesh size, Supelco, Bellefonte, PA, USA). Prior to first use, the absorbent tubes were conditioned for 2 h at 300 °C under an ultrapure helium flow of 50 cm3 min−1. Tubes were reconditioned at 300 °C for 6 min after measurement (i.e., after thermal extraction and measurement of samples). The adsorbent tubes were analyzed with a thermal desorption instrument (TurboMatrix ATD 150, Perkin-Elmer, Shelton, CT, USA) coupled with a gas chromatography and mass spectrometry detector (Clarus 600, Perkin-Elmer, Shelton, CT, USA). The tubes were thermally desorbed at 280 °C for 20 min onto an inside commercial focusing trap (“Air monitoring” trap, Perkin-Elmer, Shelton, CT, USA) using Helium gas (99.999% clean). A second desorption stage from the trap was performed following an instant temperature rise from 5 °C to 280 °C (with the final temperature kept for 6 min). At the end of the desorption process, the sample proceeded with injection through a transfer line to the GC oven (30 m ID 0.25 mm DF 0.25 mm Elite-5MS, Perkin-Elmer, Shelton, CT, USA). The temperature program was initiated at 40 °C for 2 min, followed by a ramp rate of 7 °C min−1 to 220 °C, and a second ramp rate of 25 °C min−1 to 300 °C. Finally, it was kept for an additional 5 min at the highest temperature. A carrier (helium) gas flow rate of 1 mL min−1 was maintained during the whole program. Subsequent ionization and detection of the m/z ratio by MS (Clarus SQ8T, Perkin-Elmer, Shelton, CT, USA) in scan mode (40–600 m/z) were performed for the purpose of identifying analytes. The resolved peaks of compounds were identified by validation of their retention times, retention indexes, and their mass spectra, using the NIST library, and considering a 70% match or above for analyte and library spectra. Quantification was achieved with six-point calibration using analytical standards (Sigma Aldrich, St. Louis, MO, USA) diluted with HPLC-grade methanol (Macron Fine Chemicals, Gliwice, Poland). Then, 1 µL of each calibration level was injected onto adsorbent tubes followed by a 50 mL min−1 helium flow for 5 min at a temperature of 40 °C. Standard tubes were analyzed in the same manner as sample tubes. Benzene was not quantified in this study due to instrument analytical limitations, while m- and p-xylenes were reported as total concentrations as they co-eluted in the GC columns. Five-point calibration curves were prepared for 53 compounds with low (1–100 ng) and high (50–1000 ng) concentrations, using analytical standard solutions (Sigma Aldrich, St. Louis, MO, USA). All samples were referenced to the 1-bromo-4-fluorobenzene (100 ng) internal standard.
Carbonyls: This sampling line was set to 250 cm3 min−1 and was equipped with Sep-Pak DNPH-silica cartridges (Waters, Milford, MA, USA) fitted with ozone scrubbers (Waters, MA, USA) to prevent successive oxidation of collected samples. Sampling tubes and cartridges (including field blanks) were sealed and transferred to the laboratory in temperature-controlled containers and kept refrigerated until analysis. The DNPH cartridges were extracted with 3 mL of HPLC-grade acetonitrile (J.T. Baker, Phillipsburg, NJ, USA) and brought to a final volume of 5 mL. Then, 20 µL of the extracts was injected and analyzed by HPLC (Shimadzu prominence, Kyoto, Japan) using a PS C18 column (Luna 3 µm, Phenomenex, Torrance, CA, USA) and mobile phase of solvent A, DI water–Tetrahydrofolat (5:2), and solvent B, acetonitrile (100%). A gradient elution was employed as follows: 35% A for 3.5 min, an increase to 45% A for an additional 14.5 min, an increase in A to 70% for a rapid wash, and then re-equilibration to the initial level. UV detection was set at 360 nm. A 6-point calibration curve was prepared for compounds from purchased standard DNPH-carbonyls solution (Sigma-Aldrich, St. Louis, MO, USA) and treated in the same manner as the samples.
Quality control: For each batch of samples, field and laboratory blanks were employed and analyzed for possible contamination. Two field sample tubes were collocated with a back-up tube to evaluate breakthrough. For all analytes, the back-up tube showed less than 10% of the front tube load, indicating no significant breakthrough. The concentrations of measured compounds were blank-corrected. Method detection limits (MDLs) were evaluated for the analyzed compounds using a linear range of low-concentration calibration curves for the reference standards or by averaging the blank concentration for compounds that lacked reference standards prior to the measurement. The MDLs ranged from 0.048 to 2.380 μg m−3 on a mass concentration basis using the sample-specific volume, which averaged ~21 L. For the purpose of indoor/outdoor concentration ratio calculations, samples that exhibit VOC levels below the MDL were imputed to MDL/√2. All descriptive statistical analyses were performed using MATLAB R2023b software.

2.4. Air Exchange Rate (AER)

The AER was measured using a passive method during activity hours (representing daytime AER) and an active method during nighttime (representing nighttime AER). For the passive approach, continuous CO2 measurements were conducted inside the ECE facility, along with recordings of the number of children and adults present at any time. The CO2 data were segmented based on observed trends, and the air exchange rate (λ) was calculated for each segment using Equation (1). The daytime AER was determined as the weighted average of the calculated values of the various segments, considering the duration of each section.
d ( C i n d o o r ) d t = λ C o u t d o o r C i n d o o r + S C O 2 V
where the indoor emission source of CO2 (SCO2) was calculated based on the number of children and adults present during that time in the ECE facility, assuming breathing rates of 10.5 and 17 m3 d−1 for kids and adults, respectively. Cindoor and Coutdoor represent measured CO2 concentrations in both environments and d(Cindoor)/dt was obtained from the mathematical fitting of the indoor measurements.
The nighttime active measurement was performed by releasing CO2 gas (from a cylinder) in the kindergarten to a concentration of about 3000 ppm. Its concentration was continuously monitored (30 s time interval) with a portable CO2 detector until the value decreased back to the initial concentration measured before releasing the CO2 (~5 h). The ECE setup was the standard nighttime configuration, as determined by the staff, with no modifications made for the measurement.

3. Results

3.1. Identification and Quantification of Compounds

A non-targeted VOC analysis was performed on both indoor and outdoor samples. Twenty-three VOC species were repeatedly detected and clearly identified and quantified. These substances were classified into six chemical groups: aromatic hydrocarbons, aliphatic alkanes, terpenes, alcohols, carbonyls, and ‘other’ compounds. The total indoor and outdoor average concentrations of these substances (averaged over all campaigns and daycares) are summarized in Table 1. A detailed analysis of these data, considering temporal and spatial variations, is provided in the following sections, with Section 3.2 focusing on the outdoors and Section 3.3 examining the indoor environment.

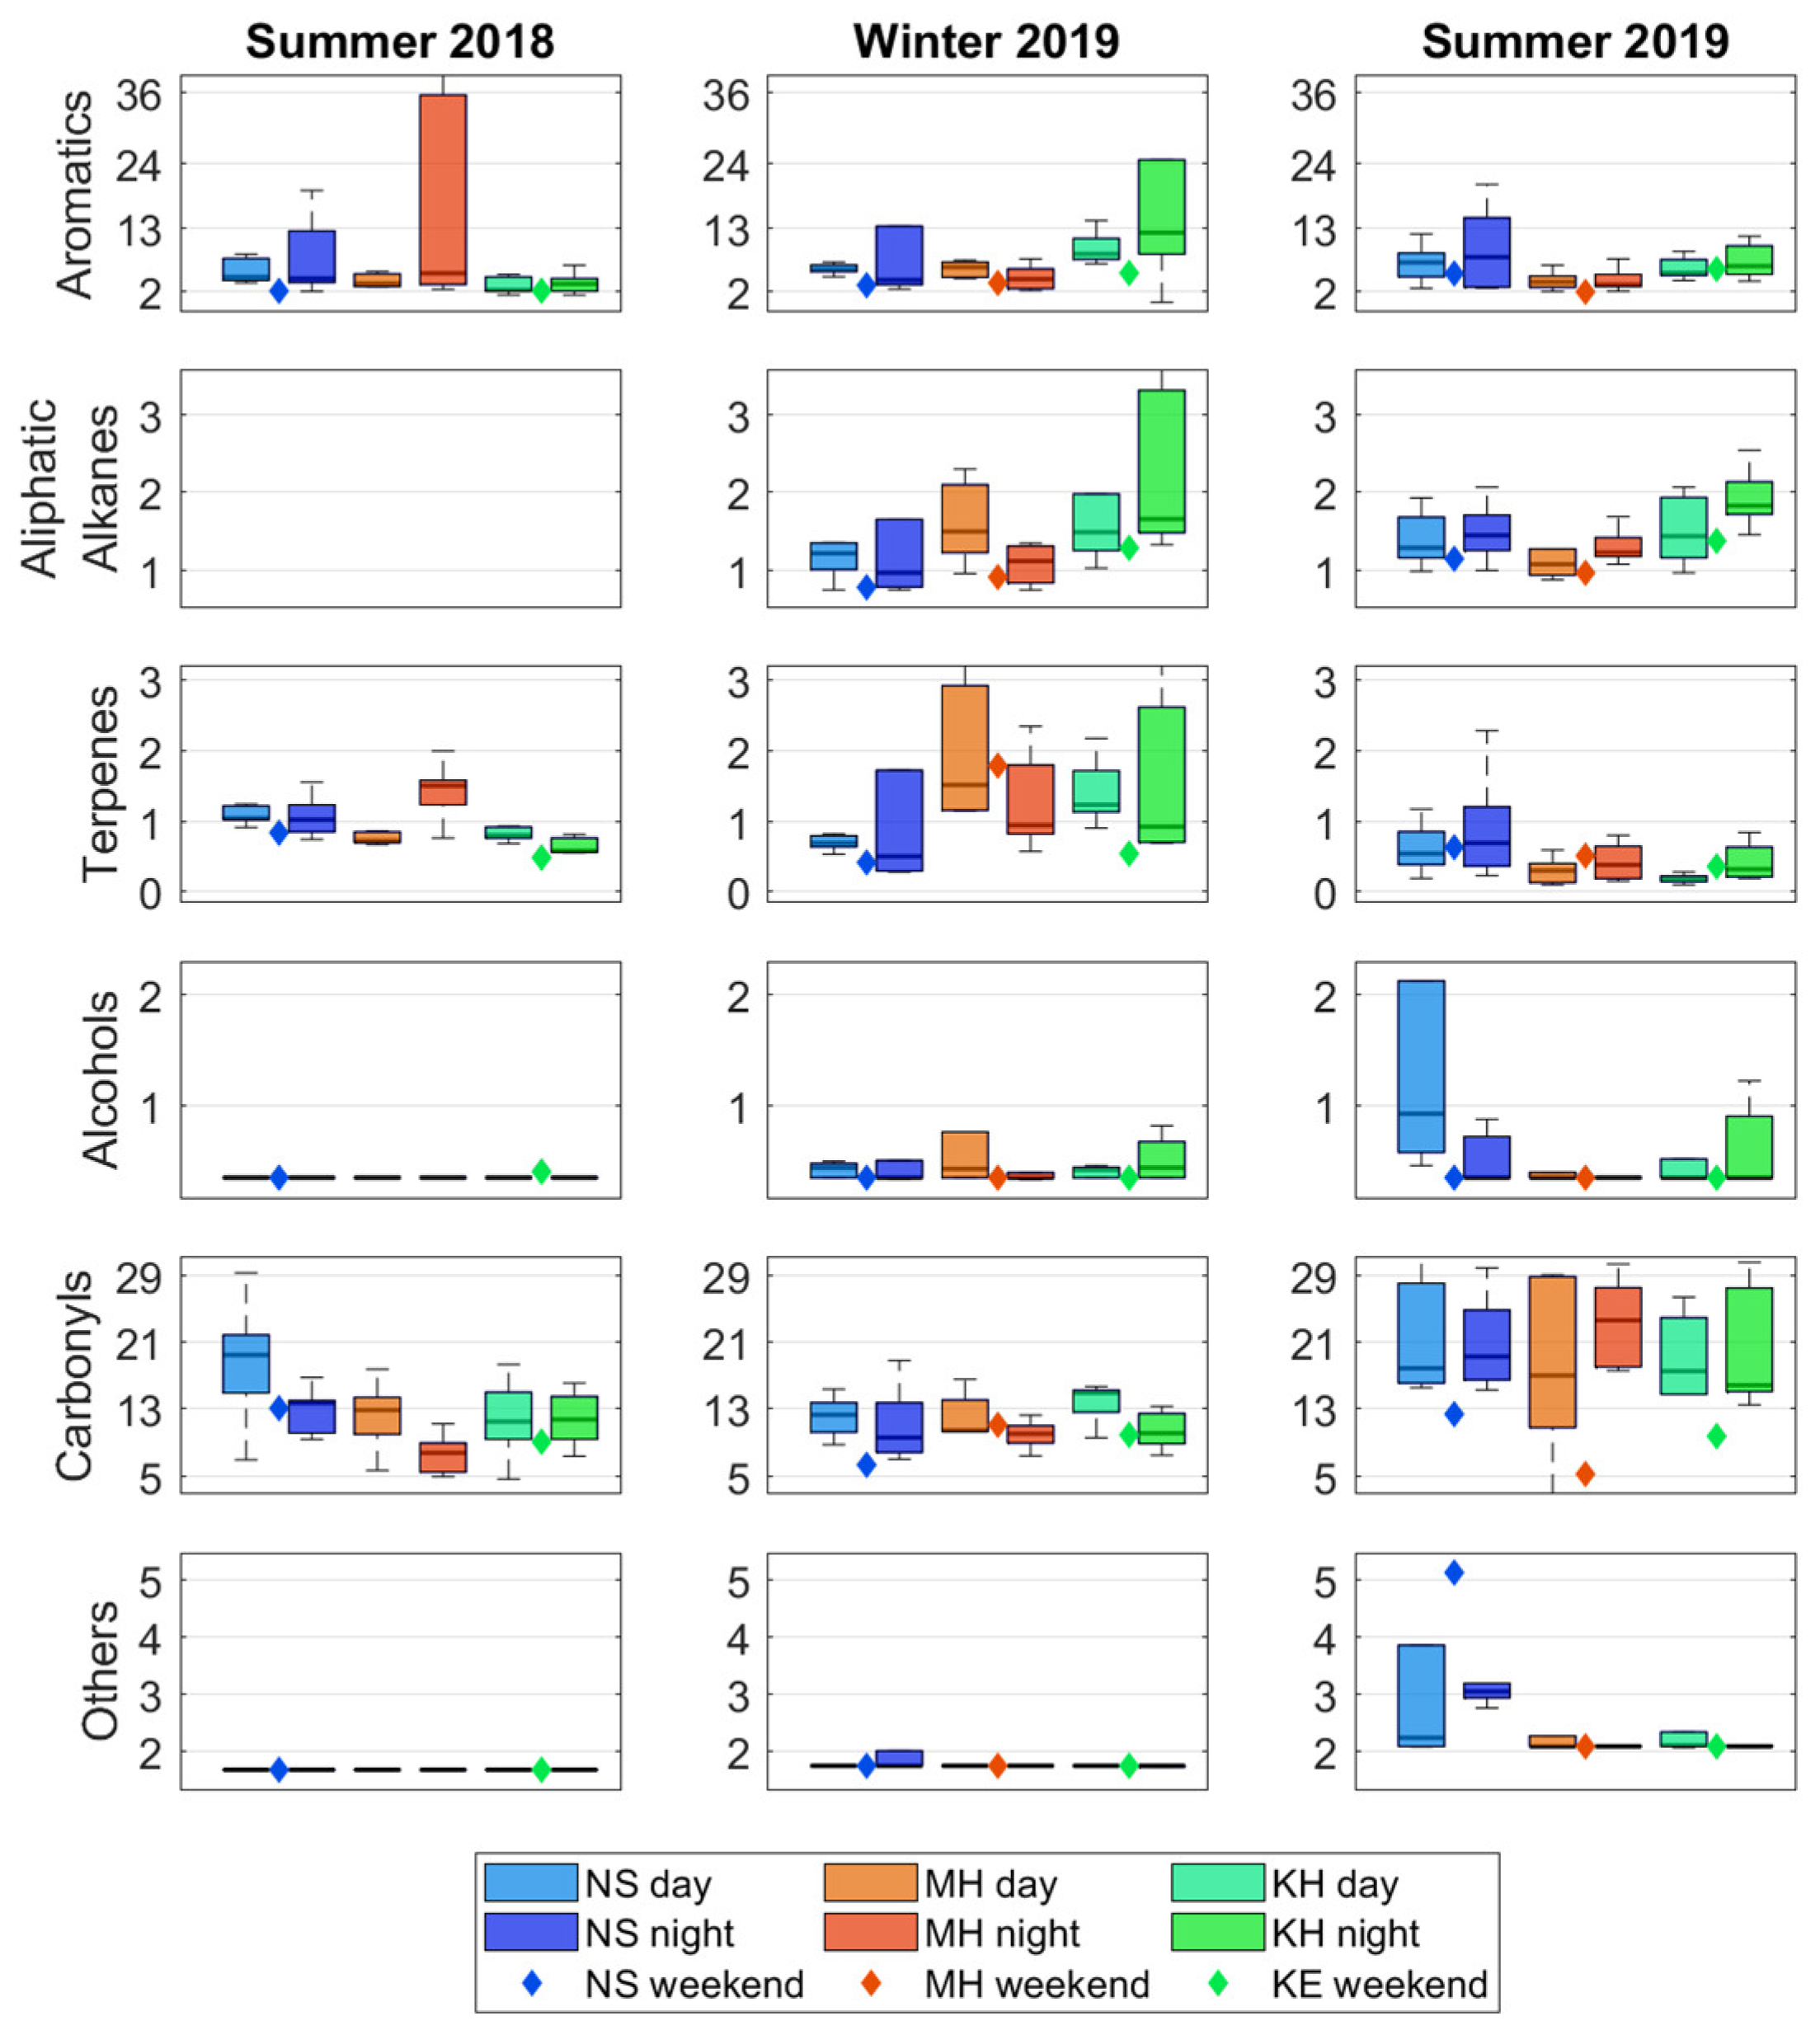
3.2. Outdoor Environment

According to Table 1, the mean outdoor concentrations were consistently below 10 μg m−3, a common range for outdoor environments [33,34]. In line with previous observations, the outdoor concentrations were significantly lower than the observed indoor concentrations. The total outdoor VOC concentration, summarizing the geometric means of 23 VOC species, showed no diurnal difference (23 μg m−3 at daytime and 22 μg m−3 at night). This is possibly because the reduction in anthropogenic and biogenic emissions at nighttime was accompanied by higher atmospheric stability (Table S2), reducing the dispersion of the emitted pollutants. Carbonyls were the most dominant group, accounting for 58.6% and 52.4% of the total daytime and nighttime concentrations, respectively (Figure S1). The second abundant group was aromatic hydrocarbons, accounting for 21.5% and 25.8%, during the daytime and nighttime, respectively. Aliphatic alkenes, alcohols, terpenes, and ‘others’ together accounted for the residual ca. 20% (i.e., 6%, 2%, 3%, and 10%, respectively), with no significant differences between day and night. Within each group, noticeable outdoor values were measured for toluene and xylene (aromatic hydrocarbons), decane (aliphatic alkanes), α-pinene (terpene), all carbonyl compounds (formaldehyde, acetaldehyde, nonanal, and acetone), and cyclopentasiloxane (‘others’).
Figure 3 illustrates the summative concentrations of each compound group (μg m−3), categorized by both spatial distribution across three locations and temporal distribution across day/night and summer/winter campaigns. The carbonyl group obtained higher mean daytime concentrations, mostly evident in summer 2018 (Figure 3). Although this trend is less pronounced for acetaldehyde, nonanal, and acetone (Table 1), formaldehyde consistently exhibits higher daytime concentrations across all three locations and seasons (Figure S2). Higher variability in the carbonyl concentrations was observed during the summer campaigns. Overall, these trends suggest additional secondary sources of carbonyls, particularly formaldehyde, likely from photo-oxidation processes. The aromatic compounds group is mainly dominated by toluene, xylene (m+p and o-), and ethylbenzene. This is expected for outdoor urban environments, as these compounds (part of the BTEX family) are generally attributed to the transportation and industrial sources. Indeed, through all three campaigns, toluene, m+p-xylene, o-xylene, and ethylbenzene showed moderate-to-strong correlations with each other (Figure S3), indicating a common source. Excluding toluene, the average concentrations of aromatic compounds show no significant differences between day and night (Table 1). However, the nighttime concentrations show greater variability, which was consistently observed at the NS location and also evident at MH and KH (Figure 3). The latter trend probably reflects the impact of local meteorology; the calm winds at nighttime and decreasing surface temperature lapse rate result in increasing concentrations of the pollutants emitted from local ground sources like transportation. The terpene group is dominated by α-pinene, which is known to be of biogenic origin and emitted from conifer foliage [35]. Outdoor terpene measurements were generally close to the MDL, which is expected given that the study region is a Mediterranean urban area. Contrary to the typical reduction in biogenic VOC emissions at lower temperatures [36], slightly higher terpene concentrations (with stronger variability) were measured during winter. Terpenes are converted to aldehydes and undergo various reactions [37], primarily with oxidants that are formed by photochemical reactions, which may explain their slower degradation during winter.
Overall, the outdoor environment shows no strong diurnal variations. Furthermore, despite differences in the geographic location within the metropolitan area, no significant spatial differences were observed. Two general trends arising from Figure 3 that are worth noting are the lower values during the weekend and the higher variability in air concentrations at night (especially for aromatic compounds). The former is expected for outdoor environments controlled by anthropogenic VOC emissions, which are reduced during weekends. This may also explain the lower carbonyl concentrations during the weekend (summer 2019), as many hydrocarbons are precursors for formaldehyde production by photo-oxidation chemistry. Support for the role of local meteorology (near-ground nighttime temperature gradient) on outdoor nighttime concentrations and variability is provided by measurements on three specific nights (25 June 2018, 27 June 2018, 22 January 2019). Despite the expectation of lower emissions from transportation and industry at night, particularly high concentrations were observed on these dates for various compounds (including, m+p and o-xylene, ethylbenzene, and nonane) in two of the daycares (KH and NS). An examination of temperature measurements at monitoring stations located at different altitudes in the region indicates that, on those dates, the temperature profile reached a local maximum at 250 m height, resulting in a temperature inversion at lower altitudes (Figure S4), where daycares KH and NS are located. None of the measured outdoor concentrations were above the environmentally permitted values. Yet, the nighttime and daytime mean concentrations of formaldehyde were above the diurnal target value of 0.8 μg m−3 [38].

3.3. Indoor Environment

Generally, the indoor environment exhibits higher mean VOC concentrations compared to the outdoors, emphasizing the importance of IAQ investigation. Values >10 μg m−3 were measured here for toluene (aromatic hydrocarbons), all measured carbonyls, limonene (terpene), ethanol,2-butoxy (alcohols), and cyclopentasiloxane (Table 1). Opposed to the outdoor trend, the total indoor concentration (summarizing 23 VOC species by geometric mean) shows strong diurnal variations: 134 μg m−3 during daytime and 204 μg m−3 during nighttime. The indoor distribution between chemical groups (i.e., relative concentrations) differs from that in the outdoor environment (Figure S1). The carbonyl group was also the most dominant group indoors, accounting for 65.2% and 68.3% of the total during the daytime and nighttime, respectively. However, terpenes (mainly limonene) and alcohols depicted a higher share of the distribution at the expense of aromatic and aliphatic hydrocarbons. This implies different emission sources and environments controlled by human activities.

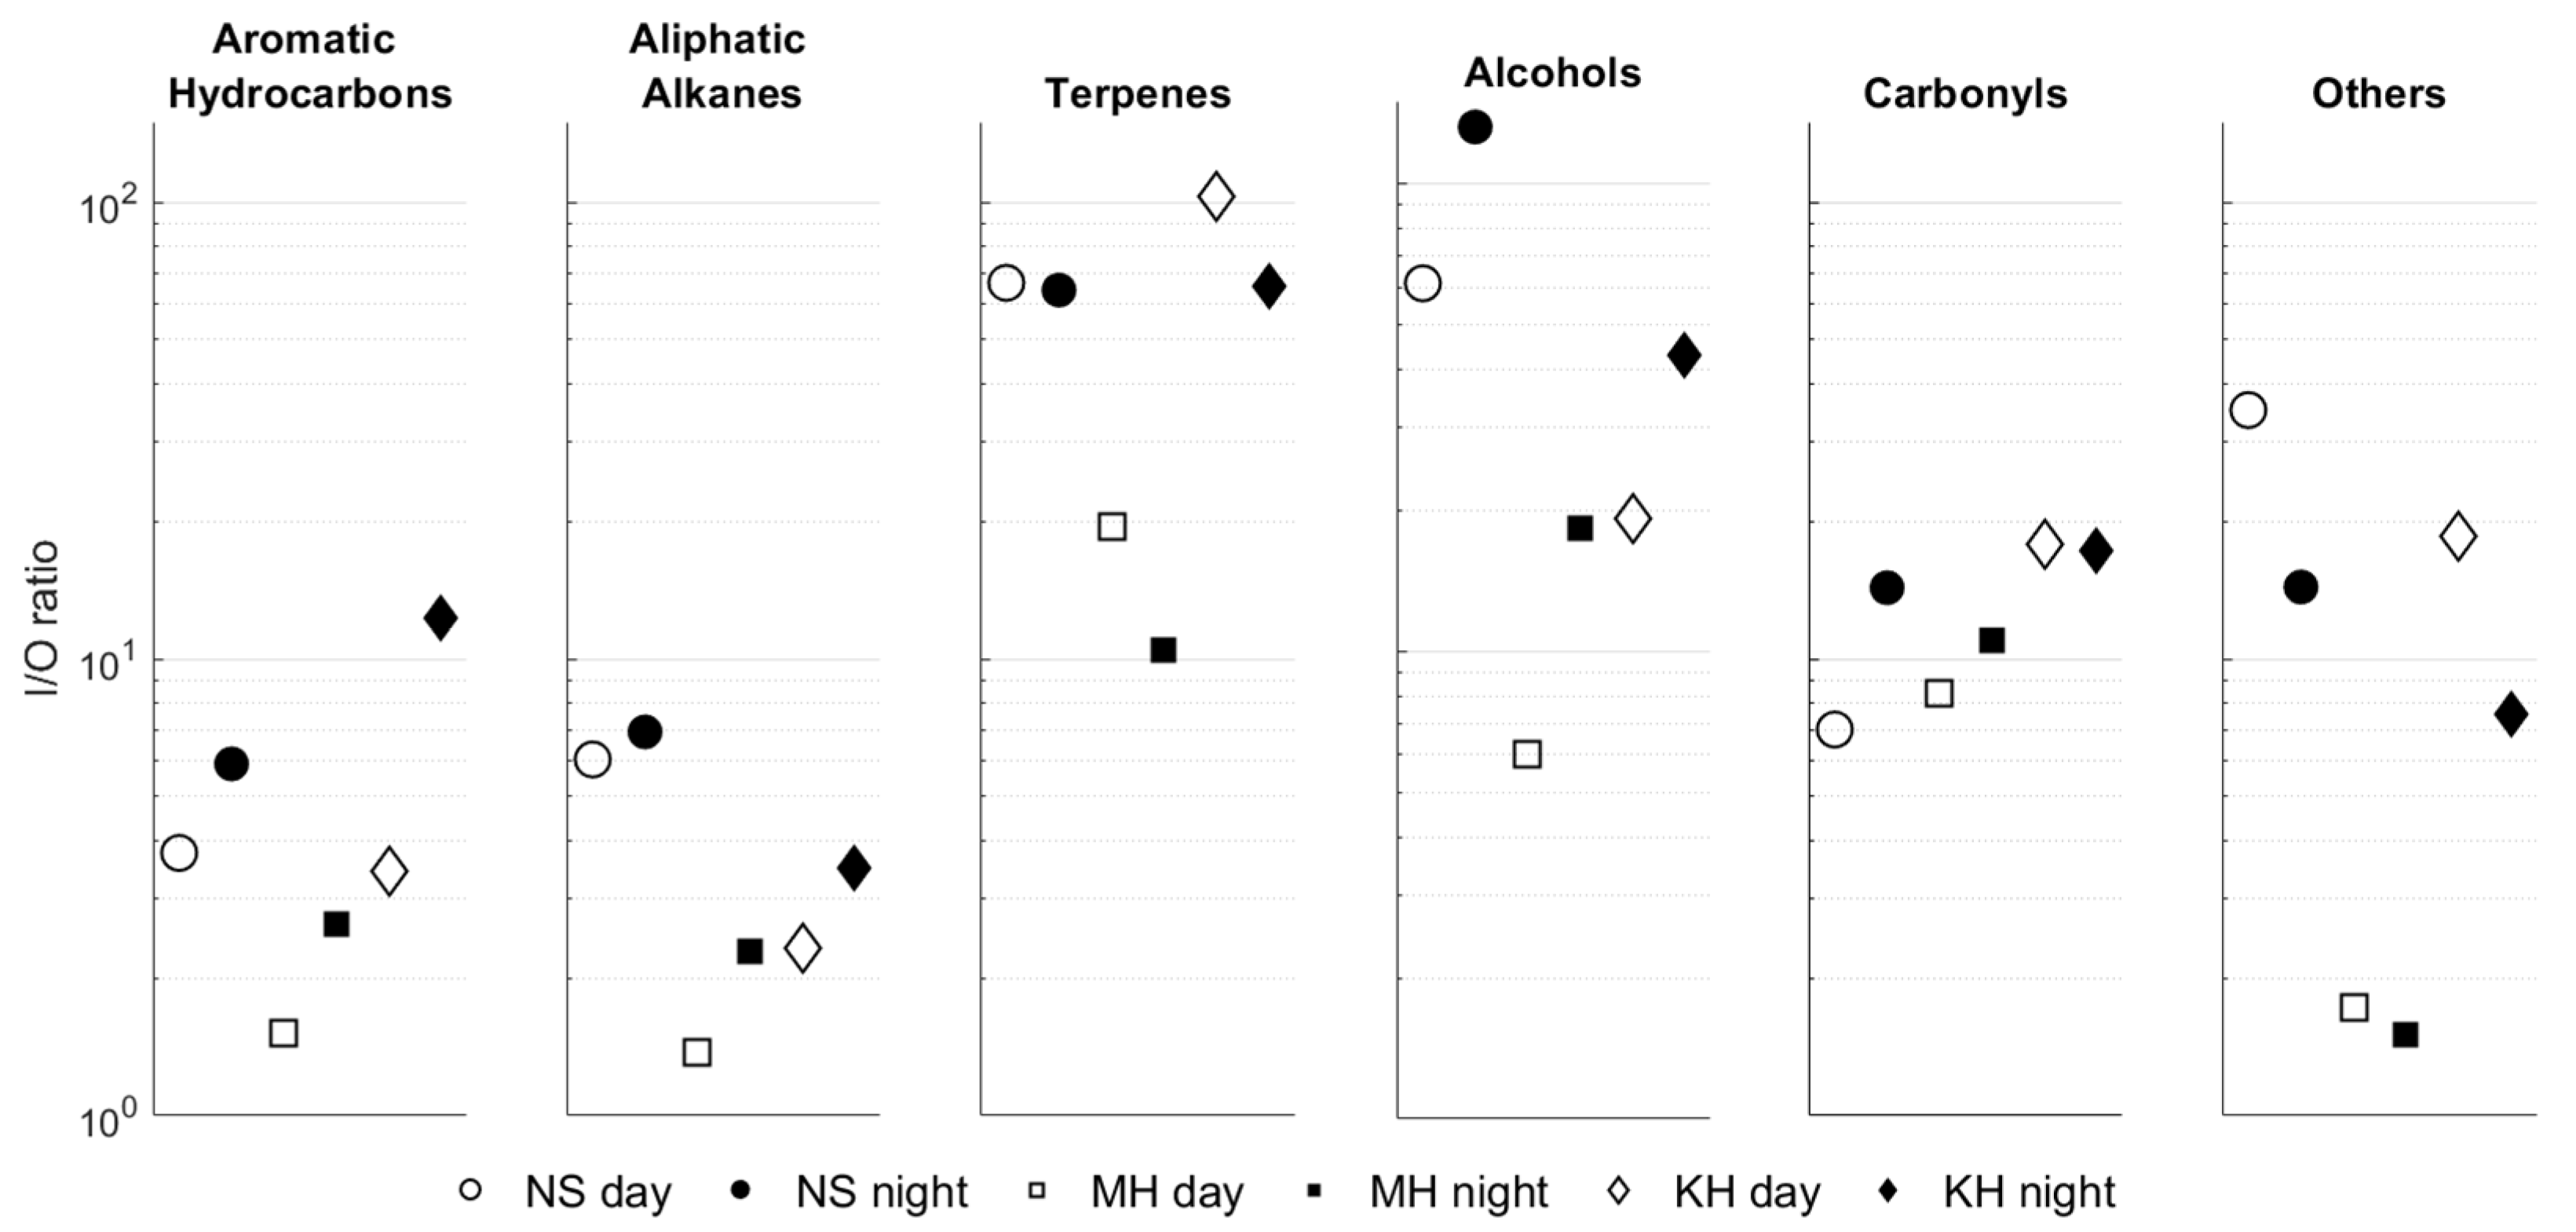
3.3.1. Indoor-to-Outdoor Concentration (I/O) Ratio

The I/O ratios of each compound group are depicted in Figure 4 (values for each compound are provided in Figures S5–S10). All of the measured VOCs show an I/O ratio greater than unity, consistent with previous studies [23,26,39,40,41,42], which rarely report I/O ratios below unity, as many compounds have mixed indoor and outdoor emission sources. According to previous findings and classification [23,42], a cut-off value of 10 was applied here to distinguish between groups with or without significant indoor emission source.
Aromatic hydrocarbons and aliphatic alkanes show I/O ratios below or close to 10, mostly ranging from 1 to 5, indicating a significant outdoor source. This is expected considering that these compounds are primarily emitted from vehicle exhausts and fossil fuel combustion [43]. Their presence and accumulation indoors may result from air exchange with the outdoor environment during the morning and afternoon rush hours, when parents bring/take their children to/from the daycare and repeatedly open and close the entrance door. This process is further compounded by slower degradation rates indoors than outdoors. The higher nighttime I/O ratio for aromatic hydrocarbons results from increased indoor concentrations at night, particularly for toluene. This may suggest emissions from a passive indoor source, such as furnishing and building materials [39,42], which becomes clearer when AER is lower. The I/O ratio for carbonyls was relatively low during the daytime at NS and MH, but clearly increased during the nighttime, coinciding with the lower AER at night. Notably, this trend was most pronounced for formaldehyde (which is ubiquitous indoors and emitted from a variety of sources) and nonanal (commonly found in household products as a fragrance component [26]), whose I/O ratios exceeded 20 during nighttime (Figure S9). The highest I/O ratios were observed for terpenes and alcohols, implying significant indoor emissions. The observed day–night variations in the I/O ratio are dominated by fluctuations in indoor emissions/ventilation, as the outdoor concentrations of both groups show no clear diurnal variations. Indeed, these compounds are abundant in various household products [44,45]. Of all detected terpenes, limonene had significantly high I/O values, in the range of 35–520 (Figure S7), and it is clearly the dominant indoor terpene. For alcohols, high nighttime values were observed for the two detected compounds in all ECE facilities.

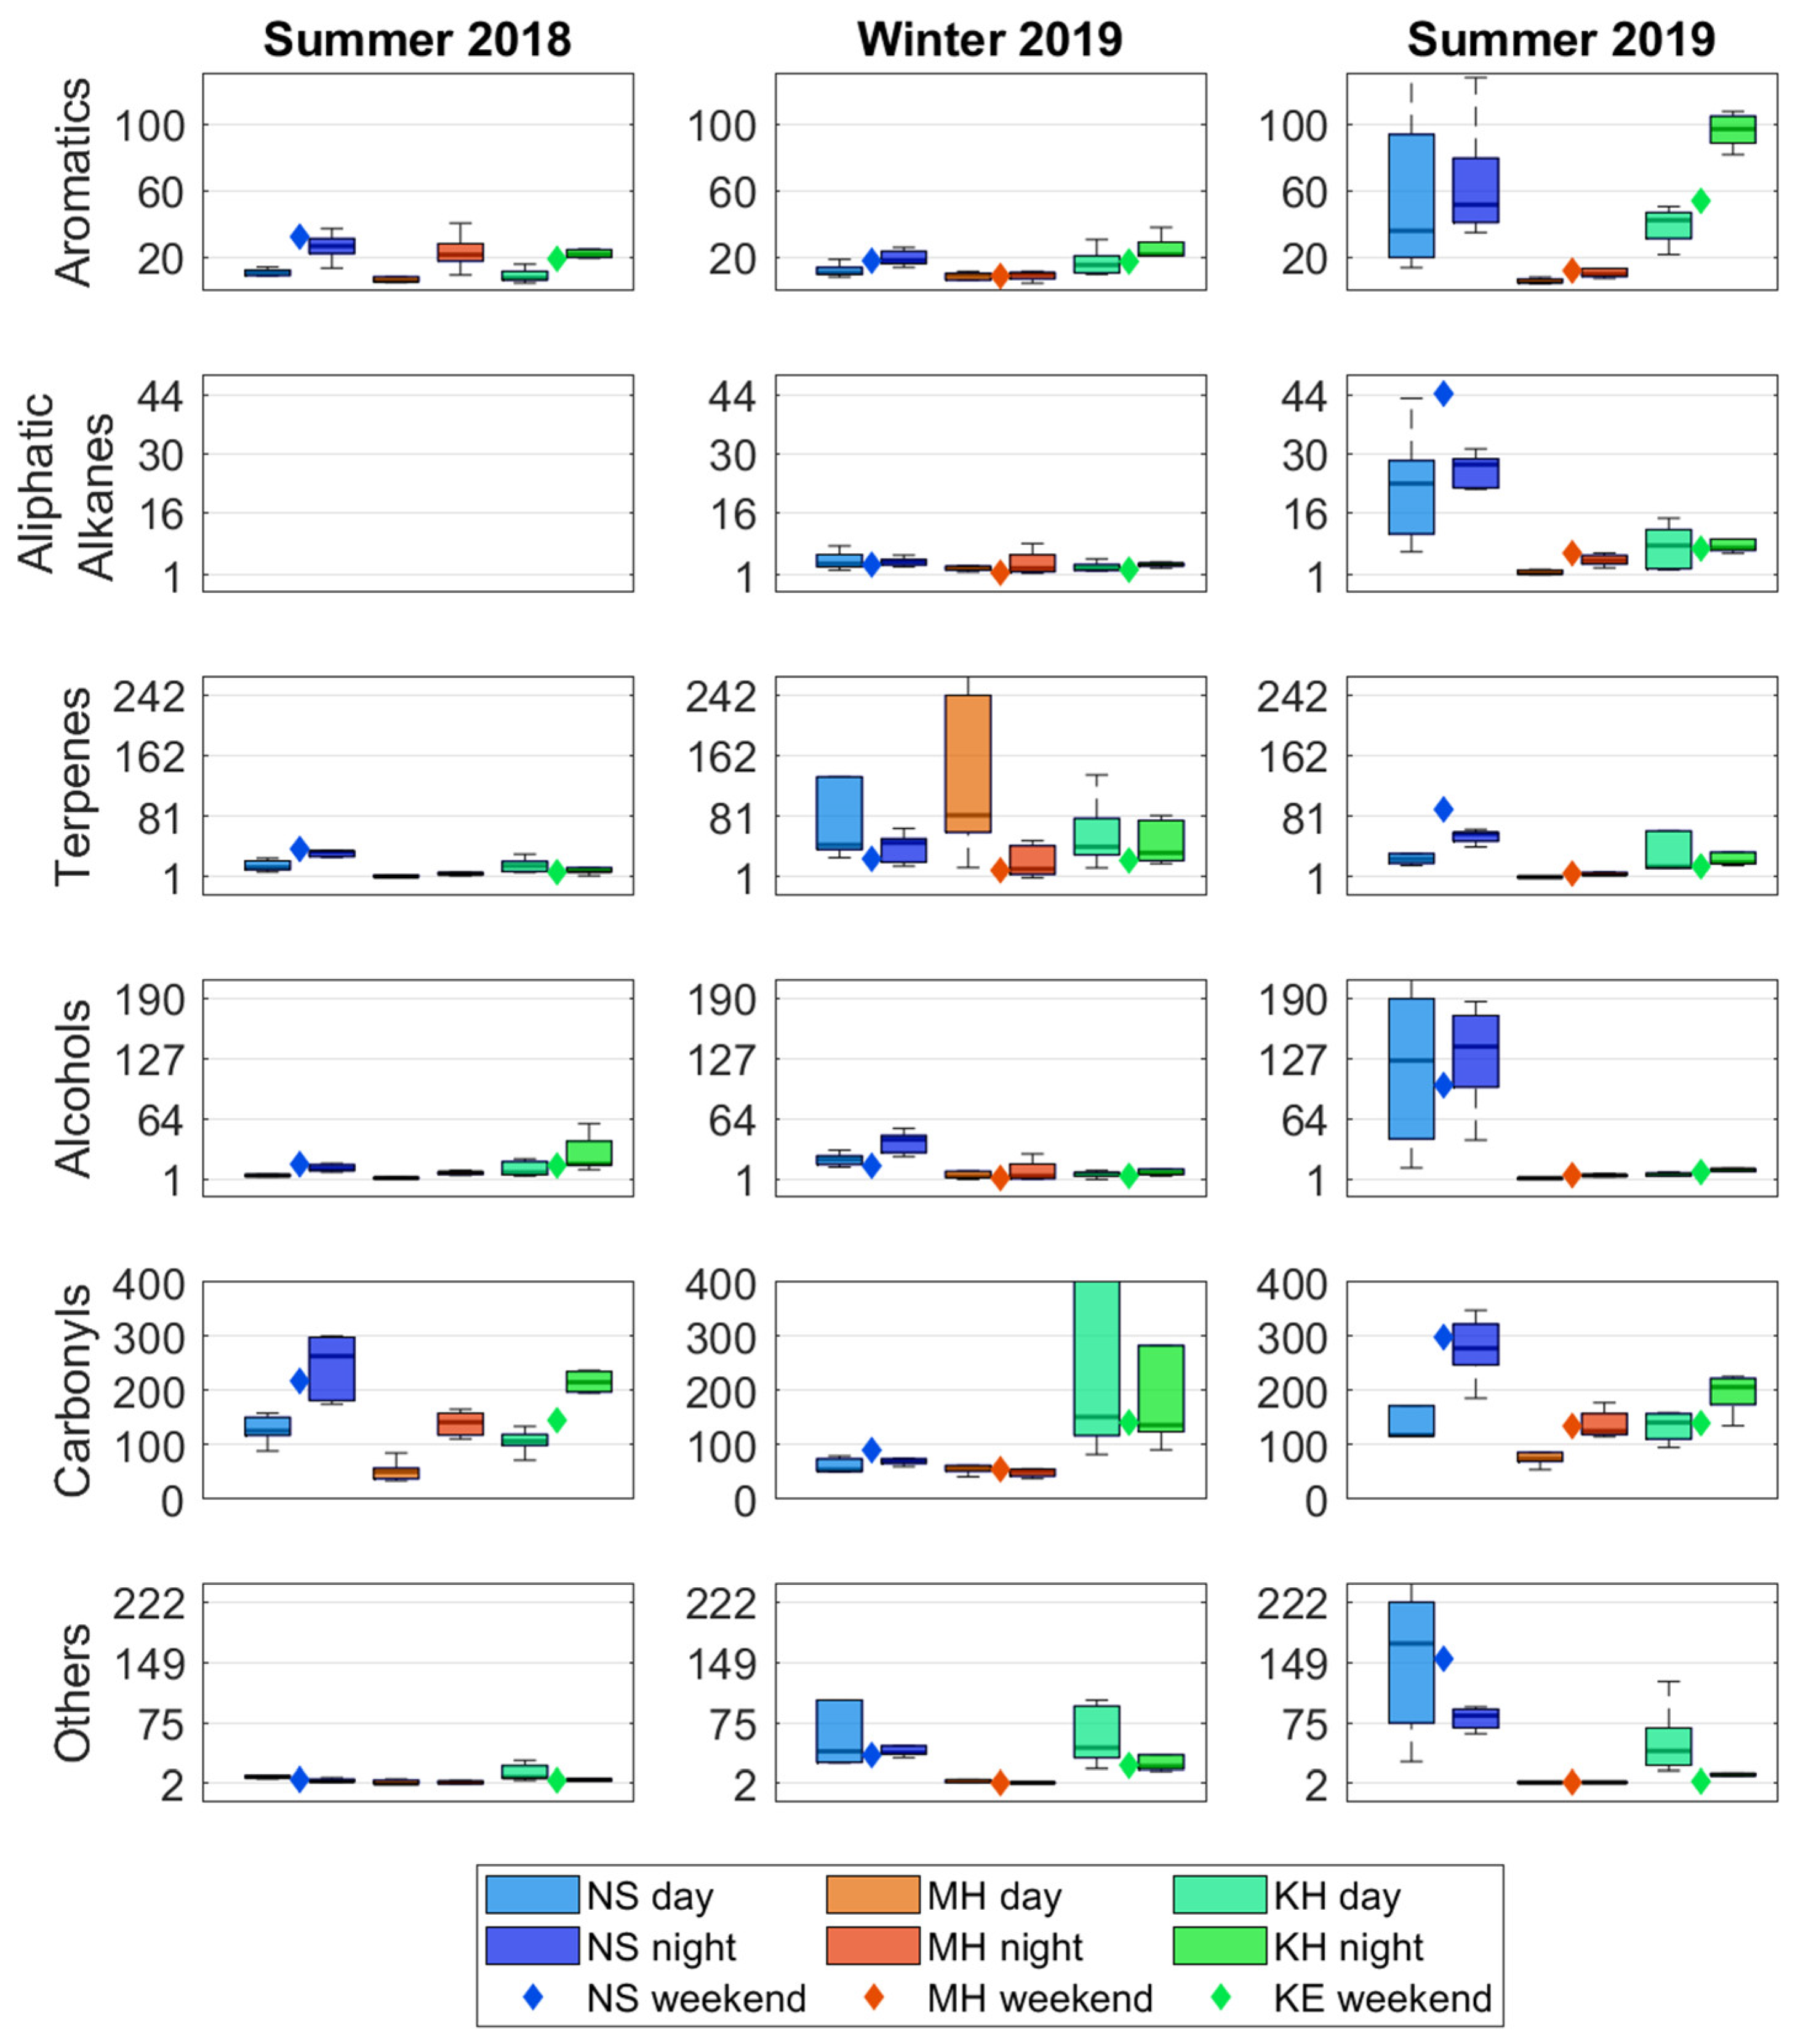
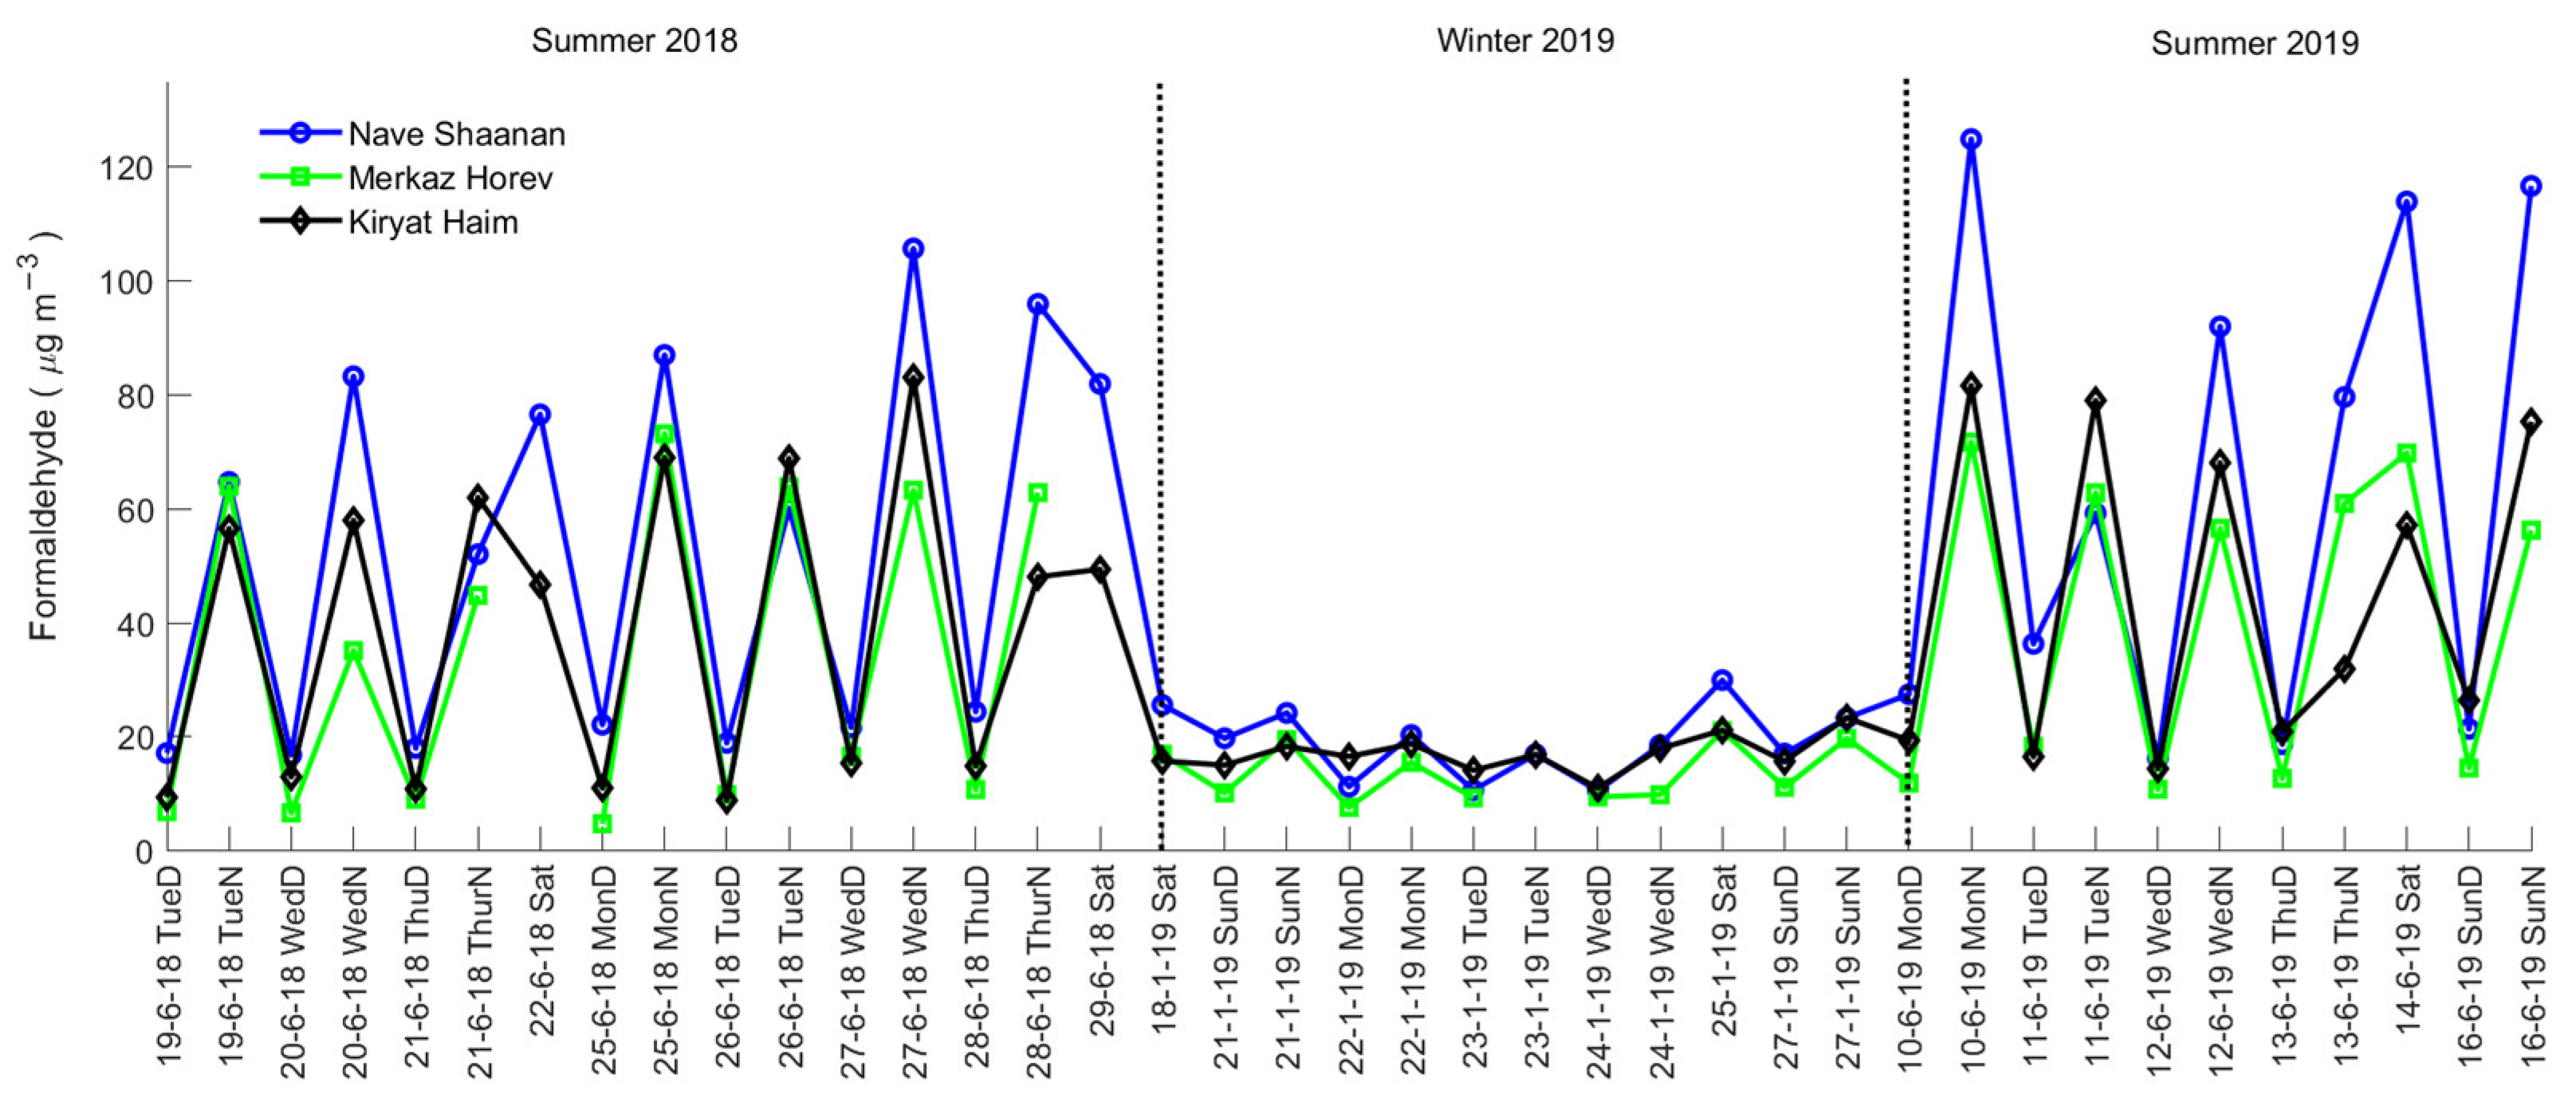
3.3.2. Spatial and Temporal Variations in Indoor Concentrations

The air exchange rate (AER) can strongly influence indoor pollutant concentrations, contributing to diurnal and seasonal fluctuations, as well as variations across the different ECE locations. Average daytime and nighttime AERs for the three ECE facilities are given in Table 2. As expected, a clear negative correlation is observed between the calculated AER and the measured maximal CO2 levels during activity hours. Unlike the common trend observed in temporal climates, the AER in both KH and NS facilities was generally lower during summer than in winter. This trend is common for the Mediterranean climate where very hot summers enhance air conditioning usage, while the mild winters allow for more natural ventilation with open windows. An exemption from this trend is observed in the MH daycare, located at the top ridge of Carmel Mountain, where a high AER was measured all year around. For all three ECE facilities, the nighttime AER was consistently below 1 h−1, demonstrating the limited ventilation during the facilities off-hours.
Diurnal variations: For indoor sources, a reduction in the AER results in higher concentrations for compounds that are emitted or generated indoors. The effect is often clearer for passive sources that are independent of human activity in the ECE facility. Although passive sources are expected to emit continuously, these emissions tend to accumulate during the nighttime due to the lower AER. This general trend of elevated indoor concentrations during the nighttime is evident for many compounds (Figure 5 and Table 1). Interestingly, this pattern of nighttime indoor peaks is observed not only for compounds with known indoor sources (formaldehyde, 1-Hexanol 2-ethyl, ethanol 2-butoxy) but also for compounds often associated with outdoor emissions (toluene, ethylbenzene, m+p-xylene, and o-xylene). In fact, indoor daytime peaks were observed only for β-pinene.
The compounds that showed high I/O ratios, carbonyls, terpenes, and alcohols, are often attributed to indoor emissions [26]. While outdoor carbonyls show maximum concentrations during the daytime, their indoor concentrations are higher at nighttime (see, for example, formaldehyde’s temporal profile in Figure 6), in line with dominant passive indoor emission source. The measured formaldehyde values of <5 μg m−3 outdoors and 10–120 μg m−3 indoors are in agreement with previous reports [7,13,46]. Examining the diurnal trends of nonanal and acetone, two carbonyls also emitted from humans [28,29], may reveal the relative contributions of this source compared to passive indoor emissions. While nonanal concentrations show a clear nighttime peak, when no people were present, no clear trend is observed for acetone (Figure S9). This suggests that nonanal passive emissions that are not related to occupants’ presence are more significant. In contrast, for acetone (a metabolic product), human-related emissions seem to play an important role, i.e., no clear increase is observed at night despite a reduced AER due to lower emissions.
Within the terpene group, limonene, a widely used fragrance product in both personal care and household cleaning products, was the most dominant compound. Aside from a single exceptionally high daytime peak, suggesting an active source, no distinct day/night trends were observed. As discussed above regarding acetone, this lack of a diurnal trend may indicate that human-related emissions are not negligible for limonene.
Alcohols are also abundant in household cleaning products as fragrances, hence their indoor emissions are likely to be associated with human activity. Nevertheless, the measured alcohol concentration increased during nighttime (Table 1 and Figure 5). While nighttime peaks in passive-source compounds are expected, such a trend in substances related to human activity is counterintuitive. Considering ECE facilities’ routines, and these compounds’ potential sources, it can be assumed that the observed nighttime peak is related to an active application occurring in proximity to closing hours of the daycare (e.g., the use of cleaning products at the end of the day, after which all windows and openings are closed). Weekend indoor concentrations were generally above the daytime concentrations, in line with the lower AER during off hours, although this trend was less clear.
Seasonal variations: Indoor measurements of VOCs with significant indoor sources (i.e., carbonyls, terpenes, and alcohols) show seasonal patterns for several compounds. While seasonal variations were not clear for all substances, none of the measured compounds consistently showed higher concentrations in winter. Some of these compounds, including formaldehyde, acetaldehyde, nonanal, α-pinene, and 1-hexanol 2-ethyl, exhibited higher concentrations in summer than in winter (Figure S11). This trend, particularly evident for carbonyls at NS and MH (Figure 5), is exemplified by the formaldehyde time series (Figure 6). The increased indoor concentrations of aldehydes and carbonyls may partly be attributed to elevated ozone levels during the summer. Ozone is known to deposit and react rapidly with indoor materials (e.g., painted walls and ceilings, furniture) and human surfaces, generating various secondary pollutants, including nonanal and de-canal [28,29]. The exceptionally high concentration variance of carbonyls at KH in winter 2019 is attributed to an elevated acetone level event at this location. This acetone peak, observed in two successive day and night measurements, may result from the use of acetone-containing cleaning products, although the exact source is unclear. In contrast, at NS and MH, acetone follows the same trend as the other carbonyls: higher in summer and lower in winter. The summer 2019 campaign highlights the dependency of indoor concentrations on AER for all chemical groups except alcohols. This trend is particularly evident at NS and KH, where low AERs of 1.2 h−1 and 1.7 h−1 in summer corresponded to higher VOC levels, in contrast to MH, which had the highest AER during this period and lower VOC levels compared to the other locations. Overall, the seasonal variation in indoor concentrations aligns with the differences in AER between summer and winter. Temperature amplitude appears to have little effect compared to AER; for example, at NS, the indoor temperature was higher in winter than summer 2019, and yet elevated VOC levels were observed in the latter, along with much lower AER following AC application.

3.4. Exposure Dose and Health Hazard Assessment

Exposure dose estimations were carried out according to the air inhalation equation provided by the Agency for Toxic Substances and Disease Registry [47]. Health risk characterization was performed by comparing the dose estimates to reference values of the California Office of Environmental Health Hazard Assessment (OEHHA) [48,49]. The No Significant Risk Levels (NSRLs) were used for carcinogenic effect, defined as the daily intake level associated with a one in 100,000 excess cancer case assuming lifetime exposure at the level in question [49]. For non-cancerous health effects, the Reference Exposure Levels (RELs) were used, which represent the concentration at or below which no adverse health effects are expected. Of the twenty-three VOCs identified and quantified in this research, eight compounds have REL values and only five of them also have NSRL references.
Exposure dose calculations were performed for the five compounds for which NSRL reference values were available—formaldehyde, acetaldehyde, ethylbenzene, naphthalene, and styrene. The inhaled dose (D, [μg day−1 kg−1]) was calculated according to Equations (2) and (3) [47]. The dose was calculated for two different averaging times (ATs). First, an averaging time of 70 years was applied as recommended by US-EPA for carcinogenic effects [47,50]. The resulting calculated dose represents the lifetime average daily dose (LADD), considering only the contribution from the exposure during one year in the ECE facility for a lifetime expectancy of 70 years. In the second calculation, an exposure duration (ED) of 1 year was used, following previous studies [7,26,51,52], assuming lifetime exposure at the level measured in the ECE facilities. The NSRL values were normalized by weight and adjusted to children using an age sensitivity factor (Equation (4); [7,53]). The LADD and NSRL values were compared using the ratio L A D D N S R L C h i l d , with values > 1 representing an inhaled dose above the recommended values (Table 3). REL values (μg m−3) are available for the following compounds: acetaldehyde, formaldehyde, naphthalene, styrene, ethylbenzene, toluene, m+p+o xylene, and methylene-chloride. The REL values were directly compared to the measured indoor concentration using the ratio C m e a s u r e d R E L (Table 4).
D = C × I R × E F B W c h i l d
where D is the inhaled dose (μg day−1 kg−1), C is the mean daytime indoor concentration (μg m−3), IR is the daily air volume inhaled by a child during daycare hours (3.3 m3 day−1), calculated based on daily air intake rate of 10 m3 day−1 for a child [47] times 8 24 ) as children are present in the facility for 8 h a day), BW is a child’s body weight (taken as 16 kg), and EF is the unitless exposure factor calculated following Equation (3).
E F = F × E D   A T
where F is the frequency of exposure (240 days per year−1), ED is the exposure duration (1 year), and AT is the averaging time, given as 70 (years) × 365 (day year−1) for LADD, or as equal to ED (years) × 365 (day year−1), which eliminates ED from the equation.
N S R L c h i l d = N S R L a d u l t B W a d u l t × 1 A S F
where NSRLchild (μg day−1 kg−1) is the NSRL value adjusted to children, NSRLadult (μg day−1) is a given value of OEHHA, BWadult is an adult body weight of 70 kg, and ASF is the age sensitivity factor, assumed to be 3 for the life period from 2 to 15 years of age [6].
For all compounds, the calculated LADDs were below their NSRL recommendations. Formaldehyde showed the highest ratio (0.15), indicating that just 7 years in an environment with the concentrations measured at the ECEs is sufficient to exceed its NSRL value. As mentioned above, the use of LADD (i.e., an averaging time of 70 years) accounts for the contribution of only a specific year of exposure to the total lifetime risk, effectively assuming no further exposure in subsequent years. This approach underestimates the results, as exposure to these ubiquitous pollutants, particularly formaldehyde, will occur in most indoor environments throughout a lifetime. Notably, when an AT of one year is used, representing lifetime exposure to the calculated daily dose, the exposure dose exceeds the NSRL for all compounds but ethylbenzene. For ethylbenzene, the dose-to-NSRL ratio remained below unity (0.53), while naphthalene and styrene doses were close to or slightly above the recommendation (ratio of 1.44 and 1.07, respectively). The exposure doses for acetaldehyde and formaldehyde in this case were well above the NSRL recommendation, with a ratio of 3.20 and 10.79, respectively. As the different averaging times used here represent two extremes (i.e., sole exposure of one year during a lifetime versus constant exposure at the levels seen in ECE facilities throughout a lifetime), the calculated doses are likely to represent lower and upper estimations. While these are only estimations, the findings highlight the need for further exposure research and assessment, specifically on formaldehyde, given its high concentrations in many indoor environments.
With respect to the REL values, all compounds except formaldehyde had ratios < 0.1 for acute, 8-h, and chronic exposure standards. Formaldehyde showed ratios of 0.27, 1.67, and 1.67 relative to acute, 8-h, and chronic exposure health effects, respectively. Exceeding the most relevant value (8-h REL), which suggests that respiratory irritation may occur [48].

4. Conclusions

In this study, 23 VOCs were repeatedly measured in early childhood education (ECE) facilities in the Haifa Bay Area, Israel. Measurements were conducted simultaneously indoors and outdoors across three facilities, allowing for comparisons of daytime activity hours vs. nighttime and weekends, as well as seasonal variation. The dominant VOC groups outdoors were carbonyls (52.4–58.6% of total), which seem to originate from primary and secondary sources, followed by aromatics (21.5–25.8%) and aliphatic alkanes (5.6–6.2%), which are mainly associated with industrial and transportation emissions. The outdoor concentrations of specific compounds were generally below 10 µg/m3, within the typical range for urban environments, and exhibited limited spatial and seasonal differences despite the heterogenous nature of the area and its various anthropogenic emission sources. However, relatively elevated concentrations were observed during periods of reduced atmospheric mixing, such as nighttime or near-ground inversion events. In line with previous studies, the mean indoor concentrations ranged around 10–100 µg/m3, much higher than outdoors for all measured VOCs, and highlighting the exposure potential in indoor environments. VOCs linked to household products and human activities were found at particularly high levels indoors, especially carbonyls, terpenes, and alcohol compounds, with I/O ratios of 20−100 and occasionally exceeding even 100. Nighttime concentrations increased due to limited air exchange rates (<1 h−1), with passive sources becoming more dominant, along with the active use of cleaning products near facility closing time. The data obtained revealed that diurnal and seasonal variations in indoor VOC levels were closely tied to air exchange rates (AERs), which followed a typical Mediterranean ventilation profile: closed windows and air conditioning during the hot summer and increased natural ventilation during the mild winter. The calculated LADD values did not exceed the available NSRL values for any of the compounds. Yet, an examination of exposure doses assuming continuous lifetime exposure to indoor levels as measured in the ECE facilities indicates that formaldehyde levels exceeded both NSRL and REL health reference values. Additionally, acetaldehyde well exceeded its NSRL reference value, while styrene and naphthalene were slightly above their respective limits. These findings highlight the importance of simultaneous indoor and outdoor measurements in identifying VOC sources and exposure dynamics. Proper ventilation and maintaining a high AER are essential, along with implementing mitigation strategies to reduce harmful VOC exposure, especially in vulnerable populations such as young children. To achieve more effective mitigation, further research is needed regarding VOC emissions during specific activities that are common in ECE facilities. This should combine data from controlled laboratory measurements, as recently reported by [15], and air measurements in real ECE facilities at a higher temporal resolution.

Supplementary Materials

The following supporting information can be downloaded at https://www.mdpi.com/article/10.3390/atmos16020181/s1, Figure S1: Relative distribution of six chemical groups during daytime and nighttime, and indoor and outdoor; Figure S2: Outdoor environment—mean formaldehyde concentration; Figure S3: Correlations between aromatic compounds for the outdoor environment; Figure S4: Temperature profile; Figures S5–S10: I/O ratio for all of the compounds; Figure S11: Time series of acetaldehyde, nonanal, α-pinene, and 1-hexanol 2-ethyl; Table S1: Sampling periods; Table S2: Outdoor temperature, relative-humidity and wind speed.

Author Contributions

Conceptualization, writing—review and editing, and supervision, Y.D.; writing—original draft preparation, formal analysis, and visualization, R.D.; methodology, fieldwork, and analytical work, M.B.; data curation and software, Y. All authors have read and agreed to the published version of the manuscript.

Funding

This research was funded by the Environmental Health Foundation, grant number PGA 1802, and by the Ministry of Environmental Protection, grant number 226-4-1.

Institutional Review Board Statement

Not applicable.

Informed Consent Statement

Not applicable.

Data Availability Statement

Data are contained within the article or Supplementary Materials.

Acknowledgments

The authors would like to express their special gratitude to all those involved in the reported study.

Conflicts of Interest

The authors declare no conflicts of interest.

References

  1. Ageel, H.K.; Harrad, S.; Abdallah, M.A.E. Occurrence, human exposure, and risk of microplastics in the indoor environment. Environ. Sci. Process. Impacts 2022, 24, 17–31. [Google Scholar] [CrossRef]
  2. Cetin, M.; Aisha, A.E.S.A. Variation of Al concentrations depending on the growing environment in some indoor plants that used in architectural designs. Environ. Sci. Pollut. Res. 2023, 30, 18748–18754. [Google Scholar] [CrossRef] [PubMed]
  3. Klepeis, N.E.; Nelson, W.C.; Ott, W.R.; Robinson, J.P.; Tsang, A.M.; Switzer, P.; Behar, J.V.; Hern, S.C.; Engelmann, W.H. The National Human Activity Pattern Survey (NHAPS): A resource for assessing exposure to environmental pollutants. J. Expo. Anal. Environ. Epidemiol. 2001, 11, 231–252. [Google Scholar] [CrossRef]
  4. Van Tran, V.; Park, D.; Lee, Y.C. Indoor air pollution, related human diseases, and recent trends in the control and improvement of indoor air quality. Int. J. Environ. Res. Public Health 2020, 17, 2927. [Google Scholar] [CrossRef]
  5. Haagen-Smit, A.J.; Bradley, C.E.; Fox, M.M. Ozone Formation in Photochemical Oxidation of Organic Substances. Ind. Eng. Chem. 1953, 45, 2086–2089. [Google Scholar] [CrossRef]
  6. Edwards, R.D.; Jurvwlin, J.; Koistinen, K.; Saarela, K.; Jantunen, M. VOC source identification from personal and residential indoor, outdoor and workplace microenvironment samples in EXPOLIS-Helsinki, Finland. Atmos. Environ. 2001, 35, 4829–4841. [Google Scholar] [CrossRef]
  7. Bradman, A.; Gaspar, F.; Castorina, R.; Williams, J.; Hoang, T.; Jenkins, P.L.; McKone, T.E.; Maddalena, R. Formaldehyde and acetaldehyde exposure and risk characterization in California early childhood education environments. Indoor Air 2016, 27, 104–113. [Google Scholar] [CrossRef] [PubMed]
  8. Cheng, M.; Galbally, I.E.; Molloy, S.B.; Selleck, P.W.; Keywood, M.D.; Lawson, S.J.; Powell, J.C.; Gillett, R.W.; Dunne, E. Factors controlling volatile organic compounds in dwellings in Melbourne, Australia. Indoor Air 2016, 26, 219–230. [Google Scholar] [CrossRef]
  9. Paciência, I.; Madureira, J.; Rufo, J.; Moreira, A.; Fernandes, E.d.O. A systematic review of evidence and implications of spatial and seasonal variations of volatile organic compounds (VOC) in indoor human environments. J. Toxicol. Environ. Health Part B Crit. Rev. 2016, 19, 47–64. [Google Scholar] [CrossRef]
  10. Dodson, R.E.; Udesky, J.O.; Colton, M.D.; McCauley, M.; Camann, D.E.; Yau, A.Y.; Adamkiewicz, G.; Rudel, R.A. Chemical exposures in recently renovated low-income housing: Influence of building materials and occupant activities. Environ. Int. 2017, 109, 114–127. [Google Scholar] [CrossRef]
  11. Goldizen, F.C.; Sly, P.D.; Knibbs, L.D. Respiratory effects of air pollution on children. Pediatr. Pulmonol. 2016, 51, 94–108. [Google Scholar] [CrossRef] [PubMed]
  12. Cakmak, S.; Dales, R.E.; Liu, L.; Kauri, L.M.; Lemieux, C.L.; Hebbern, C.; Zhu, J. Residential exposure to volatile organic compounds and lung function: Results from a population-based cross-sectional survey. Environ. Pollut. 2014, 194, 145–151. [Google Scholar] [CrossRef] [PubMed]
  13. Garrett, M.H.; Hooper, M.A.; Hooper, B.M.; Rayment, P.R.; Abramson, M.J. Increased risk of allergy in children due to formaldehyde exposure in homes. Allergy Eur. J. Allergy Clin. Immunol. 1999, 54, 330–337. [Google Scholar] [CrossRef] [PubMed]
  14. Landrigan, P.J.; Fuller, R.; Fisher, S.; Suk, W.A.; Sly, P.; Chiles, T.C.; Bose-O’Reilly, S. Pollution and children’s health. Sci. Total Environ. 2019, 650, 2389–2394. [Google Scholar] [CrossRef] [PubMed]
  15. Zheng, H.; Csemezová, J.; Loomans, M.; Walker, S.; Gauvin, F.; Zeiler, W. Species profile of volatile organic compounds emission and health risk assessment from typical indoor events in daycare centers. Sci. Total Environ. 2024, 918, 170734. [Google Scholar] [CrossRef] [PubMed]
  16. Etzel, R.A. The special vulnerability of children. Int. J. Hyg. Environ. Health 2020, 227, 113516. [Google Scholar] [CrossRef]
  17. Makri, A.; Stilianakis, N.I. Vulnerability to air pollution health effects. Int. J. Hyg. Environ. Health 2008, 211, 326–336. [Google Scholar] [CrossRef]
  18. Selevan, S.G.; Kimmel, C.A.; Mendola, P. Identifying critical windows of exposure for children’s health. Environ. Health Perspect. 2000, 108 (Suppl. S3), 451–455. [Google Scholar]
  19. Saadeh, R.; Klaunig, J. Child’s Development and Respiratory System Toxicity. J. Environ. Anal. Toxicol. 2014, 4, 5. [Google Scholar] [CrossRef]
  20. Zakaria, I.B.; Mahyuddin, N.; Mohd-Sahabuddin, M.F. Factors Influencing Indoor Air Pollution in Kindergarten: A Systematic Literature Review. J. Adv. Res. Appl. Sci. Eng. Technol. 2024, 256–277. [Google Scholar]
  21. Vardoulakis, S.; Giagloglou, E.; Steinle, S.; Davis, A.; Sleeuwenhoek, A.; Galea, K.S.; Dixon, K.; Crawford, J.O. Indoor exposure to selected air pollutants in the home environment: A systematic review. Int. J. Environ. Res. Public Health 2020, 17, 8972. [Google Scholar] [CrossRef]
  22. Abbatt, J.P.D.; Wang, C. The atmospheric chemistry of indoor environments. Environ. Sci. Process. Impacts 2019, 22, 25–48. [Google Scholar] [CrossRef]
  23. Xu, J.; Szyszkowicz, M.; Jovic, B.; Cakmak, S.; Austin, C.C.; Zhu, J. Estimation of indoor and outdoor ratios of selected volatile organic compounds in Canada. Atmos. Environ. 2016, 141, 523–531. [Google Scholar] [CrossRef]
  24. Portela, N.B.; Teixeira, E.C.; Agudelo-Castañeda, D.M.; da Silva Civeira, M.; Silva, L.F.; Vigo, A.; Kumar, P. Indoor-outdoor relationships of airborne nanoparticles, BC and VOCs at rural and urban preschools. Environ. Pollut. 2021, 268, 115751. [Google Scholar] [CrossRef]
  25. Pegas, P.N.; Alves, C.A.; Evtyugina, M.G.; Nunes, T.; Cerqueira, M.; Franchi, M.; Pio, C.A.; Almeida, S.M.; Verde, S.C.; Freitas, M.C. Seasonal evaluation of outdoor/indoor air quality in primary schools in Lisbon. J. Environ. Monit. 2011, 13, 657–667. [Google Scholar] [CrossRef]
  26. Hoang, T.; Castorina, R.; Gaspar, F.; Maddalena, R.; Jenkins, P.L.; Zhang, Q.; McKone, T.E.; Benfenati, E.; Shi, A.Y.; Bradman, A. VOC exposures in California early childhood education environments. Indoor Air 2016, 27, 609–621. [Google Scholar] [CrossRef] [PubMed]
  27. Vasile, V.; Catalina, T.; Dima, A.; Ion, M. Pollution Levels in Indoor School Environment—Case Studies. Atmosphere 2024, 15, 399. [Google Scholar] [CrossRef]
  28. Kruza, M.; Lewis, A.C.; Morrison, G.C.; Carslaw, N. Impact of surface ozone interactions on indoor air chemistry: A modeling study. Indoor Air 2017, 27, 1001–1011. [Google Scholar] [CrossRef]
  29. Weschler, C.J.; Wisthaler, A.; Cowlin, S.; Tamás, G.; Strøm-Tejsen, P.; Hodgson, A.T.; Destaillats, H.; Herrington, J.; Zhang, J. Ozone-initiated chemistry in an occupied simulated aircraft cabin. Environ. Sci. Technol. 2007, 41, 6177–6184. [Google Scholar] [CrossRef] [PubMed]
  30. EHF; MH—Environment and Health Fund, Ministry of Health. Environmental Health in Israel 2014; 2014. Available online: https://www.gov.il/en/pages/bsv-sviva2014h (accessed on 25 January 2024).
  31. Yuval; Broday, D.M. High-resolution spatial patterns of long-term mean concentrations of air pollutants in Haifa Bay area. Atmos. Environ. 2006, 40, 3653–3664. [Google Scholar] [CrossRef]
  32. Yuval; Tritscher, T.; Raz, R.; Levi, Y.; Levy, I.; Broday, D.M. Emissions vs. turbulence and atmospheric stability: A study of their relative importance in determining air pollutant concentrations. Sci. Total Environ. 2020, 733, 139300. [Google Scholar] [CrossRef] [PubMed]
  33. Pinthong, N.; Thepanondh, S.; Kondo, A. Source Identification of VOCs and their Environmental Health Risk in a Petrochemical Industrial Area. Aerosol Air Qual. Res. 2022, 22, 210064. [Google Scholar] [CrossRef]
  34. Uchiyama, S.; Noguchi, M.; Hishiki, M.; Shimizu, M.; Kunugita, N.; Isobe, T.; Nakayama, S.F. Long-term monitoring of indoor, outdoor, and personal exposure to gaseous chemical compounds. Sci. Total Environ. 2023, 906, 167830. [Google Scholar] [CrossRef]
  35. Rasmussen, R.A. What do the hydrocarbons from trees contribute to air pollution? J. Air Pollut. Control Assoc. 1972, 22, 537–543. [Google Scholar] [CrossRef]
  36. Kim, J.C.; Kim, K.J.; Kim, D.S.; Han, J.S. Seasonal variations of monoterpene emissions from coniferous trees of different ages in Korea. Chemosphere 2005, 59, 1685–1696. [Google Scholar] [CrossRef] [PubMed]
  37. Librando, V.; Tringali, G. Atmospheric fate of OH initiated oxidation of terpenes. Reaction mechanism of α-pinene degradation and secondary organic aerosol formation. J. Environ. Manag. 2005, 75, 275–282. [Google Scholar] [CrossRef] [PubMed]
  38. MoEP. Clean Air Law. 2008. Available online: https://www.gov.il/en/pages/clean_air_law_2008 (accessed on 24 December 2024).
  39. Kumar, A.; Singh, B.P.; Punia, M.; Singh, D.; Kumar, K.; Jain, V.K. Assessment of indoor air concentrations of VOCs and their associated health risks in the library of Jawaharlal Nehru University, New Delhi. Environ. Sci. Pollut. Res. 2014, 21, 2240–2248. [Google Scholar] [CrossRef]
  40. Vu, D.C.; Ho, T.L.; Vo, P.H.; Carlo, G.; McElroy, J.A.; Davis, A.N.; Nagel, S.C.; Lin, C.H. Determination of volatile organic compounds in child care centers by thermal desorption gas chromatography-mass spectrometry. Anal. Methods 2018, 10, 730–742. [Google Scholar] [CrossRef]
  41. Lucialli, P.; Marinello, S.; Pollini, E.; Scaringi, M.; Sajani, S.Z.; Marchesi, S.; Cori, L. Indoor and outdoor concentrations of benzene, toluene, ethylbenzene and xylene in some Italian schools evaluation of areas with different air pollution. Atmos. Pollut. Res. 2020, 11, 1998–2010. [Google Scholar] [CrossRef]
  42. Missia, D.A.; Demetriou, E.; Michael, N.; Tolis, E.I.; Bartzis, J.G. Indoor exposure from building materials: A field study. Atmos. Environ. 2010, 44, 4388–4395. [Google Scholar] [CrossRef]
  43. Yang, J.; Lei, G.; Liu, C.; Wu, Y.; Hu, K.; Zhu, J.; Bao, J.; Lin, W.; Jin, J. Characteristics of particulate-bound n-Alkanes indicating sources of PM2.5in Beijing, China. Atmos. Chem. Phys. 2023, 23, 3015–3029. [Google Scholar] [CrossRef]
  44. Milhem, S.A.; Verriele, M.; Nicolas, M.; Thevenet, F. Indoor use of essential oil-based cleaning products: Emission rate and indoor air quality impact assessment based on a realistic application methodology. Atmos. Environ. 2021, 246, 118060. [Google Scholar] [CrossRef]
  45. Harding-Smith, E.; Shaw, D.R.; Shaw, M.; Dillon, T.J.; Carslaw, N. Does green mean clean? Volatile organic emissions from regular versus green cleaning products. Environ. Sci. Process. Impacts 2024, 26, 436–450. [Google Scholar] [CrossRef] [PubMed]
  46. Maung, T.Z.; Bishop, J.E.; Holt, E.; Turner, A.M.; Pfrang, C. Indoor Air Pollution and the Health of Vulnerable Groups: A Systematic Review Focused on Particulate Matter (PM), Volatile Organic Compounds (VOCs) and Their Effects on Children and People with Pre-Existing Lung Disease. Int. J. Environ. Res. Public Health 2022, 19, 8752. [Google Scholar] [CrossRef]
  47. ATSDR. Public Health Assessment Guidance Manual; U.S. Department of Health and Human Services: Atlanta, GA, USA; Public Health Service: Atlanta, GA, USA; Agency for Toxic Substances and Disease Registry: Atlanta, GA, USA, 2005; pp. 1–357. [Google Scholar]
  48. OEHHA. Appendix B. In Acute, 8-Hour, and Chronic Reference Exposure Levels (RELs) Summary Table; Office of Environmental Health Hazard Assessment: Sacramento, CA, USA, 2013. Available online: https://oehha.ca.gov/air/general-info/oehha-acute-8-hour-and-chronic-reference-exposure-level-rel-summary (accessed on 17 July 2024).
  49. OEHHA. Proposition 65 Process for Developing Safe Harbor Numbers; Office of Environmental Health Hazard Assessment: Sacramento, CA, USA, 2001.
  50. EPA. Risk Assessment Guidance for Superfund: Volume III—Part A; U.S. Environmental Protection Agency: Washington, DC, USA, 2001.
  51. Bradman, A.; Castorina, R.; Gaspar, F.; Nishioka, M.; Colón, M.; Weathers, W.; Egeghy, P.P.; Maddalena, R.; Williams, J.; Jenkins, P.L.; et al. Flame retardant exposures in California early childhood education environments. Chemosphere 2014, 116, 61–66. [Google Scholar] [CrossRef] [PubMed]
  52. Bayati, M.; Vu, D.C.; Vo, P.H.; Rogers, E.; Park, J.; Ho, T.L.; Davis, A.N.; Gulseven, Z.; Carlo, G.; Palermo, F.; et al. Health risk assessment of volatile organic compounds at daycare facilities. Indoor Air 2021, 31, 977–988. [Google Scholar] [CrossRef] [PubMed]
  53. OEHHA. Technical Support Document for Cancer Potency Factors: Methodologies for Derivation, Listing of Available Values, and Adjustments to Allow for Early Life Stage Exposures; Office of Environmental Health Hazard Assessment: Sacramento, CA, USA, 2009.
Figure 1. Map of the Haifa Bay Area and the location of three ECE facilities participating in the study. Below, a topographic relief cross-section of the dotted red line.
Atmosphere 16 00181 g001
Figure 2. Self-designed air sampling system consisting of a diaphragm pump placed downstream and three sampling lines, each including an adsorber and a flow regulator.
Atmosphere 16 00181 g002
Figure 3. Summative outdoor concentrations of the chemical groups (μg m−3), categorized by spatial distribution across three locations and temporal distribution across day/night and summer/winter campaigns.
Atmosphere 16 00181 g003
Figure 4. Indoor/outdoor ratio (logarithmic scale) of the chemical groups in the three ECE facilities during daytime (open symbols) and nighttime (solid symbols).
Atmosphere 16 00181 g004
Figure 5. Summative indoor concentrations of the chemical groups (μg m−3), categorized by spatial distribution across three locations and temporal distribution across day/night and summer/winter campaigns.
Atmosphere 16 00181 g005
Figure 6. Temporal profile of indoor formaldehyde concentration.
Atmosphere 16 00181 g006
Table 1. Overall concentrations for the 23 quantified VOCs indoors and outdoors.
Indoor Concentration [μg m−3]Outdoor Concentration [μg m−3]
Arithmetic Mean (stdv)MedianGeometric MeanArithmetic Mean (stdv)MedianGeometric Mean
Name
(MDL [μg m−3])
DayNightDayNightDayNightDayNightDayNightDayNight
Aromatic hydrocarbons
Toluene
(0.120)
8.58 (10.11)18.53 (18.38)4.8812.645.5812.312.31 (1.52)5.74 (12.50)1.861.981.892.43
2-EthylToluene
(0.048)
1.14
(3.92)
0.74 (1.46)0.300.280.350.380.13 (0.07)0.15 (0.07)0.120.120.120.14
Styrene
(0.240)
1.17
(1.96)
1.93 (2.03)0.651.170.641.230.17 (0.00)0.21 (0.18)0.170.170.170.19
m+p-Xylene
(0.095)
2.71
(3.34)
4.31 (2.82)1.683.142.013.521.40 (0.83)1.80 (2.34)1.241.081.191.23
o-Xylene
(0.085)
2.54
(4.25)
5.23 (6.07)1.283.101.563.340.79 (0.82)1.00 (1.57)0.600.520.620.63
Ethylbenzene
(0.048)
1.07
(0.78)
1.83 (1.04)0.881.570.901.570.56 (0.31)0.67 (0.78)0.530.540.470.48
Trimethylbenzene
(0.500)
1.89
(3.99)
1.80 (2.59)0.780.870.931.060.49 (0.18)0.67 (0.69)0.450.350.460.49
Naphthalene
(0.071)
0.29
(1.29)
0.30 (1.28)<MDL<MDL0.080.090.08 (0.08)0.08 (0.03)<MDL<MDL<MDL<MDL
Aliphatic Alkanes
Nonane
(0.095)
1.11
(1.55)
1.31 (1.61)0.590.600.670.790.32 (0.17)0.37 (0.33)0.290.290.270.27
Decane
(0.480)
3.45
(4.79)
4.56 (4.44)1.632.332.053.120.75 (0.39)0.80 (0.41)0.630.800.670.71
Undecane
(0.480)
2.36
(2.91)
2.84 (2.90)1.081.291.301.770.37 (0.08)0.40 (0.22)<MDL<MDL<MDL<MDL
Terpenes
α-Pinene
(0.048)
2.53
(1.53)
7.06 (5.18)2.165.322.035.660.78 (0.63)0.86 (0.68)0.720.670.550.64
β-Pinene
(0.048)
1.91
(3.54)
1.18 (1.52)1.000.650.720.510.06 (0.05)0.07 (0.08)0.030.030.050.05
Limonene
(0.050)
38.05 (69.49)19.44 (20.31)13.4810.519.579.550.08 (0.14)0.11 (0.25)<MDL<MDL0.050.05
Alcohols
1-Hexanol, 2-ethyl
(0.240)
3.12
(2.30)
6.43 (5.45)2.824.652.174.380.20 (0.16)0.18 (0.04)0.170.170.180.18
Ethanol, 2-butoxy
(0.240)
16.47 (53.54)19.71 (38.16)1.034.711.965.980.38 (0.74)0.23 (0.17)0.170.170.240.20
Carbonyls
Formaldehyde (0.400)14.97 (6.00)55.65 (28.78)14.5560.5413.8746.823.55 (1.70)2.14 (1.15)3.132.093.151.76
Acetaldehyde (0.200)12.21 (6.70)18.62 (9.51)10.9516.6310.6016.402.13 (1.20)2.25 (1.60)2.122.211.621.55
Nonanal
(0.095)
24.15 (14.99)39.39 (31.93)20.3435.5120.2631.251.70 (1.67)1.43 (1.13)1.201.031.261.15
Acetone
(0.200)
93.54 (324.70)65.18 (87.10)39.4744.9442.7944.858.37 (4.07)8.12 (4.80)7.516.247.567.05
Others
Diethyl phthalate (0.095)0.60
(0.26)
0.60 (0.31)0.570.490.550.520.07 (0.02)0.07 (0.01)0.070.070.070.07
Methylene Chloride
(0.480)
0.60
(0.61)
2.64 (2.32)0.342.310.461.570.48 (0.28)0.68 (0.52)0.340.340.430.54
Cyclopentasiloxane (2.380)38.94 (66.93)17.01 (24.51)10.555.3713.157.331.80 (0.89)1.70 (0.15)1.681.681.731.70
Table 2. Facility-specific parameters, including air exchange rate (AER), CO2 levels, indoor temperature, and relative humidity.
CampaignECE# KidsAvg. Daytime
AER [h−1]
AER Range [h−1]Indoor CO2
[ppm]
Avg. Nighttime
AER [h−1]
T [°C]/RH [%]
Summer 2018KH292.21.3–4.5608–13660.8324.6/47.7
NS342.51.1–4.8473–17240.6327.0/42.6
MH307.42.8–11.8410–982N/A24.0/65.3
Winter 2019KH316.31.3–12.9435–1560N/A22.1/41.5
NS324.41.0–9.0480–17610.9323.8/48.2
MH294.32.0–6.9425–15990.6720.0/41.0
Summer 2019KH311.70.8–4.8470–29810.324.1/44.6
NS311.20.6–2.5593–3590N/A20.5/49.0
MH304.92.0–6.0426–13622.224.6/60.0
Table 3. The ratio between lifetime average daily dose (LADD) to No Significant Risk Level (NSRL) for cancer-causing chemicals. Ratio > 1 represents an inhaled dose above recommendation.
LADD 1
μg day−1 kg−1
Exposure Dose 2
μg day−1 kg−1
NSRL Child
μg day−1 kg−1
LADD/NSRLchild
Ratio
Acetaldehyde0.0201.370.430.05
Formaldehyde0.0292.050.190.15
Ethylbenzene0.0020.140.260.01
Naphthalene0.0020.04 30.030.02
Styrene0.0020.140.130.02
1 Based on an averaging time of 70 years. 2 Based on an averaging time of one year. 3 Measurements were mostly below MDL in all three facilities. The elevated dose is affected by 3-day event of elevated concentration in NS location.
Table 4. The ratio between the measured indoor mean values to Reference Exposure Level (REL) for non-cancerous acute (A), 8-h (8), and chronic (C) health effects.
REL (A)REL (8)REL (C)Measured Mean ValueRatio (A)Ratio (8)Ratio (C)
μg m−3μg m−3μg m−3μg m−3
Acetaldehyde470300140100.020.030.07
Formaldehyde5599150.271.671.67
Ethylbenzene 20001 <0.01
Naphthalene 90.3 0.03
Styrene21,000 9001<0.01 <0.01
Toluene50008304208.6<0.010.010.02
Xylene (m+p+o)22,000 7003<0.01 <0.01
Methylene-chloride14,000 4000.6<0.01 <0.01
Disclaimer/Publisher’s Note: The statements, opinions and data contained in all publications are solely those of the individual author(s) and contributor(s) and not of MDPI and/or the editor(s). MDPI and/or the editor(s) disclaim responsibility for any injury to people or property resulting from any ideas, methods, instructions or products referred to in the content.

