Review

Review of Subionospheric VLF/LF Radio Signals for the Study of Seismogenic Lower-Ionospheric Perturbations

by
Masashi Hayakawa
1,2,3
1
QuakeInsight Tokyo, UEC Alliance Center #501, 1-1-1 Kojima-Cho, Chofu 182-0026, Tokyo, Japan
2
Hayakawa Institute of Seismo Electromagnetics, Co., Ltd. (Hi-SEM), UEC Alliance Center #521, 1-1-1 Kojima-Cho, Chofu 182-0026, Tokyo, Japan
3
Advanced Wireless & Communications Research Center (AWCC), The University of Electro-Communications, 1-5-1 Chofugaoka, Chofu 182-8585, Tokyo, Japan
Atmosphere 2025, 16(11), 1312; https://doi.org/10.3390/atmos16111312 (registering DOI)
Submission received: 6 October 2025 / Revised: 12 November 2025 / Accepted: 14 November 2025 / Published: 20 November 2025

Abstract

It has recently been recognized that the ionosphere is highly sensitive to pre-seismic effects, and the detection of ionospheric perturbations associated with earthquakes (EQs) is one of the most promising candidates for short-term EQ prediction. In this review, we focus on a possible use of VLF/LF (very low frequency (3–30 kHz)/low frequency (30–300 kHz)) radio sounding of seismo-ionospheric perturbations to study seismogenic effects. Because an understanding of the early history in any area will provide a lot of crucial insights to the readers (especially to young scientists) working in the field of seismo-electromagnetics, we provide a brief history (mainly results reported by a Russian group of scientists) of the initial application of subionospheric VLF/LF propagation for the study of ionospheric perturbations associated with EQs, and then we present our first convincing evidence on the ionospheric perturbation for the disastrous Kobe EQ in 1995, with a new analysis method based on the shifts in terminator times in VLF/LF diurnal variations (minima in the diurnal variations in amplitude and phase). We then summarize our latest results on further evidence of seismo-ionospheric perturbations. Firstly, we present a few statistical studies on the correlation between VLF/LF propagation anomalies and EQs based on long-term data. Secondly, we showcase studies for a few large, recent EQs (including the 2011 Tohoku EQ). Building on those EQ precursor studies, we demonstrate scientific topics and the underlying physics that can be studied using VLF/LF data, highlighting recent achievements including the revolutionary perspective of lithosphere–atmosphere–ionosphere coupling (LAIC) (or how the ionosphere is perturbed due to the lithospheric pre-EQ activity), modulation in VLF/LF data by atmospheric gravity waves (AGWs), Doppler-shift observation, satellite observation of VLF/LF transmitter signals, etc., together with the recommendation of the application of new technologies such as artificial intelligence and critical analysis to VLF/LF analysis. Finally, we want to emphasize again the essential significance of the information on lower-ionospheric perturbations within LAIC studies.

1. Introduction to Seismo-Electromagnetics

There is a wide variety of natural disasters, including abnormal meteorological effects (such as extreme weather changes), earthquakes (EQs), volcanic eruptions, and others; in this review, we focus solely on EQs. The latest media news on massive EQs—such as the 2004 Indonesia Sumatra EQ, the 2008 Wenchuan EQ, the 2010 Haiti EQ, the 2011 Tohoku EQ, the 2024 Turkey EQs, and the 2024 Noto Peninsula EQ—has highlighted the significant magnitude of EQ hazards. To mitigate an EQ disaster, short-term EQ prediction is of primary importance in minimizing human and economic losses. Generally speaking, EQ prediction can be classified into three types, depending on the timescale with which we are concerned [1]. Due to the enormous advances in seismology, seismic geology, and geodesy, we notice significant achievements in (1) the long-term prediction (of the order of a few hundred years), and (2) the medium-term prediction (of the order of hundreds to a few years). However, despite the essential importance of (3) short-term EQ prediction (of the order of about one week), this has been far from realization. The situation for short-term EQ prediction appears to have drastically changed over the last three decades, particularly since the 1995 Kobe EQ. The conventional EQ predictions (1) and (2) have been based on the measurement of seismological crustal movement; however, this type of mechanical measurement has been deemed not particularly useful for short-term EQ prediction. Now, we have obtained a new wave of measurements through electromagnetic effects and have accumulated a substantial amount of evidence that electromagnetic phenomena occur over a wide frequency range prior to an EQ (e.g., [2,3,4,5,6,7,8,9,10]).
The electromagnetic short-term method for EQ prediction can principally be classified into two categories: the first is the detection of radio emissions from the EQ hypocenter (passive measurement), and the second is to detect indirect effects of EQs taking place in the atmosphere and ionosphere by means of the pre-existing radio transmitter signals (we call it “active measurement or radio sounding”) [9,10]. The first category has the longest history; however, it has been challenging for us to distinguish seismogenic natural radio emissions from other types of noise, such as lightning radiation and anthropogenic sources. Therefore, we have not made significant progress in reducing the natural radio noises. On the other hand, pre-existing transmitters (such as VLF/LF and VHF) have a novel advantage of identifying many seismogenic effects as propagation anomalies of transmitter signals for EQs over the propagation path from the transmitter to the receiver. As a result of research conducted over the last three decades, it has become a consensus that the ionosphere is unexpectedly extremely sensitive to the pre-seismic effect (e.g., [1,2,3,4,5,6,7,8]).
This review paper is organized as follows. Section 2 deals with early studies by Russian colleagues, and Section 3 deals with the Japanese contribution regarding the 1995 Kobe EQ. In these sections, we review the potential use of subionospheric VLF/LF propagation data for the early-stage studies of seismogenic lower-ionospheric perturbations. Section 4 deals with our Japanese VLF/LF network, initially established during the former NASDA (National Space Development Agency of Japan), followed by the introduction of other networks employed in different countries around the globe. In Section 5, we present both statistical and case studies to show the latest achievements and perspectives, and Section 6 deals with scientific aspects and underlying physics behind those seismogenic VLF/LF propagation anomalies, including the context of the lithosphere–atmosphere–ionosphere coupling (LAIC) process, and several other items, and we include new valuable directions for the future. Section 7 is the final conclusion.

2. Early Studies on VLF/LF Radio Sounding of Ionospheric Perturbations Associated with EQs

2.1. The Use of VLF/LF Subionospheric Propagation as a New Methodology

Several nations currently operate large VLF/LF transmitters, mainly for navigation and communication with military submarines. Efficient radiation of electromagnetic waves in this low-frequency range requires antennas with dimensions comparable to the wavelength of the transmitted signal. As a result, VLF/LF transmitting antennas are extremely large, often reaching several hundred meters in height (e.g., [11,12]).
Most of the energy radiated by these transmitters is confined between the ground and the lower ionosphere, forming the Earth–ionosphere waveguide. Subionospheric VLF/LF signals undergo reflection from the D/E region of the ionosphere—arguably the least explored layer of Earth’s atmosphere. Situated at altitudes of about 70–90 km, this region is inaccessible to both balloons and satellites, making direct in situ measurements exceedingly rare; consequently, VLF/LF subionospheric radio signals remain the only practical means of probing this part of the ionosphere [13].
Any disturbance in the plasma of the ionospheric D/E region can significantly alter the propagation characteristics of VLF/LF waves. Such variations manifest as observable changes in the amplitude and phase of the transmitted signals. They may arise from a variety of perturbation sources: (1) solar flares, (2) geomagnetic storms and related particle precipitation, including Trimpi effects, (3) direct lightning effects such as lightning-induced particle precipitation (e.g., [13,14,15]), and (4) typhoons. Beyond these solar–terrestrial influences, another fascinating possibility is the impact of EQs (or seismic activity) on the lower ionosphere, commonly referred to as seismo-Trimpi effects [1,2,3,4,5,6,7,8].

2.2. Brief History of VLF/LF Probing of Seismo-Ionospheric Perturbations

Russian researchers have played a pioneering role in exploring the fascinating connections between seismic activity and changes in the ionosphere [16]. Their groundbreaking work has illuminated essential aspects of several significant EQs, sparking great interest within the scientific community. One standout study by Gufeld et al. [17] focused on the phase information of VLF signals from Reunion, especially in relation to the powerful EQ that struck the Caucasus on 30 December 1983, measuring an impressive magnitude of 7.2. The research team thoroughly analyzed variations in signals from Omega transmitters in Reunion and Liberia, comparing them with reception points in Moscow and Omsk. Remarkably, they discovered anomalies in VLF signals during the nighttime just two days and one day leading up to the EQ, particularly along the path closest to the epicenter. This phase information is especially valuable as it offers clearer insights than amplitude data, revealing significant changes in the ionosphere’s reflection height.
In a further exploration [18,19], researchers documented notable VLF propagation anomalies during the Spitak EQ in Armenia on 7 December 1988, which also had a significant magnitude of 7.1. This investigation highlighted clear disturbances in subionospheric VLF signals linked to the EQ event. The team concentrated on two crucial paths—Liberia–Omsk and Reunion–Leningrad. Despite the epicenter being about 500–600 km from these paths, it fell within the first Fresnel zone for both. They detected phase anomalies approximately a week before the EQ, which intensified in the days leading up to the event, indicating a decline in nighttime reflection height. Intriguingly, after analyzing the data with a standard 2σ (σ: standard deviation) criterion, they found no unusual activity beyond the threshold post-EQ, underscoring the potential significance of these indicators prior to seismic events.

3. VLF Propagation Anomaly for the 1995 Kobe EQ

3.1. Terminator Time Method for the Study of Seismo-Ionospheric Perturbations

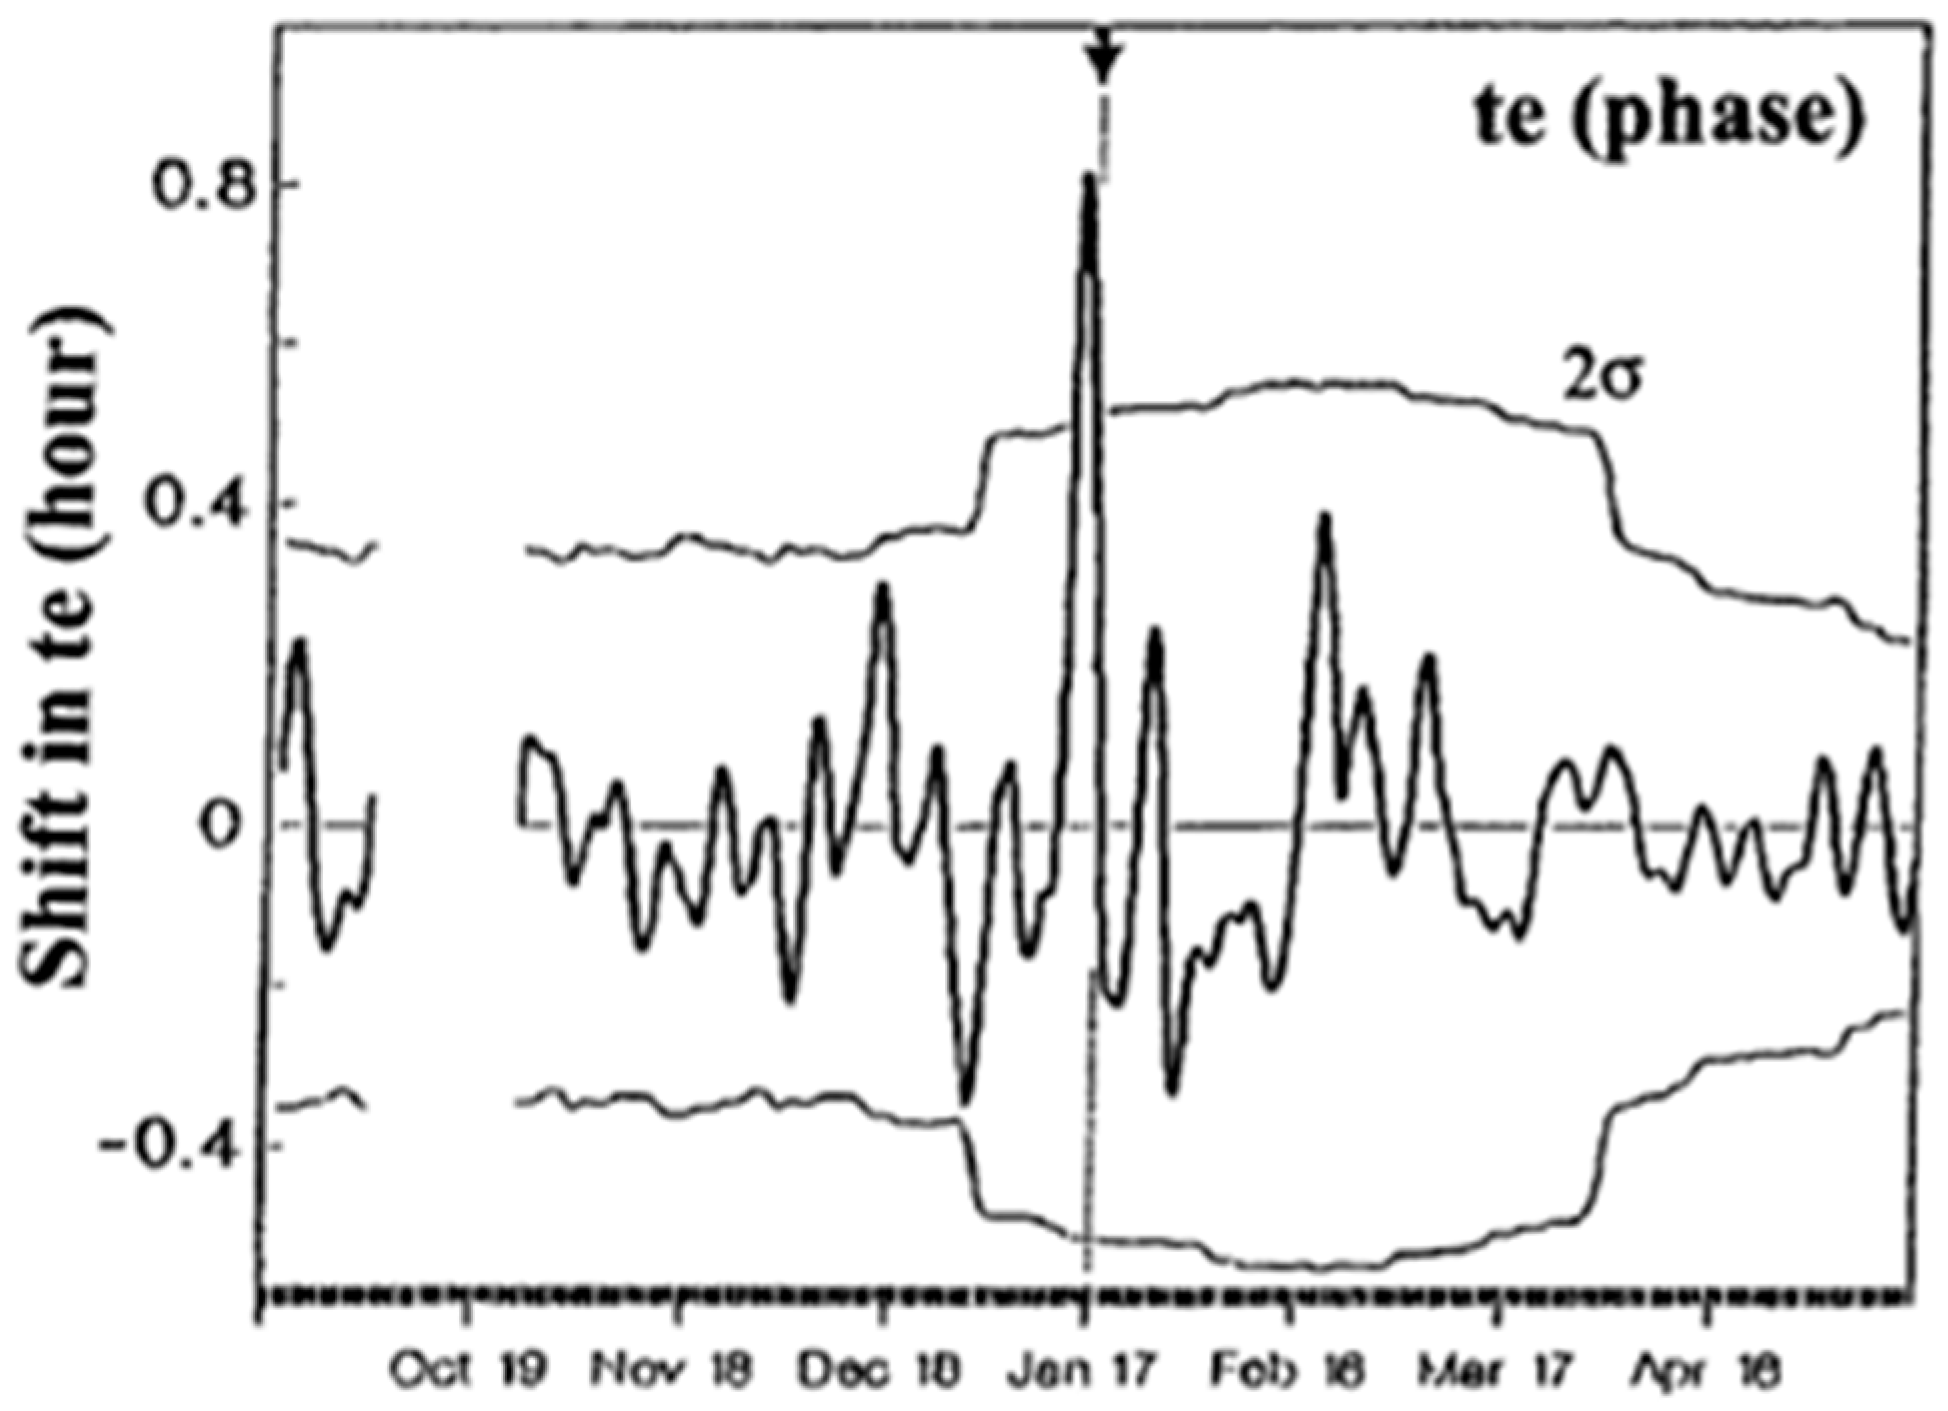
The most convincing result on seismo-ionospheric perturbations using VLF sounding was obtained by Hayakawa et al. (1996) [20] for the famous Kobe earthquake on 17 January 1995 (with a magnitude of 7.3 and a depth of 20 km). Some important peculiarities in their paper are summarized as follows: (1) The propagation distance (from Tsushima VLF Omega (geographic coordinates: 34.37° N, 129.27° E) to Inubo Observatory (35.42° N, 140.52° E) in Chiba Prefecture) is a relatively short path at VLF (~1000 km), as shown in Figure 1a, as compared with the long-propagation paths (5000~9000 km) used in Russian papers [16,17,18,19]. (2) They found that the fluctuation method, as used before, was not as effective for this short-propagation path, so they developed another method of analysis; that is, they paid attention to the times of terminator (morning and evening) (that is, minima in amplitude and phase during the sunrise and sunset times), and they found significant shifts in the terminator times before the EQ, as shown in Figure 1b. The terminator time is defined as the time when the diurnal phase (or amplitude) variation exhibits a minimum around sunrise and sunset (which we call morning (tm) and evening (te) terminator times). Figure 1b shows a surprising result: a significant change in terminator times before the EQ. A black dot indicates the point at the minimum around sunrise, and the time is called tm, while the time with a white dot is called te. The vertical lines indicate tm and te under normal (unperturbed) conditions, so that the hatched area means the deviation or shift in the terminator time from the corresponding unperturbed situation. Hence, it is clear that tm shifts to early hours and te to later hours; in other words, a longer daytime as felt by the VLF waves. This effect is also confirmed by analysis over a much longer period of data collection (±4 months, totaling eight months), displayed in Figure 2. The full line indicates the terminator time (te, phase) on each day, averaged over ±1 day (a 3-day running average). The estimation of the mean value and standard deviation (σ) is based on averaging over a ±1.5-month period around a particular day. This figure shows the deviation in te from the mean (0), and the ±2σ lines are also drawn. This figure indicates that the only significant peak is seen just before the EQ. Also, after studying the correlation of this anomalous propagation with other possibly solar–terrestrial- and meteorological-related phenomena (magnetic activity, solar activity, rainfall, etc.), we have not found any recognizable correlation with any of those phenomena; therefore, we conclude that this propagation anomaly is highly likely to be associated with the EQ. We have also found a similar tendency for tm (i.e., lead time).
A later extensive study by Molchanov and Hayakawa (1998) [21] was based on the more abundant events over 13 years (11 events with magnitude greater than 6.0 and within the first Fresnel zone) for the same propagation path from the VLF Omega, Tsushima to Inubo in Chiba Prefecture, and they came to the following conclusions:
(1)
As for shallow (depth smaller than 30 km) EQs, four EQs from five exhibited the same terminator time anomaly as the Kobe EQ (as in Figure 1b) (with the same 2σ criterion).
(2)
When the depth of the EQs was in a medium range of 30–100 km, there were two events observed—one event exhibited the same terminator time anomaly, while another indicated a different type of anomaly.
(3)
Deep (depth larger than 100 km) EQs (four events) did not show any anomalies. Two of them had an extremely large magnitude (greater than 7.0) but had no propagation anomaly.
This summary might indicate a relatively high probability of the propagation anomaly (with the use of terminator time anomaly) of the order of 70~80% for larger (magnitude greater than 6.0) EQs located relatively close to the great-circle path (e.g., first Fresnel zone).
Another significant finding was that when propagation anomalies (ionospheric perturbations) existed, harmonic analysis of terminator times showed increased modulation at periods of 5 days and 9–11 days—typical of planetary wave oscillations. This suggests that atmospheric oscillations at these timescales could be vital in LAIC. Figure 3 illustrates a case of heightened long-period oscillations before the Kobe EQ, where the EQ date (marked by an upward arrow) aligns with a strong ~11-day wavelet and a weaker 5-day wavelet. To interpret this modulation, atmospheric gravity waves (AGWs) were proposed as the carriers due to their strong upward propagation in the LAIC mechanism, with planetary waves acting as the modulating signal. Spectral analysis of amplitude and phase fluctuations further identified increased power within the AGW frequency range (10 min to 2 h), likely linked to seismic activity [22]. These findings establish a fundamental basis for studying LAIC, which will be examined in more detail in Section 6.

3.2. The Shift in Terminator Time for the Study of Ionospheric Changes Associated with EQs

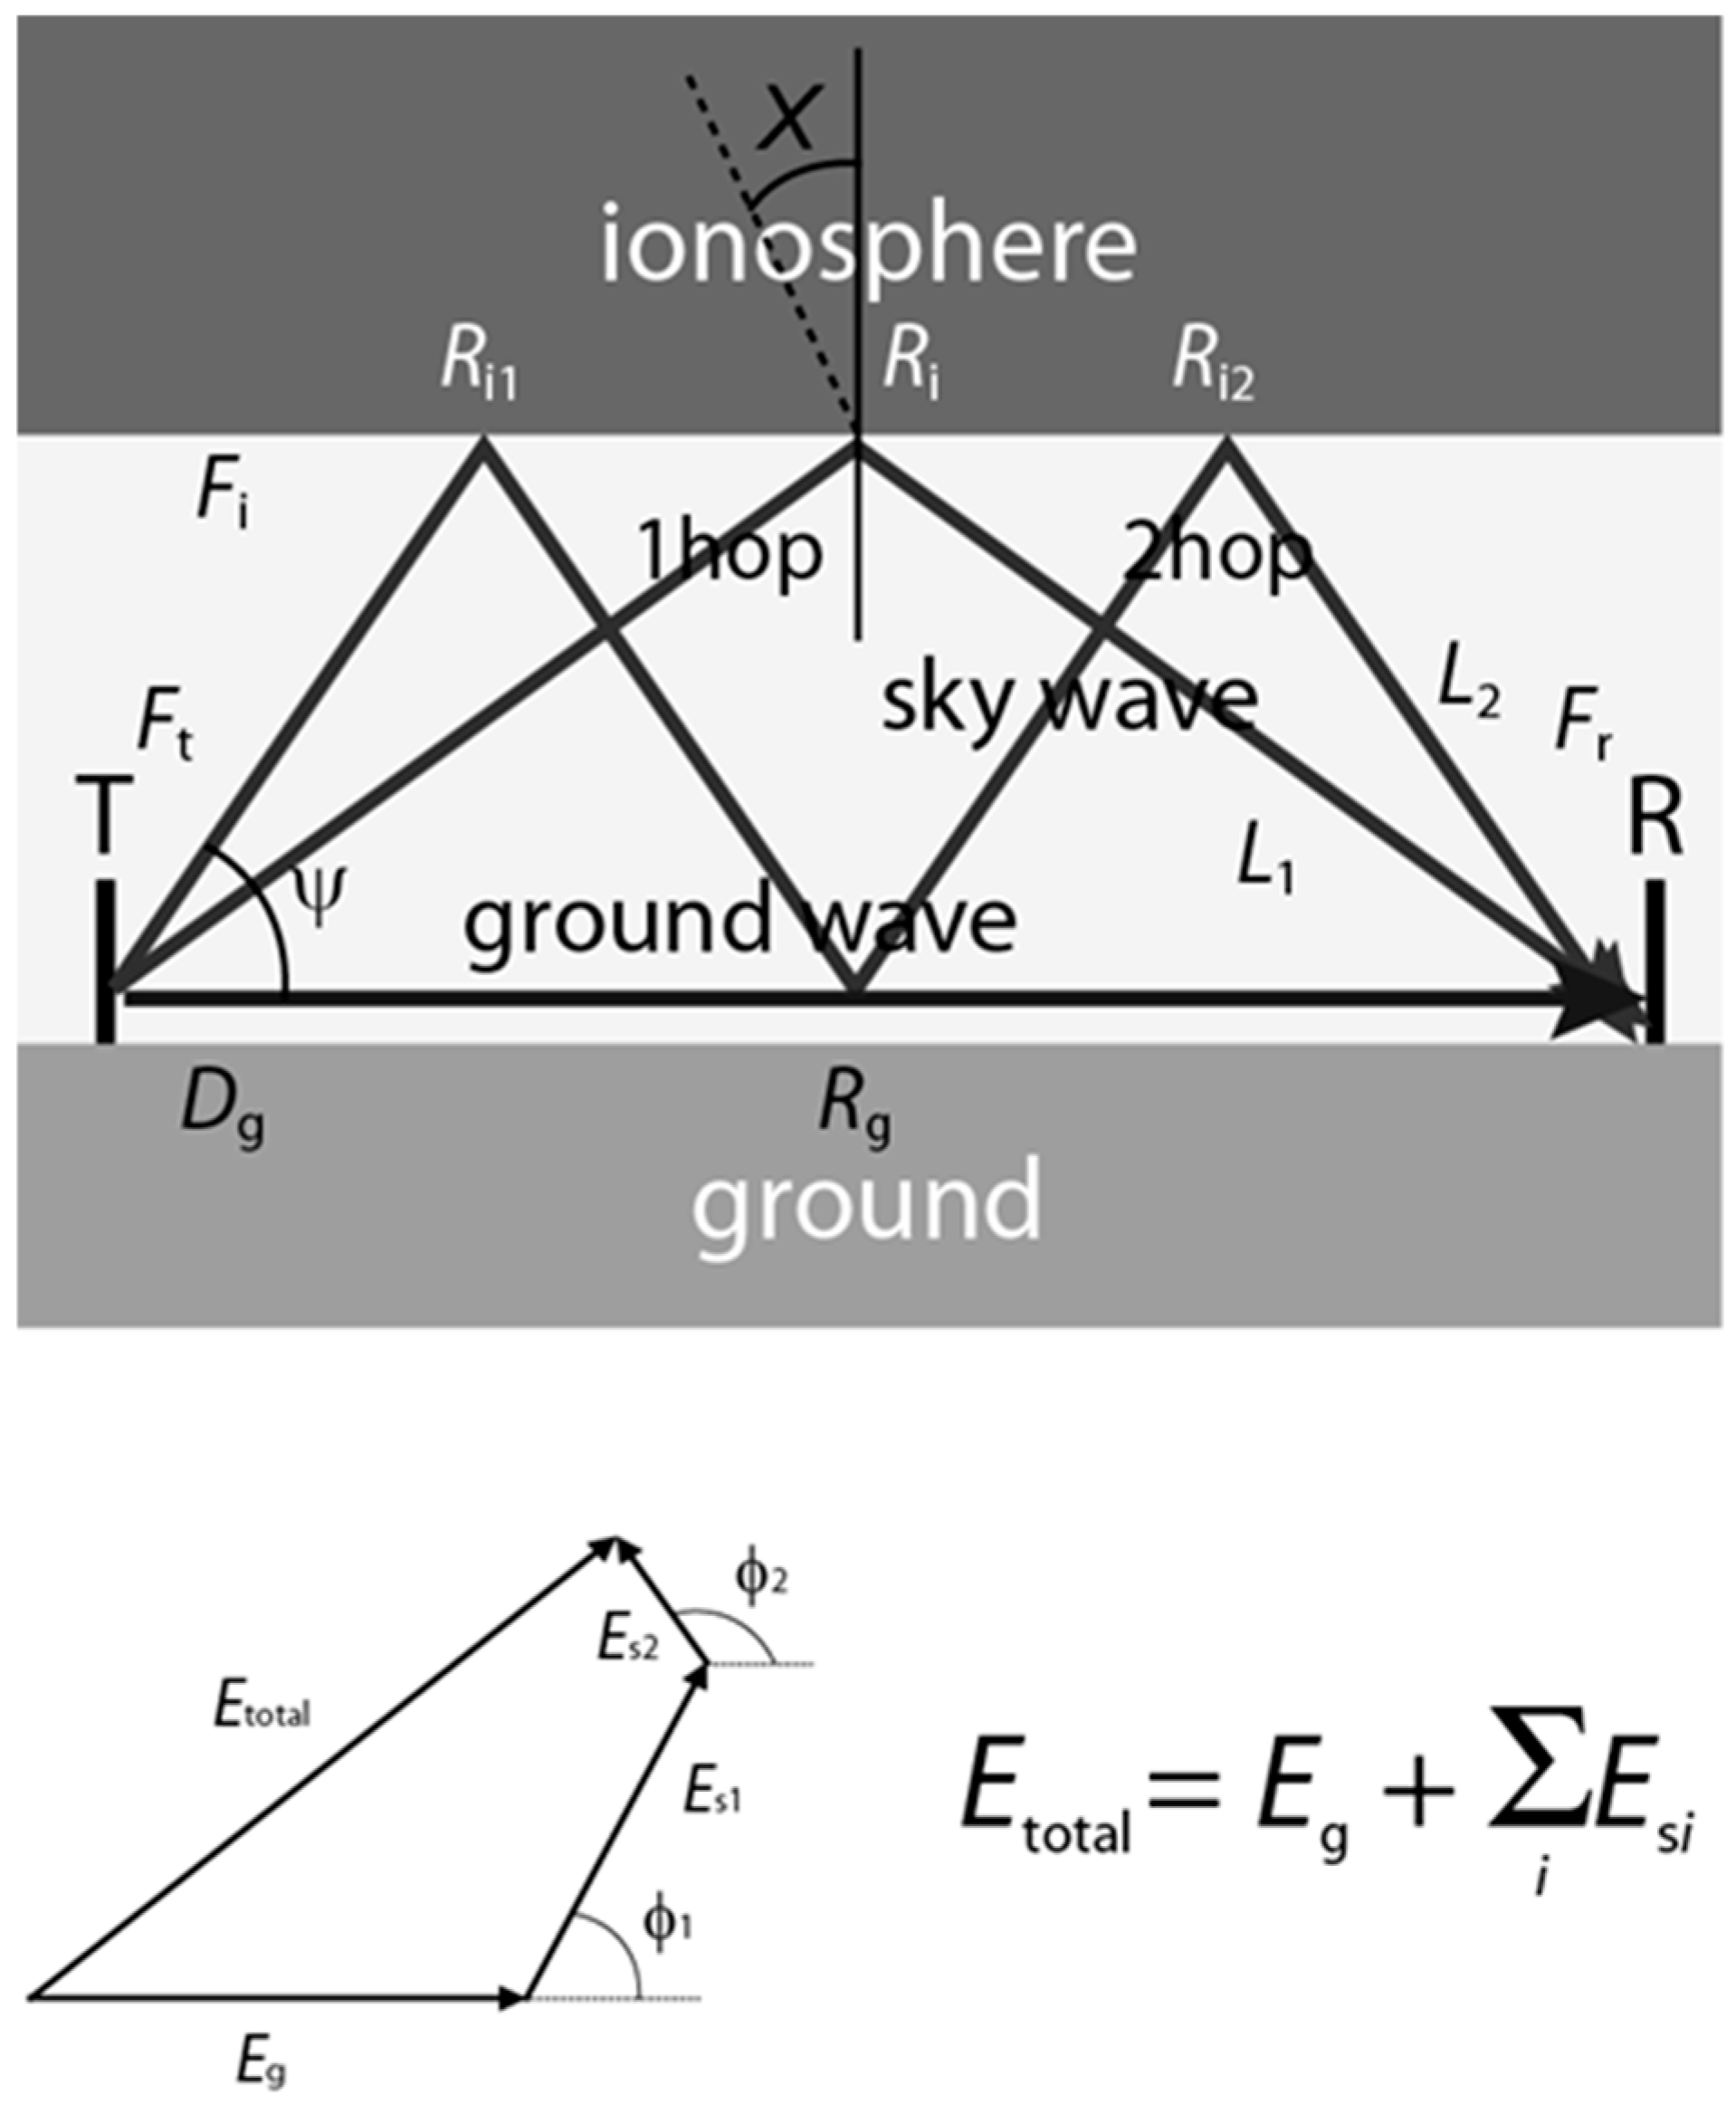
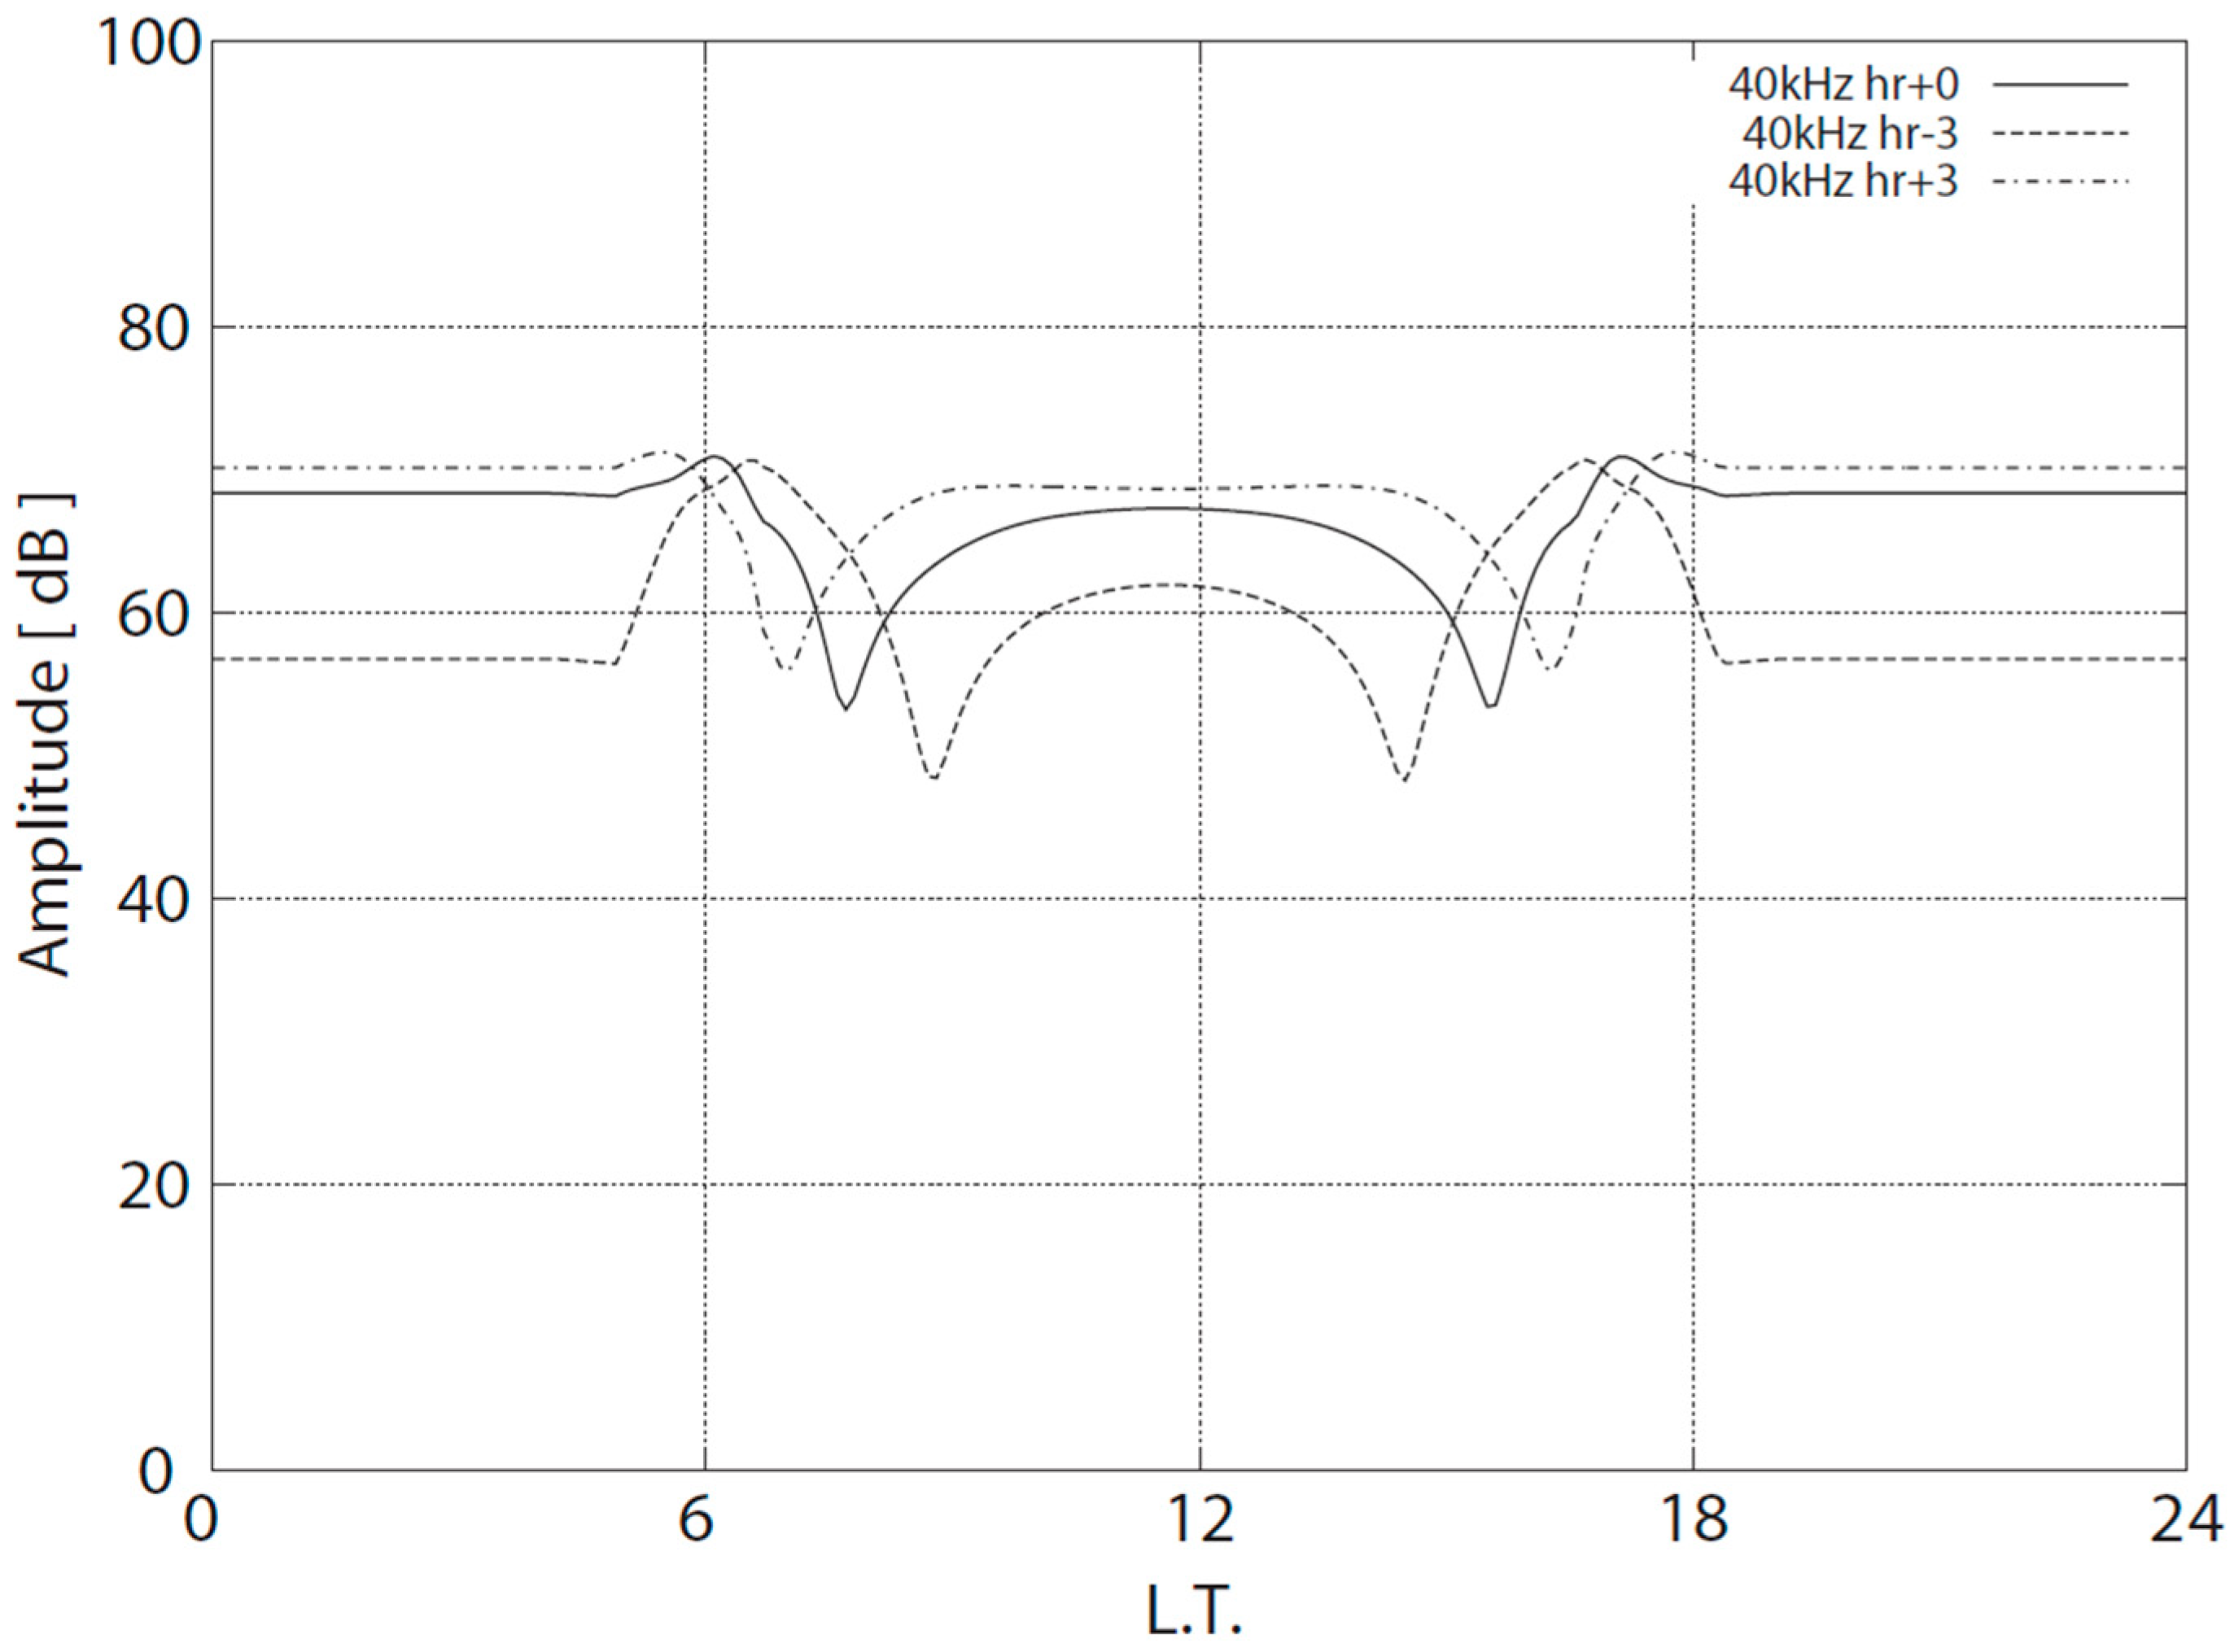
Hayakawa et al. (1996) [20] and Molchanov et al. (1998) [21] suggested explaining the seismogenic change in the lower ionosphere using the full-wave theory of subionospheric VLF propagation over a short distance (~1000 km), where several modes of propagation exist (i.e., the terminator time results from wave interference among those modes, which will be described later in more detail). Based on the comparison of theoretical estimations with experimental data, we conclude that the lower ionosphere might have been lowered by a few kilometers. Here, we present a comprehensive concept regarding the importance of terminator time shifts in the diurnal variation in subionospheric VLF/LF signals and their use in inferring lower-ionospheric changes associated with EQs. Unlike the previously mentioned studies based on full-wave computations [20], we utilize the wave-hop method (ray theory). Figure 4 illustrates the VLF/LF propagation scheme for relatively short distances (less than 2000 km). The VLF/LF signal received at a receiver (R) consists of (1) ground wave and (2) sky waves. Sky waves refer to any hop signals reflecting from the ionosphere, such as 1-hop sky waves reflected once, or 2-hop waves reflected twice. The details of these computations were published by Yoshida et al. (2008) [23]. The total field received is shown in the phasor diagram at the bottom of Figure 4, where the phase difference in the 1-hop wave relative to the ground wave (i.e., as shown in the figure) plays a crucial role in the diurnal VLF/LF variation. Figure 5 provides an example of the computations at a frequency of 40 kHz (corresponding to the Japanese standard wave (JJY) in Fukushima Prefecture). The x-axis indicates time in local time (L.T.). The top panel displays the diurnal variation in the reflection height of the ionosphere, which lowers during the day due to solar radiation and ionization in the D region. The distance between the transmitter and receiver at Kochi is 787 km (details of our Japanese VLF/LF network will be described later). The bottom panel shows only the amplitudes of the ground and sky waves (using only the dominant 1-hop wave), revealing that both waves have nearly similar intensities. However, examining the middle panel in Figure 5—which plots the phase difference in the 1-hop wave relative to the ground wave against L.T.—indicates that there are two local times when the phase difference is approximately 180°. This suggests that the sky and ground waves interfere destructively, which explains the occurrence of terminator times (tm and te) in the amplitude of the diurnal VLF/LF propagation. Essentially, the difference in path lengths between the ground and sky waves plays a vital role in forming the VLF/LF terminator times.
This terminator-time method is becoming one of the most promising VLF/LF analysis methods. It has been applied to different EQ events such as the 2015 Gorkha Nepal EQ [24,25], the 11 March 2011 Tohoku EQ, and the same 2015 Nepal EQs [26,27], the 2020 Croatian EQs [28], etc. In [26,27], they have considered two opposite situations, in which one of the EQ epicenters was located near the VLF transmitter, and another was located near the receiver.
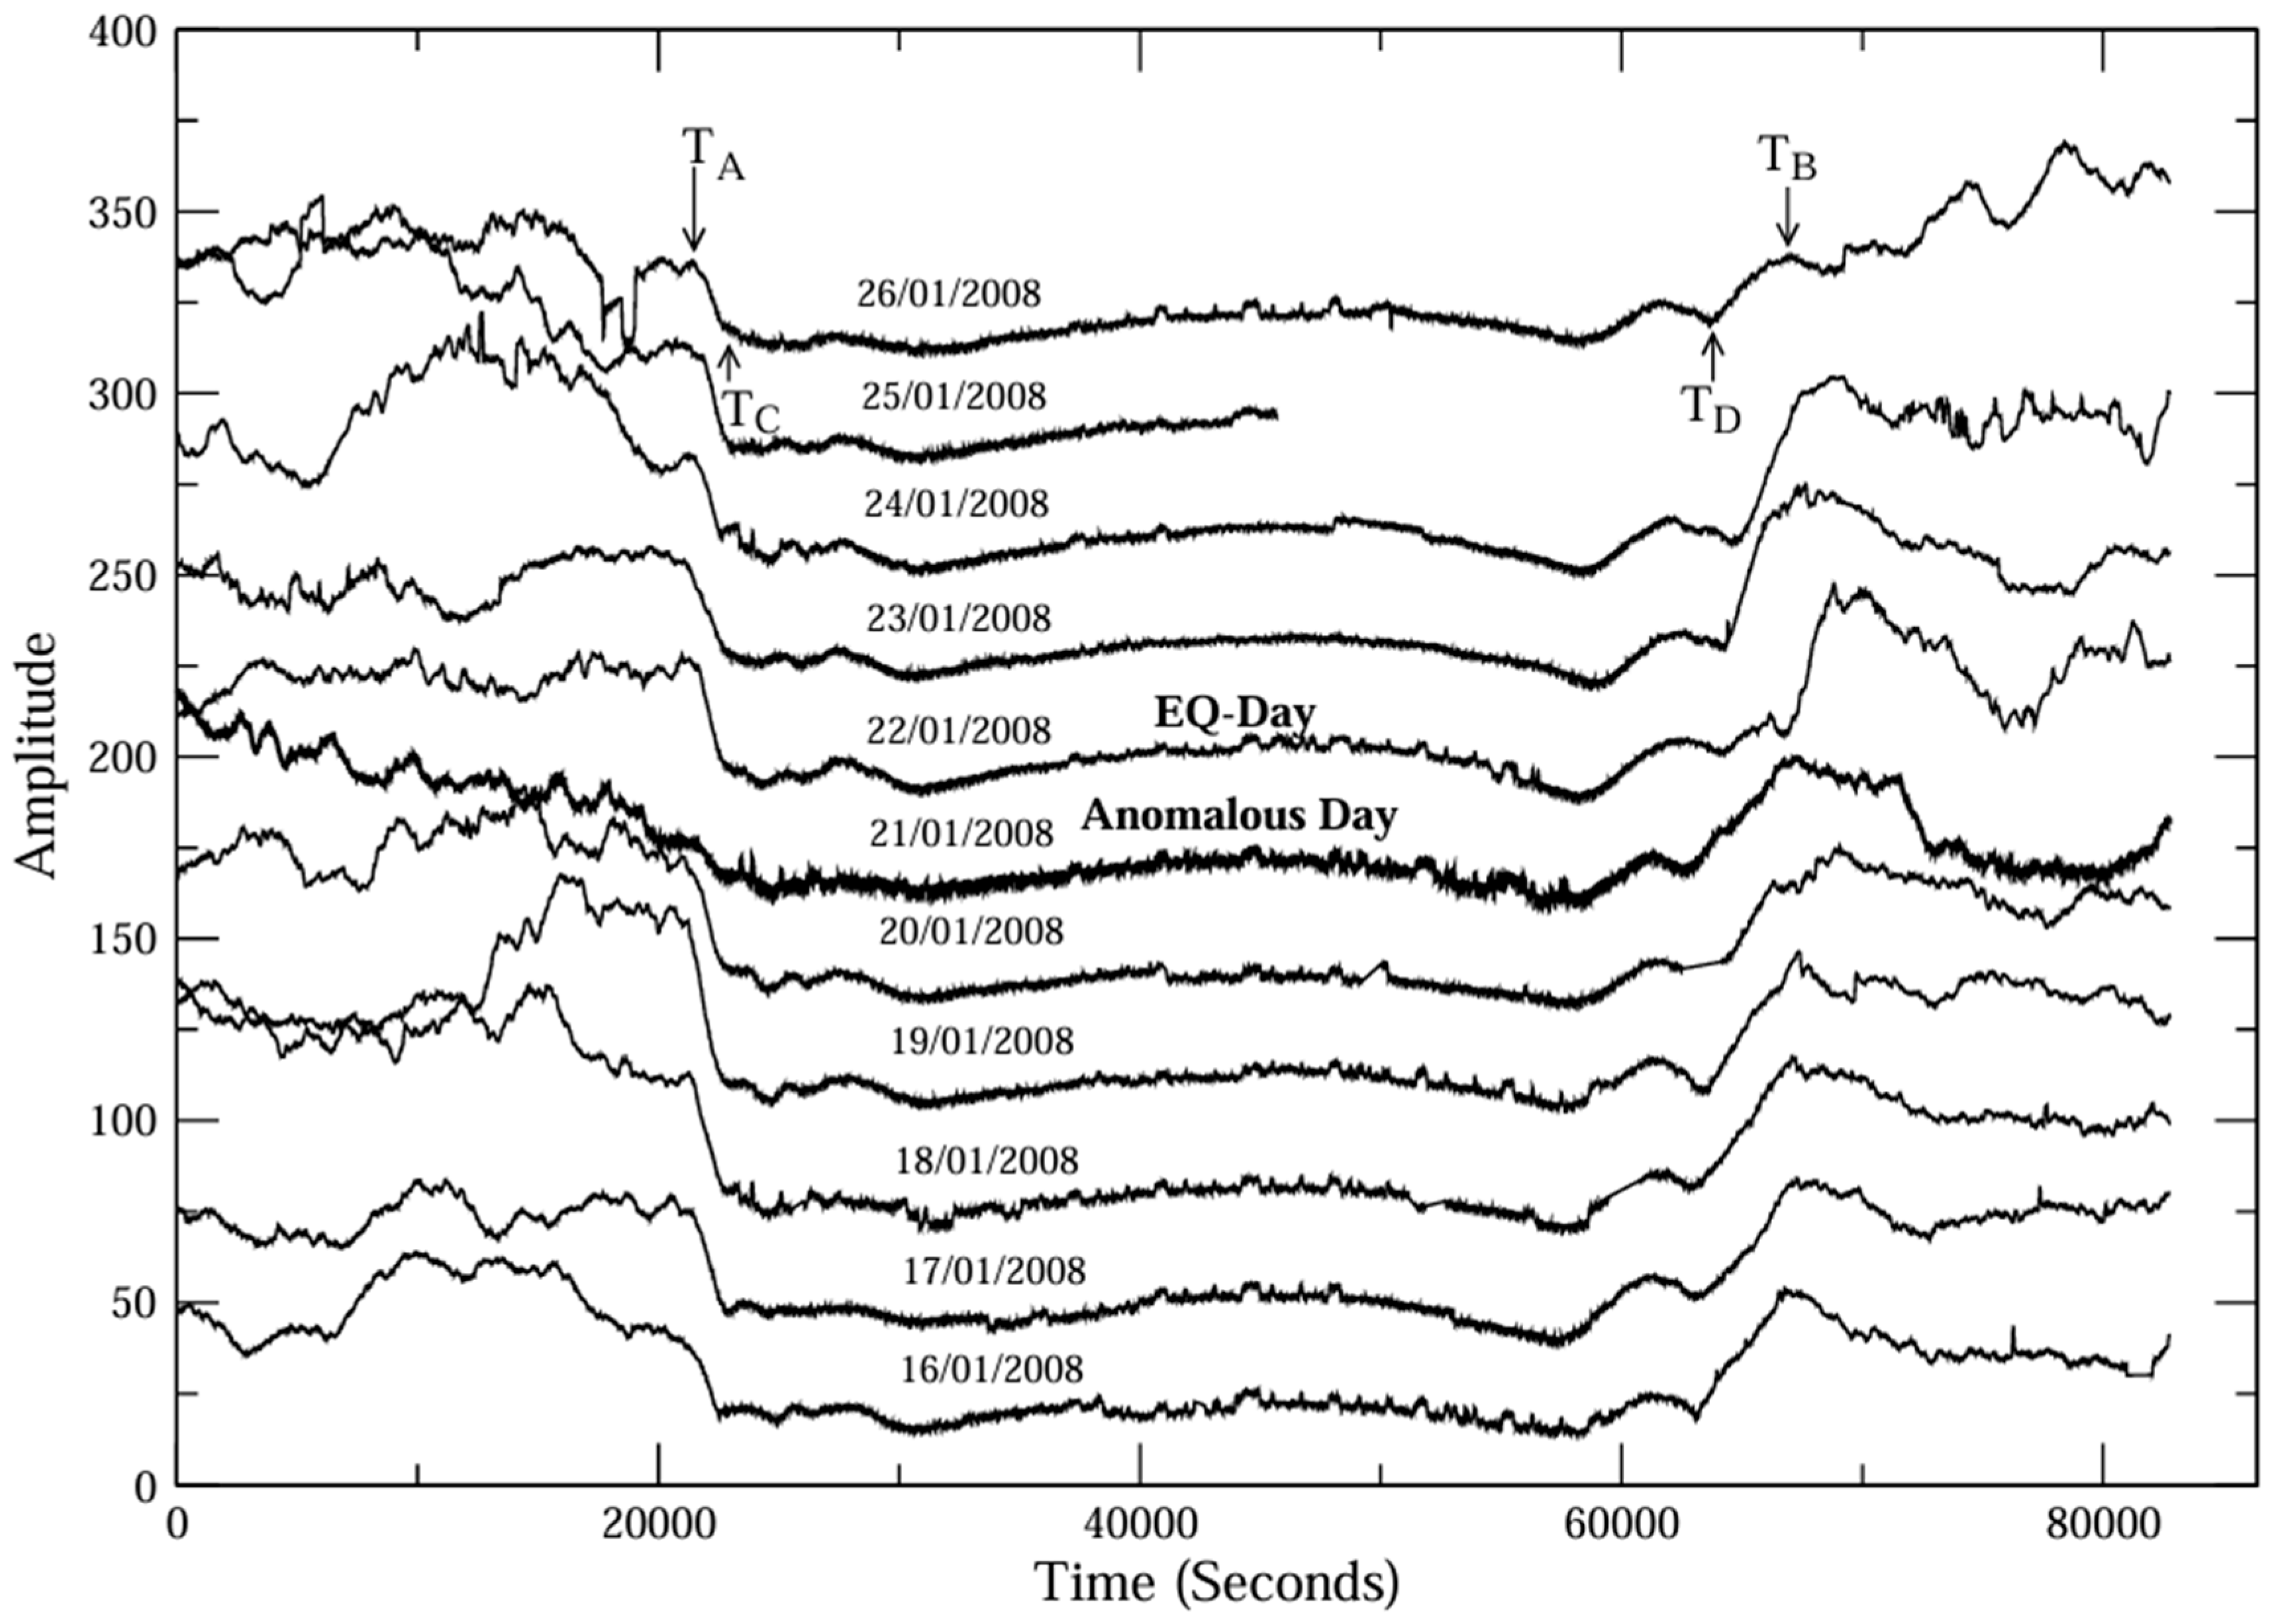
Later, Indian colleagues [29,30] developed another measure called D-layer preparation time (DLPT) and disappearance time (DLDT) as alternatives to the conventional terminator time. These are defined as the time to lower the D-layer boundary in the early morning and the time taken to raise it again in the evening. To illustrate DLPT and DLDT, Figure 6 shows a plot of the signal amplitudes (shifted by 30 dB vertically for better viewing) over eleven consecutive days. Looking at the top of the figure, we see that DLPT = TC − TA and DLDT = TB − TD, where TA, TC, TD, and TB are marked in the top panel. The transmitter is the Indian Navy station, VTX (18.2 kHz), and the receiver is in Kolkata, India. During this period, Figure 7 captures an EQ with a magnitude of 6.0 on 22 January 2008. An anomalous day, 21 January, is also notable, where the signal near sunrise differs markedly—the usual sharp drop associated with sunrise is replaced by a flatter variation. Statistical analyses have been conducted on all EQs with magnitudes greater than 5.0. Figure 8 presents the statistical plot of DLPT (filled circles) and DLDT (filled squares) for 14 such EQs, averaged over approximately 15 days around each event. The figure indicates that the mean values peak two days before the EQ for DLPT and one day prior for DLDT. Error bars represent the standard deviation for each day. These findings are consistent with earlier statistical studies based on simple terminator times, as in [20], suggesting that DLPT and DLDT can be effectively utilized in examining seismogenic ionospheric perturbations.
These new parameters of DLPT and DLDT have been utilized by other Indian colleagues in their recent investigations of space weather, such as the effects of geomagnetic storms or meteorological phenomena like typhoons or cyclones (e.g., [31]).

4. Japanese VLF/LF Network During the Former NASDA’s EQ Remote-Sensing Frontier Project

4.1. NASDA’s EQ Remote-Sensing Frontier Project

In response to the above-mentioned pioneering results, especially the one regarding the Kobe EQ, the Japanese government initiated the integrated EQ Frontier Project. The former NASDA (National Space Development Agency of Japan, now JAXA, Japan Aerospace Exploration Agency) carried out the so-called “EQ Remote-Sensing Frontier Project” (of which the author was the principal investigator) between 1997 and 2001—a five-year project [32]. As the name indicates, the main focus of the former NASDA was remote sensing of various regions, including the lithosphere, atmosphere, and upper atmosphere (ionosphere). As summarized in our previous papers (e.g., [32]), from the outset of the Frontier Project, we aimed to significantly expand our research scope, not only into the lithosphere but also into the search for seismic effects occurring in the atmosphere and ionosphere. When we began the project, our knowledge of these regions was limited, aside from the lithosphere. The discovery of seismo-ionospheric perturbations associated with the Kobe EQ, as discussed earlier, was an enormous surprise even to us—it demonstrated that the ionosphere is remarkably sensitive to pre-seismic activity. An earlier notable finding was the detection of ULF (ultra-low-frequency) lithospheric electromagnetic emissions linked to different EQs, including the 1988 Spitak [33] and 1989 Loma Prieta EQs [34,35]. Additionally, we proposed a novel analysis method called the polarization method (which uses the ratio of vertical-to-horizontal magnetic field components) during the 1993 Guam EQ, allowing us to distinguish seismogenic ULF emissions from other space waves like geomagnetic pulsations [36]. Detailed investigations into seismogenic ULF emissions up to 2011 can be found in [37], with a comprehensive recent review provided in Hayakawa et al. (2019) [38].
In addition to the effects observed in the lithosphere, we aimed to identify possible seismogenic effects in the atmosphere and ionosphere. A surface temperature anomaly related to EQs, potentially linked to radon exhalation and charged aerosols, has been identified as a signature of the lowest atmosphere or Earth’s surface, detected through thermal satellite images [39,40,41,42] during our NASDA Frontier Project. Inspired by Tronin et al. (2002) [42], we recognize that numerous subsequent studies have published satellite-based observations of these thermal anomalies, as well as SLHF (surface latent heat flux), OLR (outgoing longwave radiation), and others [43,44,45,46,47,48,49,50,51,52,53,54,55,56,57,58,59]. Additionally, recent ground-based meteorological data have confirmed surface meteorological anomalies associated with the 1995 Kobe EQ [60,61].
The atmospheric perturbation is also detected through over-the-horizon VHF transmitter signals, which are similar to active experiments like VLF/LF subionospheric signals [62,63]. The proposed mechanism behind these atmospheric disturbances is based on geochemical effects occurring before an EQ, as suggested by [64]. Additionally, Ouzounov et al. (2024) [65] recently examined the sudden modulation of UHF wireless signals as a potential EQ precursor. The conditions of the upper atmosphere or stratosphere can be studied by analyzing AGW anomalies using European weather data [66,67].
The ionosphere, whether the upper F layer or the lower D/E layer, has been confirmed to be sensitive to pre-seismic effects, with further details to be provided later. Data on the upper ionosphere (mainly the F region) were gathered through ground-based ionosondes, GPS (global positioning satellite) TEC (total electron content) measurements (Liu et al. [68,69]), and in situ satellite density measurements in [70], all indicating a possible link between density perturbations and EQs. Subsequently, a satellite observation was proposed by Dr. M. Parrot—namely, the DEMETER satellite—as a significant milestone in seismo-electromagnetic research; it operated from 2004 to 2010 [71], yielding numerous valuable scientific results, e.g., [72]. The subsequent Chinese satellite, CSES, launched in 2018, has also produced many publications using its various payloads, with a comprehensive recent summary available (e.g., [73]).
The above findings led us to consider that the entire Earth system—lithosphere, atmosphere, and ionosphere—is strongly interconnected, which introduces the revolutionary perspective of LAIC [74,75], and is now actively utilized in our society.

4.2. Japanese Subionospheric VLF/LF Network

In the former NASDA Frontier Project, we focused intensely on observing subionospheric VLF/LF propagation to predict EQs in the short term. Figure 8 illustrates the Japanese VLF/LF network built during this project [32,76]. It shows only a few observation stations in Japan: Moshiri (Hokkaido) (MSR), Chofu (Tokyo) (CHF), Tateyama (Chiba) (TYM), Kasugai (Nagoya) (KSG), and Kochi (KCH); however, additional stations were later added. Currently, each station monitors multiple transmitter signals simultaneously, unlike our earlier VLF systems. The monitored transmitters include (1) JJY (40 kHz, Fukushima), (2) JJI (22.2 kHz, Ebino, Kyushu), (3) NWC (19.8 kHz, Australia), (4) NPM (21.4 kHz, Hawaii), and (5) NLK (24.8 kHz, America). By integrating data from various stations and transmitters received at each site, we can identify ionospheric disturbances. Additionally, our VLF/LF system, called Japal, is designed to detect very slow, subtle changes in amplitude and phase in collaboration with the late Prof. R.L. Dowden, differing from conventional space Trimpi observations [14,15]. The magnitude of phase and amplitude variations considered as EQ precursors is significantly larger than typical space Trimpis, making them detectable if present by our system [77].
This VLF network was maintained just after my retirement from the university (2009), and afterwards Prof. Y. Hobara of The University of Electro-Communications established a new VLF network consisting of about 10 stations, which is still working now. Also, Hi-SEM established another VLF/LF network of observations at about 10 stations within Japan, aimed at EQ prediction practice, but for a limited period of 5 years from 2015 to the end of 2019.

4.3. Other VLF/LF Networks

(a)
Asia–Pacific network
Similar VLF/LF networks have been deployed in different countries around the world. One of our VLF/LF receivers is now operational at Petropavlovsk–Kamchatka in Russia (as shown in Figure 8 with the notation of KCK), with encouraging results [78], forming a global Asia–Pacific VLF/LF network, as depicted in Figure 8.
(b)
European INFREP network
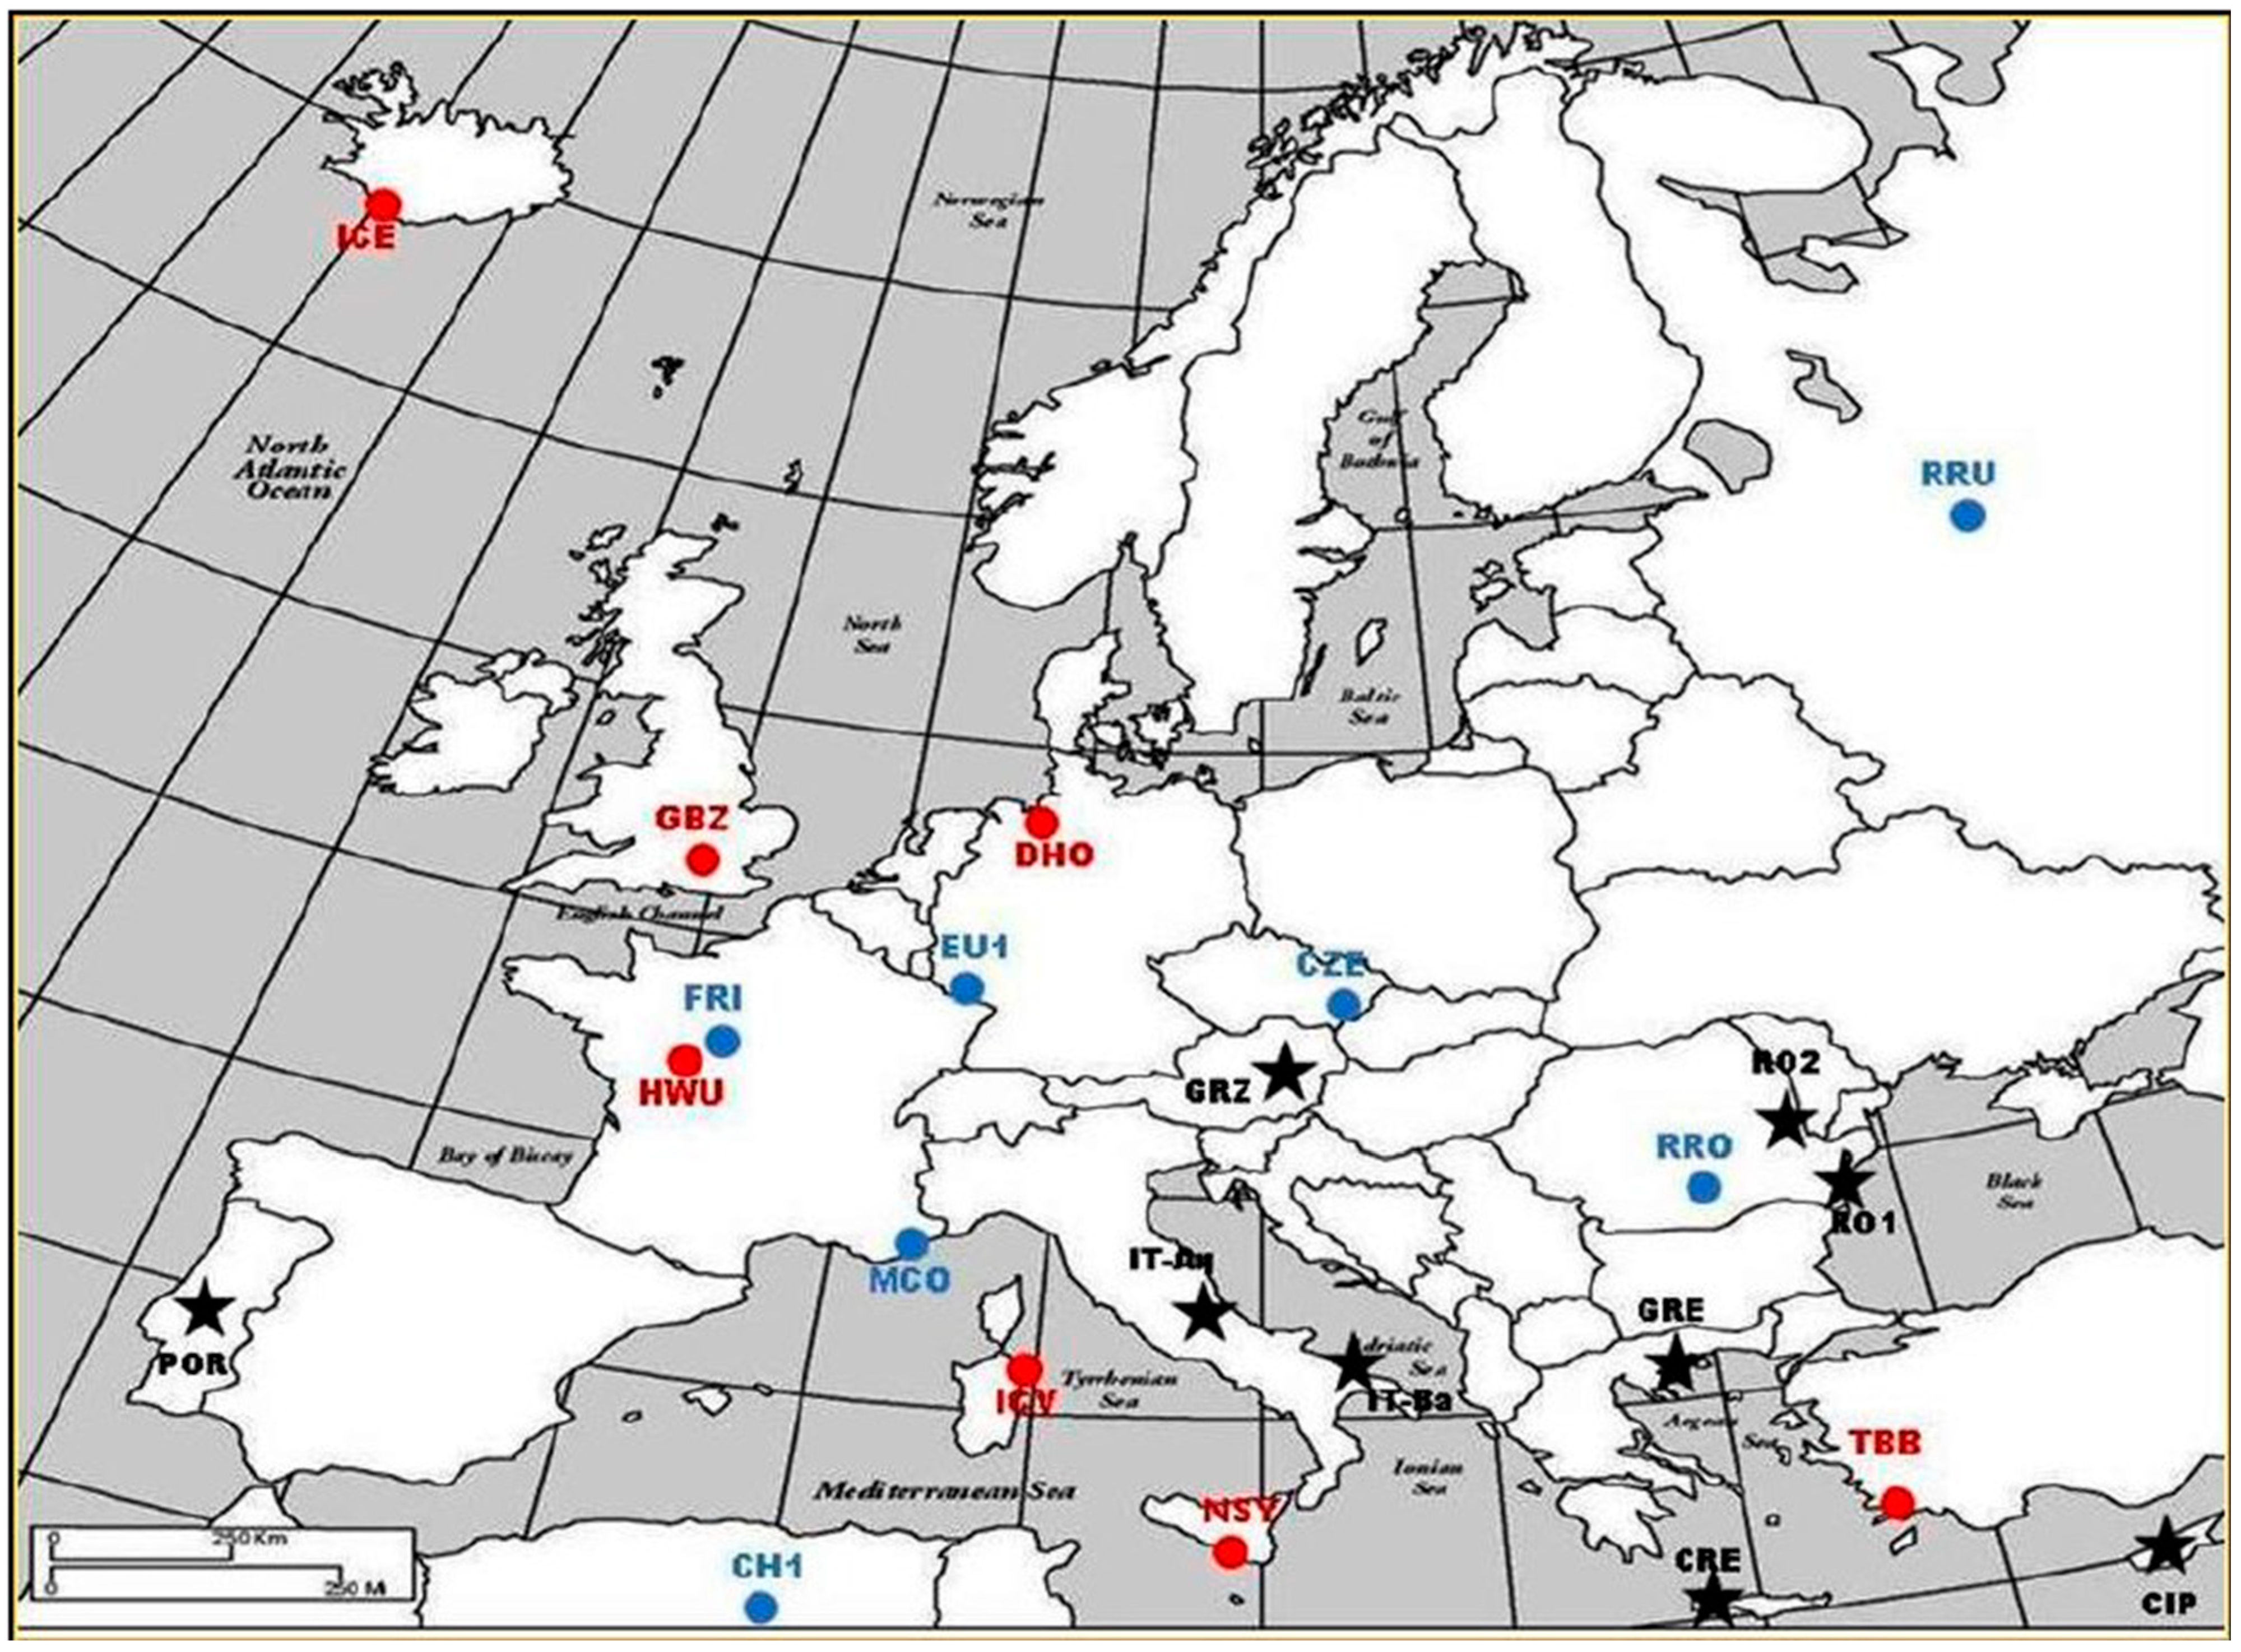
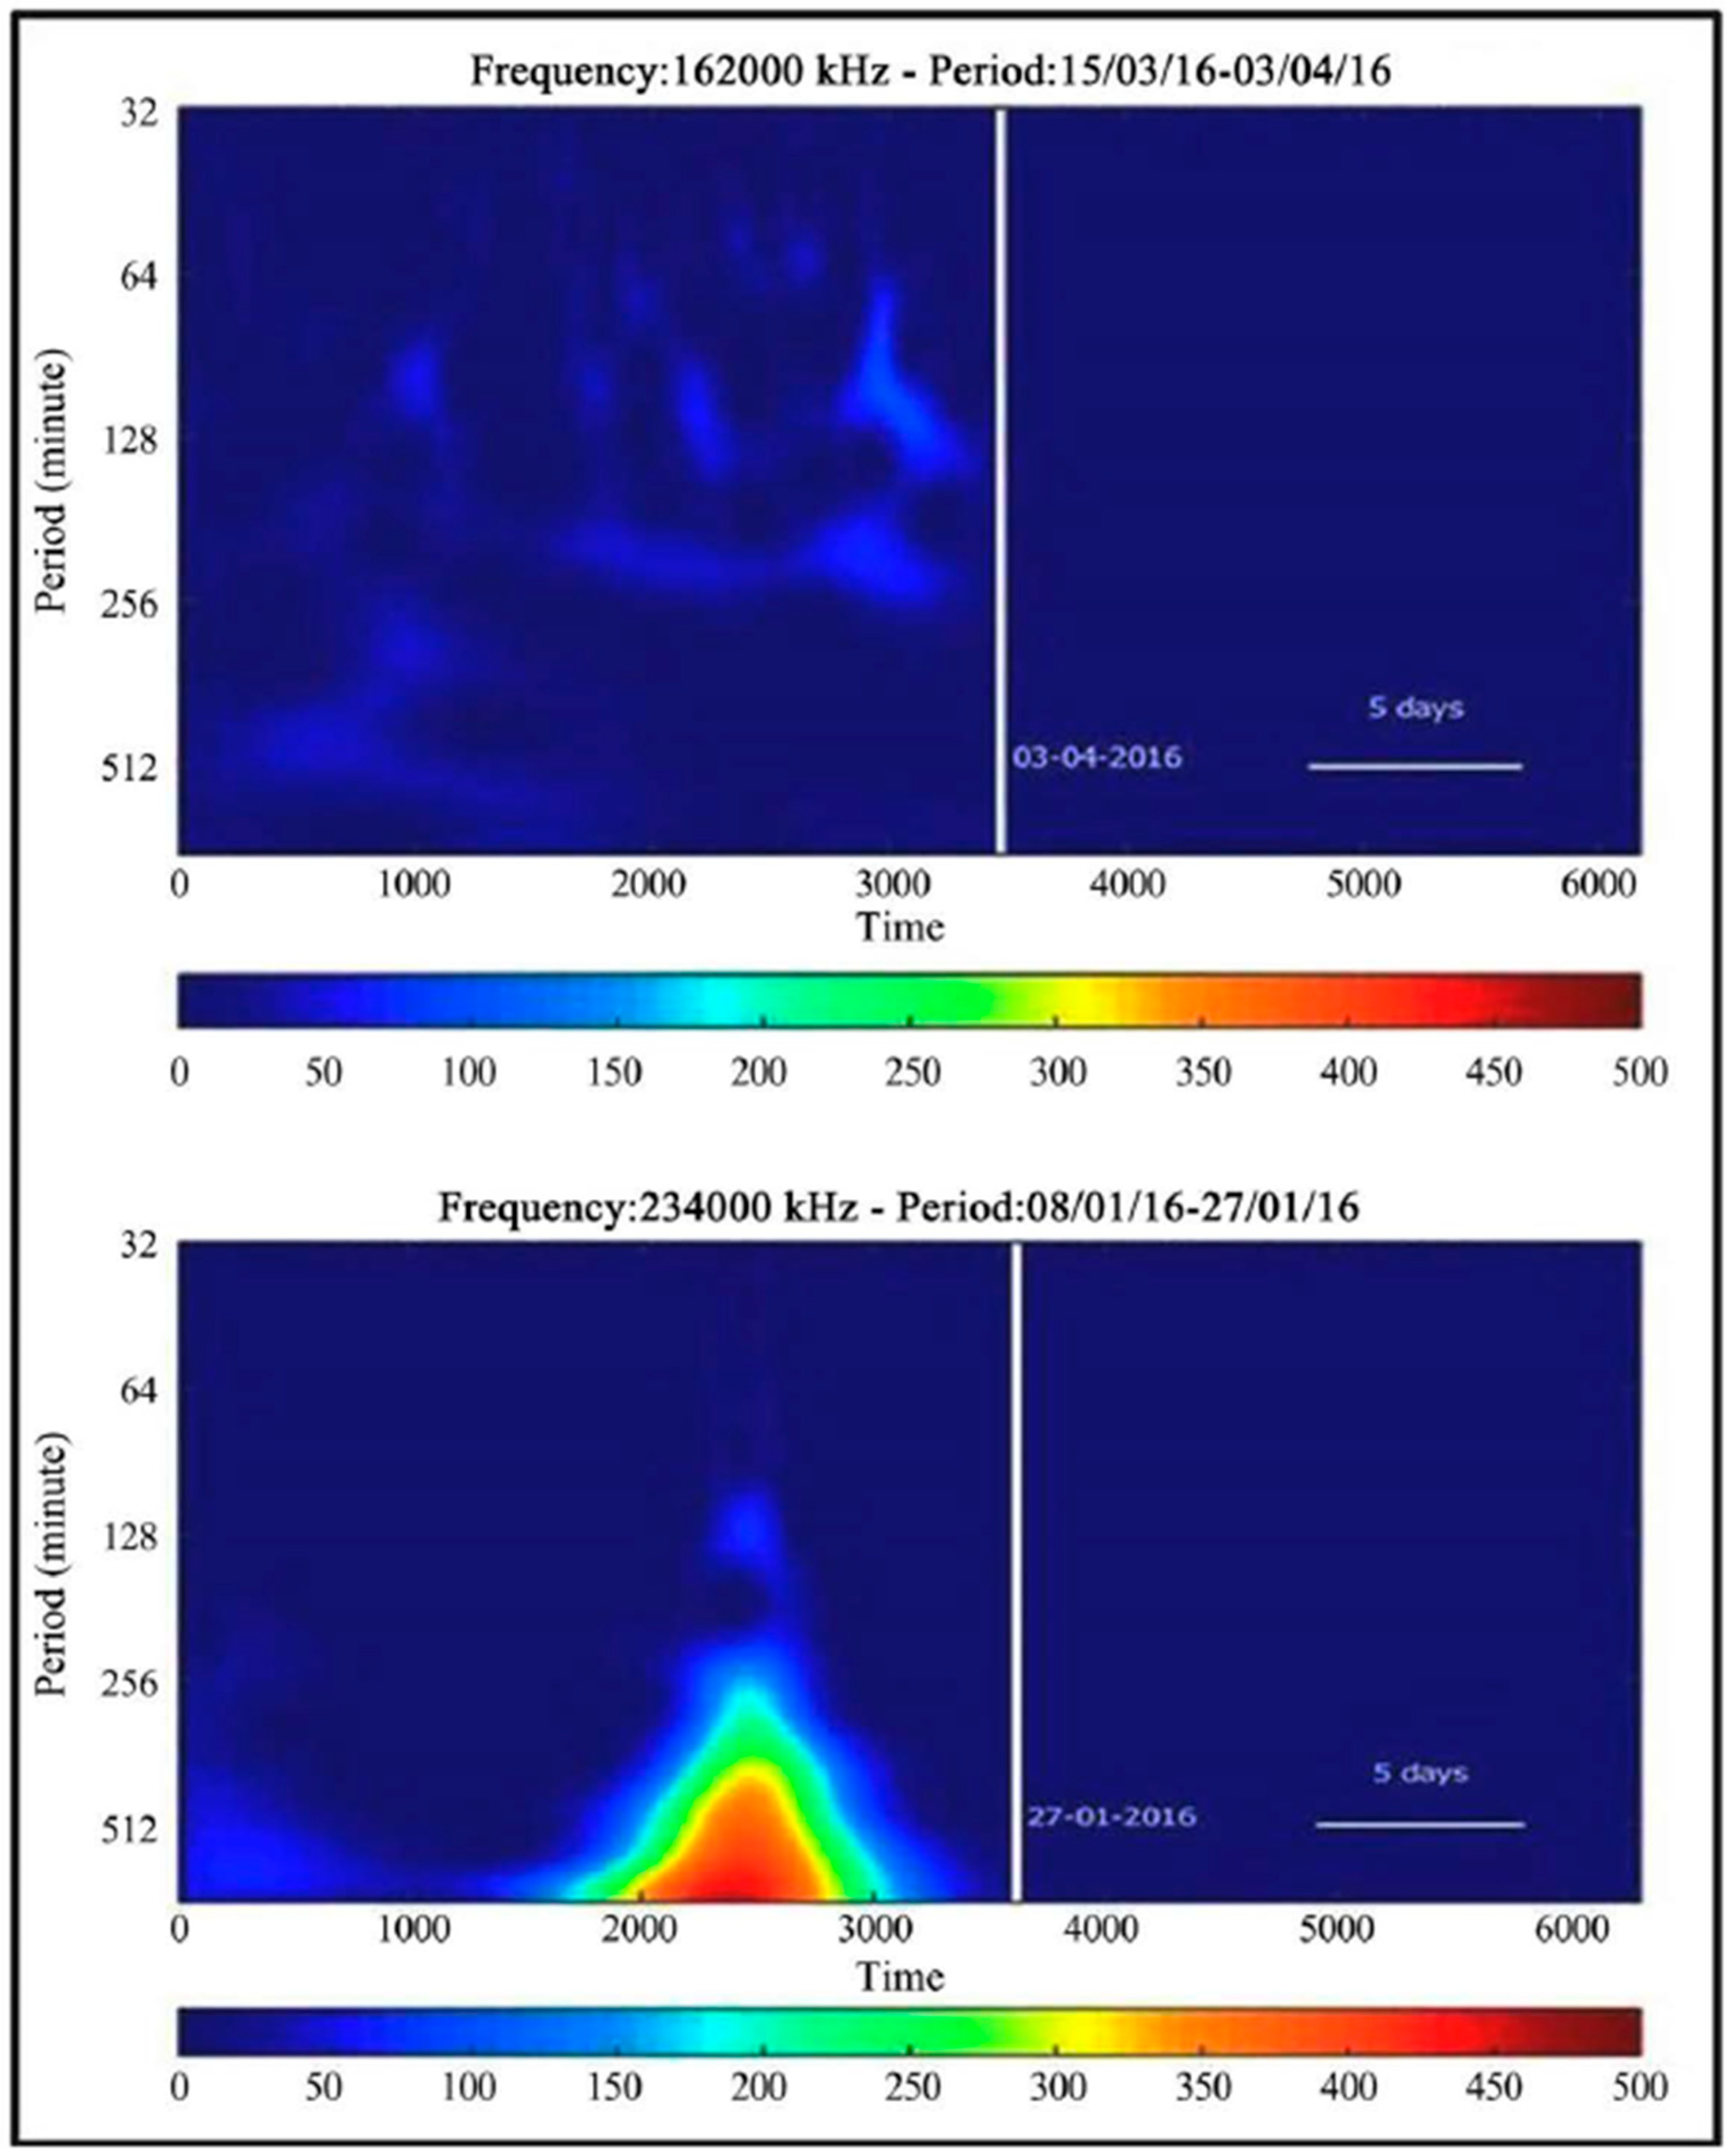
Several VLF/LF networks were established worldwide, but a notable European network led by Prof. P. Biagi in Italy deserves mention [79,80,81,82,83]. Named INFREP (The International Network for Frontier Research on EQ Precursors), it was developed in 2009 to study VLF/LF radio precursors. The network includes nine receivers: two each in Italy, Romania, and Greece; and one each in Austria, Portugal, and Cyprus. The Italian-manufactured radio receivers measure the intensity (electric field strength) of 10 radio signals in the VLF (20–80 kHz) and LF (150–300 kHz) bands at a 1-min sampling rate. These signals are emitted by existing VLF-LF broadcasting stations across Europe. Typically, each receiver picks up five VLF signals and five LF signals; the specific signals are selected based on local reception quality. The locations of transmitters and receivers are shown in Figure 9, with transmitter labels and frequencies summarized in Table 1. The collected data are sent daily to a server at the Department of Physics, University of Bari, Italy, which acts as the central node. To identify potential radio precursors, data analysis focuses on detecting anomalies that differ from normal data trends. In INFREP, analysis is conducted only on nighttime data from 21:00 to 24:00 UTC, covering three hours each day. Given the 1-minute sampling rate, this results in 180 data points per day. Several methods can be used to analyze these datasets and detect anomalies; INFREP employs wavelet analysis [80,81,83]. Using the Morlet wavelet function (Daubechies, 1990) [84], the wavelet transform converts the time series into a complex series represented by its squared amplitude, known as the wavelet power spectrum. This spectrum, a two-dimensional plot as shown in Figure 10, is normalized considering white noise power, providing insights into the strength and timing of various Fourier components in the original signal. Colors from blue to red indicate increasing power, with red zones representing anomalies, which could signal AGW fluctuations as precursors, discussed in Section 6.2. INFREP’s software automatically performs wavelet analysis on the radio data at the end of each day. This analysis considers the previous 15 days [2700 data points] or 20 days [3600 data points], with the current day marked by a vertical white line on the spectrum (Figure 10). Data after the current day are from the 15-day period without added frequencies to avoid border effects. Currently, the software analyzes nighttime data from four signals collected by each receiver: CIP, CRE, GRE, and IT-Aq. As shown in Figure 9 and Table 1, the transmitter combinations are as follows: CIP (using DHO, GBZ, EU1, and MCO); CRE (using DHO, EU1, FRI, and MCO); GRE (using CZE, GBZ, EU1, and RRO); and IT-Aq (using DHO, GBZ, EU1, and MCO).
(c)
Chinese network
Lastly, from China [85], their network includes two observing stations in western China that monitor Russian transmitters (ALPHA) at KRA, NOV, and KHA. This setup allowed them to investigate seismogenic ionospheric disturbances linked to the 2010 Yushu Ms7.1 EQ and the 2013 Lushan Ms7.0 EQ. Using the nighttime fluctuation method described in [86], they successfully identified clear anomalies on the propagation paths between the NOV and KHA transmitters and the two receiving stations prior to these EQs.

5. Further Evidence on Seismo-Ionospheric Perturbations

To convince readers that the lower ionosphere is definitely affected by EQs, we need to pursue two research approaches: (1) case studies examining various seismogenic phenomena simultaneously for large EQs occurring in different regions worldwide; and (2) statistical analyses aimed at demonstrating a significant correlation between VLF/LF propagation anomalies (that is, ionospheric perturbations) and EQs [86].
First, we present our two papers on the statistical study of the correlation of VLF/LF propagation anomalies with EQs.

5.1. Statistical Studies

We present a few additional papers dealing with statistical studies (Rozhnoi et al., 2004 [78]; Maekawa et al., 2006 [87]) and show their results one by one. These papers [78,87] are rather old, but we believe that their results still remain universal.
(a)
Statistical study of the path, Japan–Kamchatka
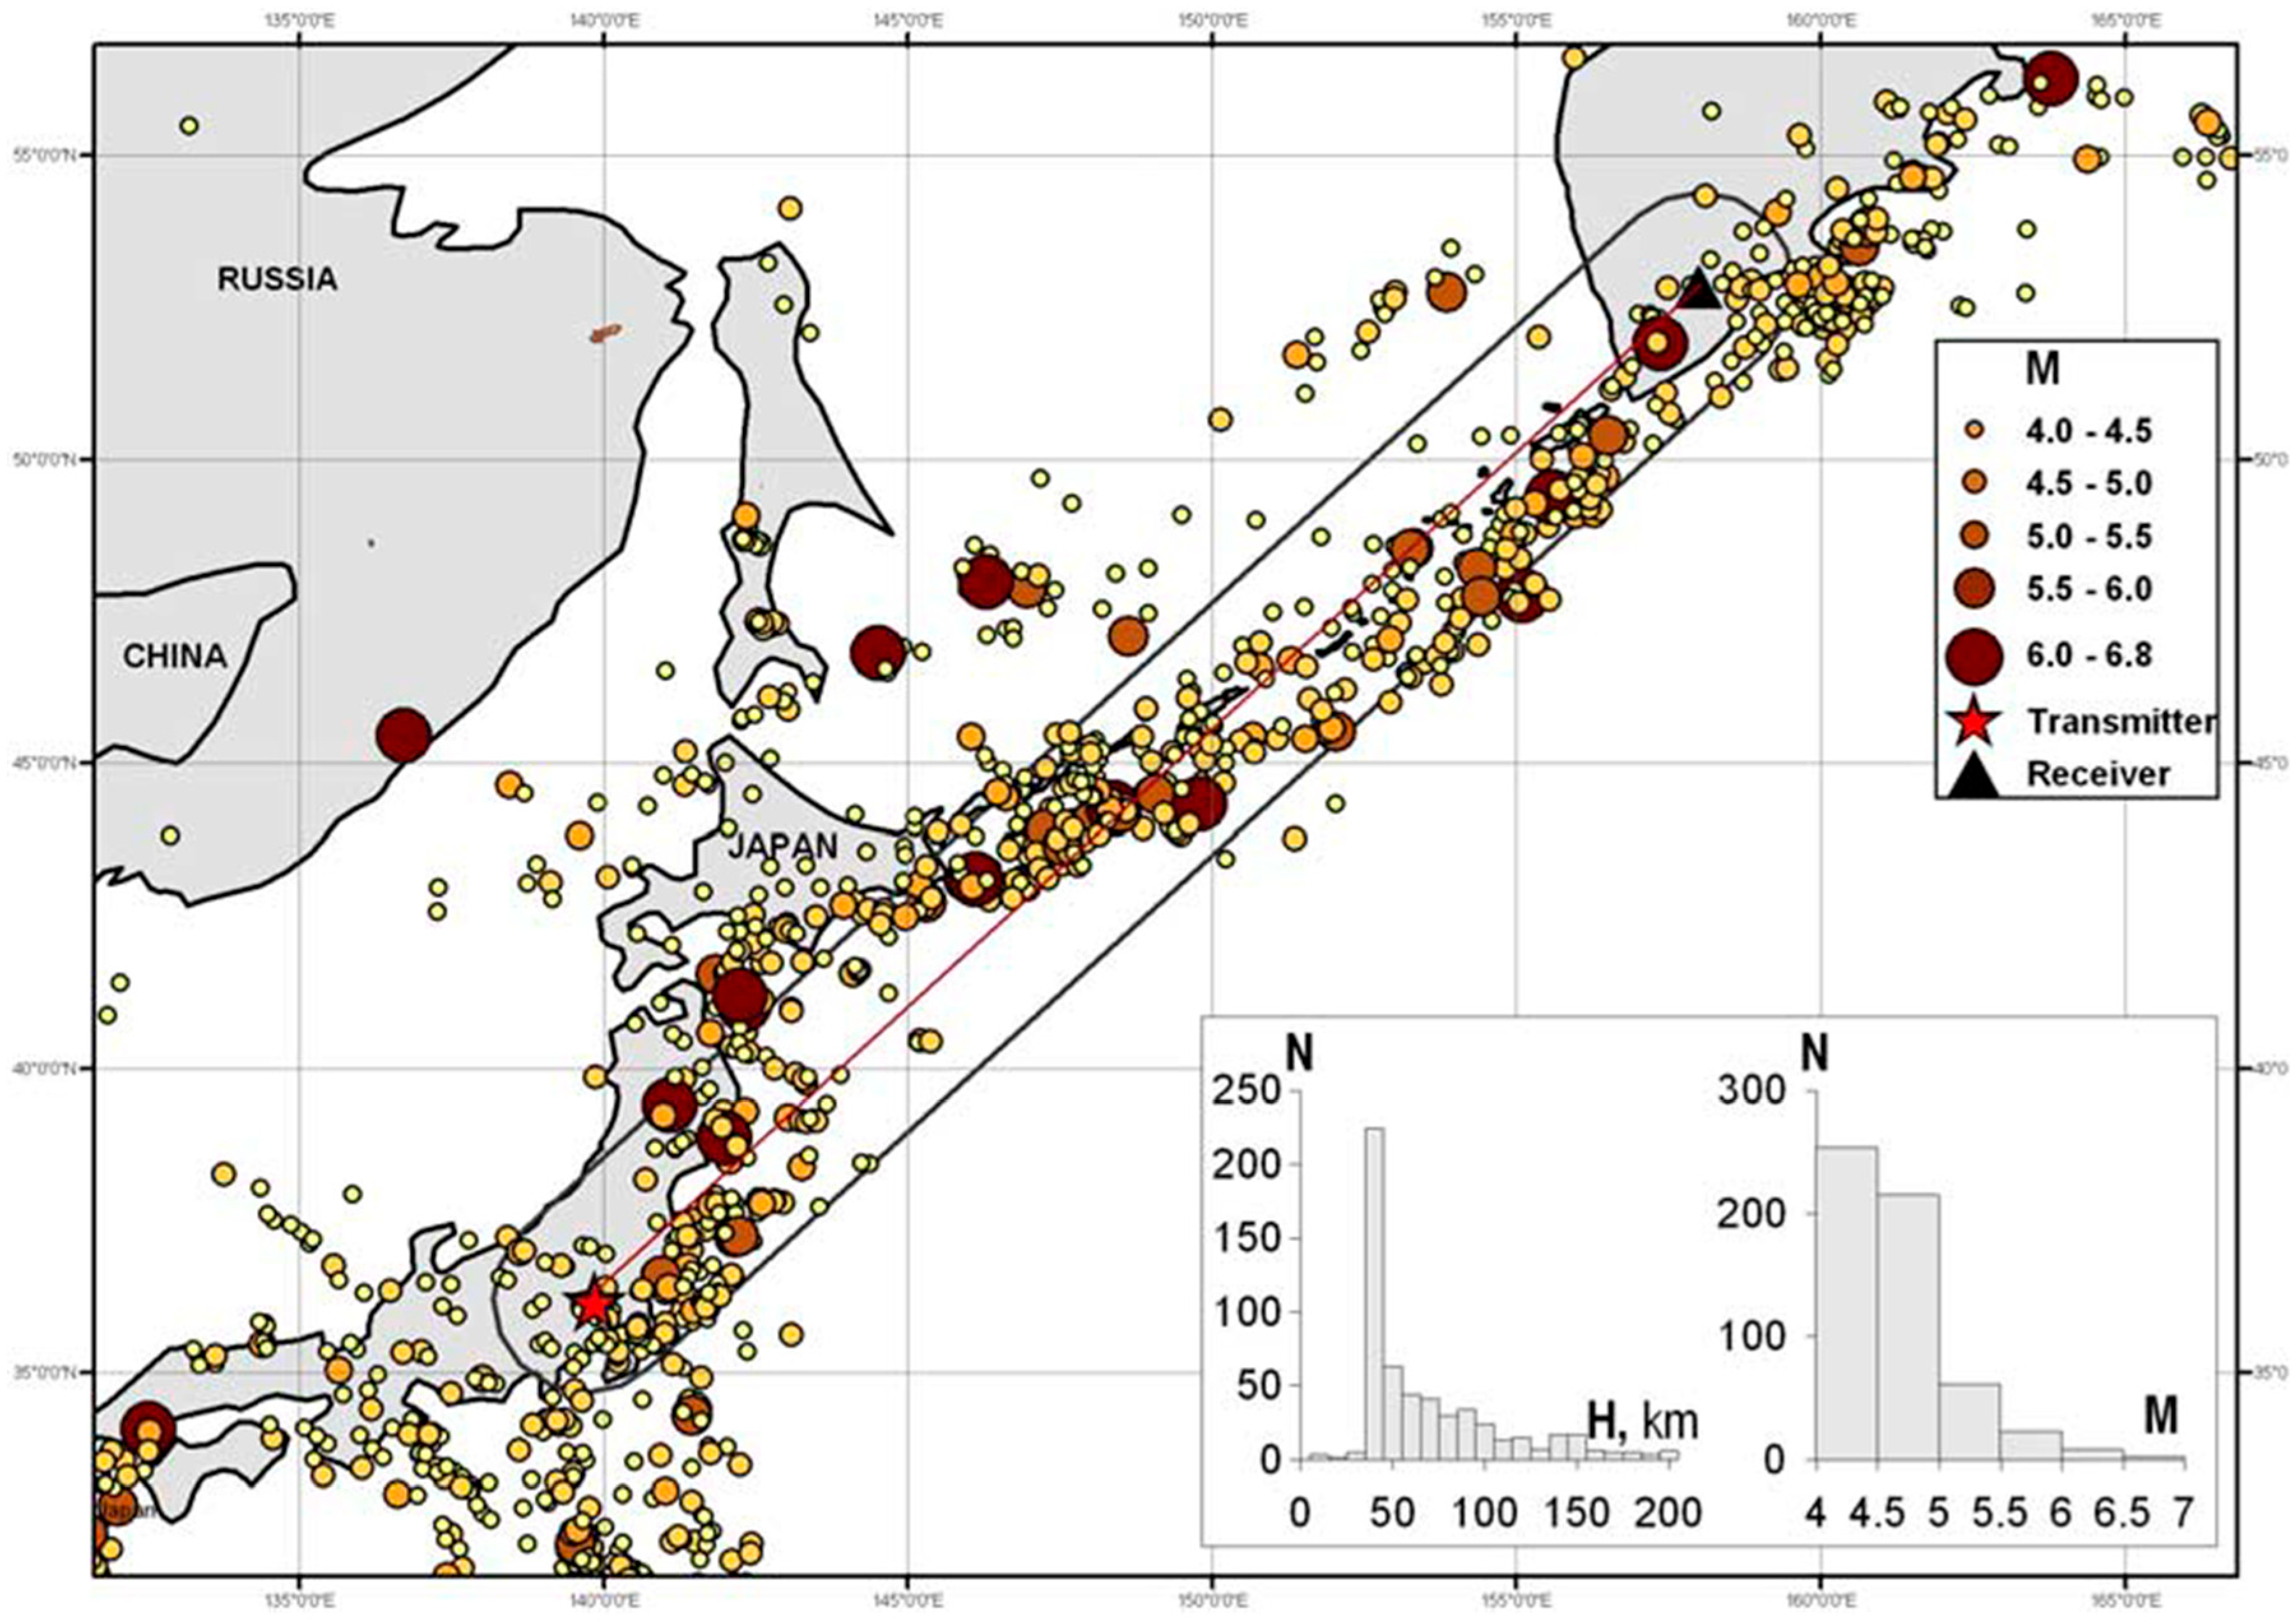
In the paper [78], they used data observed in Petropavlosk–Kamchatka (KCK in Figure 8) (geographic coordinates: 53.090176° N, 158.55° E), where they received LF signals from a transmitter JJY (40 kHz) in Japan (36.18° N, 139.85° E). The wave-path length is approximately 2300 km, with a sampling frequency of 20 s. We analyzed the results from this observation during 2001–2002 using the advanced digital VLF/LF receiver OmniPAL (also known as Japal) [14]. This receiver can simultaneously track the amplitude and phase of signals from one to five stations, as mentioned earlier. The locations of the transmitter and receiver, along with the positions of EQ epicenters (M > 4) for the period 2001–2002, are illustrated in Figure 11. The sensitivity area along the wave path, with a width of the second Fresnel zone (~300 km), is also displayed. The wave path sensitivity area appears to almost entirely cover the highly seismically active Izu-Bonin and Kurile-Kamchatka arcs. The epicentral zone can be divided into different regions characterized by distinct seismic activity and focal zone depths. Maximal focal depths in this region are 600–650 km, and the upper mantle exhibits a complex mosaic-layered structure. There are some low-velocity zones, and the depth of the lithosphere is approximately 60 km.
During two years of monitoring in the wave path sensitivity area, 565 EQs with M > 4 and 32 events with M > 5.5 were recorded. This is shown in Figure 11, where the magnitude of EQs is mainly represented by the size of the symbol. The highest EQ magnitude recorded is 6.8. The distributions of EQs by depth and magnitude M are shown in the inset of Figure 11. A high level of seismic activity along the LF signal wave-path and the complex structure of the focal zone make it challenging to study the correlation between phase and amplitude changes in LF signals and seismic events.
Here we present the data processing method (so-called nighttime fluctuation method [78,86]), which is becoming one of the most conventional VLF analysis methods [88,89,90,91,92,93]. We have made the empirical model of daily distribution of background phase and amplitude variations for each month. Diurnal variations in the amplitude and phase of the LF signal change significantly from month to month. Therefore, we use, for our analysis, a residual signal of phase dP or amplitude dA is defined as the difference between the observed signal and the average of a few quiet days immediately preceding or following the current day (±5 days):
d A ( t ) = A ( t ) A ( t ) ,         d P ( t ) = P ( t ) P ( t ) ,
where A(t) and P(t) are the amplitude and phase at a particular time for the current day, while A ( t ) and P ( t ) are the corresponding averages at time t. The signal is considered anomalous when dP or dA exceeds the corresponding standard deviation (σ).
Aside from sunrise and sunset, VLF/LF waves show very stable propagation in both phase and amplitude. As a result, data are selected during night and daytime, excluding the sunrise and sunset periods to avoid terminator time effects.
In night and day periods for each dataset, the averages dP and dA and their dispersions are estimated. Because the daytime variations in LF signals are less than those at night and they are strongly affected by sudden ionospheric disturbances (SID) caused by X-rays emitted during a solar flare on the Earth’s dayside, we have chosen only night conditions for our analysis.
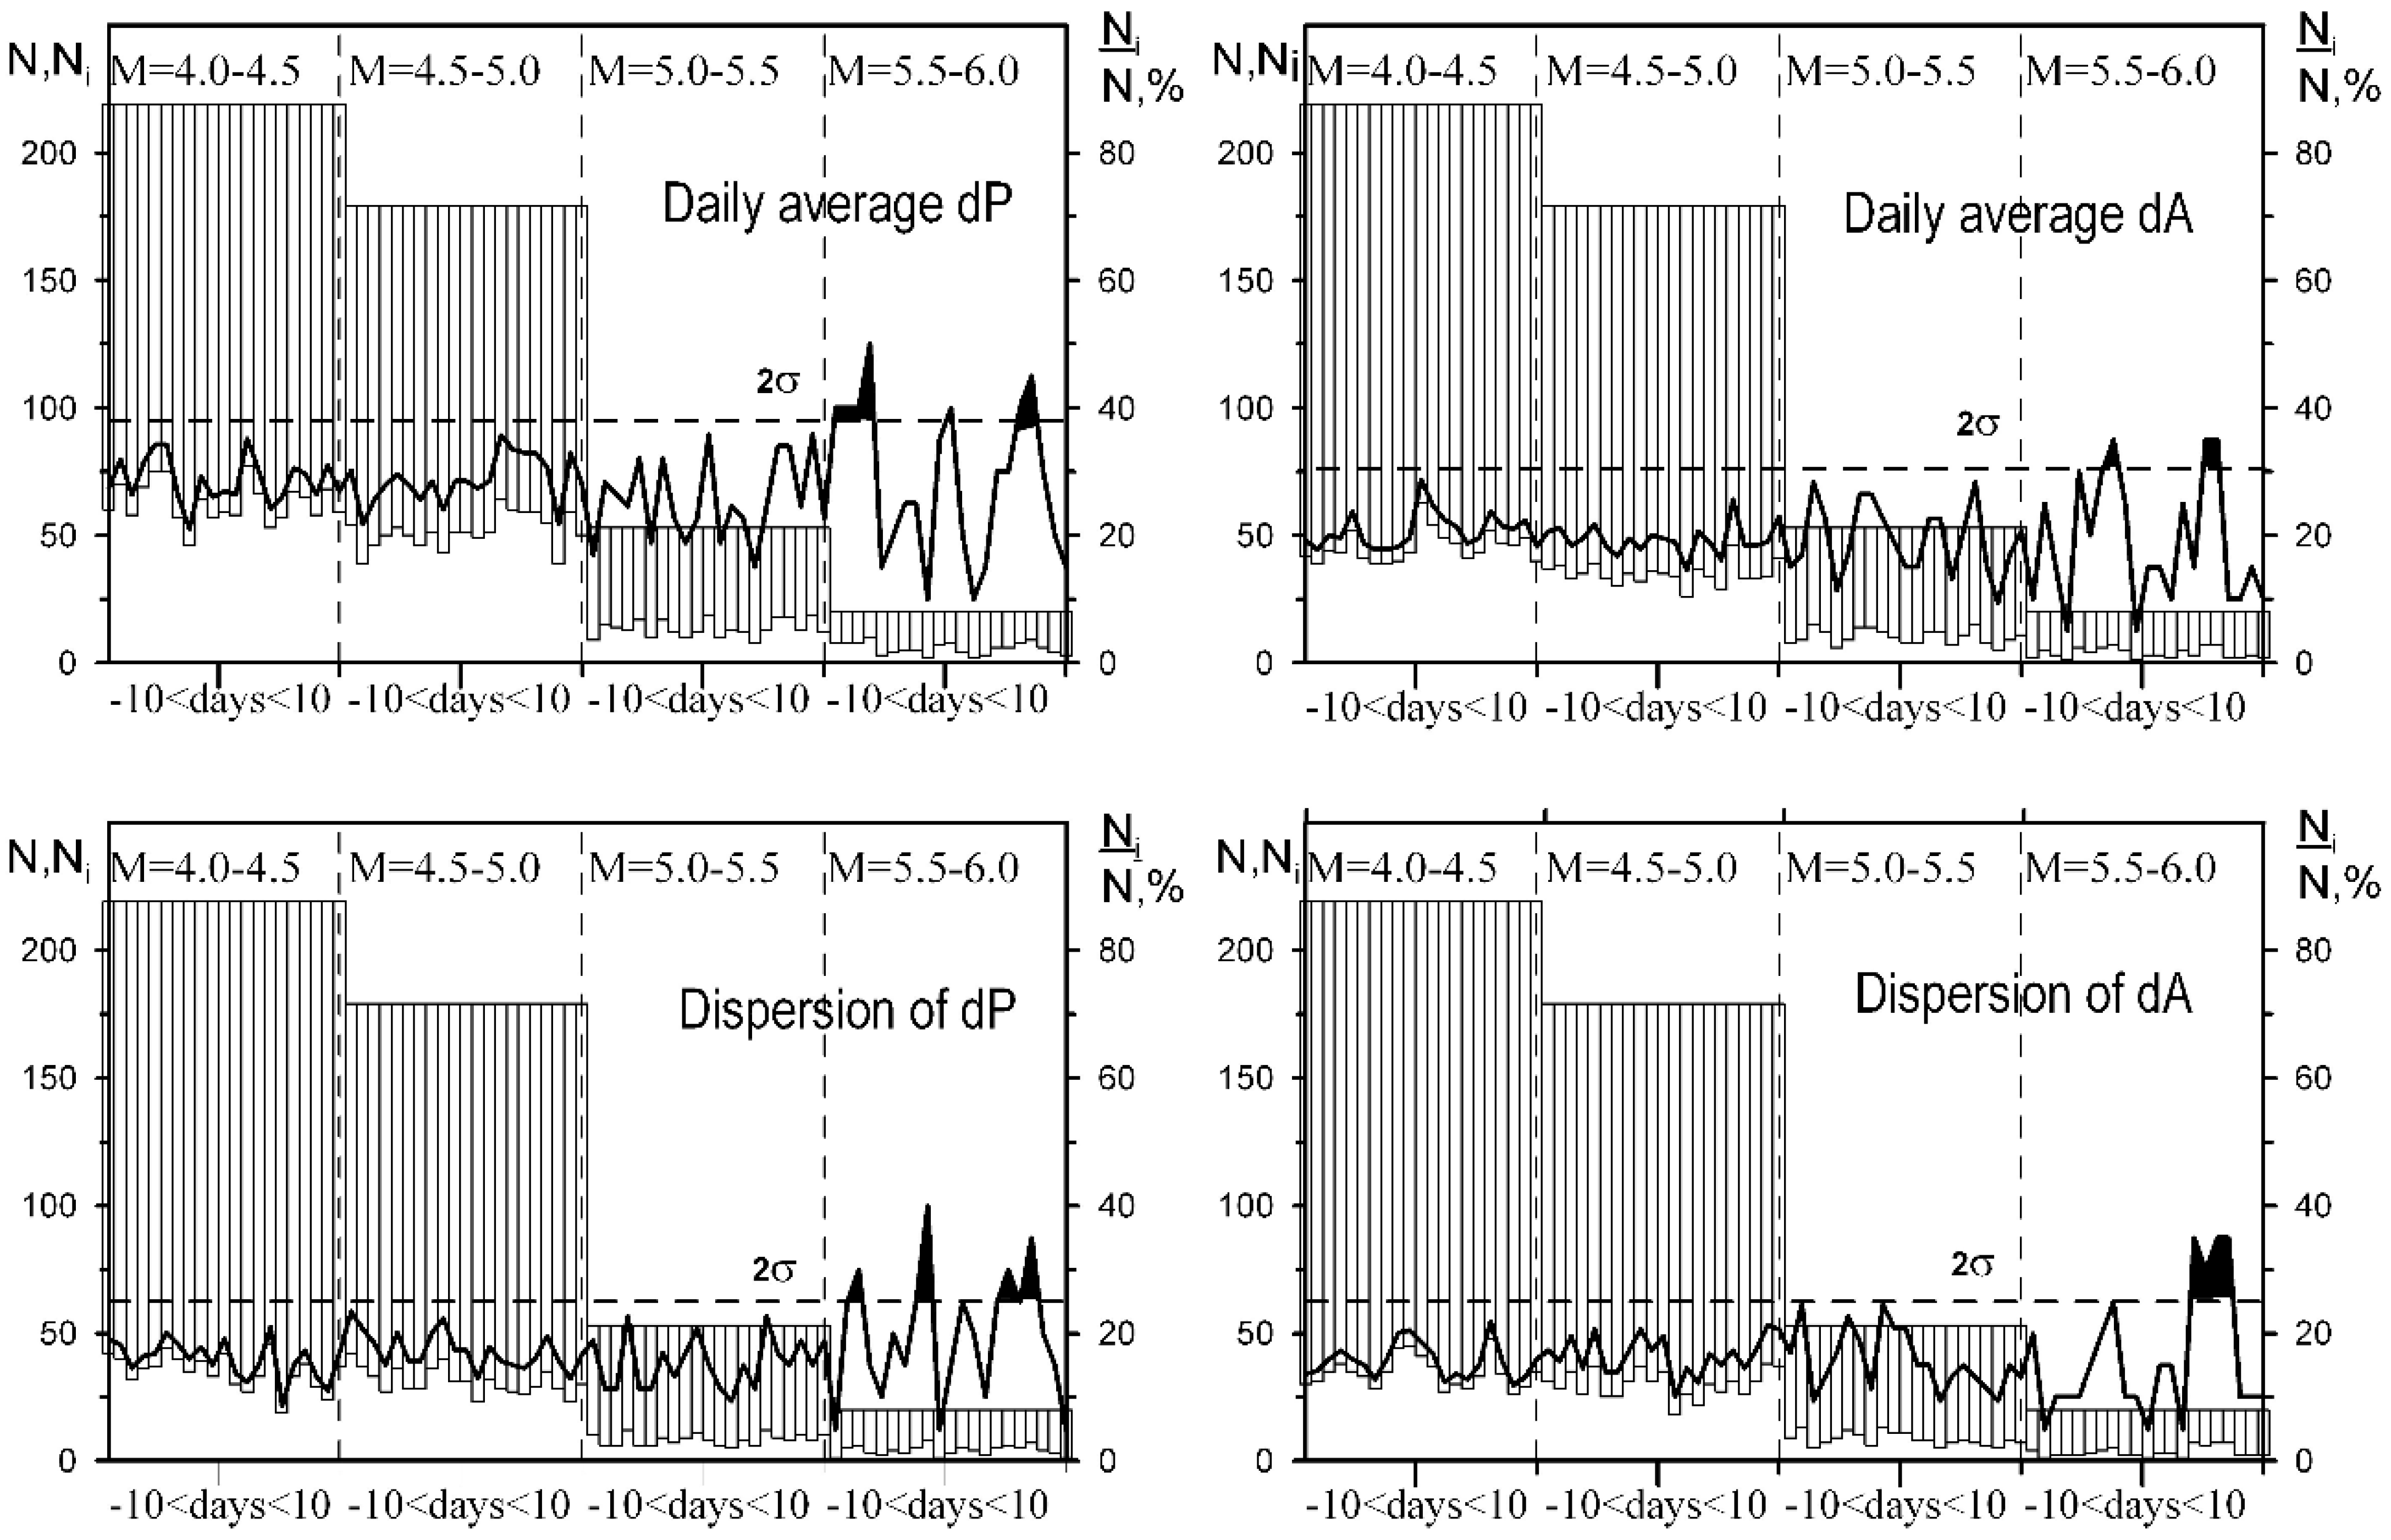
The results of statistical analysis for 2 years of observations are summarized in Figure 12. The average residual amplitude and phase of the signal (upper two panels in Figure 12) and their dispersion (bottom two panels) during nighttime are examined 10 days before and 10 days after an EQ. Magnitude (M) is divided into four intervals: 4.0–4.5, 4.5–5.0, 5.0–5.5, and 5.5–6.0. The figure displays bar charts where each range is divided into 21 parts (±10 days and the day of the EQ). The top of the bar chart is the number of events in the given interval of magnitudes (M), and the bottom of the bar chart is the number of days in which a signal or its dispersion exceeds the respective σ(Ni). The line is the ratio of Ni/N in percentage, and the dotted line is the averaged 2σ level. We can notice from the figure that there is no correlation of LF signal anomalies with EQs with M < 5.5 and with the number of days with regard to the moment of an EQ. However, when the EQ magnitude is more enhanced, such as 5.5 < M < 6, for all the days, the ratio of Ni/N is found to obviously exceed the averaged values by more than 2σ. Thus, on the wave-path under consideration, the sensitivity of LF signals (both phase and amplitude and their dispersions) to seismic processes becomes apparent mainly for M > 5.5. The most probable times of phase and amplitude anomalies are 7 and 2–3 days before the EQ and also 6–7 days after it.
(b)
Statistical study of the Japanese EQs
We present findings from two studies: Maekawa et al. (2006) [87] and Politis et al. (2024) [92]. First, we focus on results from [87], highlighting key differences from earlier studies by [78]. Notably, we used a much longer data collection period of five years for VLF/LF signals. Additionally, we examined specific physical parameters of VLF/LF propagation data, including (1) nighttime amplitude (or trend) and (2) amplitude dispersion (or nighttime fluctuations). The study in [78] focused on the percentage of anomalous days, where an anomalous day is defined as one with an amplitude and/or phase deviation from the monthly average exceeding one standard deviation (σ).
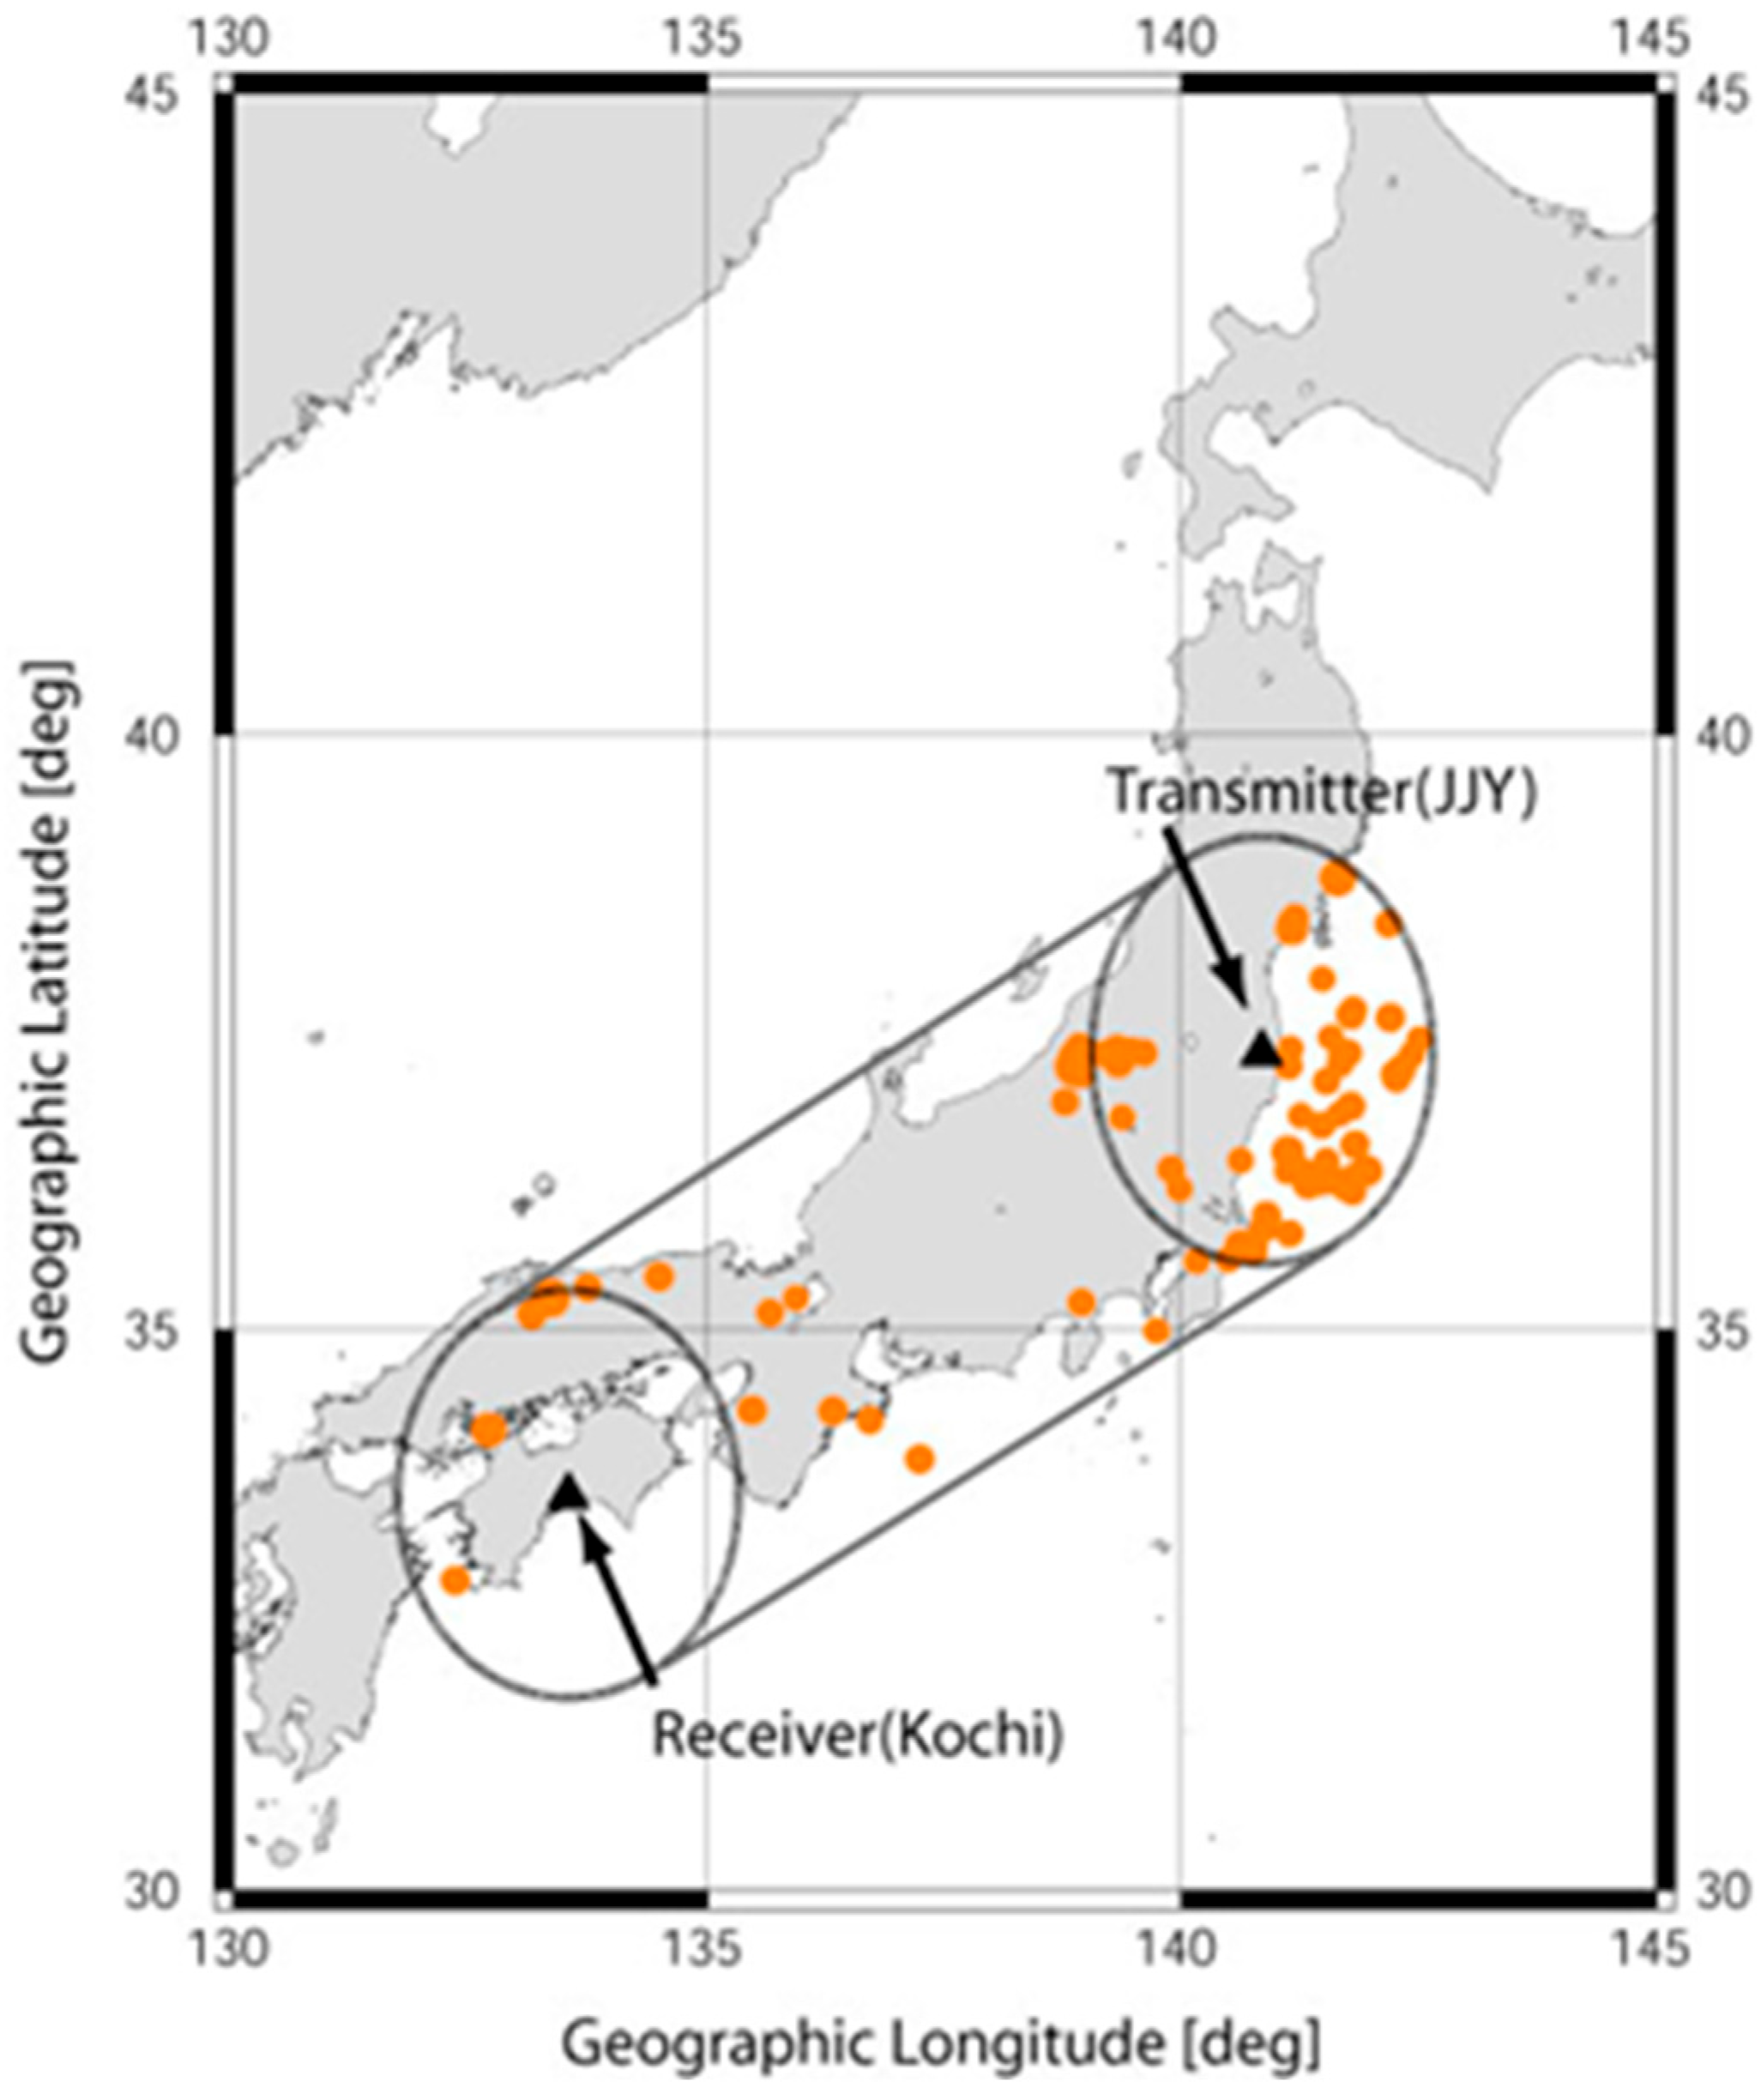
The subionospheric LF data for this propagation path were collected over six years, from June 1999 to June 2005, but we excluded the year 2004 (January to December) for specific reasons. As you may know, a significant EQ called the 2004 Mid-Niigata Prefecture EQ occurred on October 23, with a magnitude of 6.8 and a depth of 10 km. The impact of the main shock and numerous large aftershocks was so substantial and frequent that it could have disturbed our subsequent statistical analysis. Therefore, we excluded 2004 from our study. We also established criteria for selecting EQs. The sensitive area for the wave-path from the JJY transmitter to the Kochi receiving station is defined as follows: as shown in Figure 13, first we draw circles with a radius of 200 km around the transmitter and receiver, then connect the outer edges of these two circles to outline the sensitive region. All 92 EQs with a magnitude (conventional magnitude (M) by the Japan Meteorological Agency) greater than 5.0 are plotted in Figure 13, but the depth of the EQs is limited to less than 100 km, considering our previous findings that shallow EQs can influence the ionosphere [21]. Normally, we adopt the fifth Fresnel zone as the VLF/LF sensitive area [22,78], but we have found that the region immediately surrounding the transmitter and receiver is also responsive to VLF perturbations (e.g., [94]), especially considering the possible size of seismo-ionospheric disturbances. In this sense, the selected sensitive area seems quite reasonable as its width closely matches the 10th Fresnel zone.
The subionospheric LF data for this propagation path were collected over six years, from June 1999 to June 2005; however, we excluded data from the year 2004 (January to December) due to specific reasons. As you may know, there was a particularly large EQ called the 2004 Mid-Niigata Prefecture EQ, which occurred on October 23 with a magnitude of 6.8 and a depth of 10 km. The impact of the main shock, along with its large aftershocks, was substantial and frequent, likely disturbing our subsequent statistical analysis. Therefore, we decided to exclude 2004 from our study. We also needed to establish criteria for selecting EQs. The sensitive area for the wave-path from the JJY transmitter to the Kochi receiving station is defined as follows. As shown in Figure 13, we first draw circles with radii of 200 km around both the transmitter and receiver. The sensitive area is then defined by connecting the outer edges of these two circles. All 92 EQs with a magnitude (conventional magnitude (M) by the Japan Meteorological Agency) greater than 5.0 are plotted in Figure 13. However, only EQs with depths less than 100 km were considered, based on our previous findings that shallow EQs can influence the ionosphere [21]. Typically, we use the fifth Fresnel zone as the VLF/LF sensitive area [22,78], but we have also observed that the region around the transmitter and receiver is sensitive to VLF perturbations (e.g., [94]), considering the possible scale of seismo-ionospheric disturbances. In this context, the sensitive area we have chosen appears appropriate, as its width is very close to the 10th Fresnel zone.
In the following statistical analysis, we perform superimposed epoch analysis to enhance the S/N ratio; we define EQ magnitude differently here. Since we treat the data in units of one day using U.T. (instead of L.T.), where a day is counted from midnight U.T. even if it crosses into the next calendar day, we first estimate the total energy released from multiple EQs of various magnitudes within a day in the sensitive area for the LF wave path, as illustrated in Figure 13. This involves integrating the energy from several EQs (down to the conventional magnitude M = 2.0) and converting it into an effective magnitude (Meff) for that day. Meff is more significant than the conventional magnitude of individual EQs because the LF propagation anomaly for a day reflects the combined effect of multiple EQs occurring within the sensitive area. Although not shown graphically, we observe that there are 19 days with Meff exceeding 5.5.
Diurnal variations in the amplitude and phase of subionospheric VLF/LF signals are known to fluctuate significantly from month to month and day to day. As a result, building on our previous research [78,93], we analyze a residual amplitude signal, dA, which is calculated as the difference between the observed signal intensity and the average over several days before or after the current day.
d A ( t ) = A ( t ) < A ( t ) >
where A(t) is the amplitude at a time t for a current day; and < A(t) > is the corresponding average at the same time t over ±15 days (15 days before, 15 days after the EQ, and on the day of the EQ). In our analysis, we examined the nighttime variation within the U.T. range from 10 h to 20 h (or L.T. from 19 h to 05 h). We then utilize two physical parameters: the average amplitude (which we refer to as the trend) and the amplitude dispersion (which we refer to as fluctuation or dispersion). We estimate the average amplitude for each day (in terms of U.T.) using the observed dA(t) and a single value for dispersion (fluctuation) for each day.
Next, we perform a superimposed epoch analysis. For our investigation into the correlation between ionospheric disturbances—measured by amplitude and dispersion—and seismic activity, we select two characteristic periods: seismic periods with Meff exceeding 5.5 and those exceeding 6.0. There are 19 events with Meff ≥ 5.5, and 4 events with Meff ≥ 6.0.
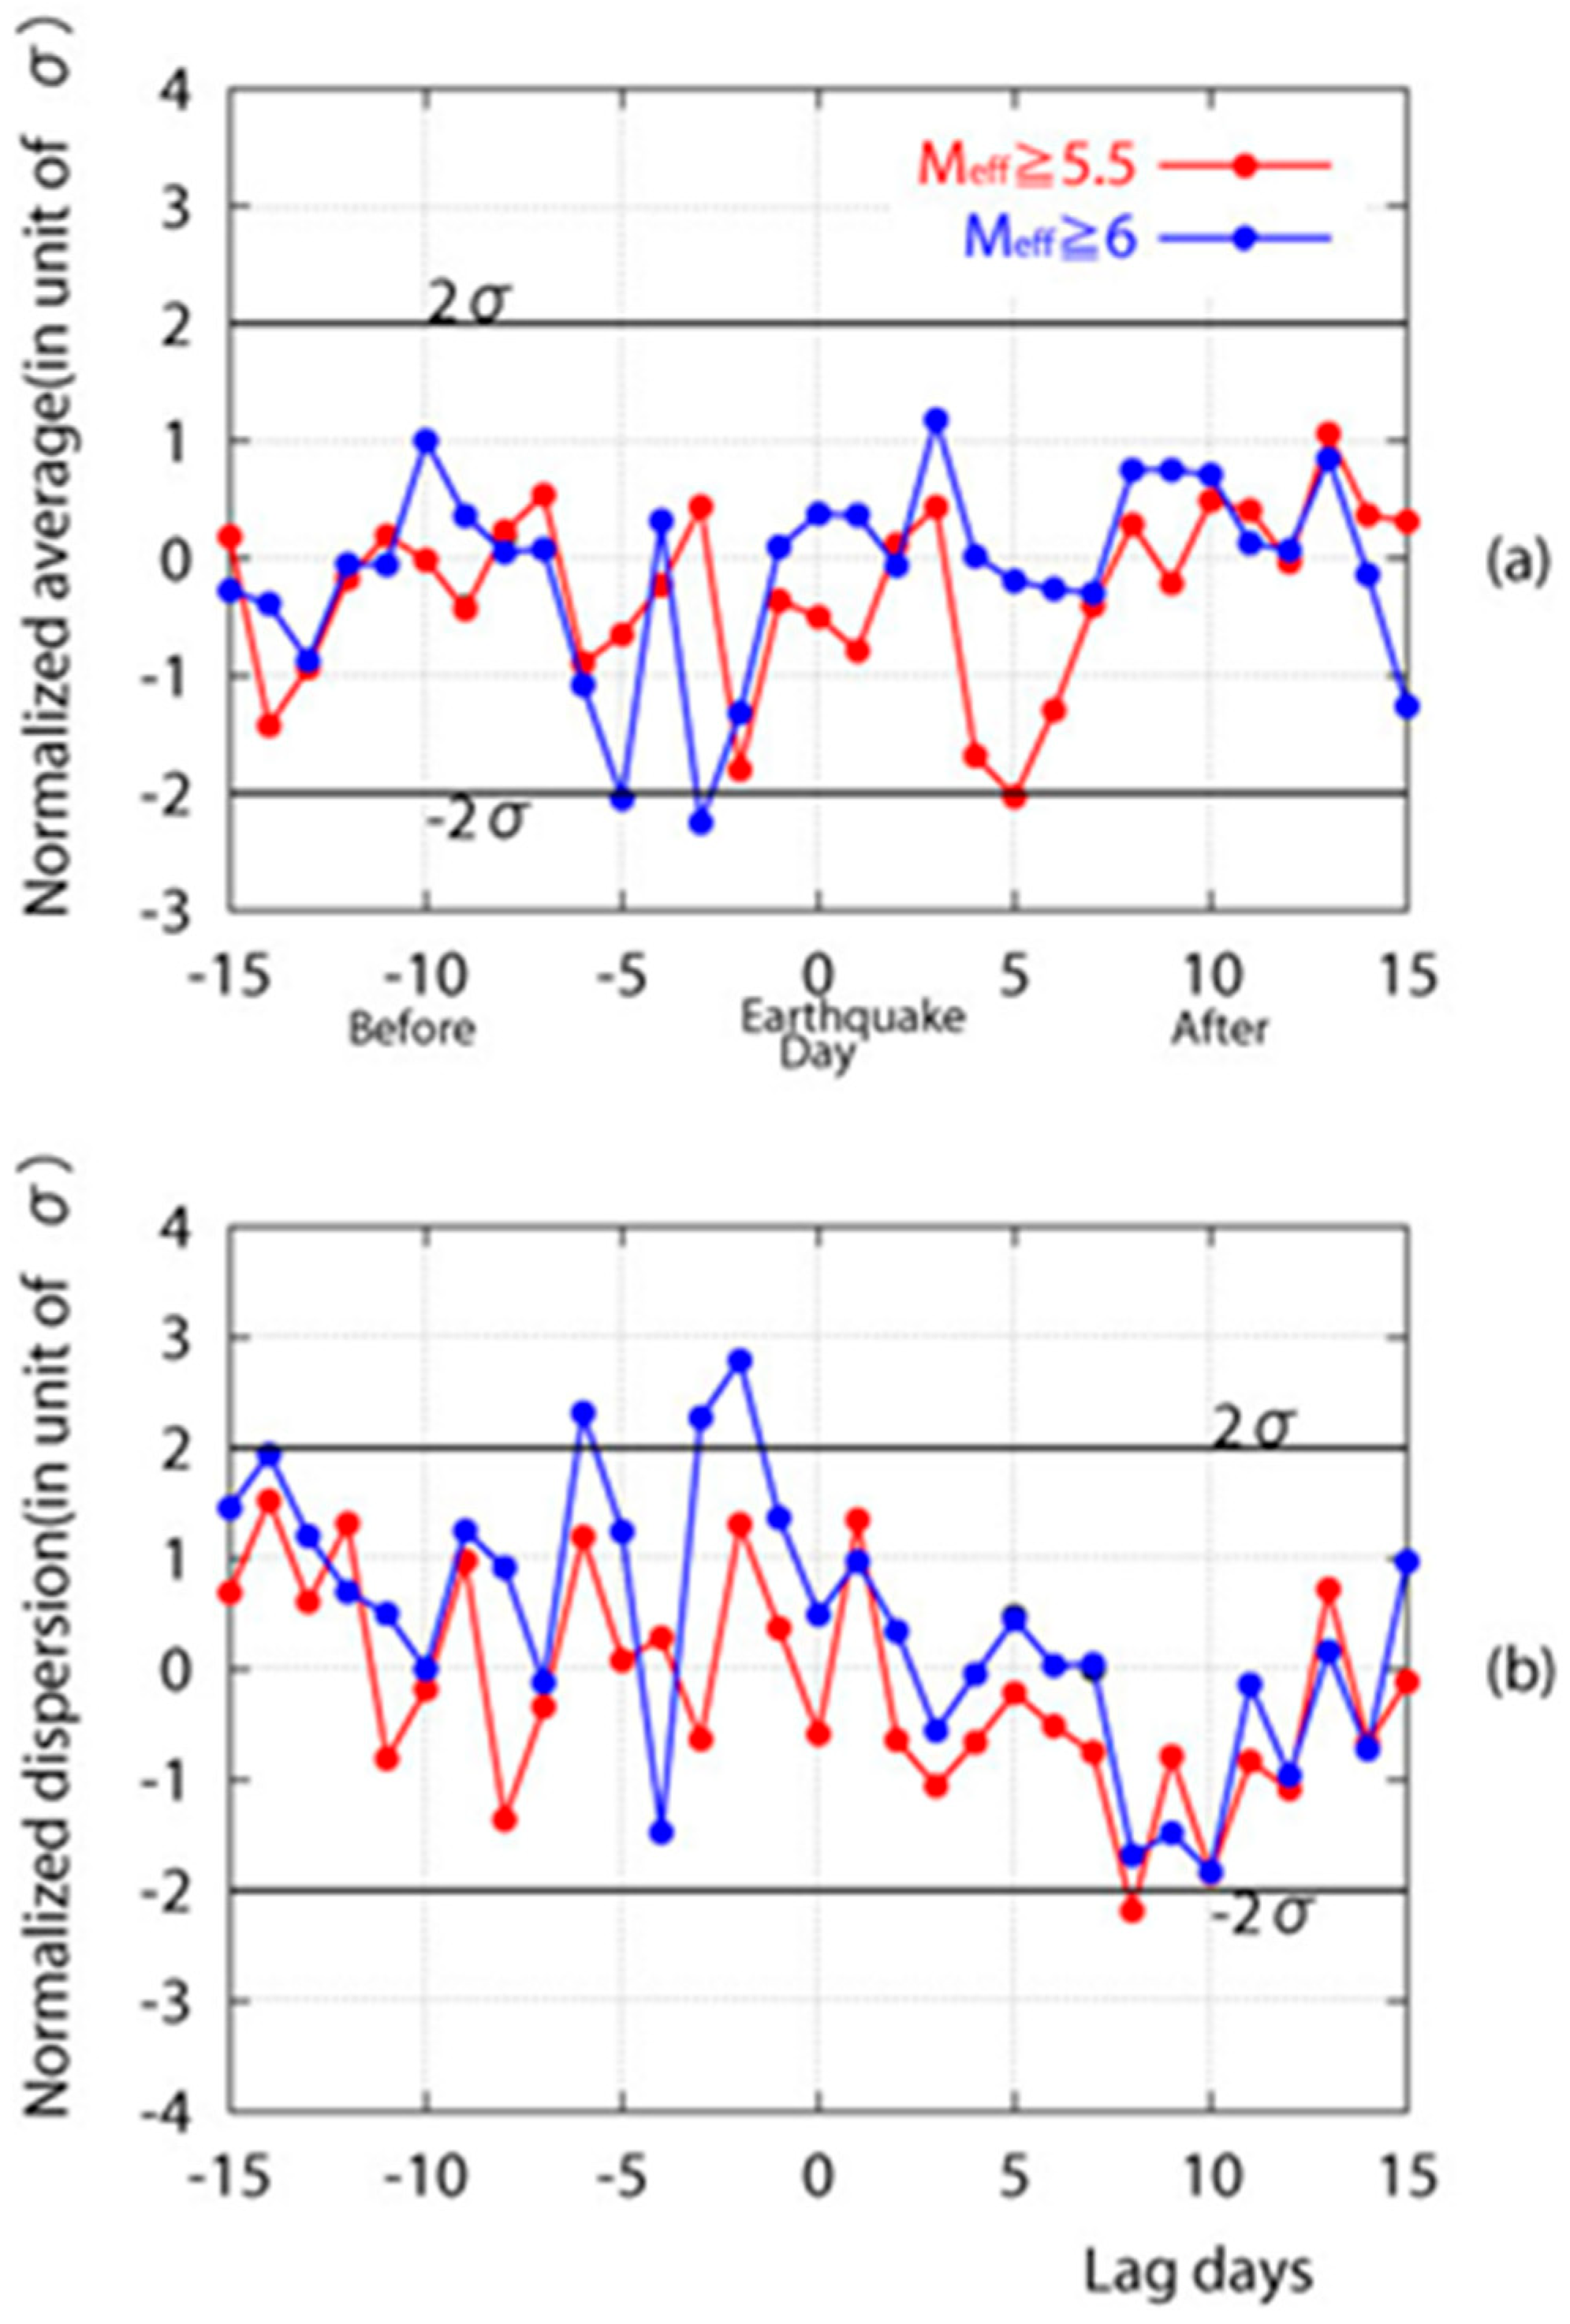
We finally perform the statistical test. When we apply Fisher’s z-transformation to the data’s amplitude and dispersion, respectively, the z-value generally follows an approximately normal distribution, N(0, 1), with a mean of zero and a standard deviation of one. Figure 14a,b show the corresponding results of the z-test. The 2σ (σ: standard deviation over the entire five-year period) line is used as the statistical criterion. First, we examine the amplitude (trend) results in Figure 14a. It is evident that the blue line for Meff greater than 6.0 exceeds the 2σ line (about a 3 dB decrease) a few days prior to the EQ. This indicates that the ionospheric perturbation, in terms of amplitude (trend), exhibits a statistically significant precursory behavior (3 to 5 days before the EQ). Next, we look at Figure 14b for dispersion. The increase in dispersion (fluctuation) is clearly noticeable during periods of extremely high seismic activity (Meff ≥ 6.0). Specifically, dispersion exceeds the 2σ line from 6 to 2 days before the EQ. When Meff decreases slightly (Meff ≥ 5.5), the effect of the EQ remains detectable, though less significantly compared to the case where Meff ≥ 6.0. Finally, we comment on the results for M ≥ 5.0 (considering values below Meff = 5.5 in steps of 0.5). We find that variations in amplitude and dispersion stay well within the ±2σ bounds for Meff ≥ 5.0. Based on these findings, we conclude that seismic effects are notably observable only for Meff ≥ 6.0. This final conclusion on the correlation between magnitude and effects aligns with earlier results [78] discussed in the previous subsection and subsequent findings.
Secondly, our latest statistical results by Politis et al. (2024) [92] are presented, which include a six-year (2014–2020) statistical analysis of Japanese VLF propagation data collected at 19 VLF observing receivers from a VLF transmitter named JJI (Ebino, Kyushu) operating at a frequency of 22.2 kHz, all located within Japan. Moderate and strong EQs (ML ≥ 4.5 and depth ≤ 50 km) that occurred in the wider area around Japan during the same period and with available VLF data are investigated. The shifts in terminator times in VLF amplitude data, as potential precursors of EQs, are statistically examined, with a focus on their correlation with seismic activity. The concept of the effective EQ magnitude (Meff) is used to define the total EQ energy that could influence the midpoint of each path daily. It is important to note that dates when geomagnetic storms or solar flares occurred, as well as dates corresponding to the well-known winter effect on terminator time statistics in the north–south direction, were excluded. The cross-correlation between anomalies in terminator time statistics and seismic activity, represented by Meff, was identified. Most maximum cross-correlation values were found for cases prior to the subsequent seismic activity (1–7 days before EQs), indicating a close link between ionospheric anomalies and later seismic events. Lastly, the broad temporal range of the locations of the cross-correlation maxima is explained by the inhomogeneity of the lower ionosphere, combined with the anisotropy of the pre-seismic effect of impending seismicity, highlighting the complexity of EQ preparation processes.

5.2. Case Studies

Mainly based on the Japanese VLF/LF network mentioned above (although occasionally using foreign networks), we have conducted numerous case studies on large EQs. We can list these EQs: (1) Izu Peninsula EQ swarm (largest magnitude 6.3) in March 1997 (using data from Tsushima, Omega, and Chofu); (2) Tokai (Nagoya) area EQs (with data from NWC (Australia) to Kasugai (Nagoya)) [94]; (3) Tokachi-oki EQ (25 September 2003, M8.3) [46,93]; (4) Niigata-Chuetsu EQ (23 October 2004, M6.8) [95,96]; (5) Chi-chi EQ in Taiwan (20 September 1999, M7.6) [97]; (6) Sumatra EQ in Indonesia (26 December 2004, M9.0) [98,99]; (7) the 2010 Haiti EQ [100]; (8) the 2011 Tohoku EQ [101]; (9) the 2016 Kumamoto EQ [102]; (10) the 2017 Greece EQ [103]; (11) the 2020 Samos (Greece) EQ [104]; and (12) the 2020 Croatian EQ [28]. Below, we present interesting results for one of the huge EQs, the 2011 Tohoku EQ.
(a)
The disastrous 2011 Tohoku EQ
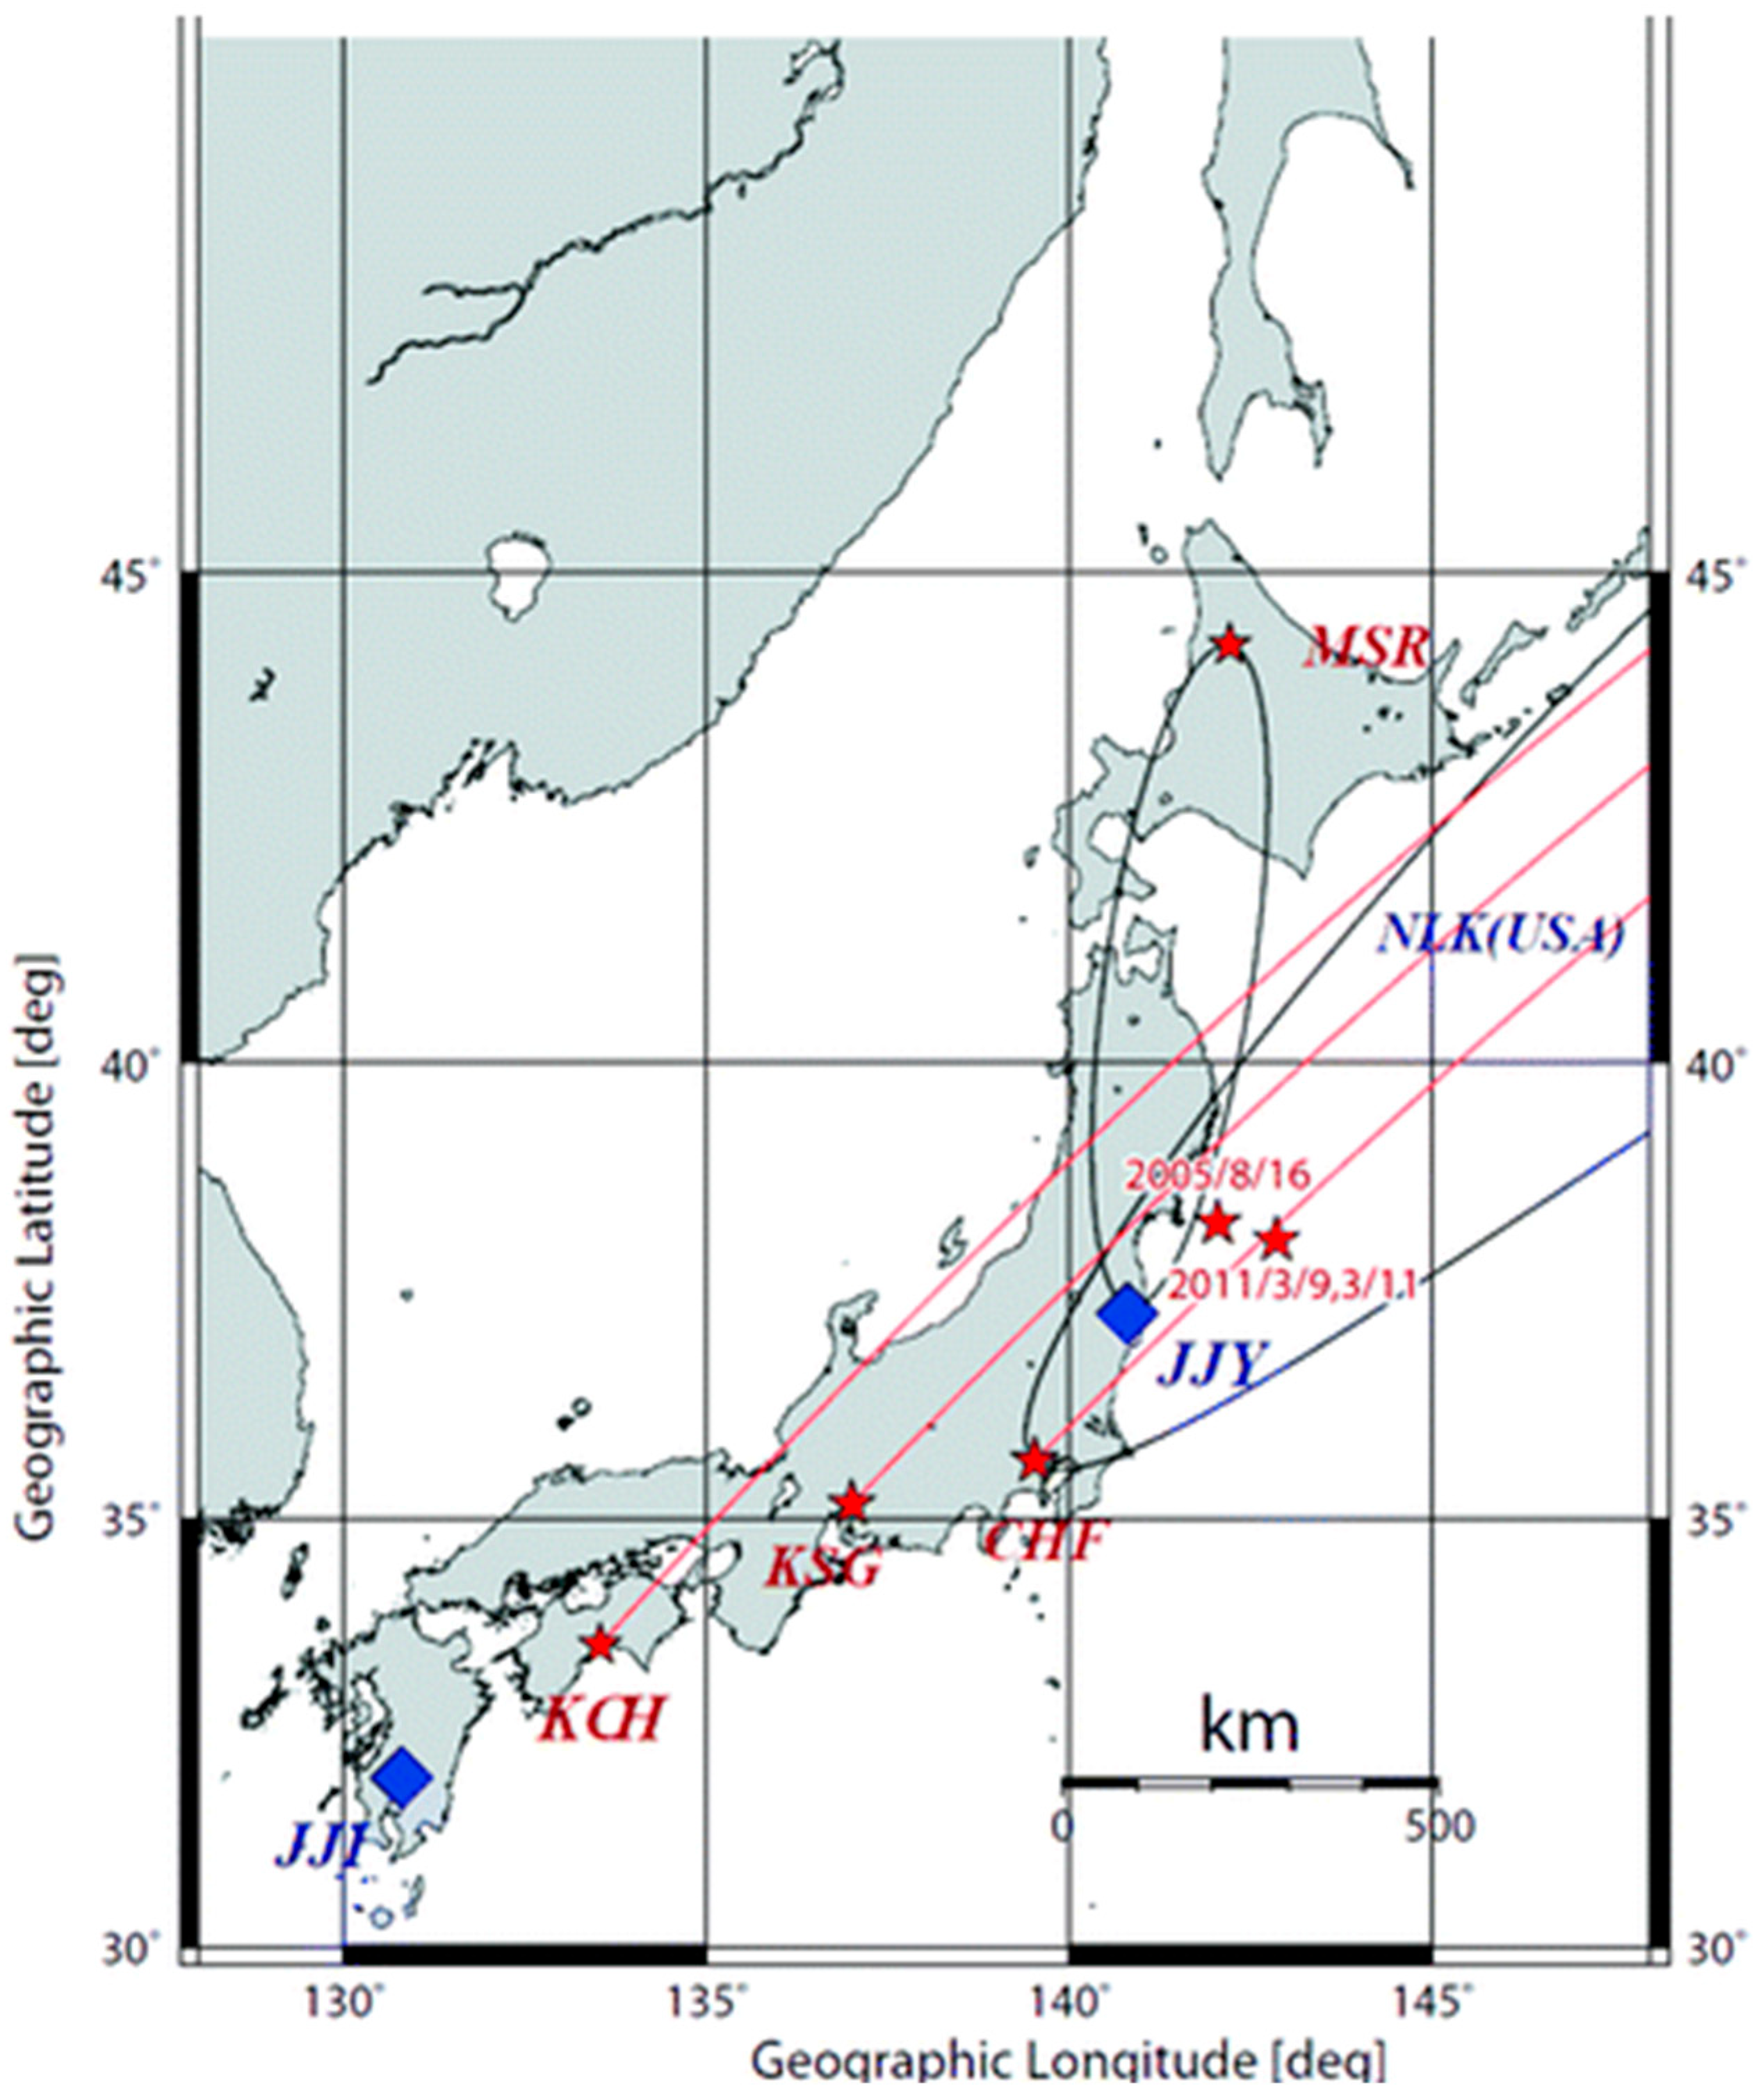
There was an extremely large EQ (with a magnitude of 9.0) beneath the sea bed in the Pacific Ocean off the Tohoku region of Japan, officially known as the 2011 off the Pacific coast of Tohoku EQ. This EQ occurred at 14:46:18 L.T. on 11 March 11, with its epicenter at the geographic coordinates (36°6.2′ N, 142°51.6′ E), as shown in Figure 1 by a red star, along with the date and a depth of approximately 20 km. This EQ is a typical oceanic plate-type EQ around Japan, which differs significantly from the extensively studied fault-type EQs such as the Kobe EQ [20], Niigata–Chuetsu EQ [95,96], or similar.
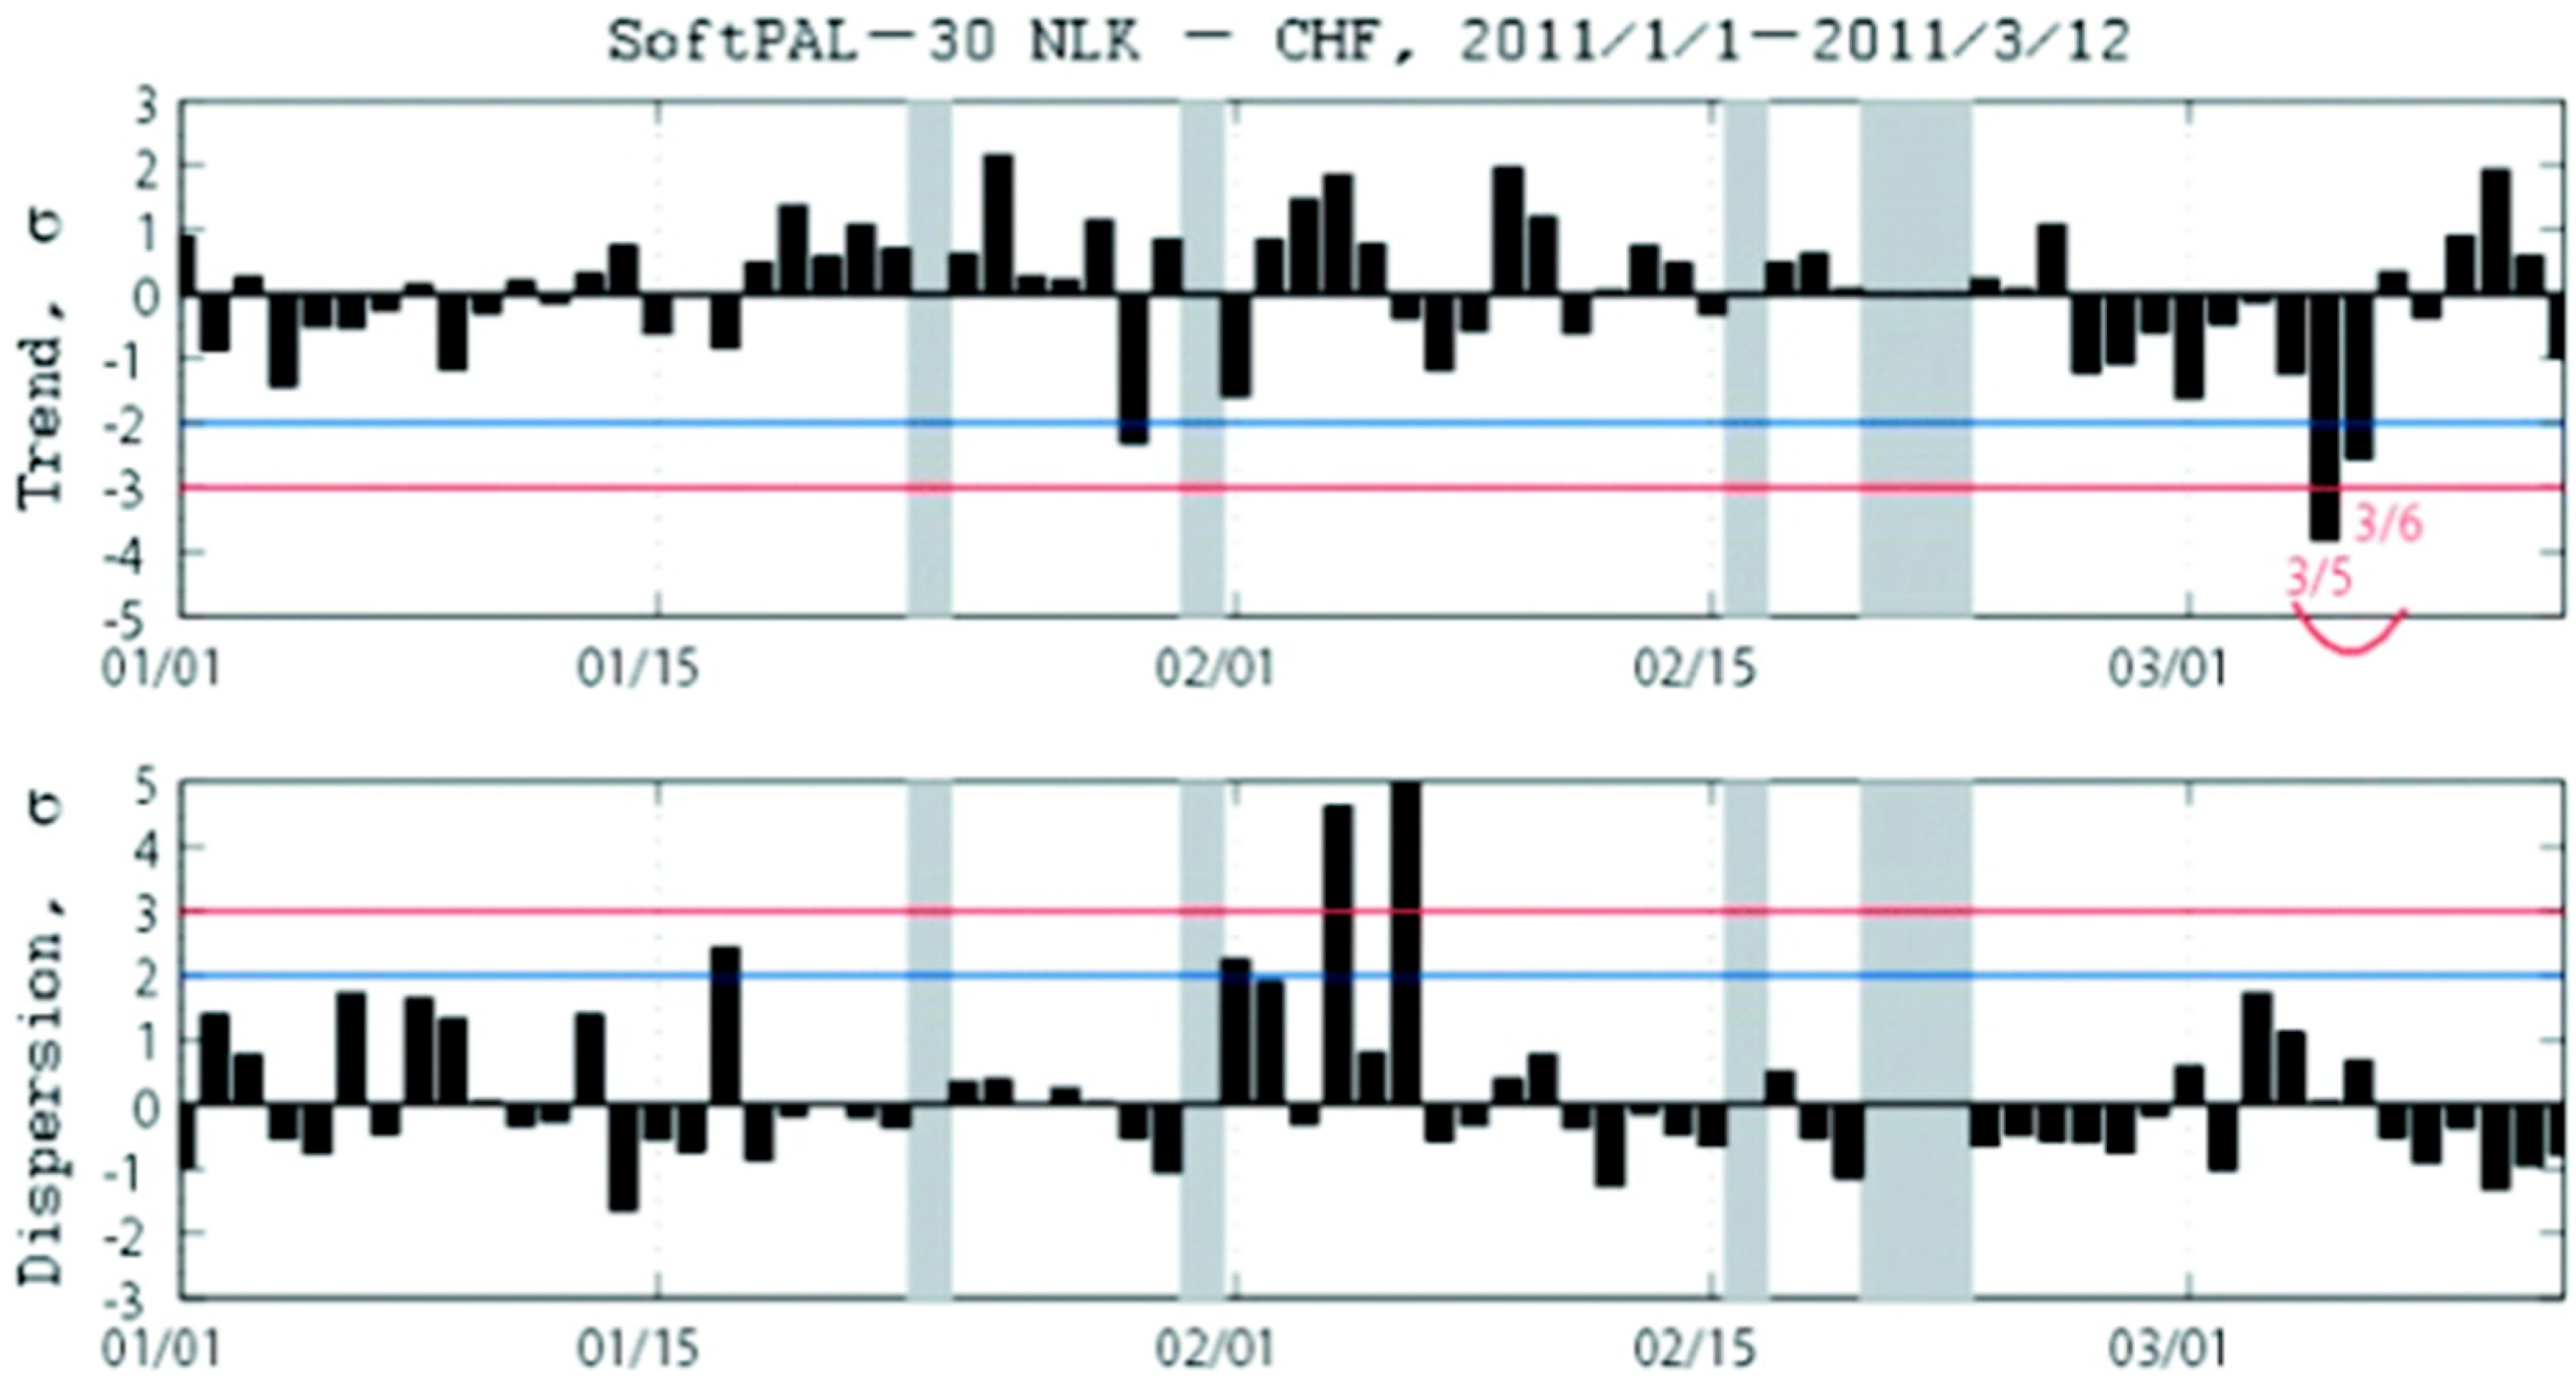
The definition of nighttime is quite complex for east–west long-distance propagation from the American NLK transmitter to Japanese stations such as Chofu (CHF). By considering the sunrise and sunset times at both the transmitter and the observatory (i.e., terminator times [20]) and examining the actual diurnal variations along the NLK-CHF path, we adopted universal time (U.T.) from 10 to 12 h as the nighttime period for this path—only during this time is the propagation path completely in darkness. Figure 15 indicates that the paths from Japanese stations (CHF, KSG, and KCH) to the American transmitter NLK are well-positioned relative to the EQ epicenter. Notably, the NLK-CHF path passes just above the epicenter. The other paths from NLK to KSG and from NLK to KCH are also favorable for observing any corresponding ionospheric disturbances. Based on these considerations, we present only the CHF results: the temporal evolution of propagation characteristics along the NLK-CHF path from 1 January to mid-March is shown in Figure 16. In the figure, two physical parameters are plotted: from top to bottom, the trend and dispersion, both normalized by their respective standard deviations. Focusing on the trend in the top panel of Figure 16 for the key propagation path from NLK to CHF from 1 January onwards, we find that the trend does not drop below −2σ during the entire period, except on 29 January and during the significant anomalies on 5 and 6 March. The anomaly on 5 March features a sharp decline in trend (exceeding −3σ and approaching −4σ), accompanied by nearly simultaneous increases in dispersion (approaching +2σ). Although not illustrated, we also note additional observations at other stations. An obvious anomaly is seen along the NLK to KCH propagation path, with the trend parameter experiencing a significant drop to −2σ. Conversely, the anomaly along the NLK to KSG path on 5 and 6 March is less pronounced; nevertheless, the response to this EQ remains clearly evident.

6. Scientific Topics and Underlying Physics as Studied with VLF/LF Information

6.1. LAIC Channels

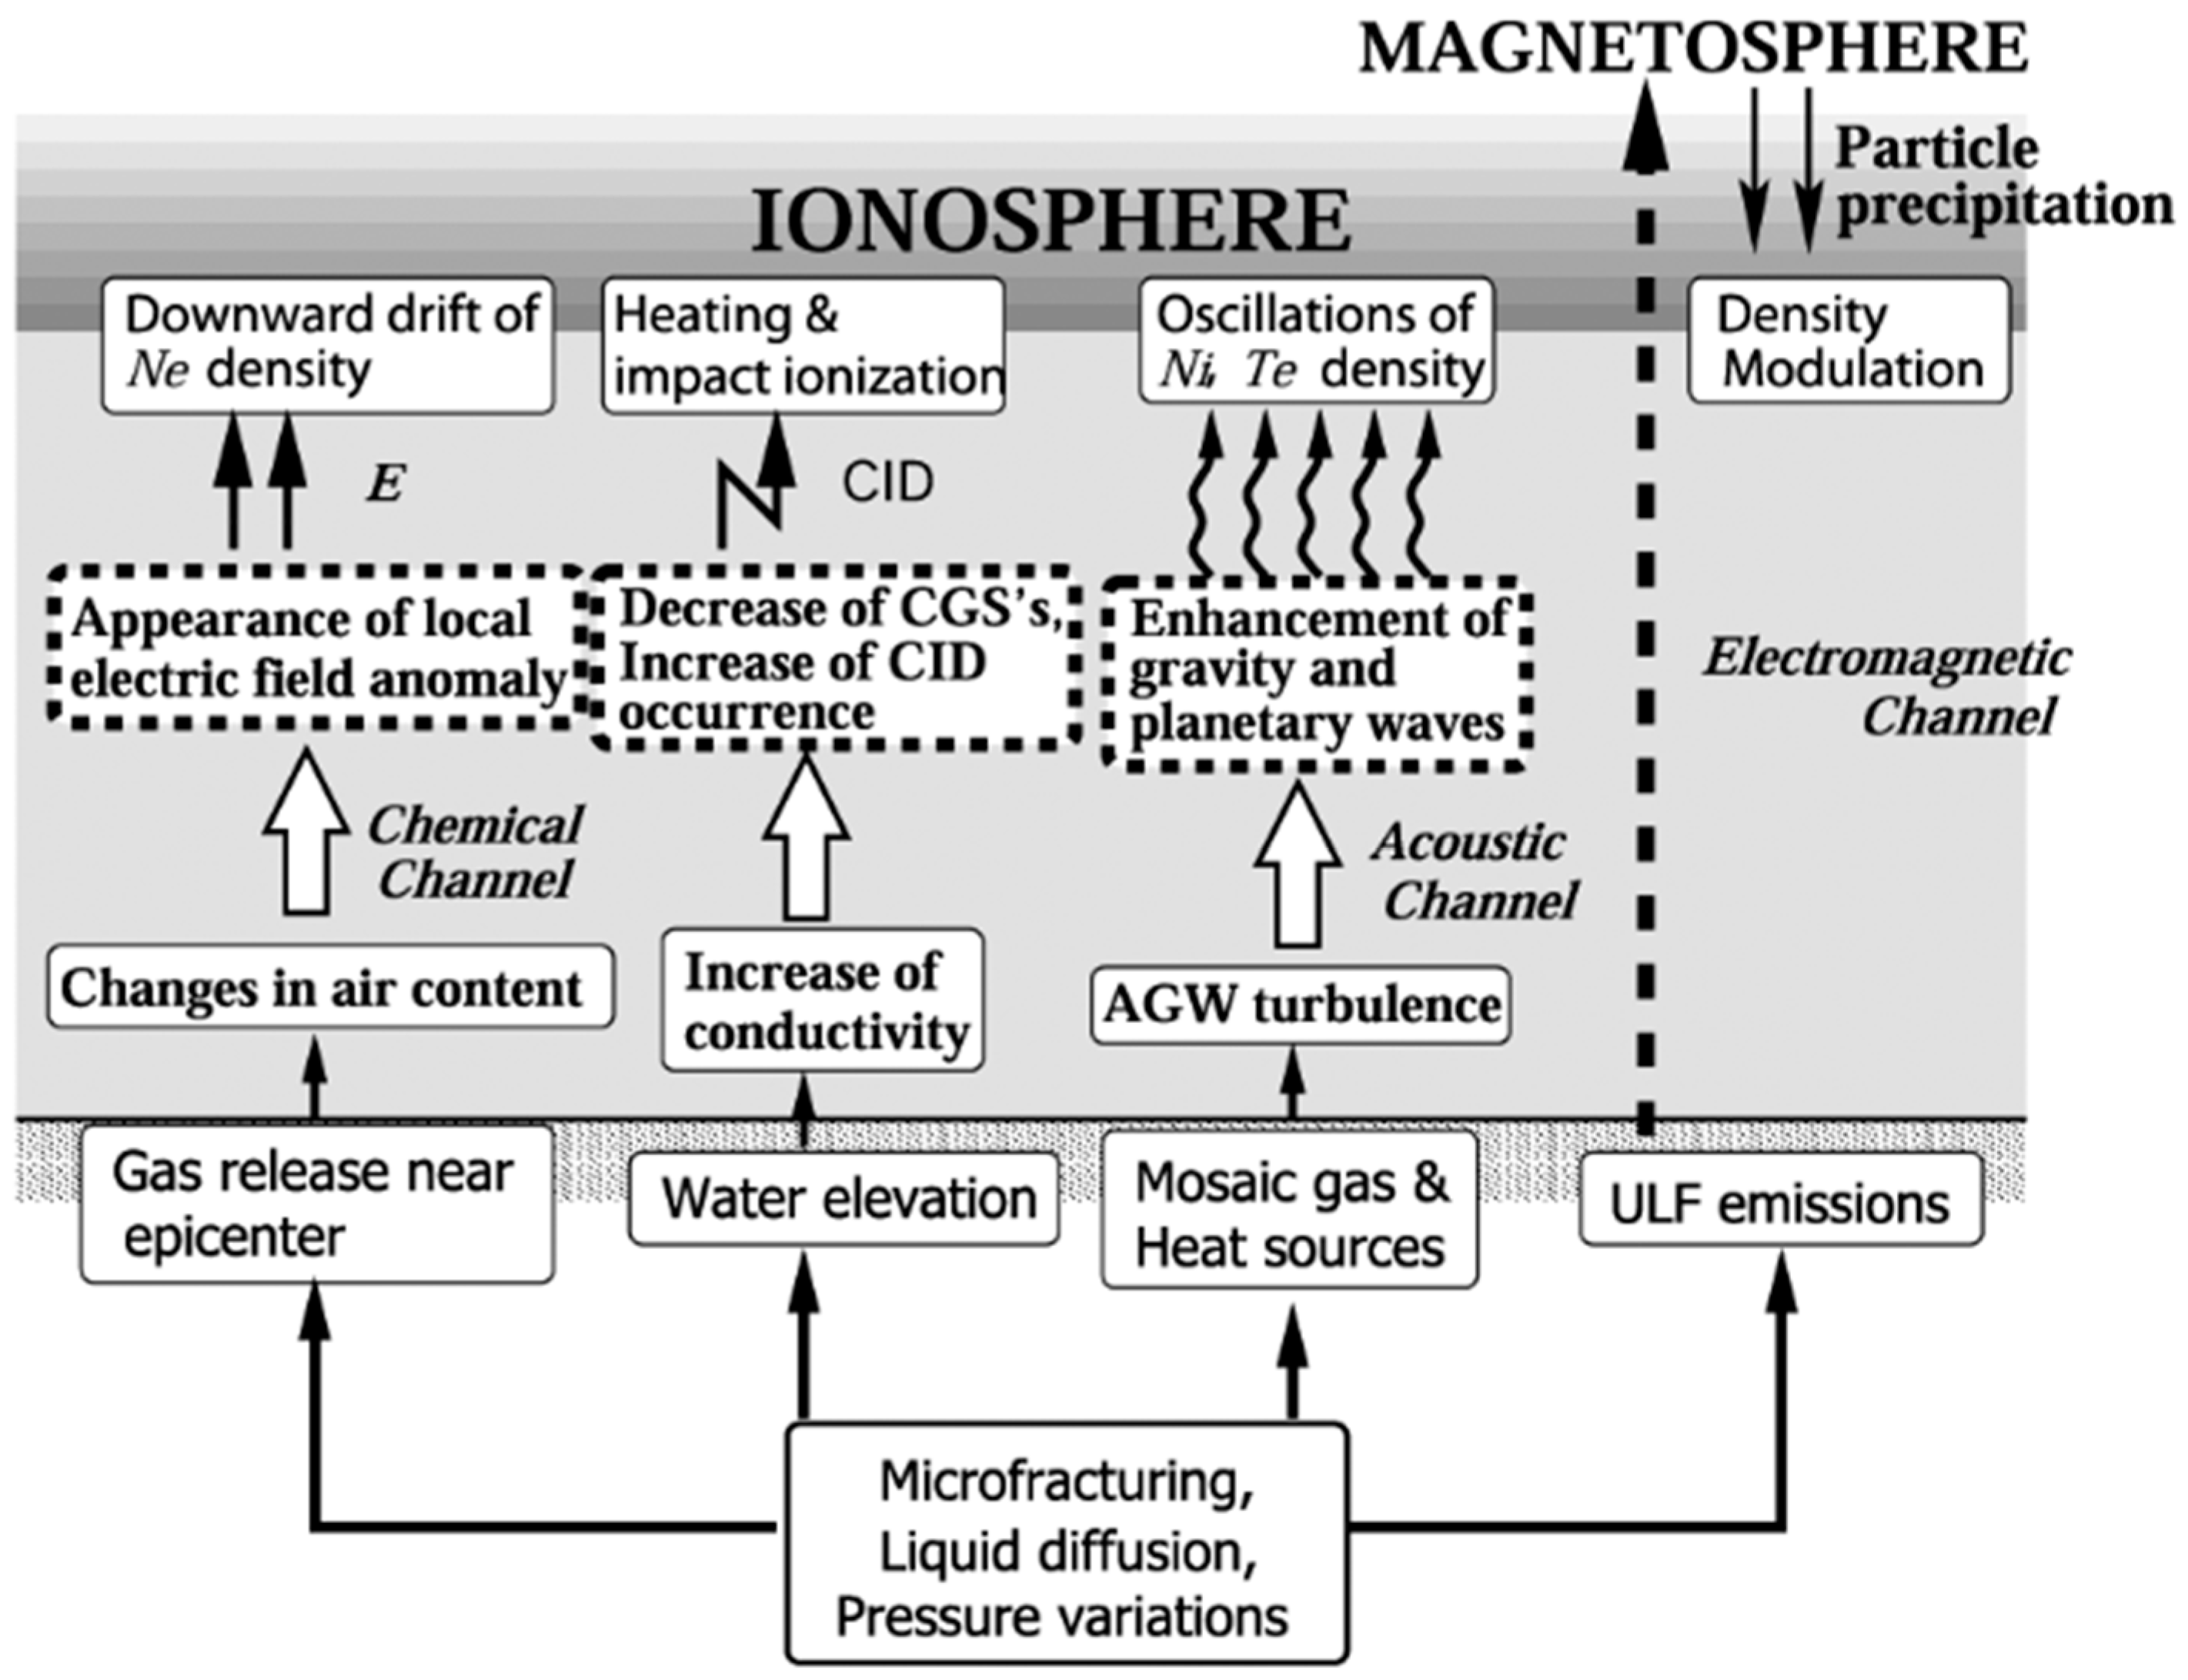
Although it is highly likely that the ionosphere is disturbed before an EQ, the specific physical mechanisms by which seismic activity in the lithosphere perturbs the ionosphere remain poorly understood. About 20 years ago, Hayakawa et al. (2004) [32] proposed several hypotheses on the coupling mechanisms between lithospheric activity and the ionosphere: (1) chemical channel, (2) acoustic channel, (3) electromagnetic channel, and (4) electrostatic channel. Figure 17 illustrates the schematic diagram of these three coupling channels, excluding the last one that was proposed after the publication. The first channel involves geochemical quantities, such as surface temperature and radon emanation, which induce changes in atmospheric conductivity, subsequently affecting the ionosphere through atmospheric electric fields (e.g., [105,106]). The second channel emphasizes the role of atmospheric oscillations in the LAIC. Perturbations such as temperature and pressure changes in seismo-active regions excite atmospheric oscillations that propagate upward to the ionosphere, causing density perturbations [4,22,93,107] based on established propagation theories [108,109,110]. The third electromagnetic channel involves radio emissions generated in the lithosphere that propagate upward, modifying the ionosphere through heating or ionization, though this mechanism is considered insufficient due to the weak intensity of lithospheric radio emissions [111]. The fourth channel, based on laboratory experiments showing the generation of positive hole carriers in stressed rocks [112,113], is not shown in Figure 17. Currently, the first and second mechanisms are regarded as the most likely candidates for coupling. Pulinets et al. [75,105] identified the second chemical channel as the most promising for ionospheric perturbations related to EQs, with radon emanation suggested as a key agent. However, there is little observational evidence supporting this hypothesis. No studies have directly linked radon emanation to ionospheric disturbances, though radon has been reported as a precursor to EQs [4]. It remains poorly understood whether radon emanation causes ionospheric perturbations or how this might occur. For instance, Sorokin et al. (2020) [114] proposed that emanated charged particles generate an electromotive force (EMF), creating external currents that facilitate electric field penetration into the ionosphere. Few studies have examined correlations between surface phenomena (such as SLHF and OLR) and ionospheric disturbances observed through VLF/LF subionospheric perturbations [46]. Over the past decade, the LAIC channels have been extensively investigated using satellite-based observations of in situ ionospheric parameters (like electron density and magnetic fields) and surface/atmospheric data (such as surface temperature, SLHF, OLR, etc.) [115,116,117,118,119,120,121,122,123,124,125,126,127,128,129,130,131]. Most research, apart from ours, focuses on data at satellite altitude (~600 km or 500 km) and near-surface levels. Consequently, the LAIC channel remains inferred in the intermediate regions, such as the lower ionosphere and stratosphere, limiting understanding. Recently, Hayakawa and Hobara (2024) [132] and Chen et al. (2024) [133] highlighted the importance of data on perturbations in the lower ionosphere, as detected by VLF/LF propagation, and in the upper atmosphere, including the stratosphere, for better understanding of LAIC mechanisms.
Based on the above studies, Hayakawa and Hobara (2024) [132] have identified two possible channels, (i) the fast channel and (ii) the slow channel, which may indicate different LAIC mechanisms. The fast channel is characterized by the observation that ionospheric perturbations occur almost simultaneously (on the same day) with surface perturbations in the lower atmosphere. Conversely, the slow channel is characterized by ionospheric disturbances occurring after a certain time delay (such as a few to five days), similar to diffusion processes. Further extensive research is essential to understand the physics involved in these two channels: what are the fundamental physical differences between them?

6.2. Slow Fluctuations in VLF/LF Amplitude and Phase: AGWs

Compared to the first chemical channel, there has been a substantial accumulation of indirect evidence supporting the second channel (due to atmospheric oscillations) within the LAIC mechanism using VLF/LF subionospheric data. The results derived from these VLF/LF data clearly provide us with information occurring in the ionosphere, and in this context, the information is not as direct.
We need to highlight some important papers on this topic by Molchanov et al. (2001) [22] and Miyaki et al. (2002) [107]. We identified convincing seismic signatures in terminator time variations in Section 3.1; fluctuations with periods of a few to 20 days for several large EQs [134,135]. The mechanisms behind such influences (of planetary waves) are not yet entirely clear, and we have suggested that near-ground atmospheric wave intensification, likely during the EQ process, occurs about 1–2 weeks around the main shock. Our arguments are based on the analysis of dynamic periodograms, as shown in Figure 3. If the wavelets are indeed associated with seismic perturbations, then the main challenge for the explanation is the time delay between the peak of the EQ process (the moment of the main shock) and the wavelet center. This delay appears to be several days. However, the upward transport of planetary wave energy is very slow (with a theoretical group velocity of less than 0.05 m/s), and the expected transport time from the bottom of the atmosphere to the lower ionosphere exceeds 20–30 days. Therefore, we must hypothesize that planetary wave oscillations are coupled with a faster carrier wave, such as AGW. This is plausible when considering the nonlinearity of the equations describing atmospheric processes. For simplicity, we consider that some amplitude-modulated AGWs have appeared in the troposphere, with the following temporal dependence of density variation:
N t ( t ) = u g t + A t m s i n Ω m t s i n ω g t + φ z , t ,
where ugt is the amplitude of tropospheric AGW (frequency ωg); and Atm is the amplitude of planetary wave in the troposphere (frequency Ωm). If AGW wavelength is on the order of 100–300 km, which is comparable with the size of seismic perturbation above an epicenter, then AGW periods are approximately 20 min to 1 h, and their transport time into the lower-ionosphere region is about 1 day. Decoupling in the upper atmosphere is also possible. In a case of quadratic nonlinearity, the resulting amplitude of slow oscillation at the ionosphere boundary will be as follows:
N b = α u g t A t m s i n Ω m t + 1 / 2 A 2 t m   s i n 2 Ω m t ,
where α is the coefficient of nonlinear transformation. Assuming a decrease in height of planetary wave generation with period τ m = 2 π / Ω m and u g t A t m , we have finally the planetary wave component, as outlined below:
ε m u g t 2   A t m 2 / Σ N b i 2 ,
where the sum in the denominator is fulfilled over the power of all the planetary wave oscillations (i.e., planetary wave component) generated both in the troposphere and stratosphere. Thus, planetary wave intensity at the lower ionosphere could be correlated with AGW intensity near the ground influenced by seismic activity, even if the tropospheric planetary wave oscillations are not exposed to such an influence at all.
The main issue here is the assumption that seismic-related AGWs exist, despite the well-known propagation mechanism [108,109,110]. To examine this, Miyaki et al. (2002) [107] analyzed data from Chofu, involving subionospheric signals from a JJY transmitter (40 kHz) in Fukushima. The transmitter and receiver are about 220 km apart, making the sky wave slightly stronger than the ground wave at Chofu. The amplitude and phase of the LF signal were continuously recorded at Chofu, but only the amplitude data were used. For the fluctuation spectrum analysis, data were collected both during the day (0900-1314 LT) and at night (2152-0216 LT). The four-hour window was chosen to avoid seasonal terminator effects. The analysis method matched the periodogram used earlier. Although not shown, the data indicated significant increases in fluctuation power within the AGW period range (about 10 min to 2 h) from mid-October 1999 to 2 January 2000, coinciding with heightened seismic activity. There was a quiet period until mid-February 2000, followed by an increase in fluctuation spectra approximately ten days before the EQ on 4 March 2000. It seems that amplitude modulation of AGWs, with periods around this timeframe, is observed near the EQ.
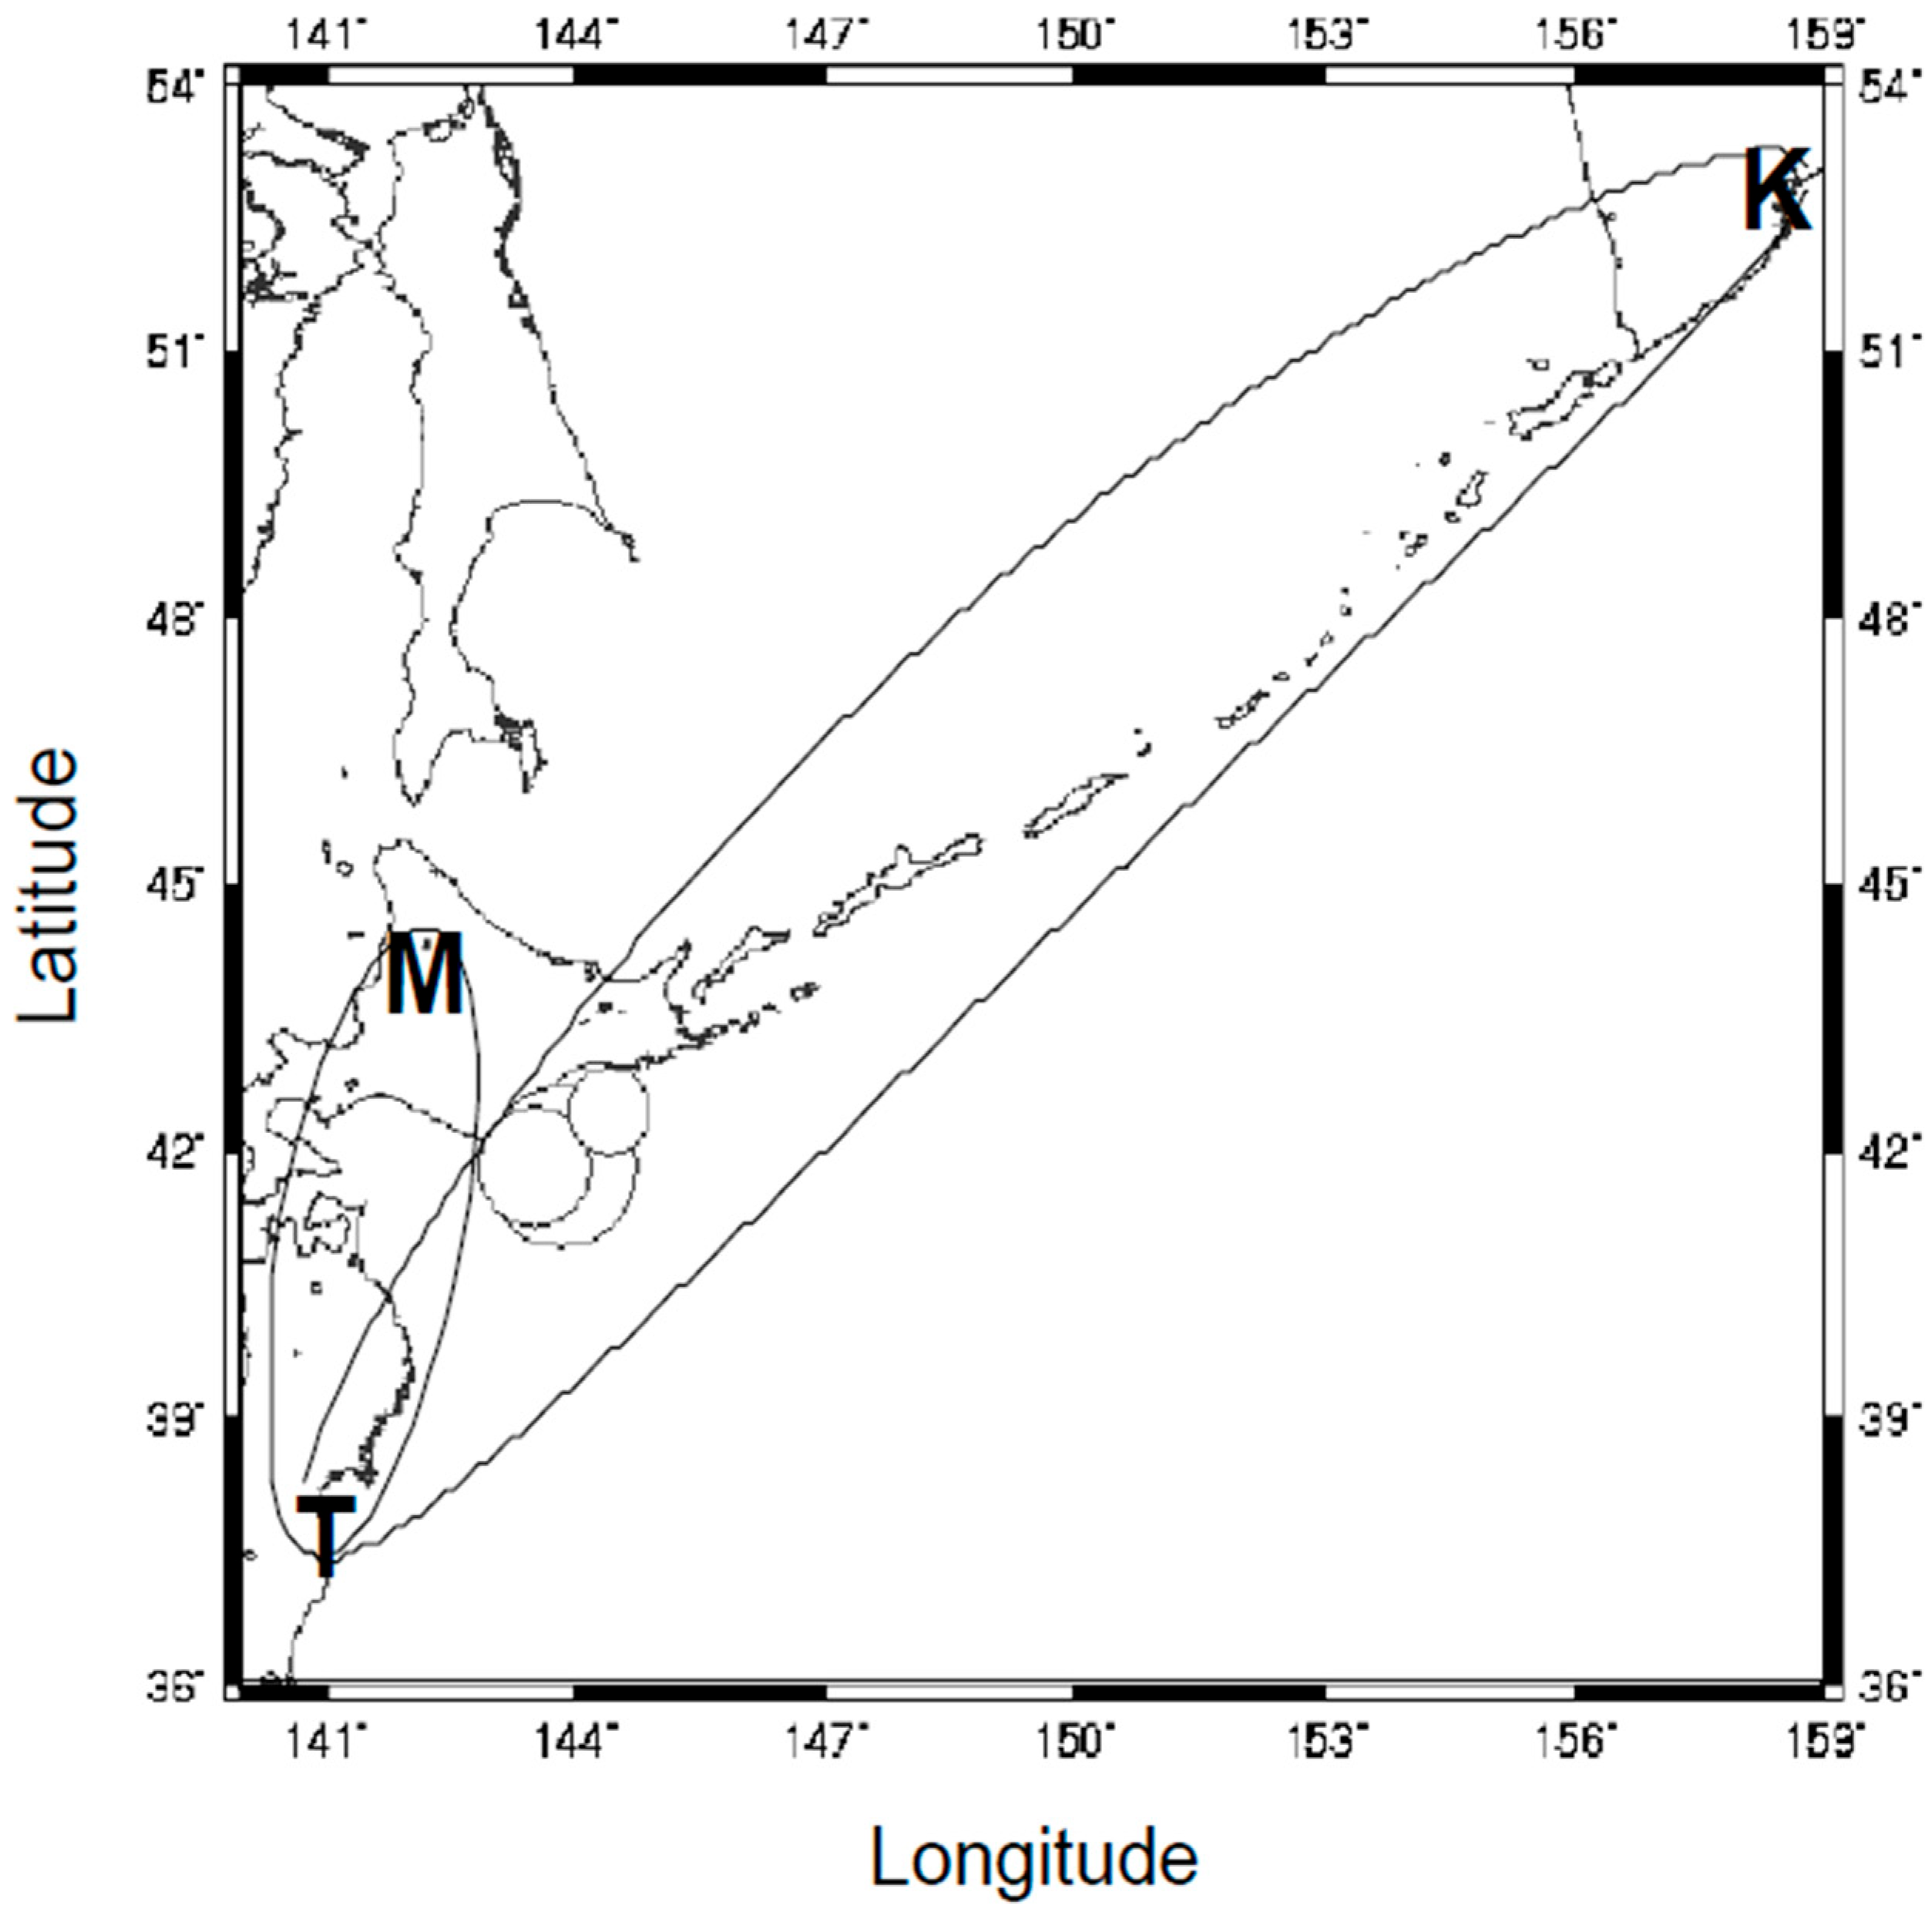
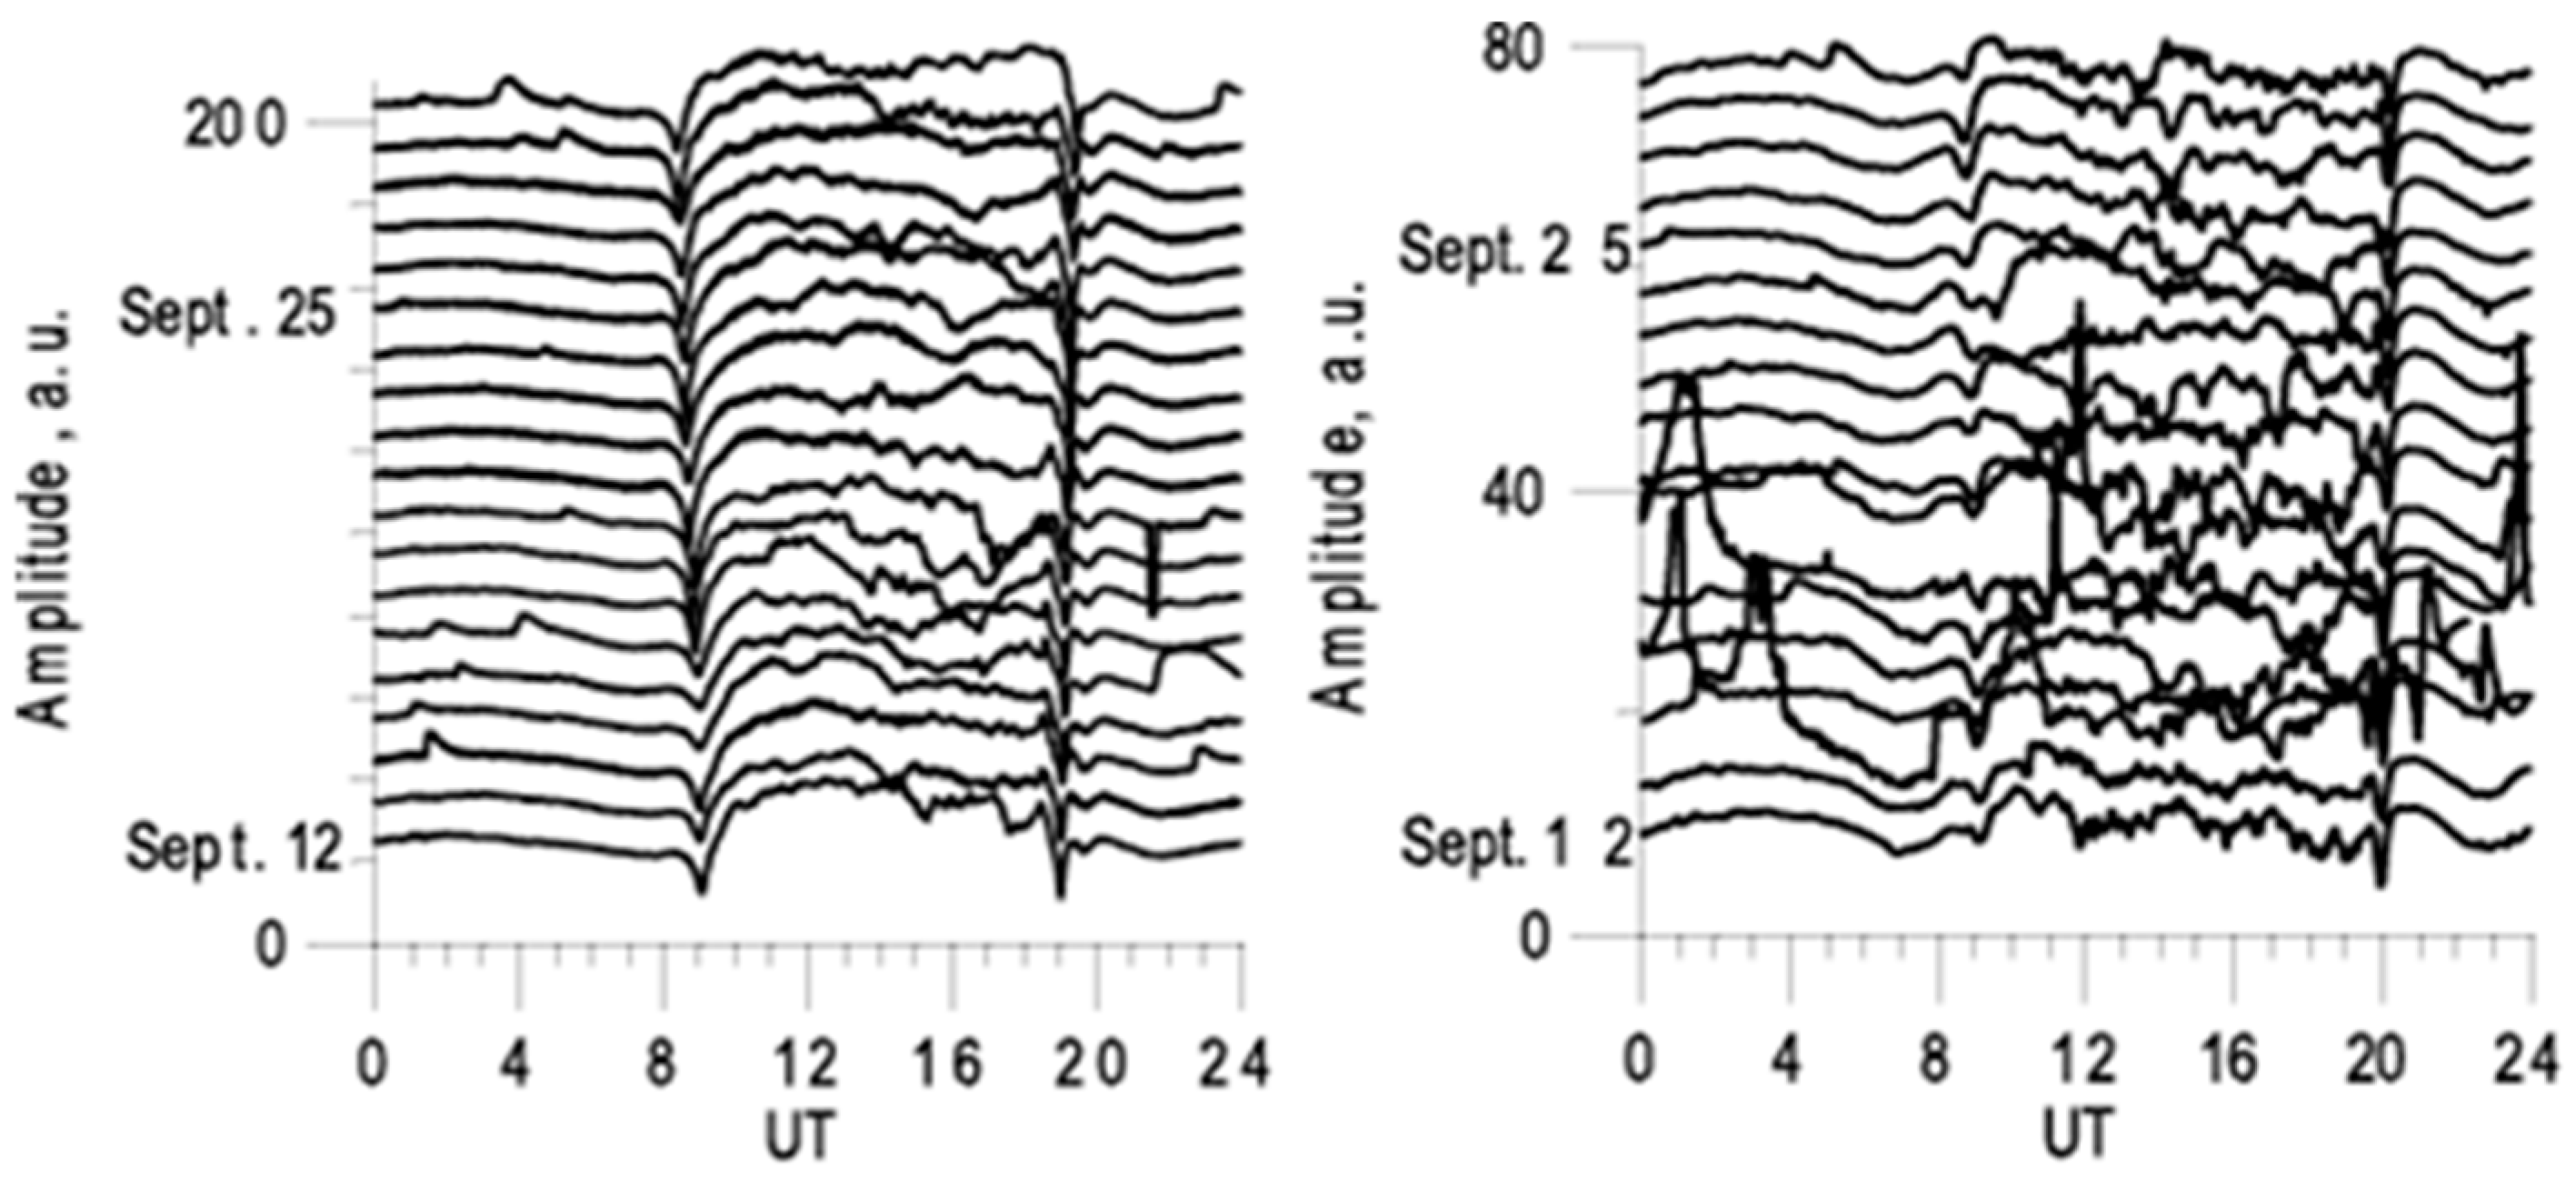
We present some recent additional results on the significance of AGWs in the LAIC: (a) a case study of the Tokachi-oki EQ (25 September 2003) [93], and (b) a statistical study [136]. First, we show the results for a larger EQ that occurred in Japan, called the “Tokachi-oki EQ“, which took place on 25 September 2003 off the coast of the Tokachi area in Hokkaido with a magnitude of 8.3. In the paper by Shvets et al. [93], they analyzed fluctuations (and fluctuation spectra) in the VLF amplitude and phase, focusing on the potential role of atmospheric oscillations in the LAIC (with several possible coupling channels previously suggested). Specifically, we examined the fluctuation spectra in the frequency range of AGWs, roughly 10 min to a few hours, during nighttime, and correlated these with EQs [93]. Two different propagation paths from the Japanese LF transmitter (JJY, 40 kHz) were analyzed: one to the observing station in Kamchatka, and another to Moshiri (as shown in Figure 18). The relative locations of the receiving stations (M for Moshiri and K for Kamchatka), the transmitter (T for JJY), and the epicenters of rather big EQs (marked by white circles) are displayed in Figure 18. Figure 19 depicts the daily variations in amplitude at both observatories around the date of the Tokachi-oki EQ.
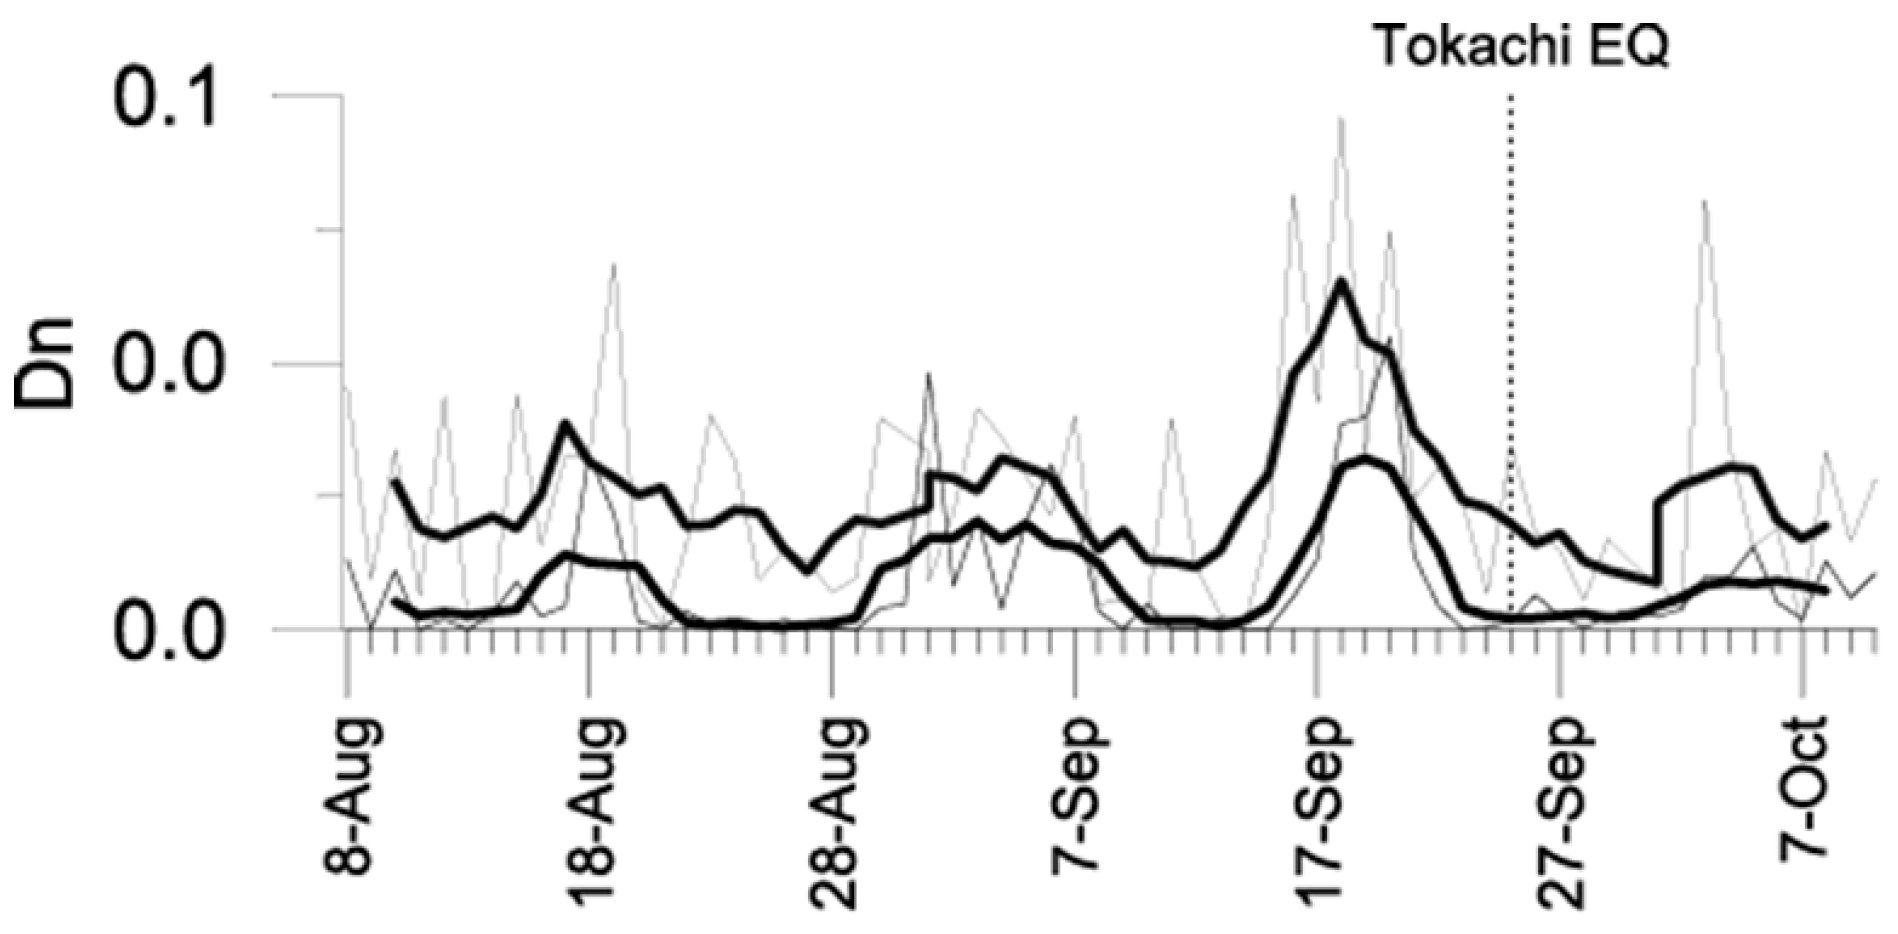
It is clear from Figure 19 that we recognize strong fluctuations during the night period at both stations (M and K) before the EQ. In order to emphasize more clearly the signal fluctuations in the differential quantity A ( t ) A (where A is the average in amplitude over a few days, and A ( t ) is the current amplitude), we plotted the intensity integrated over the period interval from 10 min to 3 h (this is the frequency range of AGW) in Figure 19. This figure indicates that the signal fluctuation in the AGW frequency range is extremely enhanced before the EQ. Also, we have observed synchronous intensification of quasi-periodical 16-day (planetary wave) variations at both stations before the EQ, as shown in Figure 20, which will provide us with a crucial role of planetary waves in the LAIC process. The most substantial deviations observed as a rule were depletions of signal amplitude, probably connected with an increase in loss in the ionosphere due to the enhancement of turbulence. This is due to dissipation at the lower ionospheric height.
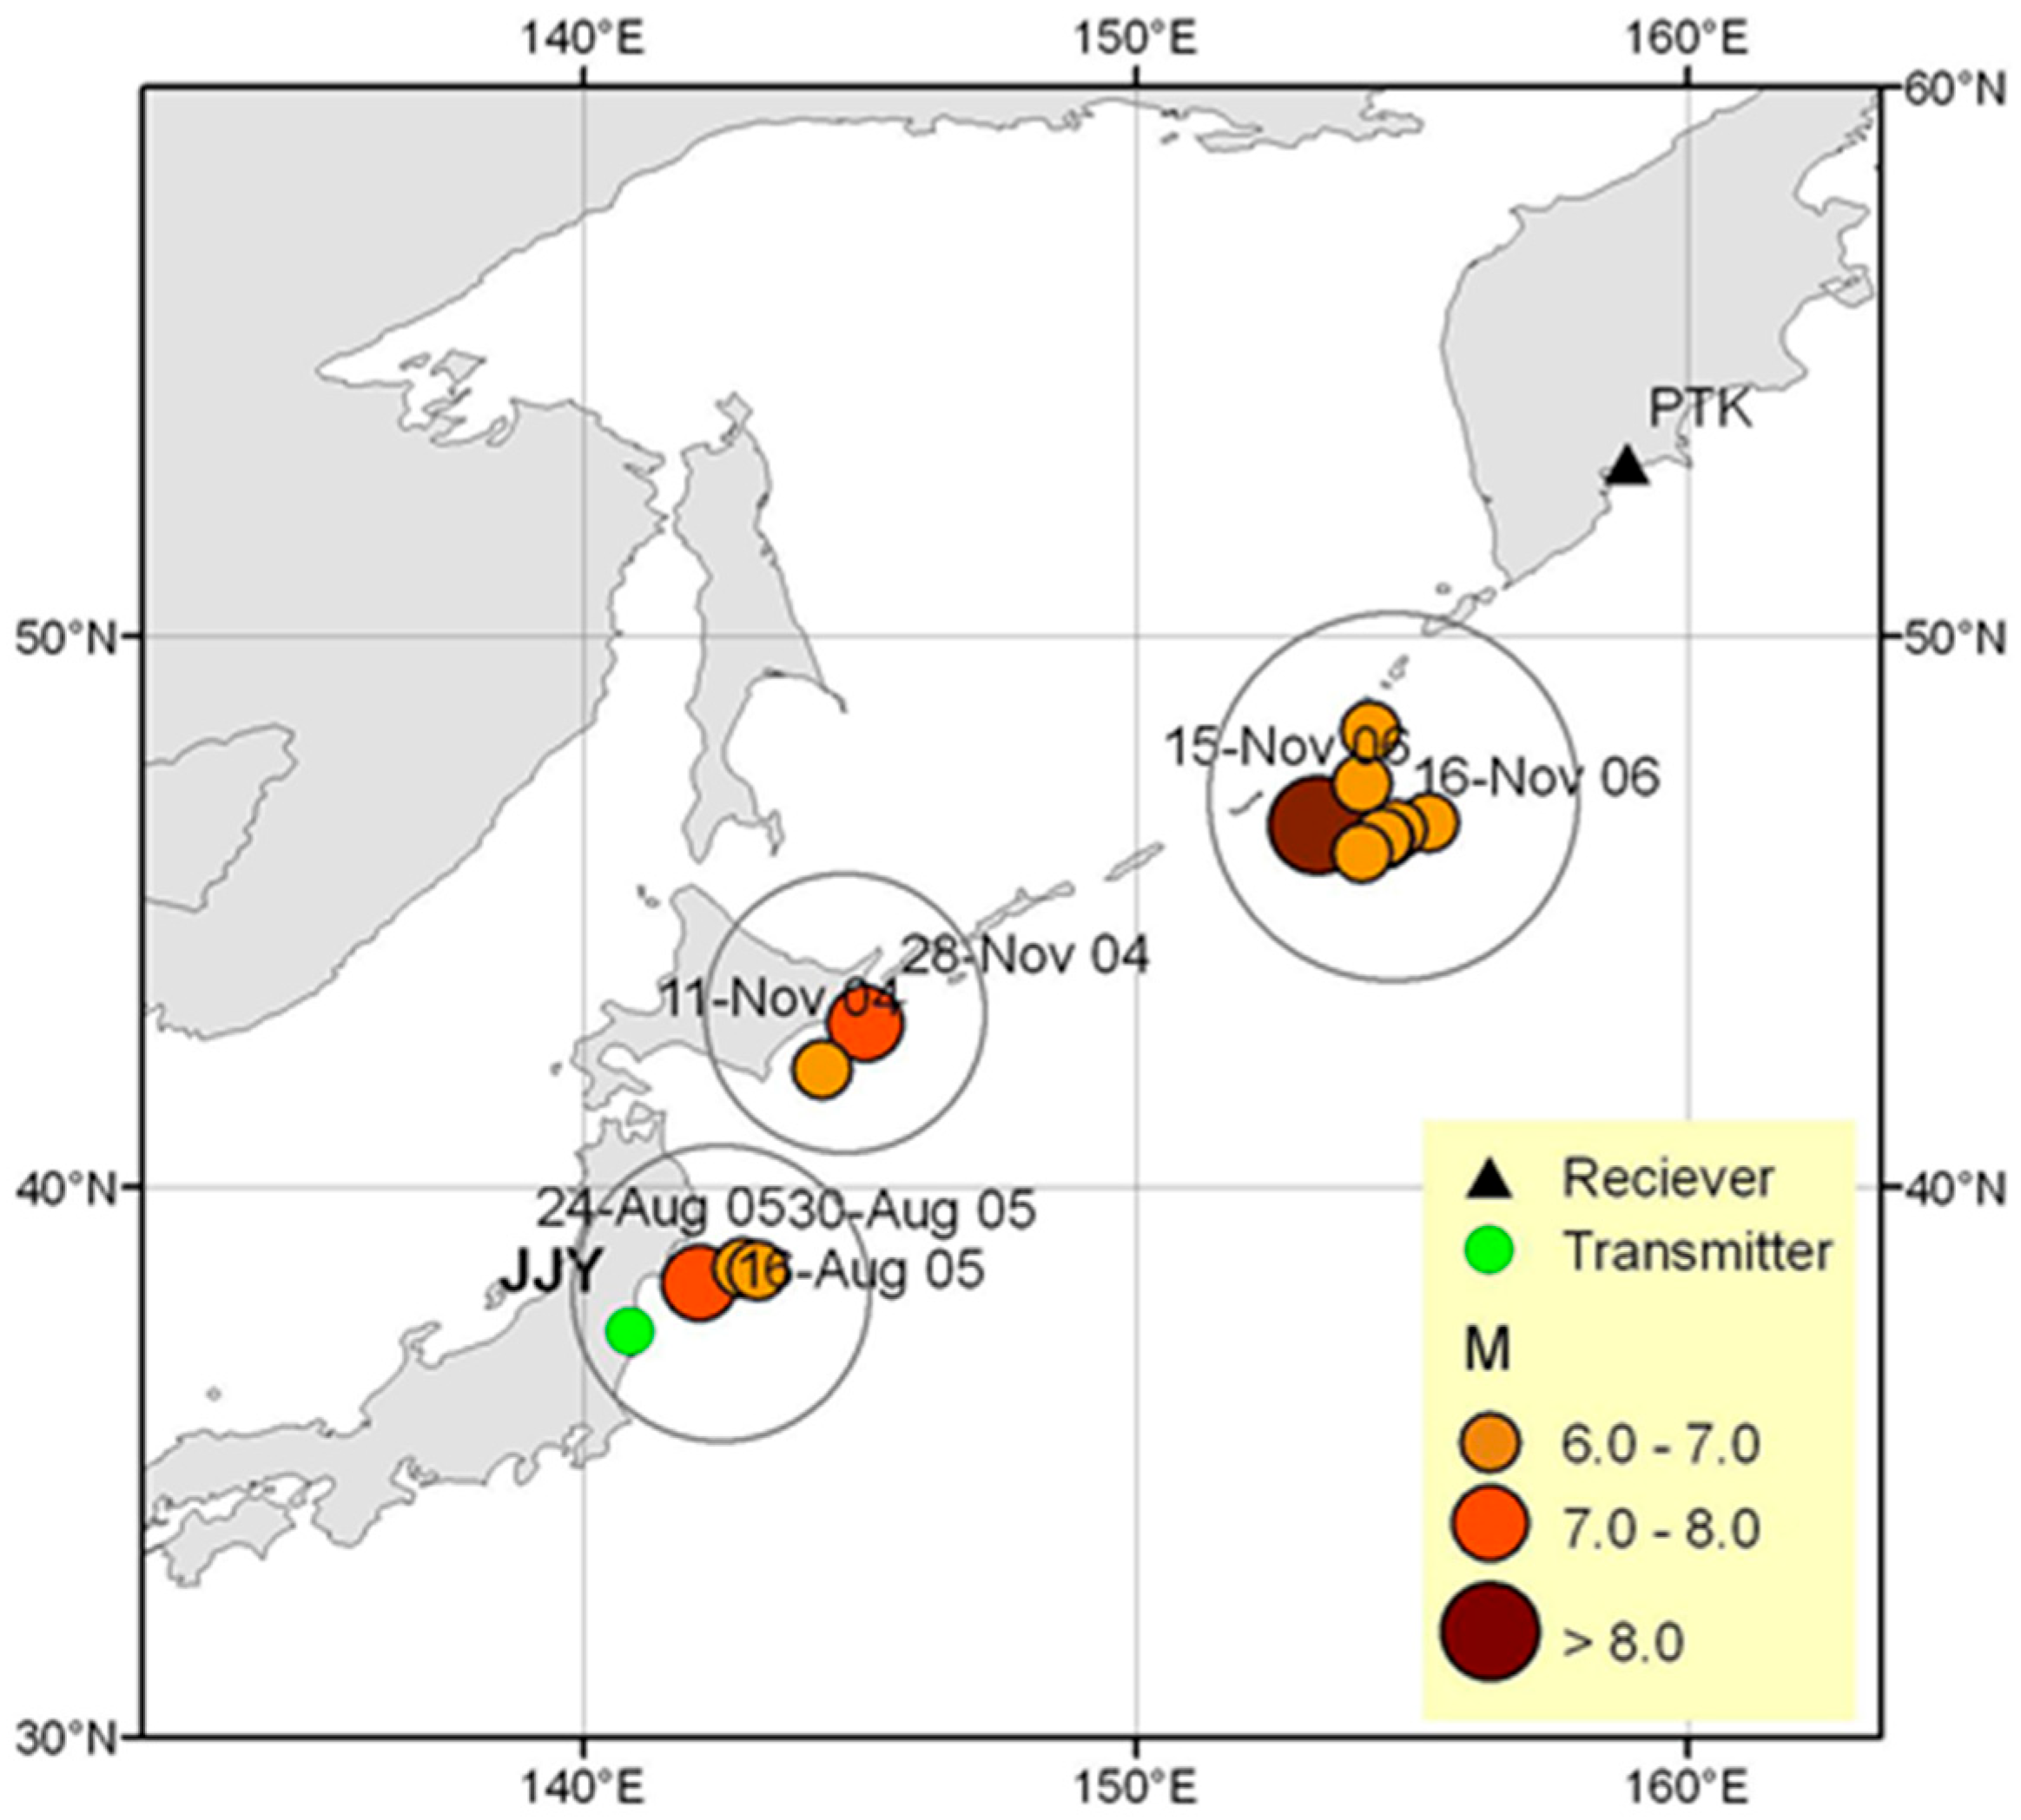
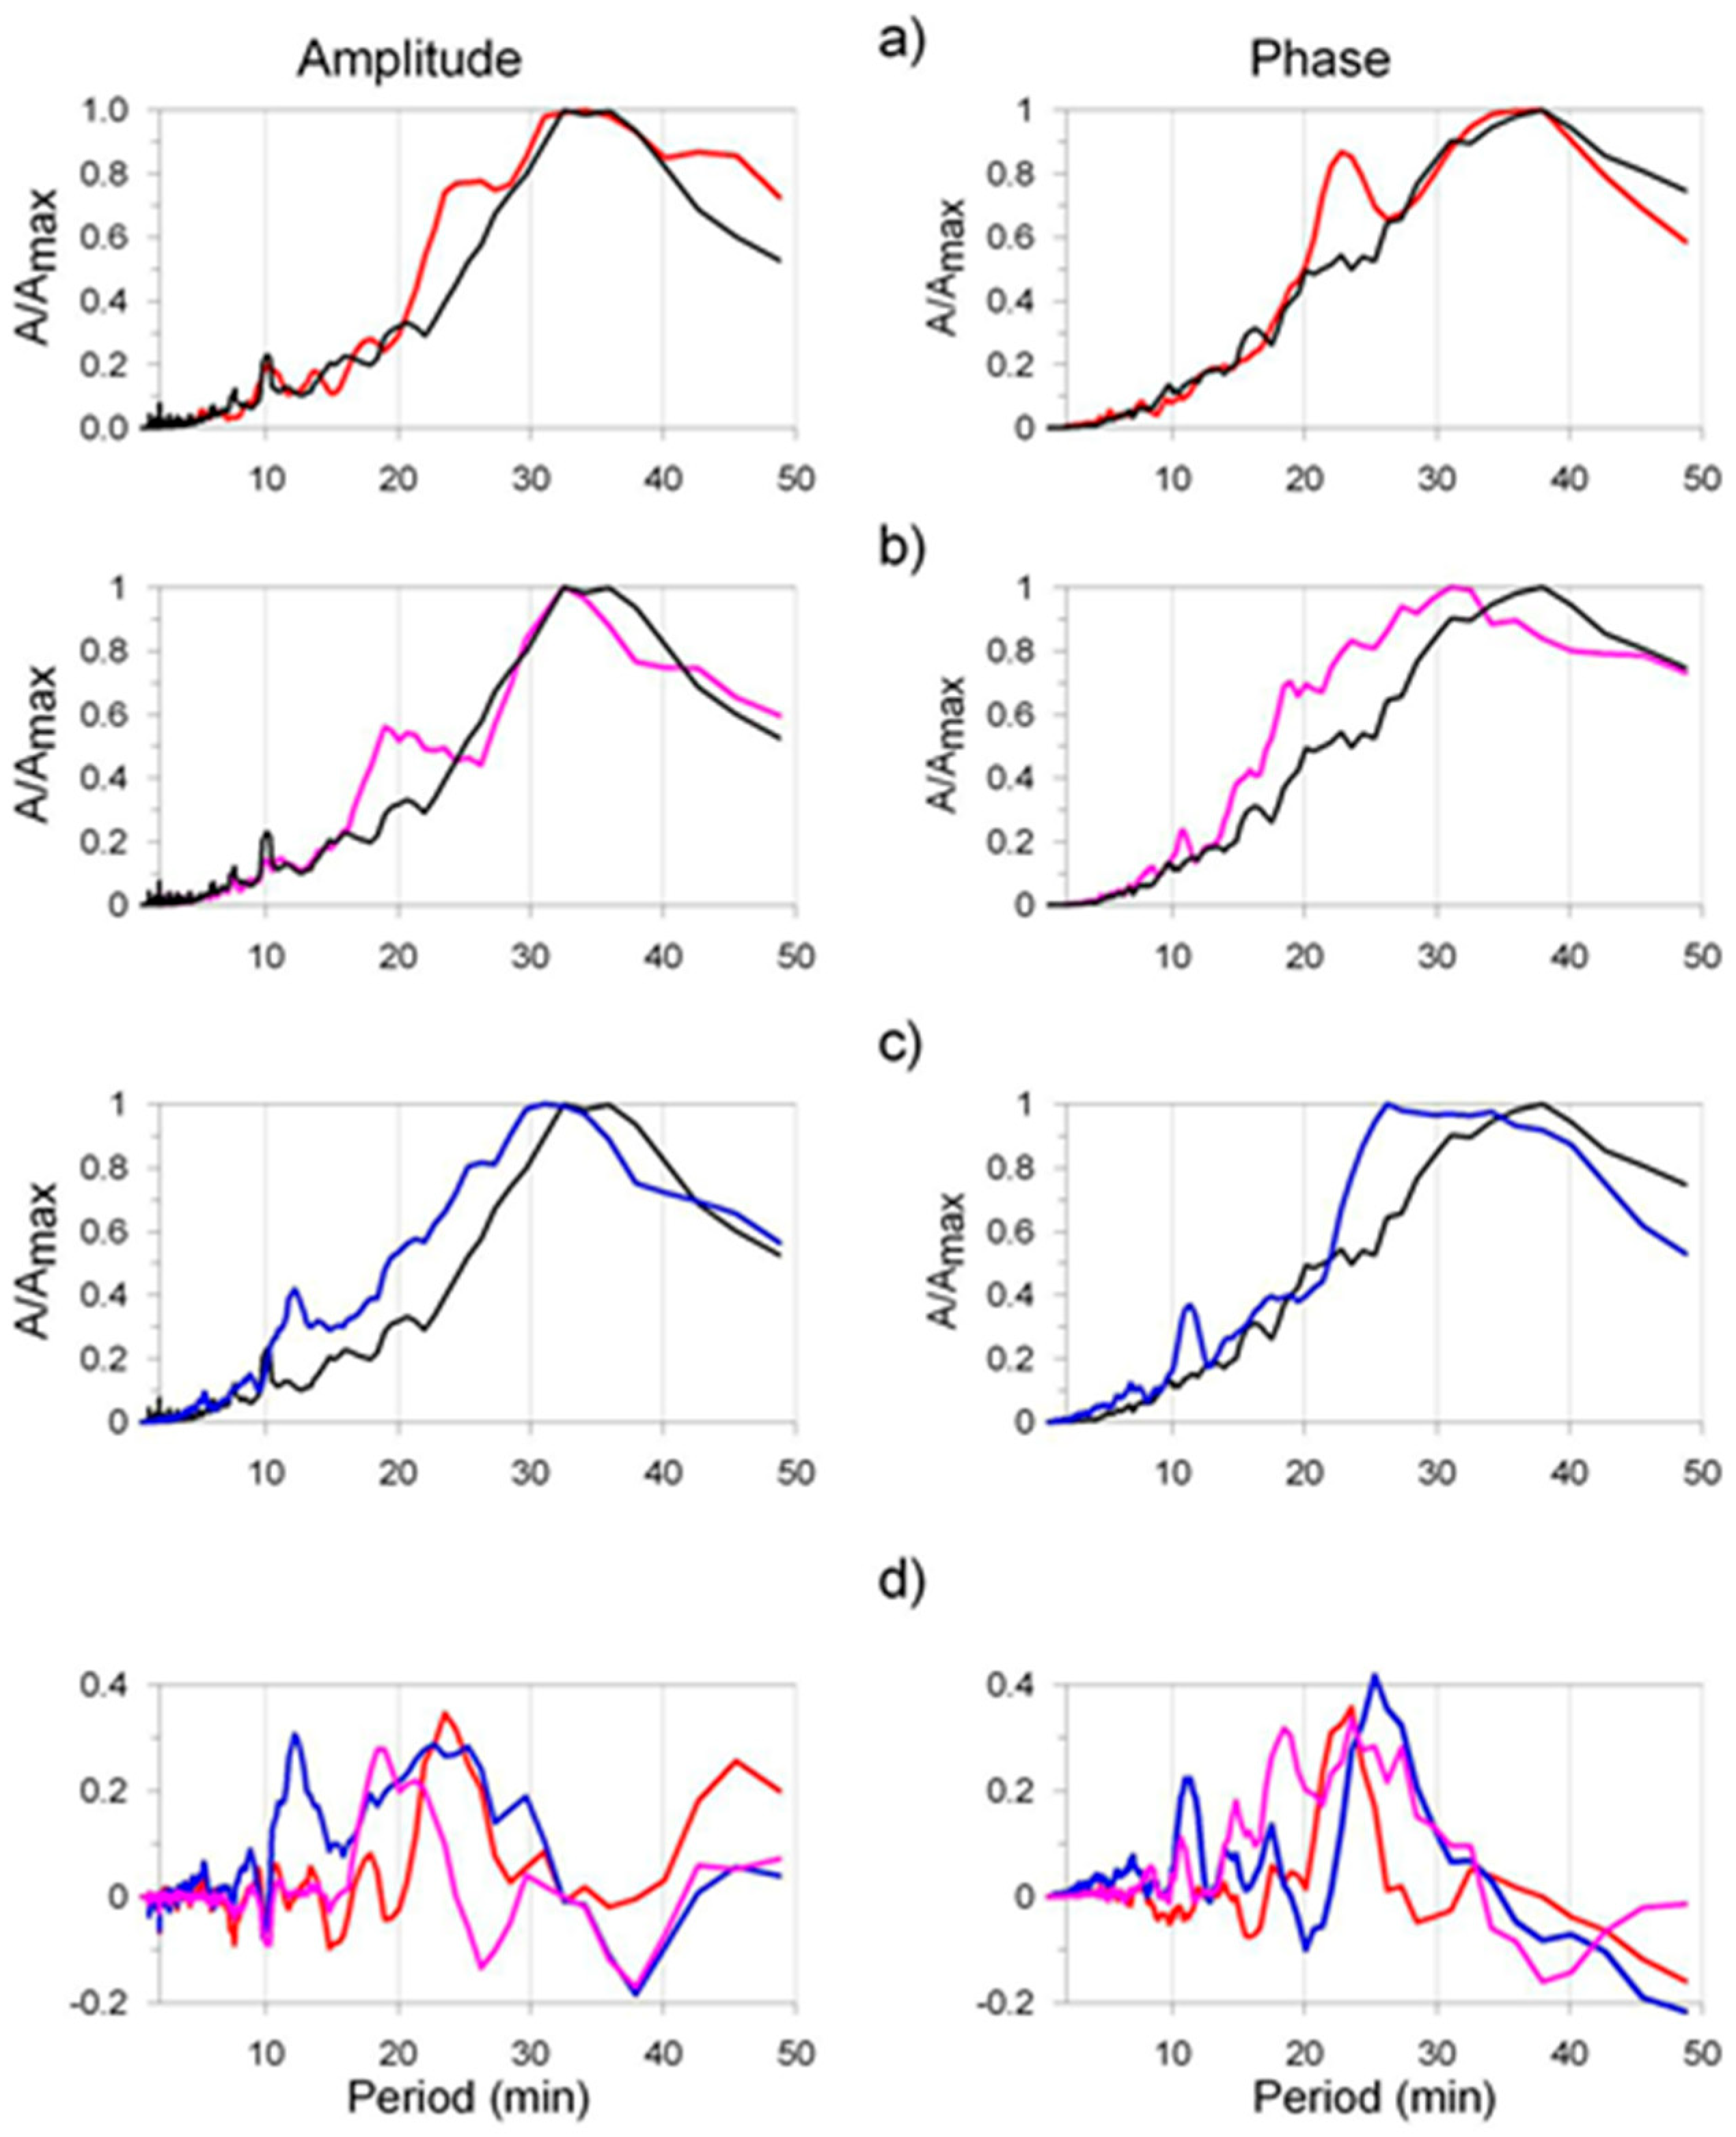
Next, we present another study by Rozhnoi et al. (2007) [134] on the statistical analysis of the AGW effect in VLF/LF signals. We used data from 2004 to 2006 along the same path from JJY Japan to Petropavlovsk–Kamchatka, Russia, as shown in Figure 21. The analysis focused on variations in LF subionospheric signal amplitude and phase during periods of seismic quietness and activity, including magnetic storms. After averaging over 20 s, the frequency range examined was 0.28–15 mHz, corresponding to periods of 1 to 60 min. Figure 22 shows the normalized spectra of amplitude (left) and phase (right) for three EQ series: (a) November–December 2004—red, (b) August 2005—pink, and (c) November 2006—blue. Black lines represent the average spectrum over 19 quiet days. Clear differences in spectral density between seismically active and quiet days are observed in this figure. Notably, spectral fluctuations in the LF signal changed several days before and after three large EQs—M = 7.1 in November 2004, M = 7.2 in August 2005, and M = 8.2 in November 2006—all within the Fresnel zone of the JJY–Kamchatka path. Comparing perturbed and background spectra revealed a significant increase in spectral fluctuation for periods between 10 and 25 min. Similar changes were not observed during magnetic storms. However, an unresolved issue remains: how are AGWs excited during seismic activity?
Rapoport et al. (2022) [135] recently studied quasi-wave oscillations in VLF signals with periods of 4–10 and 20–25 min, reinforcing prior findings. They also observed oscillation periods of 3–4 h, likely due to long-period gravity waves. Additionally, they calculated the information entropy in VLF signals, finding that entropy increases near sunset and sunrise with seasonal changes, and that solar flares also elevate information entropy.

6.3. Doppler-Shift Observation

To provide “direct” support for the presence of AGWs in the lower ionosphere and their significant role in the LAIC process, we conducted the first attempt to observe Doppler shifts of short-distance subionospheric signals from a Japanese LF transmitter JJY1 (40 kHz) at several stations in the Tokyo area [137]. The details of the Doppler-shift observational instrument are documented in [137,138]. As a preliminary analysis, Doppler shift data from JJY to the station in Machida (distance = 230 km) over five months in 2008 were analyzed, which indicated notable enhancements of Doppler shifts within the AGW range for two EQs, along with a further statistical correlation of Doppler shifts in the AGW range with large EQs.
The Doppler-shift observation of LF (f = 60 kHz) subionospheric signals from Saga (Kyushu), with the call sign JJY2, as detected at Chofu (CHF), has been used to explore the characteristics of ionospheric disturbances possibly linked to EQs [138]. The analysis covers a six-month seismo-active period from January 1 to June 30, 2009, focusing on six EQs with magnitudes over 5.0 (ranging from 5.1 to 5.8) that occurred within the wave-sensitive region of the JJY-CHF path. Results indicate that Doppler shifts are indeed observed at CHF, with clear enhancements in the frequency components associated with AGWs and acoustic waves (AWs) before each EQ. This finding supports the significant role of atmospheric oscillations in the LAIC mechanism and suggests that Doppler observations could be recommended as a valuable tool in VLF/LF research.

6.4. Imminent VLF/LF Precursor

As already summarized in Molchanov and Hayakawa (2008) [4] and Hayakawa et al. (2023) [139], there are two distinct types of VLF/LF precursors based on lead time: one is the short-term precursor (approximately a week), which is of our primary interest, and the other is an “imminent” precursor with a lead time of less than one day. Molchanov and Hayakawa (2008) [4] have identified potential candidates for imminent EQ precursors within general seismo-electromagnetic studies, such as ULF electromagnetic emissions, acoustic emissions, and others. Recently, a new candidate for an imminent precursor was proposed by Heki (2011) [140], Heki and Enomoto (2013) [141], and Iwata and Umeno (2017) [142], utilizing GPS TEC data. Heki et al. identified a TEC anomaly 40 min prior to the 2011 Tohoku (Mw9.0) EQ, and similar anomalies, whose amplitudes depend on EQ magnitude, were observed in the 2010 Chile EQ (Mw8.8), the 2004 Sumatra-Andaman EQ (Mw9.2), and the 1994 Hokkaido-Toho-oki EQ (Mw8.3). However, such anomalies are not present in smaller-magnitude EQs. Additionally, Iwata and Umeno detected the same pre-seismic anomaly for the 2014 Kumamoto EQ using more sophisticated signal analysis.
Although several studies have criticized the existence of these anomalies (e.g., [143]), the lower ionosphere’s much lower altitude compared to the F region responsible for TEC anomalies might make it easier to detect such imminent effects. Because the agent causing these effects must originate in the lithosphere, the question arises: can we identify these imminent precursors in VLF/LF propagation data?
Zhao et al. (2024) [136] investigated how the 2022 Sichuan Luding M6.8 EQ affected VLF propagation in Northern China. They monitored China’s LF time code (68.5 kHz) signal at Xi’an Science Park, 650 km away. The researchers observed that on four days—two before and two after the EQ—the signal amplitude showed notably more fluctuations than on other days. They also found that the amplitude began decreasing approximately 60 min before the quake and gradually recovered around two hours afterwards, indicating a potential EQ precursor in VLF/LF data. Further research is needed to confirm these VLF/LF imminent precursors.

6.5. Fast Fluctuations in VLF/LF Amplitude

Nina et al. (2021, 2022) [144,145] and Nina (2024) [146] extensively studied the “noises”—rapid fluctuations—in VLF/LF signal amplitude and phase using recordings with a high temporal resolution of 0.1 s. While this sampling rate is notably higher than usual in seismogenic VLF research, it is quite common in space Trimpi studies [14,15,147]. The VLF signal, transmitted from the Italian station ICV, is received in Belgrade, Serbia. This high temporal resolution has enabled the identification of a new potential EQ precursor observed in both the time and frequency domains. Analyzing a one-month period from 26 October to 2 November 2016, during a time of heightened seismic activity in Central Europe, revealed significant changes or reductions in amplitude and phase occurring minutes to tens of minutes before an EQ. This could represent a new, promising imminent EQ precursor, warranting further investigation with more event studies.

6.6. A New VLF Network and Design of New VLF Receivers

We have already shown the existing VLF/LF networks in Japan, Europe, and other regions. In addition to these regional networks, here we present a new proposal by Galopeau et al. (2023) [148] for a global VLF/LF network aimed at detecting electromagnetic precursors of EQs. The system includes a monopole antenna with a preamplifier, a GPS receiver, and a recording device equipped with ultra-msk software. This setup will provide continuous real-time measurements of amplitude and phase, along with daily recordings of VLF/LF data. The first implementation was established in Graz, Austria. The second will be in Guyancourt, France; the third in Réunion, France; and the fourth in Moratuwa, Sri Lanka. They also plan to expand this network worldwide for better global monitoring and increased coverage.
Malkotsis et al. (2022) [149] introduced a new VLF/LF receiver. Specifically designed for studying local ionosphere disturbances caused by events like EQs, volcanoes, and typhoons, it enables monitoring multiple subionospheric propagation paths. However, hardware capable of wide-band VLF/LF reception from various transmitters is rare or hard to reproduce, and the software is mostly proprietary. To offer a cost-effective, easy-to-assemble solution for researchers, they proposed a VLF/LF receiver based on open-source amateur radio hardware and software. Its main components include the “mini-whip” active antenna and free programs “SpectrumLab” and “GPS2Time.” The article provides complete hardware schematics and all software settings for this receiver. To validate reliability, two nearly identical receivers were deployed in Attica, Greece, in June and September 2021. Examples of ionospheric disturbances caused by solar flares, EQs, and magnetic storms demonstrate the setup’s capability to deliver dependable data for ionospheric research. This kind of development of a more sophisticated VLF/LF system is highly necessary.

6.7. Satellite Observation of VLF/LF Transmitter Signals from On-Board Satellites

Molchanov et al. (2006) [150] analyzed wideband VLF/LF data collected by the French DEMETER satellite at 500 km altitude, focusing on the reception of several VLF transmitters worldwide, including European, Japanese, and Indonesian EQ regions. Their findings show a notable decrease in signal strength associated with large EQs. Notably, the NWC (Australia) transmitter’s signal intensity significantly drops over the epicentral area of the 2004 Sumatra–Andaman EQ (M9.0). While most VLF signals travel within the Earth–ionosphere waveguide, some energy penetrates the lower ionosphere and propagates along magnetic field lines in whistler mode [151,152], allowing reception aboard satellites. This phenomenon is attributed to enhanced absorption in the disturbed lower ionosphere, particularly at lower latitudes, as already presented before in this review. The affected region of the perturbed lower ionosphere has a radius of approximately 2000 km.
Muto et al. (2008) analyzed whistler-mode signals in the upper ionosphere originating from VLF/LF transmitters, which are the counterparts of subionospheric signals [153]. These signals, detected onboard the DEMETER satellite, were studied in relation to several large Japanese EQs, including the Miyagi-oki EQ on 16 August 2005 (M = 7.2, depth = 36 km). The target transmitter was the Japanese LF JJY transmitter operating at 40 kHz. Due to the significant longitudinal separation (about 2500 km) between satellite orbits, a statistical analysis over extended periods (such as 3 weeks or a month) was performed to ensure reliable data. During a four-month period that included the Miyagi-oki quake, they analyzed the spatial distribution of JJY signal intensities, measured as signal-to-noise ratio (SNR). They observed notable decreases in SNR generally occurring before the EQ, suggesting a potential precursory ionospheric signature. This abnormality could be explained by either (1) increased absorption of whistler-mode LF signals in the lower ionosphere due to its lowering or (2) nonlinear wave–wave scattering.
Rozhnoi et al. (2010) [154] conducted a study on signals from two Japanese transmitters (JJI, 22.2 kHz, and JJY, 40 kHz) recorded at the ground VLF/LF station in Petropavlovsk–Kamchatsky and aboard the DEMETER satellite during Japan’s seismic activity in May–June 2008. The analysis covered from 18 April to 27 June, during which two significant EQs occurred in northern Honshu Island on 7 May (M = 6.8) and 13 June (M = 6.9). Data processing involved comparing the real nighttime signals with a model. Several days prior to the first EQ, a clear decrease in both signals was observed on the ground. For the second EQ, anomalies appeared only in the JJI signal. The EQ epicenters fell within the reliable reception zone of the 40 kHz signal on DEMETER. Satellite data showed a signal enhancement over the seismic region and a notable depletion in the magnetically conjugate area before the first quake. These anomalies in satellite data aligned temporally with ground-based observations.
Further work has been undertaken by other researchers on various EQ events in this area [155,156,157], and a paper on the statistical analysis of this topic using data from China’s EQ Electromagnetic Satellite, CSES, is also cited. Li et al. (2023) [158] utilized VLF data observed by the CSES satellite to analyze VLF signals before and after EQs from January 2019 to March 2023, focusing on the amplitude and SNR of electric field power spectrum disturbances. Using 73 EQs with a magnitude of 6.0 or higher occurring in the Circum-Pacific seismic belt as a case study, the findings reveal: (1) a strong correlation between EQs of magnitude 6.0 or above and abnormal disturbances (decrease in amplitude) in the VLF electric field, which often occur within 20 days prior to the quake and within 800 km of the epicenter; (2) from an EQ-prone area perspective, the VLF electric field anomalies observed before EQs in the Ryukyu Islands of the Taiwan region show small and concentrated fluctuations, whereas in the Taiwan Philippines region, larger and more dispersed fluctuations are observed. The detection of this link between seismic ionospheric phenomena and seismic activity offers a promising new approach for EQ monitoring, prediction, and early warning.

6.8. Correlation of Satellite Observations of Attenuation Band of ELF Signals with VLF/LF Subionospheric Anomalies

Based on the analysis of data observed onboard the DEMETER satellite, Nemec et al. (2008, 2009) [159,160] and Pisa et al. (2013) [161] found a statistically significant reduction in the in situ wave intensity at 1.6–1.8 kHz 0–4 h before the EQ, along with an increase in the cut-off frequency for propagation in the Earth–ionosphere waveguide (see [162]) prior to an EQ. The decrease occurs more frequently near shallower EQs with higher magnitudes, as is intuitively expected. Even though those authors did not pay any attention to the relationship of their phenomenon to our subionospheric VLF/LF propagation anomalies (lower-ionospheric perturbations), their phenomena of an anomaly in ELF cut-off frequencies can be satisfactorily explained by the lowering of the lowest ionosphere, thereby increasing transmission loss of upward penetration through the perturbed lowest ionosphere in whistler mode, as shown in [151,152]. As a conclusion, this DEMETER phenomenon is essentially the same in principle as the result obtained from subionospheric VLF/LF observations, as already presented in this review [20].
Mainly based on the above satellite results, Harrison et al. (2010) [163] have proposed a simple scenario that before a major EQ, we expect an increase in the electrical conductivity of the air layer close to the ground, and this, in turn, enhances the vertical fair-weather current, leading to a lowering of the ionosphere. Their scenario seems to be based on the chemical hypothesis [105,106], but we understand that further extensive study on detailed LAIC channels has been continued, as already mentioned in Section 6.1 (e.g., [132]).

6.9. Numerical Modeling of Perturbed Lower Ionosphere

A new and significant challenge has been undertaken in an effort to use numerical modeling to explain seismogenic changes in the electron density profile of the D/E layer prior to an EQ using observational data on terminator time anomalies and nighttime fluctuation anomalies. The initial studies in this area were carried out by Sasmal et al. (2021) [120] and Ghosh et al. (2019) [164] to better understand the 2015 Nepal and 2011 Japan Tohoku EQs.
Then, Sasmal et al. (2021) [120] developed a multi-parameter approach to investigate pre-EQ irregularities in the stratosphere, ionosphere, and magnetosphere for a recent Samos (Greece) EQ on 30 October 2020, with a magnitude of M = 6.9. For this EQ, Biswas et al. (2022) [165] identified anomalies in VLF signals, particularly in terminator times. VLF signals from two transmitters, ISR (Israel) and TBB (Turkey), received at the UWA station in Greece, showed significant shifts in sunrise and sunset terminator times before the EQ. The signal profiles were numerically simulated using the Long Wave Propagation Capability (LWPC) program, incorporating Wait’s simplified exponential profile with two parameters: β (gradient or steepness) and h’ (reflection height). It was found that the electron density profile of the lower ionosphere was notably affected during the maximum shifts in terminator times. For the ISR-UWA path, simulations indicated an elevation in the electron density profile during sunrise terminator time, and a decrease during sunset. Conversely, for the TBB-UWA path, the electron density profile was found to be lowered at both sunrise and sunset terminator times according to LWPC computations.
In a similar way to [120], Politis et al. (2013) [166] studied recent strong EQs in the south-eastern Mediterranean, as observed by the three VLF/LF stations in Athens, Greece. To identify seismogenic anomalies, they used both statistical and criticality analyses, such as the nighttime fluctuation method, terminator time method, and natural time analysis methods. Paying particular attention to very strong (M > 5.5) EQs that occurred in September–October 2021 and January 2022, the LWPC program was again employed to search for variations in the electron density profile of the ionospheric D/E layer, with respect to the changes in terminator time.
More comprehensive studies on pre-seismic changes in the electron density profile, based on experimental VLF results, are highly needed. Even though previous modeling studies were based on Wait’s simple, two-parameter model, the real situation of the perturbed lower ionosphere must be very different from the model; however, by providing an equivalent Wait’s model for the realistic profile, these studies will provide valuable insights into the vertical transfer of energy from the lithosphere to the ionosphere within the LAIC process.

6.10. Application of Artificial Intelligence (Machine/Deep Learning) and Critical Analysis to VLF Anomalies

As mentioned in previous sections, the detection of seismogenic VLF/LF anomalies relies on conventional statistical methods using statistical confidence. However, to increase confidence in detecting a seismogenic VLF/LF anomaly, it is highly recommended to apply recent artificial intelligence (AI) technologies, such as machine and deep learning, to long-term VLF/LF data. This can help distinguish seismogenic anomalies from other origins like geomagnetic storms and typhoons. In practice, we have employed our AI technique combining NARMAX (nonlinear autoregressive moving average with exogenous inputs) and LSTM (long short-term memory) on three years’ data to objectively identify an LF anomaly related to a specific EQ in Hokkaido (on 5 September 2018). We succeeded in confirming the result with conventional statistical analysis [167]. Further application of AI to subionospheric VLF/LF propagation anomalies associated with different EQ events is highly recommended in the future to re-confirm objectively the presence of such precursory VLF/LF propagation anomalies with the use of long-term observational data.
Furthermore, we suggest applying critical analysis methods like natural time analysis (e.g., [168]), fractal analysis, and others to our VLF/LF propagation data. Natural time analysis [168] can be particularly useful for determining whether the VLF/LF anomaly detected, through either standard statistical method or AI application, is connected to self-organization or criticality within the lithosphere. We strongly recommend exploring the use of this approach not only in VLF/LF data but also in other observational parameters.

7. Conclusions

Short-term EQ prediction is crucial for humans to help prevent EQ disasters, and for the sake of future EQ prediction practice, the following two issues should be pursued together: (1) accumulation of as many reliable EQ precursors as possible; and (2) elucidation and modeling of physical mechanisms behind those EQ precursors. Recently, monitoring the ionosphere has emerged as the key method for EQ prediction through multi-parameter and multi-layer observations; in particular, we have suggested the potential use of VLF/LF radio sounding to detect seismo-ionospheric perturbations. In this review, we have presented ample evidence of ionospheric changes associated with EQs based on both statistical and case studies. The most important point now is to gather as many convincing results as possible, which is only achievable through VLF/LF radio sounding data by fully utilizing the proper characteristics of integrated observation. Moreover, establishing a network of observations (sometimes with more advanced equipment) allows us to carry out detailed studies of the spatial and temporal dynamics of these seismo-ionospheric perturbations, thereby strengthening the potential of VLF/LF monitoring to drastically improve our understanding of the complex physical processes underlying LAIC.
We are confident about the presence of ionospheric perturbations associated with EQs, but more coordinated observations with multiple parameters and multiple layers are highly necessary, as in [115,116,117,118,119,120,121,122,123,124,125,126,127,128,129,130,131], to clarify the scientific aspects and modeling of the LAIC mechanism, which is the ultimate goal of seismo-electromagnetic research. This includes gathering convincing VLF/LF anomalies for practical EQ prediction. Additionally, we propose a new approach, such as establishing a test site where highly coordinated measurements are conducted. These would include various observations like surface monitoring (surface parameters, SLHF, OLR, etc.), lithospheric radio emissions (e.g., ULF emissions), atmospheric effects (such as those studied using over-the-horizon VHF signals or AGW monitoring in the stratosphere), and ionospheric effects (examined through subionospheric VLF/LF waves in this review and upper ionospheric monitoring) for short-term EQ prediction. During Japanese Frontier Projects, we operated such a station at Kamchatka, Russia, as part of a Japanese–Russian collaboration [169], and recently, Chinese colleagues established a Chinese station [170] aimed at gaining a much better understanding of LAIC-related issues. We hope that a few more coordinated stations will be established worldwide.
Finally, we must comment on a recent suggestion (e.g., Anagnostopoulos (2021) [171]) that solar–terrestrial effects such as solar flares and geomagnetic phenomena might significantly influence our seismogenic processes. This idea remains under active debate, making VLF studies potentially important in this context, as VLF monitoring can help improve understanding of these interconnected effects (Raulin et al., 2010) [172].

Funding

This research received no external funding.

Data Availability Statement

No new data were created or analyzed in this study.

Acknowledgments

The initial Japanese VLF/LF network was established within the framework of the EQ Remote-Sensing Frontier Project by the former NASDA, to which I am grateful. Also, we have to mention that many scientists, either domestic or foreign, contributed a lot to the success of NASDA’s Frontier Project: We have appreciated fruitful collaboration in the field of VLF/LF studies with the late O. Molchanov, the late A. Rozhnoi, M. Solovieva, and the late K. Ohta, recently S. Potirakis, S. Sasmal, and Y. Hobara. Finally, thanks are also due to NiCT (R&D promotion scheme funding international joint research) for its financial support.

Conflicts of Interest

M.H. is an employee of QuakeInsight Tokyo and Hi-SEM, but the contents of this paper reflect ideas presented as a scientist.

References

  1. Hayakawa, M. Earthquake Precursors Studies in Japan. In Pre-Earthquake Process: A Multidisciplinary Approach to Earthquake Prediction Studies; Ouzounov, D., Pulinets, S., Hattori, K., Taylor, P., Eds.; American Geophysical Union: Washington, DC, USA; Wiley: Hoboken, NJ, USA, 2018; Chapter 2; pp. 7–18. [Google Scholar]
  2. Hayakawa, M. (Ed.) Electromagnetic Phenomena Associated with Earthquakes; Transworld Research Network: Trivandrum, India, 1999; 279p. [Google Scholar]
  3. Hayakawa, M.; Molchanov, O.A. (Eds.) Seismo-Electromagnetics: Lithosphere-Atmosphere-Ionosphere Coupling; TERRAPUB: Tokyo, Japan, 2002; 477p. [Google Scholar]
  4. Molchanov, O.A.; Hayakawa, M. Seismo-Electromagnetics and Related Phenomena: History and Latest Results; TERRAPUB: Tokyo, Japan, 2008; 189p. [Google Scholar]
  5. Hayakawa, M. Earthquake Prediction with Radio Techniques; John Wiley & Sons: Singapore, 2015; 274p. [Google Scholar]
  6. Ouzounov, D.; Pulinets, S.; Hattori, K.; Taylor, P. (Eds.) Pre-Earthquake Process: A Multidisciplinary Approach to Earthquake Prediction Studies; American Geophysical Union: Washington, DC, USA; Wiley: Hoboken, NJ, USA, 2018; 365p. [Google Scholar]
  7. Pulinets, S.; Ouzounov, D.; Karelin, A.; Boyarchuk, K. Earthquake Precursors in the Atmosphere and Ionosphere: New Concepts; Springer: Berlin/Heidelberg, Germany, 2022; 294p. [Google Scholar]
  8. Surkov, V.V. An overview of theoretical studies of non-seismic phenomena accompanying earthquakes. Surv. Geophys. 2024, 46, 7–70. [Google Scholar] [CrossRef]
  9. Uyeda, S.; Nagao, T.; Kamogawa, M. Short-term earthquake prediction: Current status of seismo-electromagnetics. Tectonophysics 2009, 470, 205–213. [Google Scholar] [CrossRef]
  10. Hayakawa, M.; Hobara, Y. Current status of seismo-electromagnetics for short-term earthquake prediction. Geomat. Nat. Hazards Risk 2010, 1, 115–155. [Google Scholar] [CrossRef]
  11. Watt, A.D. VLF Radio Engineering; Pergamon: Oxford, UK; New York, NY, USA, 1967; 703p. [Google Scholar]
  12. Wait, J.R. Electromagnetic Waves in Stratified Media; Pergamon Press: Oxford, UK; New York, NY, USA, 1962; 372p. [Google Scholar]
  13. Rodgers, C.; McCormic, R.J. Remote Sensing of the Upper Atmosphere by VLF. In Sprites, Elves and Intense Lighting Discharges; Füllekrug, M., Mareev, E.A., Rycrof, M.J., Eds.; NATO Science Series II; Springer: Berlin/Heidelberg, Germany, 2006; pp. 167–190. [Google Scholar]
  14. Dowden, R.L.; Adams, C.D.D. Location of lightning-induced electron precipitation from measurements of VLF phase and amplitude perturbations on spaced antennas and on two frequencies. J. Geophys. Res. 1990, 95, 4135–4145. [Google Scholar] [CrossRef]
  15. Inan, U.S.; Cummer, S.A.; Marshall, R.A. A survey of ELF and VLF research on lightning-ionosphere interactions and causative discharges. J. Geophys. Res. 2010, 115, A00E36. [Google Scholar] [CrossRef]
  16. Gokhberg, M.B.; Gufeld, I.L.; Rozhnoi, A.A.; Marenko, V.F.; Yampolshy, V.S.; Ponomarev, E.A. Study of seismic influence on the ionosphere by super long wave proding of the Earth–ionosphere waveguide. Phys. Earth Planet. Inter. 1989, 57, 64–67. [Google Scholar] [CrossRef]
  17. Gufeld, I.L.; Rozhnoi, A.A.; Tyumensev, S.N.; Sherstuk, S.V.; Yampolsky, V.S. Radiowave disturbances in period to Rudber and Rachinsk earthquakes. Phys. Solid Earth 1992, 28, 267–270. [Google Scholar]
  18. Gufeld, I.L.; Marenko, V.F. The short-time prediction for the time of strong earthquakes with the help of radiowave technique. Dokl. RAN 1992, 323, 1064–1070. [Google Scholar]
  19. Gufeld, I.L.; Gusev, G.; Pokhotelov, O. Is the Prediction of Earthquake Date Possible by VLF Radio Wave Monitoring Method? In Electromagnetic Phenomena Related to Earthquake Prediction; Hayakawa, M., Fujinawa, Y., Eds.; TERRAPUB: Tokyo, Japan, 1994; pp. 381–390. ISBN 4-88704-113-6. [Google Scholar]
  20. Hayakawa, M.; Molchanov, O.A.; Ondoh, T.; Kawai, E. On the precursory signature of Kobe earthquake in subionospheric VLF propagation. J. Comm. Res. Lab. 1996, 43, 169–180. [Google Scholar]
  21. Molchanov, O.A.; Hayakawa, M. Subionospheic VLF signal perturbations possibly related to earthquakes. J. Geophys. Res. 1998, 103, 17489–17504. [Google Scholar] [CrossRef]
  22. Molchanov, O.A.; Hayakawa, M.; Miyaki, K. VLF/LF sounding of the lower ionosphere to study the role of atmospheric oscillations in the lithosphere-ionosphere coupling. Adv. Polar Upper Atmos. Res. 2001, 15, 146–158. [Google Scholar] [CrossRef]
  23. Yoshida, M.; Yamauchi, T.; Horie, T.; Hayakawa, M. On the generation mechanism of terminator times in subionospheric VLF/LF propagation and its possible application to seismogenic effects. Nat. Hazards Earth Syst. Sci. 2008, 8, 129–134. [Google Scholar] [CrossRef]
  24. Maurya, A.K.; Venkatesham, K.; Tiwari, P.; Vijaykumar, K.; Singh, R.; Singh, A.K.; Ramesh, D.S. The 25 April 2015 Nepal earthquake: Investigation of precursor in VLF subionospheric signal. J. Geophys. Res. Space Phys. 2016, 121, 416. [Google Scholar] [CrossRef]
  25. Phanikumar, D.V.; Maurya, A.K.; Kumar, K.N.; Venkateshan, K.; Singh, R.; Sharma, S.; Naja, M. Anomalous variations of VLF sub-ionospheric signal and mesospheric ozone prior to the 2015 Nepal earthquake. Sci. Rep. 2018, 8, 9381. [Google Scholar] [CrossRef] [PubMed]
  26. Sasmal, S.; Chakrabarti, S.K.; Ray, S. Unusual Very Low Frequency signal during the earthquake at Honshu, Japan on 11 March, 2011. Indian J. Phys. 2014, 88, 1013–1019. [Google Scholar] [CrossRef]
  27. Ghosh, S.; Chakraborty, S.; Samal, S.; Basak, T.; Chakrabarti, S.K.; Samanta, A. Comparative study of the possible anomalies in D-region electron density as computed from unusual terminator shifts in sub-ionospheric Very Low Frequency (VLF) signal during Honshu, 2011 and Nepal, 2015 earthquakes. In Proceedings of the 42nd COSPAR Scientific Assembly, Pasadena, CA, USA, 14–22 July 2018; Volume 42. [Google Scholar]
  28. Boudajada, M.Y.; Biagi, P.F.; Eichelberger, H.U.; Nico, G.; Galopeau, P.H.M.; Ermini, A.; Solovieva, M.; Hayakawa, M.; Lammer, H.; Volker, W.; et al. Analysis of pre-seismic ionospheric disturbances prior to 2020 Croatian earthquakes. Remote Sens. 2024, 16, 529. [Google Scholar] [CrossRef]
  29. Chakrabarti, S.K.; Sasmal, S.; Chakrabarti, S. Ionospheric anomaly due to seismic activities—Part 2: Evidence from D-layer preparation and disappearance times. Nat. Hazards Earth Syst. Sci. 2010, 10, 1751–1757. [Google Scholar] [CrossRef]
  30. Chakrabarti, S.K.; Sasmal, S.; Pal, S. ICSP Detections of Anomalous VLF Radio Wave Signals Prior to Major Earthquakes. In Earthquake Prediction Studies: Seismo Electromagnetics; Hayakawa, M., Ed.; TERRAPUB: Tokyo, Japan, 2013; pp. 49–55. [Google Scholar]
  31. Choudhury, A.; De, B.K.; Guha, A.; Roy, R. Long-duration geomagnetic storm effects on the D region of the ionosphere: Some case studies using VLF signal. J. Geophys. Res. Space Phys. 2015, 120, 778–787. [Google Scholar] [CrossRef]
  32. Hayakawa, M.; Molchanov, O.A. NASDA/UEC team Achievements of NASDA’s Earthquake Remote Sensing Frontier Project. Terr. Atmos. Ocean. Sci. 2004, 15, 311–328. [Google Scholar] [CrossRef]
  33. Kopytenko, Y.A.; Matiashvily, T.G.; Voronov, P.M.; Kopytenko, E.A.; Molchanov, O.A. Detection of ULF Emission Connected with the Spitak Earthquake and Its Aftershock Activity Based on Geomagnetic Pulsations Data at Dusheti and Vardziya Observatories. Phys. Earth Planet. Inter. 1990, 77, 85–95. [Google Scholar] [CrossRef]
  34. Fraser-Smith, A.C.; Bernardi, A.; McGill, P.R.; Ladd, M.E.; Helliwell, R.A.; Villard, O.G., Jr. Low-frequency magnetic field measurements near the epicenter of the Ms 7.1 Loma Prieta earthquake. Geophys. Res. Lett. 1990, 17, 1465–1468. [Google Scholar] [CrossRef]
  35. Molchanov, O.A.; Kopytenko, Y.A.; Voronov, P.M.; Kopytenko, E.A.; Matiashvily, T.G.; Fraser-Smith, A.C.; Bernardi, A. Results of ULF magnetic field measurements near the epicenters of the Spitac (Ms = 6.9) and Loma Prieta (Ms = 7.1) earthquakes: Comparative Analysis. Geophys. Res. Lett. 1992, 19, 1495–1498. [Google Scholar] [CrossRef]
  36. Hayakawa, M.; Kawate, R.; Molchanov, O.A.; Yumoto, K. Results of ultra-low-frequency magnetic field measurements during the Guam earthquake of 8 August 1993. Geophys. Res. Lett. 1996, 23, 241–244. [Google Scholar] [CrossRef]
  37. Hayakawa, M.; Hattori, K.; Ohta, K. Monitoring of ULF (ultra low frequency) geomagnetic variations associated with earthquakes. Sensors 2007, 7, 1108–1122. [Google Scholar] [CrossRef]
  38. Hayakawa, M.; Schekotov, A.; Izutsu, J.; Nickolaenko, A.P. Seismogenic effects in ULF/ELF/VLF electromagnetic waves. Int. J. Electron. Appl. Res. 2019, 6, 1–86. [Google Scholar] [CrossRef]
  39. Gorny, V.I.; Salman, A.G.; Troni, A.A.; Shilin, B.B. The Earth’s outgoing IR radiation as an indicator of seismic activity. Proc. USSR Acad. Sci. 1988, 30, 67–69. [Google Scholar]
  40. Qiang, Z.J.; Xu, X.D.; Dian, C.G. Thermal infrared anomaly precursor of impending earthquakes. Chin. Sci. Bull. 1991, 36, 319–323. [Google Scholar] [CrossRef]
  41. Tronin, A. Satellite thermal survey-a new tool for the study of seismoactive regions. Int. J. Remote Sens. 1996, 17, 1439–1455. [Google Scholar] [CrossRef]
  42. Tronin, A.A.; Hayakawa, M.; Molchanov, O.A. Thermal IR satellite data application for earthquake research in Japan and China. J. Geodyn. 2002, 33, 319–534. [Google Scholar] [CrossRef]
  43. Dey, S.; Singh, R.P. Surface latent heat flux as an earthquake precursor. Nat. Hazards Earth Syst. Sci. 2003, 3, 749–755. [Google Scholar] [CrossRef]
  44. Ouzounov, D.; Freund, F. Mid-infrared emission prior to strong earthquakes analyzed by remote sensing data. Adv. Space Res. 2004, 33, 268–273. [Google Scholar] [CrossRef]
  45. Tramutoli, V.; Cuomo, V.; Filizzola, C.; Pergola, N.; Pietrapertosa, C. Assessing the potential of thermal infrared satellite surveys for monitoring seismically active areas: The case of Kocaeli (Izmit) earthquake, August 17, 1999. Remote Sens. Environ. 2005, 96, 409–426. [Google Scholar] [CrossRef]
  46. Cervone, G.; Maekawa, S.; Singh, R.P.; Hayakawa, M.; Kafatos, M.; Shvets, A. Surface latent heat flux and nighttime LF anomalies prior to the Mw = 8.3 Tokachi-Oki earthquake. Nat. Hazards Earth Syst. Sci. 2006, 6, 109–114. [Google Scholar] [CrossRef]
  47. Blackett, M.; Wooster, M.J.; Malamud, B.D. Exploring land surface temperature earthquake precursors: A focus on the Gujarat (India) earthquake of 2001. Geophys. Res. Lett. 2011, 38, L15303. [Google Scholar] [CrossRef]
  48. Shah, M.; Khan, M.; Ullah, H.; Ali, S. Thermal anomalies prior to the 2015 Gorkha (India) earthquake from MODIS land surface temperature and outgoing longwave radiation. Geodyn. Tectonophys. 2018, 9, 123–138. [Google Scholar] [CrossRef]
  49. Piscini, A.; De Santis, A.; Marchetti, D.; Cianchini, G. A multiparametric climatological approach to study the 2016 Amatrice Norcia (Central Italy) earthquake preparatory phase. Pure Appl. Geophys. 2017, 174, 3673–3688. [Google Scholar] [CrossRef]
  50. Draz, M.U.; Shah, M.; Jamjareegulgarn, P.; Shahzed, R.; Hasan, A.M.; Ghamry, N.A. Deep machine learning based possible atmospheric and ionospheric precursors of the 2021 Mw7.1 Japan earthquake. Remote Sens. 2023, 15, 1904. [Google Scholar] [CrossRef]
  51. Ghosh, S.; Sasmal, S.; Potirakis, S.; Hayakawa, M. Thermal anomaly observed during the Crete earthquake on 27 September, 2021. Geosciences 2023, 14, 73. [Google Scholar] [CrossRef]
  52. Ghosh, S.; Chowdhury, S.K.; Kundu, S.; Sasmal, S.; Politis, D.Z.; Potirakis, S.M.; Hayakawa, M.; Chakraborty, S.; Chakrabarti, S.K. Unusual surface latent heat flux variations and their critical dynamics revealed before strong earthquakes. Entropy 2022, 24, 23. [Google Scholar] [CrossRef]
  53. Ouzounov, D.; Liu, D.; Chunli, K.; Cervone, G.; Kafatos, M.; Taylor, P. Outgoing long wave radiation variability from satellite data prior to major earthquakes. Tectonophysics 2007, 431, 211–220. [Google Scholar] [CrossRef]
  54. Venkatanathan, N.; Natyaganov, V. Outgoing longwave radiations as pre-earthquake signals: Preliminary results of 24 September 2013 M7.7 earthquake. Curr. Sci. 2014, 106, 1291–1297. [Google Scholar]
  55. Xiong, P.; Shen, X.H.; Bi, X.X.; Kang, C.L.; Chen, J.Z.; Jing, F.; Chen, Y. Study of outgoing longwave radiation anomalies associated with Haiti earthquake. Nat. Hazards Earth Syst. Sci. 2010, 10, 2169–2178. [Google Scholar] [CrossRef]
  56. Shah, M.; Ehsan, M.; Abbas, A.; Ahmed, A.; Jamjareegulgarn, P. Possible thermal anomalies associated with global terrible earthquakes during 2000-2019 based on MODIS-LST. IEEE Geosci. Remote Sens. Lett. 2021, 19, 1002705. [Google Scholar] [CrossRef]
  57. Zarchi, A.K.; Maharan, M.R.S. Fault distance-based approach in thermal anomaly detection before strong earthquakes. Nat. Hazards Earth Syst. Sci. Prepr. 2020, 391. [Google Scholar] [CrossRef]
  58. Genzano, N.; Filizzaola, C.; Hattori, K.; Pergola, N.; Tramutoli, V. Statistical correlation analysis between thermal infrared anomalies observed from MTSATs and large earthquakes occurred in Japan (2005–2015). J. Geophys. Res. Solid Earth 2021, 126, e2020JB020108. [Google Scholar] [CrossRef]
  59. Sharma, P.; Bardhan, A.; Kumari, R.; Sharma, D.K.; Sharma, A.K. Variation of surface latent heat flux (SLHF) observed during high-magnitude earthquakes. J. Ind. Geophys. Union 2024, 28, 131–142. [Google Scholar]
  60. Hayakawa, M.; Hironaka, S.; Michimoto, K.; Potirakis, S.M.; Hobara, Y. Meteorological anomalies during earthquake preparation: A case study for the 1995 Kobe earthquake based on statistical and machine learning-based analyses. Atmosphere 2025, 16, 88. [Google Scholar] [CrossRef]
  61. Hinata, H.; Michimoto, K.; Ozawa, Y.; Hayakawa, M. A study of lithosphere-atmosphere-ionosphere coupling channel for the 1995 Kobe earthquake, by including ground-based meteorological anomalies. Open J. Earthq. Res. 2025, 14, 85–105. [Google Scholar] [CrossRef]
  62. Fukumoto, Y.; Hayakawa, M.; Yasuda, H. Investigation of over-horizon VHF radio signals associated with earthquakes. Nat. Hazards Earth Syst. Sci. 2001, 1, 107–112. [Google Scholar] [CrossRef]
  63. Fujiwara, H.; Kamogawa, M.; Ikeda, M.; Liu, J.Y.; Sakata, H.; Chen, Y.I.; Ofuruton, H.; Uramatsu, S.; Chuo, J.Y.; Ohtsuki, Y.H. Atmospheric anomalies observed during earthquake occurrences. Geophys. Res. Lett. 2004, 31, L17110. [Google Scholar] [CrossRef]
  64. Hayakawa, M.; Surkov, V.V.; Fukumoto, Y.; Yonaiguchi, N. Characteristics of VHF over-horizon signals possibly related to impending earthquakes and a mechanism of seismo-atmospheric perturbations. J. Atmos. Sol. Terr. Phys. 2007, 69, 1057–1062. [Google Scholar] [CrossRef]
  65. Ouzounov, D.; Velichkova-Yotsova, S.; Pulinets, S. Sudden modulation in the UHF wireless signals probably caused by the activation of pre-earthquake processes. Case studies for the Balkans (SE Europe). Ann. Geophys. 2024, 66, SE647. [Google Scholar] [CrossRef]
  66. Yang, S.-S.; Asano, T.; Hayakawa, M. Abnormal gravity wave activity in the stratosphere prior to the 2016 Kumamoto earthquakes. J. Geophys. Res. Space Phys. 2019, 124, 1410–1425. [Google Scholar] [CrossRef]
  67. Yang, S.S.; Hayakawa, M. Gravity wave activity in the stratosphere before the 2011 Tohoku earthquake as the mechanism of lithosphere-atmosphere-ionosphere coupling. Entropy 2020, 22, 110. [Google Scholar] [CrossRef]
  68. Liu, J.Y.; Chen, Y.I.; Chuo, Y.J.; Chen, C.S. A statistical investigation of pre-earthquake ionospheric anomaly. J. Geophys. Res. 2006, 111, A05304. [Google Scholar] [CrossRef]
  69. Liu, J.Y.; Chen, C.H.; Chen, Y.I.; Yang, W.H.; Oyama, K.I.; Juo, K.W. A statistical study of ionospheric earthquake precursors monitored by using equatorial ionization anomaly of GPS TEC in Tawan during 2001–2007. J. Asian Earth Sci. 2010, 39, 76–80. [Google Scholar] [CrossRef]
  70. Afonin, V.V.; Molchanov, O.A.; Kodama, T.; Hayakawa, M.; Akentieva, O.A. Statistical Study of Ionospheric Plasma Response to Seismic Activity: Search for Reliable Result from Satellite Observations. In Atmospheric and Ionospheric Electromagnetic Phenomena Associated with Earthquakes; Hayakawa, M., Ed.; TERRAPUB: Tokyo, Japan, 1999; pp. 597–618. [Google Scholar]
  71. Parrot, M. Special Issue Planetary and Space Science “DEMETER”. Planet. Space Sci. 2006, 54, 411–412. [Google Scholar] [CrossRef]
  72. Zhang, Y.; Li, M.; Huang, Q.; Shao, Z.; Liu, J.; Zhang, X.; Ma, W.; Parrot, M. Statistical correlation between DEMETER satellite electronic perturbations and global earthquakes with M >4.8. Trans. Geosci. Remote Sens. 2023, 61, 2001118. [Google Scholar] [CrossRef]
  73. Yan, R.; Huang, J.; Lin, J.; Wang, Q.; Zhang, Z.; Yang, Y.; Chu, W.; Liu, D.; Xu, S.; Lu, H.; et al. Retrospective study on seismo ionospheric anomalies based on five-year observations from CSES. Remote Sens. 2024, 16, 4426. [Google Scholar] [CrossRef]
  74. Molchanov, O.; Fedorov, E.; Schekotov, A.; Gordeev, E.; Chebrov, V.; Surkov, V.; Rozhnoi, A.; Andreavsky, A.; Iudin, D.; Yunga, S.; et al. Lithosphere-atmosphere-ionosphere coupling as governing mechanism for preseismic short-term events in atmosphere and ionosphere. Nat. Hazards Earth Syst. Sci. 2004, 4, 757–767. [Google Scholar] [CrossRef]
  75. Pulinets, S.; Ouzounov, D. Lithosphere-atmosphere-ionosphere coupling (LAIC)—A unified concept for earthquake precursors validation. J. Asian Earth Sci. 2011, 41, 371–382. [Google Scholar] [CrossRef]
  76. Hayakawa, M.; Horie, T.; Muto, F.; Kasahara, Y.; Ohta, K.; Liu, J.Y.; Hobara, Y. Subionospheric VLF/LF probing of ionospheric perturbations associated with earthquakes: A possibility of earthquake prediction. SICE J. Control Meas. Syst. Integr. 2010, 3, 10–14. [Google Scholar] [CrossRef]
  77. Dowden, R.L.; Brundel, J.B.; Hayakawa, M. Remote sensing by VLF using “Absolute OmniPAL”. 1. Investigation of short path propagation for possible earthquake precursor detection. In Proceedings of the 1998 International Conference on Mathematical Model in Electromagnetic Theory, Kharkov, Ukraine, 2–5 June 1998; pp. 29–34. [Google Scholar] [CrossRef]
  78. Rozhnoi, A.; Solovieva, M.S.; Molchanov, O.A.; Hayakawa, M. Middle latitude LF (40 kHz) phase variations associated with earthquakes for quiet and disturbed geomagnetic conditions. Phys. Chem. Earth 2004, 29, 589–598. [Google Scholar] [CrossRef]
  79. Biagi, P.F.; Castellana, L.; Maggipinto, T.; Piccolo, R.; Minafra, A.; Ermini, A.; Martellucci, S.; Bellecci, C.; Perna, G.; Capozzi, V.; et al. A possible preseismic anomaly in the ground wave of a radio broadcasting (216 kHz) during July-August 1998 (Italy). Nat. Hazards Earth Syst. Sci. 2005, 5, 727–732. [Google Scholar] [CrossRef]
  80. Biagi, P.F.; Castellana, L.; Maggipinto, T.; Piccolo, R.; Minafra, A.; Ermini, A.; Martellucci, S.; Bellecci, C.; Perna, G.; Capozzi, V.; et al. LF radio anomalies revealed in Italy by the wavelet analysis: Possible preseismic effects during 1997–1998. Phys. Chem. Earth 2006, 31, 403–408. [Google Scholar] [CrossRef]
  81. Biagi, P.F.; Castellana, L.; Maggipinto, T.; Ermini, A. An overview on preseimic anomalies in LF radio signals revealed in Italy by wavelet analysis. Ann. Geophys. 2008, 51, 237–246. [Google Scholar] [CrossRef]
  82. Doleaa, P.; Cristeaa, C.; Dascala, P.V.; Moldovanb, I.-A.; Biagi, P.F. Aspects regarding the use of the INFREP network for identifying possible seismic precursors. Phys. Chem. Earth 2015, 85, 34–43. [Google Scholar] [CrossRef]
  83. Biagi, P.F.; Colella1, R.; Schiavulli1, L.; Ermini, A.; Boudjada, M.; Eichelberger, H.; Schwingenschuh, K.; Katzis, K.; Contadakis, M.E.; Skeberis, C.; et al. The INFREP network: Present situation and recent results. Open J. Earthq. Res. 2019, 8, 101–115. [Google Scholar] [CrossRef]
  84. Daubechies, I. The wavelet transform of time-frequency localization and signal analysis. IEEE Trans. Inform. Theory 1990, 36, 961–1004. [Google Scholar] [CrossRef]
  85. Zhao, S.; Shen, X.; Liao, L.; Zhima, Z.; Zhou, C.; Wang, Z.; Cui, J.; Lu, H. Investigation of precursors in VLF subionospheric signals related to strong earthquakes (M > 7) in western China and possible explanations. Remote Sens. 2020, 12, 3563. [Google Scholar] [CrossRef]
  86. Hayakawa, M.; Kasahara, Y.; Nakamura, T.; Muto, F.; Horie, T.; Maekawa, S.; Hobara, Y.; Rozhnoi, A.A.; Solovieva, M.; Molchanov, O.A. A statistical study on the correlation between lower ionospheric perturbations as seen by subionospheric VLF/LF propagation and earthquakes. J. Geophys. Res. 2010, 115, A09305. [Google Scholar] [CrossRef]
  87. Maekawa, S.; Horie, T.; Yamauchi, T.; Sawaya, T.; Ishikawa, M.; Hayakawa, M.; Sasaki, H. A statistical study on the effect of earthquakes on the ionosphere, based on the subionospheric LF propagation data in Japan. Ann. Geophys. 2006, 24, 2219–2225. [Google Scholar] [CrossRef]
  88. Singh, D.; Singh, B.; Pundhir, D. Ionospheric perturbations due to earthquakes as determined from VLF and GPS-TEC data analysis at Agra, India. Adv. Space Res. 2018, 61, 1952–1965. [Google Scholar] [CrossRef]
  89. Maurya, A.K.; Singh, R.; Veenadhari, B.; Kumar, S. Sub-ionospheric very low frequency perturbations associated with the 12 May 2008 M=7.9 Wenchuan earthquake. Nat. Hazards Earth Syst. Sci. 2013, 13, 2331–2336. [Google Scholar] [CrossRef]
  90. Tojiev, S.R.; Ahmedov, B.J.; Eshkuvatov, H.E. Ionospheric precursors of earthquakes recorded by VLF receiver at Tashkent IHY station. Adv. Space Res. 2014, 54, 628–643. [Google Scholar] [CrossRef]
  91. Kumar, S.; Kumar, S.; Kumar, A. Earthquakes associated subionospheric VLF anomalies recorded at two low latitude stations in the South Pacific region. J. Atmos. Sol. Terr. Phys. 2022, 229, 105834. [Google Scholar] [CrossRef]
  92. Politis, D.Z.; Sasmal, S.; Hayakawa, M.; Haralambous, H.; Datta, A.; Potirakis, S.M. A Six-Year (2014–2020) Statistical Correlation Study of VLF Terminator Time Shift with Earthquakes in Japan. Remote Sens. 2024, 16, 4162. [Google Scholar] [CrossRef]
  93. Shvets, A.V.; Hayakawa, M.; Maekawa, S. Results of subionospheric radio LF monitoring prior to the Tokachi (M=8, Hokkaido, 25 September 2003) earthquake. Nat. Hazards Earth Syst. Sci. 2004, 4, 647–653. [Google Scholar] [CrossRef]
  94. Ohta, K.; Makita, K.; Hayakawa, M. On the association of anomalies in subionospheric VLF propagation at Kasugai with earthquakes in the Tokai area. J. Atmos. Electr. 2000, 20, 85–95. [Google Scholar] [CrossRef]
  95. Hayakawa, M.; Ohta, K.; Maekawa, S.; Yamauchi, T.; Ida, Y.; Gotoh, T.; Yonaiguchi, N.; Sasaki, H.; Nakamura, T. Electromagnetic precursors to the 2004 Mid Niigata Prefecture earthquake. Phys. Chem. Earth 2006, 31, 356–364. [Google Scholar] [CrossRef]
  96. Yamauchi, T.; Maekawa, S.; Horie, T.; Hayakawa, M.; Soloviev, O. Subionospheric VLF/LF monitoring of ionospheric perturbations for the 2004 Mid-Niigata earthquake and their structure and dynamics. J. Atmos. Sol. Terr. Phys. 2007, 69, 793–802. [Google Scholar] [CrossRef]
  97. Ohta, K.; Umeda, K.; Watanabe, N.; Hayakawa, M. ULF/ELF emissions observed in Japan, possibly associated with the Chi-Chi earthquake in Taiwan. Nat. Hazards Earth Syst. Sci. 2001, 1, 37–42. [Google Scholar] [CrossRef]
  98. Horie, T.; Maekawa, S.; Yamauchi, T.; Hayakawa, M. A possible effect of ionospheric perturbations associated with the Sumatra earthquake, as revealed from subionospheric very-low-frequency (VLF) propagation (NWC-Japan). Int. J. Remote Sens. 2007, 28, 3133–3139. [Google Scholar] [CrossRef]
  99. Horie, T.; Yamauchi, T.; Yoshida, M.; Hayakawa, M. The wavelike structures of ionospheric perturbation associated with Sumatra earthquake of 26 December 2004, as revealed from VLF observation in Japan of NWC signals. J. Atmos. Sol. Terr. Phys. 2007, 69, 1021–1028. [Google Scholar] [CrossRef]
  100. Hayakawa, M.; Raulin, J.P.; Kasahara, Y.; Bertoni, F.C.P.; Hobara, Y.; Guevara-Day, W. Ionospheric perturbations in possible association with the 2010 Haiti earthquake, as based on medium-distance subionospheric VLF propagation data. Nat. Hazards Earth Syst. Sci. 2011, 11, 513–518. [Google Scholar] [CrossRef]
  101. Hayakawa, M.; Rozhnoi, A.; Solovieva, M.; Hobara, Y.; Ohta, K.; Schekotov, A.; Fedorov, E. The lower ionospheric perturbation as a precursor to the 11 March 2011 Japan earthquake. Geomat. Nat. Hazards Risk 2013, 4, 275–287. [Google Scholar] [CrossRef]
  102. Asano, T.; Hayakawa, M. On the tempo-spatial evolution of the lower ionospheric perturbation for the 2016 Kumamoto earthquakes from comparisons of VLF Propagation data observed at multiple stations with wave-hop theoretical computations. Open J. Earthq. Res. 2018, 7, 161–185. [Google Scholar] [CrossRef]
  103. Potirakis, S.M.; Schekotov, A.; Koulouras, G.E.; Contoyiannis, Y.; Balasis, G.; Melis, N.S.; Boutsi, A.Z.; Hayakawa, M.; Eftaxias, K.; Nomicos, C. On possible electromagnetic precursors to a significant earthquake (Mw = 6.3) occurred in Lesvos (Greece) on 12 June 2017. Entropy 2019, 21, 241. [Google Scholar] [CrossRef]
  104. Politis, D.Z.; Potirakis, S.M.; Contoyiannis, Y.F.; Biswas, S.; Sasmal, S.; Hayakawa, M. Statistical and criticality analysis of the lower ionosphere prior to the 30 October 2020 Samos (Greece) earthquake (M6.9), based on VLF electromagnetic propagation data as recorded by a new VLF/LF receiver installed in Athens (Greece). Entropy 2021, 23, 676. [Google Scholar] [CrossRef]
  105. Pulinets, S.A.; Boyarchuk, K. Ionospheric Precursors of Earthquakes; Springer: Berlin/Heidelberg, Germany, 2004; 315p. [Google Scholar]
  106. Sorokin, V.M.; Yaschenko, A.K.; Chmyrev, V.M.; Hayakawa, M. DC electric field amplification in the mid-latitude ionosphere over seismically active faults. Phys. Chem. Earth 2006, 31, 447–453. [Google Scholar] [CrossRef]
  107. Miyaki, K.; Hayakawa, M.; Molchanov, O.A. The Role of Gravity Waves in the Lithosphere-Ionosphere Coupling, as Revealed from the Subionospheric LF Propagation Data. In Seismo Electromagnetics: Lithosphere-Atmosphere-Ionosphere Coupling; Hayakawa, M., Molchanov, O.A., Eds.; TERRAPUB: Tokyo, Japan, 2002; pp. 229–232. [Google Scholar]
  108. Hooke, W.H. Ionospheric irregularities produced by internal atmospheric gravity waves. J Atmos. Terr. Phys. 1968, 30, 795–823. [Google Scholar] [CrossRef]
  109. Hooke, W.H. Rossby-Planetary Waves, Tides, Gravity Waves in the Upper Atmosphere. In The Upper Atmosphere and Magnetosphere; National Academy Science: Washington, DC, USA, 1970; pp. 130–140. [Google Scholar]
  110. Grossard, E.E.; Hooke, W.H. Waves in the Atmosphere (Atmospheric Infrasound and Gravity Wave—Their Generation and Propagation); Elsevier: Amsterdam, The Netherlands, 1975; 440p. [Google Scholar]
  111. Molchanov, O.A.; Mazhaeva, O.A.; Goliavin, A.N.; Hayakawa, M. Observations by the Intercosmos-24 satellite of ELF-VLF electromagnetic emissions associated with earthquakes. Ann. Geophysicae 1993, 11, 431–440. [Google Scholar]
  112. Freund, F. Stress-Activated Positive Hole Charge Carriers in Rocks and the Generation of Pre-Earthquake Signals. In Electromagnetic Phenomena Associated with Earthquakes; Hayakawa, M., Ed.; Transworld Research Network: Trivandrum, India, 2009; pp. 41–96. [Google Scholar]
  113. Freund, F. Earthquake forewarning—A multidisciplinary challenge from the ground up to space. Acta Geophys. 2013, 61, 775–807. [Google Scholar] [CrossRef]
  114. Sorokin, V.M.; Chmyrev, V.M.; Hayakawa, M. A Review on Electrodynamic Influence of Atmospheric Processes to the Ionosphere. Open J. Earthq. Res. 2020, 9, 113–141. [Google Scholar] [CrossRef]
  115. De Santis, A.; Balasis, G.; Pavón-Carrasco, F.J.; Cianchini, G.; Mandea, M. Potential earthquake precursory pattern from space: The 2015 Nepal event as seen by magnetic Swarm satellites. Earth Planet. Sci. Lett. 2017, 461, 119–126. [Google Scholar] [CrossRef]
  116. De Santis, A.; Cianchini, G.; Marchetti, D.; Piscini, A.; Sabbagh, D.; Perrone, L.; Campuzano, S.A.; Inan, S. A multiparametric approach to study the preparation phase of the 2019 M7.1 Ridgecrest (California, USA) earthquake. Front. Earth Sci. 2020, 8, 540398. [Google Scholar] [CrossRef]
  117. Akhoondzadeh, M.; De Santis, A.; Marchetti, D.; Piscini, A.; Jin, S. Anomalous seismo-LAI variations potentially associated with the 2017 Mw = 7.3 Sarpol-e Zahab (Iran) earthquake from Swarm satellites, GPS-TEC and meteorological data. Adv. Space Res. 2019, 64, 143–158. [Google Scholar] [CrossRef]
  118. Ouzounov, D.; Pulinets, S.; Davidenko, D.; Rozhnoi, A.; Solovieva, M.; Fedun, V.; Dwivedi, B.N.; Rybin, A.; Kafatos, M.; Taylor, P. Transient effects in atmosphere and ionosphere preceding the 2015 M7.8 and M7.3 Gorkha–Nepal earthquakes. Front. Earth Sci. 2021, 9, 757358. [Google Scholar] [CrossRef]
  119. Parrot, M.; Tramutoli, V.; Liu, J.Y.; Pulinets, S.; Ouzounov, D.; Genzaro, N.; Lisi, M.; Hattori, K.; Namgaladze, A. Atmospheric and ionospheric coupling phenomena associated with large earthquakes. Eur. Phys. J. Spec. Top. 2021, 230, 197–225. [Google Scholar] [CrossRef]
  120. Sasmal, S.; Chowdhury, S.; Kundu, S.; Politis, D.Z.; Potirakis, S.M.; Balasis, G.; Hayakawa, M.; Chakrabarti, S.K. Pre-seismic irregularities during the 2020 Samos (Greece) earthquake (M = 6.9) as investigated from multi-parameter approach by ground and space-based techniques. Atmosphere 2021, 12, 1059. [Google Scholar] [CrossRef]
  121. Hayakawa, M.; Izutsu, J.; Schekotov, A.; Yang, S.S.; Solovieva, M.; Budilova, E. Lithosphere-atmosphere-ionosphere coupling effects based on multiparameter precursor observations for February–March 2021 earthquakes (M~7) in the offshore of Tohoku area of Japan. Geosciences 2021, 11, 481. [Google Scholar] [CrossRef]
  122. Hayakawa, M.; Schekotov, A.; Izutsu, J.; Yang, S.S.; Solovieva, M.; Hobara, Y. Multi-parameter observations of seismogenic phenomena related to the Tokyo earthquake (M = 5.9) on 7 October 2021. Geosciences 2022, 12, 265. [Google Scholar] [CrossRef]
  123. D’Arcangelo, S.; Regi, M.; De Santis, A.; Perrone, L.; Cianchini, G.; Soldani, M.; Piscini, A.; Fidani, C.; Sabbagh, D.; Lepidi, S.; et al. A multiparametric-multilayer comparison of two geophysical events in the Tonga-Kermadec subduction zone: The 2019 M7.2 earthquake and 2022 Hunga Ha’apai eruption. Front. Earth Sci. 2023, 11, 12677411. [Google Scholar] [CrossRef]
  124. Zhang, X.; Liu, J.; De Santis, A.; Perrone, L.; Xiong, P.; Zhang, X.; Du, X. Lithoshere-atmosphere-ionosphere coupling associated with four Yutian earthquakes in China from GPS TEC and electromagnetic observations onboard satellites. J. Geodyn. 2023, 155, 101943. [Google Scholar] [CrossRef]
  125. Marchetti, D.; Zhu, Z.; Picsini, A.; Ghamry, E.; Shen, X.; Yan, R.; He, X.; Wang, T.; Chen, W.; Wen, J.; et al. Changes in the lithosphere, atmosphere and ionosphere before and after the Mw = 7.7 Jamaica 2020 earthquake. Remote Sens. Environ. 2024, 307, 114146. [Google Scholar] [CrossRef]
  126. Sasmal, S.; Chowdhury, S.; Kundu, S.; Ghosh, S.; Politis, A.Z.; Potirakis, S.M.; Hayakawa, M. Multi-parametric study of seismogenic anomalies during the 2021 Crete earthquake (M = 6.0). Ann. Geophys. 2024, 66, SE646. [Google Scholar] [CrossRef]
  127. Cianchini, G.; Calcara, M.; De Santis, A.; Piscini, A.; D’Arcangelo, S.; Fidani, C.; Sabbagh, D.; Orlando, M.; Perrone, L.; Campuzano, S.A.; et al. The preparation phase of the 2023 Kahramanmaras (Turkey) major earthquakes from a multidisciplinary and comparative perspective. Remote Sens. 2024, 16, 2766. [Google Scholar] [CrossRef]
  128. Zhang, X.; Chen, C.-H. Lithosphere–atmosphere ionosphere coupling processes for pre-, co-, and post-earthquakes. Atmosphere 2023, 14, 4. [Google Scholar] [CrossRef]
  129. Pilipenko, V.A.; Surkov, V. Seismoelectromagnetic and seismoionospheric phenomena: From the pioneering works to G. A. Sobolev to present. Phys. Solid Earth 2025, 61, 609–625. [Google Scholar] [CrossRef]
  130. Tachema, A. Identifying pre-seismic ionospheric disturbances using space geodesy: A case study of the 2011 Lorca earthquake (Mw5.1), Spain. Earth Sci. Inform. 2024, 17, 2055–2071. [Google Scholar] [CrossRef]
  131. Adhikari, B.; Klausner, V.; Cândido, C.M.N.; Poudel, P.; Gimenes, H.M.; Silwal, A.; Gautam, S.P.; Calabia, A.; Shah, M. Lithosphere-atmosphere-ionosphere coupling during the September 2015 Coquimbo earthquake. J. Earth System. Sci. 2024, 133, 35. [Google Scholar] [CrossRef]
  132. Hayakawa, M.; Hobara, Y. Integrated analysis of multi-parameter precursors to the Fukushima offshore earthquake (Mj = 7.3) on 13 February 2021 and lithosphere-atmosphere-ionosphere coupling channels. Atmosphere 2024, 15, 1015. [Google Scholar] [CrossRef]
  133. Chen, C.H.; Sun, Y.Y.; Zhang, X.; Gao, Y.; Yisimayili, A.; Qing, H.; Yeh, T.K.; Lin, K.; Wang, F.; Yen, H.Y.; et al. Double resonance in seismo-lithosphere-atmosphere-ionosphere coupling. Ann. Geophysics 2024, 66, SE641. [Google Scholar] [CrossRef]
  134. Rozhnoi, A.; Solovieva, M.; Molchanov, O.; Biagi, P.F.; Hayakawa, M. Observation evidences of atmospheric gravity waves induced by seismic activity from analysis of subionospheric LF signal spectra. Nat. Hazards Earth Syst. Sci. 2007, 7, 625–628. [Google Scholar] [CrossRef]
  135. Rapoport, Y.; Reshetnyk, V.; Grytsai, A.; Grimalsky, V.; Liashchuk, O.; Fedorenko, A.; Hayakawa, M.; Krankowski, A.; Błaszkiewicz, L.; Flisek, P. Spectral analysis and information entropy approaches to data of VLF disturbances in the waveguide Earth-ionosphere. Sensors 2022, 22, 8191. [Google Scholar] [CrossRef]
  136. Zhao, F.; Feng, P.; Qi, Z.; Cheng, L.; Wang, X.; Huang, L.; Liu, Q.; Chen, Y.; Ren, X.; Hua, Y. Investigation on the impact of the 2022 Luding M6.8 earthquake on regional low-frequency time code signals in northern China. Atmosphere 2024, 15, 1419. [Google Scholar] [CrossRef]
  137. Asai, S.; Yamamoto, S.; Kasahara, Y.; Hobara, Y.; Inaba, T.; Hayakawa, M. Measurement of Doppler shifts of short-distance subionospheric LF transmitter signals and seismic effects. J. Geophys. Res. 2011, 116, A02311. [Google Scholar] [CrossRef]
  138. Hayakawa, M.; Kasahara, Y.; Endoh, T.; Hobara, Y.; Asai, S. The observation of Doppler shifts of subionospheric LF signal in possible association with earthquakes. J. Geophys. Res. 2012, 117, A09304. [Google Scholar] [CrossRef]
  139. Hayakawa, M.; Schekotov, A.; Izutsu, J.; Nickolaenko, A.P.; Hobara, Y. Seismogenic ULF/ELF wave phenomena: Recent advances and future perspectives. Open J. Earthq. Res. 2023, 12, 45–113. [Google Scholar] [CrossRef]
  140. Heki, K. Ionospheric electron enhancement preceding the 2011 Tohoku-Oki earthquake. Geophys. Res. Lett. 2011, 38, L17312. [Google Scholar] [CrossRef]
  141. Heki, K.; Enomoto, Y. Preseismic ionospheric electron enhancements revisited. J. Geophys. Res. Space Phys. 2013, 118, 6618–6626. [Google Scholar] [CrossRef]
  142. Iwata, T.; Umeno, K. Preseismic ionospheric anomalies detected before the 2016 Kumamoto earthquake. J. Geophys. Res. Space Phys. 2017, 122, 3602–3616. [Google Scholar] [CrossRef]
  143. Eisenbeis, J.; Occhipinti, G. The TEC enhancement before seismic events is an artifact. J. Geophys. Res. Space Phys. 2021, 126, e2020JA028733. [Google Scholar] [CrossRef]
  144. Nina, A.; Biagi, P.F.; Pulinets, S.; Nico, G.; Mitrović, S.T.; Čadež, V.M.; Radovanović, M.; Urošev, M.; Popović, L.Č. Variation in the VLF signal noise amplitude during the period of intense seismic activity in Central Italy from 25 October to 3 November 2016. Front. Environ. Sci. 2022, 10, 1005575. [Google Scholar] [CrossRef]
  145. Nina, A.; Biagi, F.P.; Mitrovic, S.T.; Pulinets, S.; Nico, G.; Radovanovic, M.; Popovic, L.C. Reduction of the VLF signal phase noise before earthquakes. Atmosphere 2021, 12, 444. [Google Scholar] [CrossRef]
  146. Nina, A. VLF signal noise reduction during intense seismic activity: First study of wave excitations and attenuations in the VLF signal amplitude. Remote Sens. 2024, 16, 1330. [Google Scholar] [CrossRef]
  147. Silber, I.; Price, C. On the use of narrowband measurements to study the lower ionosphere and the mesosphere-lower thermosphere. Surv. Geophys. 2017, 38, 407–441. [Google Scholar] [CrossRef]
  148. Galopeau, P.H.M.; Maxworth, A.S.; Boudjada, M.Y.; Eichelberger, H.U.; Meftah, M.; Biagi, P.F.; Schwingenschuh, K. A VLF/LF facility network for preseismic electromagnetic investigations. Geosci. Instrum. Method Data Syst. 2023, 12, 231–237. [Google Scholar] [CrossRef]
  149. Malkotsis, F.; Politis, D.Z.; Dimakos, D.; Potirakis, S.M. An amateur-radio-based open-source (HW/SW) VLF/LF receiver for lower ionosphere monitoring, Examples of identified perturbations. Foundations 2022, 2, 639–663. [Google Scholar] [CrossRef]
  150. Molchanov, O.; Rozhnoi, A.; Solovieva, M.; Akentieva, O.; Berthelier, J.J.; Parrot, M.; Lefeuvre, F.; Biagi, P.F.; Castellana, L.; Hayakawa, M. Global diagnostics of the ionospheric perturbations related to the seismic activity using the VLF radio signals collected on the DEMETER satellite. Nat. Hazards Earth Syst. Sci. 2006, 6, 745–753. [Google Scholar] [CrossRef]
  151. Hayakawa, M. Whistlers. In Handbook of Atmospheric Electrodynamics; Volland, H., Ed.; CRC Press: Boca Raton, FL, USA, 1995; Volume II, pp. 155–193. [Google Scholar]
  152. Hayakawa, M.; Hobara, Y. The Effects of Lightning on the Ionosphere/Magnetosphere: Whistlers and Ionospheric Alfven Resonator. In Lightning Electromagnetics; Cooray, V., Rachidi, F., Rubinstein, M., Eds.; IET: London, UK, 2022; pp. 475–525. [Google Scholar]
  153. Muto, M.; Yoshida, T.; Horie, M.; Hayakawa, M.; Parrot, M.; Molchanov, O.A. Detection of ionospheric perturbations associated with Japanese earthquakes on the basis of reception of LF transmitter signals on the satellite DEMETER. Nat. Hazards Earth Syst. Sci. 2008, 8, 135–141. [Google Scholar] [CrossRef]
  154. Rozhnoi, A.; Solovieva, M.; Molchanov, O.; Biagi, P.F.; Hayakawa, M.; Schwingenschuh, K.; Boudjada, M.; Parrot, M. Variations of VLF/LF signals observed on the ground and satellite during a seismic activity in Japan region in May–June 2008. Nat. Hazards Earth Syst. Sci. 2010, 10, 529–534. [Google Scholar] [CrossRef]
  155. Boudjada, M.Y.; Schwingenschuh, K.; Doller, R.; Rozhnoi, A.; Parrot, M.; Biagi, P.F.; Galopeau, P.H.M.; Solovieva, M.; Molchanov, O.; Biernat, K.; et al. Decrease of VLF transmitter signal and chorus-whistler waves before l’Aquila earthquake occurrence. Nat. Hazards Earth Syst. Sci. 2010, 10, 1487–1494. [Google Scholar] [CrossRef]
  156. Slominska, E.; Blecki, J.; Parrot, M.; Slominski, J. Satellite study of VLF ground-based transmitter signals during seismic activity in Honshu island. Phys. Chem. Earth 2009, 34, 464–473. [Google Scholar] [CrossRef]
  157. Rozhnoi, A.; Solovieva, M.; Parrot, M.; Hayakawa, M.; Biagi, P.F.; Schwingenschuh, K.; Fedun, V. VLF/LF signal studies of the ionospheric response to strong seismic activity in the Far Eastern region combing the DEMETER and ground-based observations. Phys. Chem. Earth 2015, 141, 85–86. [Google Scholar] [CrossRef]
  158. Li, Z.; Chen, Z.; Huang, J.; Li, X.; Han, Y.; Yang, X.; Li, Z. Study on VLF electric field anomalies caused by seismic activity on the Western coast of the Pacific Rim. Atmosphere 2023, 14, 1676. [Google Scholar] [CrossRef]
  159. Nemec, F.; Santolík, O.; Parrot, M.; Berthelier, J.J. Spacecraft observations of electromagnetic perturbations connected with seismic activity. Geophys. Res. Lett. 2008, 35, L05109. [Google Scholar] [CrossRef]
  160. Nemec, F.; Santolík, O.; Parrot, M. Decrease of intensity of ELF/VLF waves observed in the upper ionosphere close to earthquakes. J. Geophys. Res. 2009, 114, A04303. [Google Scholar] [CrossRef]
  161. Pisa, D.; Nemec, F.; Santolik, O.; Parrot, M.; Rycroft, M. Additional attenuation of natural VLF electromagnetic waves observed by the DEMETER spacecraft resulting from preseismic activity. J. Geophys. Res. Space Phys. 2013, 118, 5286–5295. [Google Scholar] [CrossRef]
  162. Nickolaenko, A.P.; Hayakawa, M. Resonances in the Earth–Ionosphere Cavity; Kluwer Academic Publishers: Dordrecht, The Netherlands, 2002; 381p. [Google Scholar]
  163. Harrison, R.G.; Alpin, K.; Rycroft, M. Atmospheric electricity coupling between earthquake regions and the ionosphere. J. Atmos. Sol. Terr. Phys. 2010, 72, 376–381. [Google Scholar] [CrossRef]
  164. Ghosh, S.; Chakraborty, S.; Sasmal, S.; Basak, T.; Chakrabarti, S.K.; Samanta, A. Comparative study of the possible lower ionospheric anomalies in very low frequency (VLF) signal during Honshu, 2011 and Nepal, 2015 earthquakes. Geomat. Nat. Hazards Risk 2019, 10, 1596–1612. [Google Scholar] [CrossRef]
  165. Biswas, S.; Chowdhury, S.; Sasmal, S.; Politis, D.Z.; Potirakis, S.M.; Hayakawa, M. Numerical modelling of sub-ionospheric Very Low Frequency radio signal anomalies during the Samos (Greece) earthquake (M = 6.9) on October 30, 2020. Adv. Space Res. 2022, 70, 1453–1471. [Google Scholar] [CrossRef]
  166. Politis, D.Z.; Potirakis, S.M.; Sasmal, S.; Malkotsis, F.; Dimakos, D.; Hayakawa, M. Possible pre-seismic indications prior to strong earthquakes that occurred in Southeastern Mediterranean as observed simultaneously by three VLF/LF stations installed in Athens (Greece). Atmosphere 2013, 14, 673. [Google Scholar] [CrossRef]
  167. Hayakawa, M.; Solovieva, M.; Kopylova, G.; Hirooka, S.; Sasmal, S.; Nanda, K.; Yang, S.S.; Michimoto, K.; Hinata, H. Multi Parameter and Multi Layer Observations of Electromagnetic Precursors to a Large Hokkaido Earthquake (M = 6.7) on 5 September 2018, and Lithosphere–Atmosphere–Ionosphere Coupling Channel. Atmosphere 2025. submitted. [Google Scholar]
  168. Varotsos, P.A.; Sarlis, N.V.; Skordas, E.S. Natural Time Analysis: The New Concept of Time; Springer: Berlin/Heidelberg, Germany, 2011; 449p. [Google Scholar]
  169. Uyeda, S.; Nagao, T.; Hattori, K.; Hayakawa, M.; Miyaki, K.; Molchanov, O.; Gladychev, V.; Baransky, L.; Chtchekotov, A.; Fedorov, E.; et al. Geophysical Observatory in Kamchatka region for monitoring of phenomena connected with seismic activity Geophysical Observatory in Kamchatka region for monitoring of phenomena connected with seismic activity. Nat. Hazards Earth Syst. Sci. 2001, 1, 3–7. [Google Scholar] [CrossRef]
  170. Chen, C.H.; Sun, Y.Y.; Lin, K.; Zhou, C.; Xu, R.; Qing, H.; Gao, Y.; Chen, T.; Wang, F.; Yu, H.; et al. A new instrumental array in Sichuan, China, to monitor vibrations and perturbations of the lithosphere, atmosphere, and ionosphere. Surv. Geophys. 2021, 42, 1425–1442. [Google Scholar] [CrossRef]
  171. Anagnostopoulos, G. On the origin of ULF magnetic waves before the Taiwan Chi-Chi 1999 earthquake. Front. Earth Sci. 2021, 9, 730162. [Google Scholar] [CrossRef]
  172. Raulin, J.P.; Bertoni, F.C.; Kaufmann, P.; Gavilan, H.R.; Correia, E.; Hadano, R.; Schuch, N.J. Solar-terrestrial, ionospheric and natural phenomena studies using the South America VLF network (SAVNET). J. Atmos. Sol. Terr. Phys. 2010, 73, 1581–1586. [Google Scholar] [CrossRef]
Figure 1. (a) Location of the VLF transmitter (Omega, Tsushima) and receiver (Inubo) (together with the EQ epicenter (as a cross)) and the first Fresnel zone (an ellipse); (b) sequential plot of diurnal variations in phase measurement at Inubo of Tsushima Omega transmission (f = 10.2 kHz) around the time of the Kobe EQ (on 17 January) with a star. A significant change is seen in the terminator times (as shaded area) just before the EQ. After [20].
Atmosphere 16 01312 g001
Figure 2. The change in terminator time (of local evening) for a longer period (±4 months around the EQ). A significant change (exceeding 2σ line) is seen only before the EQ (17 January), indicated by a downward arrow. Similar variation is also obtained for the amplitude data. After [21], with permission of AGU.
Atmosphere 16 01312 g002
Figure 3. An example of enhancement of the planetary-wave atmospheric oscillations with periods of 5 days and 9–11 days for the same Kobe EQ (indicated by a black triangle on the time axis). An upward arrow indicates the presence of an island enhancement of 5 day modulation. After [21] with permission of AGU.
Atmosphere 16 01312 g003
Figure 4. VLF/LF wave-hop analysis modeling, including the ground and sky waves. Upper panel indicates the propagation scheme, and the lower panel presents a phasor diagram to obtain the resultant signal. After [23].
Atmosphere 16 01312 g004
Figure 5. Formation of terminator times as a function of lowering height of the lower ionosphere for the propagation path from JJY (40 kHz, Fukushima) to Kochi on Shikoku Island. The full line refers to the quiet ionosphere, while the broken line refers to the perturbed ionosphere (3 km downward shift in reflection height) and the chain line refers to the disturbed ionosphere with reflection height 3 km lifted upward. The ionospheric reflection height is found to lead to a change in terminator times. After [23].
Atmosphere 16 01312 g005
Figure 6. The sequential plot of the amplitudes of the VTX signal as a function of time in seconds (one day) for eleven consecutive days. Days are stacked by an amplitude shift of 30 units. The points TA, TC, TD, and TB are denoted on the first day, and DLPT = TC − TA and DLDT = TB − TD. An EQ with M6.0 occurred on 22 January 2008. After Chakrabarti et al. (2010) [29].
Atmosphere 16 01312 g006
Figure 7. The plot shows the average variations in the DLPT (filled circles) and DLDT (filled squares) using the 14 EQs with magnitude greater than 5.0. The error bars are standard deviations for those 14 EQs. After [29].
Atmosphere 16 01312 g007
Figure 8. VLF/LF network in and around Japan. Several VLF/LF observing stations indicated by stars (Moshiri (abbreviated as MSR), Chofu (CHF), Tateyama, Chiba (TYM), Kasugai (KSG), and Kochi (KCH)) and several VLF/LF transmitter signals detected at each station. The two Japanese transmitters of JJY and JJI are indicated by rhombi. Kamchatka (KCK) and Taiwan (TWN) stations are also illustrated.
Atmosphere 16 01312 g008
Figure 9. Map showing the locations of receivers and VLF/LF transmitters of the INFREP network. The stars show the location of the receivers; the circles indicate the transmitters (blue, VLF; red, LF), the signals of which are collected by the different receivers (after [83]).
Atmosphere 16 01312 g009
Figure 10. Two examples of wavelet power spectra; the top panel refers to a normal situation, and the bottom panel corresponds to an anomalous period with an anomaly. After [83].
Atmosphere 16 01312 g010
Figure 11. Location of a radio transmitter (JJY) and the receiver at Kamchatka, together with the EQ (M ≥ 4) epicenters for the period of 2001–2002. The inset illustrates the histograms of EQ distribution versus depth (H) and M. The first Fresnel zone is plotted. After [78].
Atmosphere 16 01312 g011
Figure 12. Dependence of amplitude and phase anomaly on EQ magnitude during 2001–2002 for the period from 10 days before to 10 days after the EQ time. Top of the float bar is the number of days in the interval of M (N). Bottom of the float bar is the number of days in the same interval with data exceeding σ (Ni). Solid line is Ni/N, and dotted line is the average of Ni/N + 2σ. After [78].
Atmosphere 16 01312 g012
Figure 13. Relative location of the LF transmitter, JJY in Fukushima, and an observing station, Kochi. The sensitive area for this LF propagation path is also indicated as the circles with radii of 200 km around the transmitter and receiver, and by connecting the outer edges of these two circles. Also, 92 EQs with conventional magnitude (M) greater than 5.0 are plotted as orange dots, which took place within the sensitive area. After [87].
Atmosphere 16 01312 g013
Figure 14. Statistical test results for the amplitude (a) and dispersion (b). The day on the abscissa is defined as follows: day zero indicates the day of the EQ, and minus (plus) means that the phenomenon takes place before (after) the EQ. The important 2σ (σ: standard deviation) lines are plotted for the statistical test. After [87].
Atmosphere 16 01312 g014
Figure 15. Propagation paths of the American transmitter NLK signals as observed at the observing stations of Chofu (CHF), Kasugai (KSG), and Kochi (KCH). The Fresnel zone is plotted only for the NKL-CHF propagation path. Two Japanese transmitters of JJY and JJI and the propagation path of JJY-MSR are plotted for reference. The epicenter of the Tohoku EQ is given by 2011/3/11. Another former EQ of 2005/8/16 was plotted for reference. After [101].
Atmosphere 16 01312 g015
Figure 16. Propagation characteristics for the propagation path of NLK-CHF. The top panel illustrates the temporal evolution of trend, nighttime averaged amplitude normalized by the standard deviation, and the bottom panel refers to the fluctuation. An extremely enhanced depletion in nighttime amplitude is observed on 5 and 6 March 2011 (with pink dates). After [101].
Atmosphere 16 01312 g016
Figure 17. Fundamental LAIC channels: chemical, acoustic, and electromagnetic channels [32].
Atmosphere 16 01312 g017
Figure 18. Relative location of the JJY transmitter (T) and receiving stations (Moshiri (M) and Kamchatka (K)). The third Fresnel zones are plotted for T-M and T-K. The epicenters of rather big EQs are given by white circles. After [93].
Atmosphere 16 01312 g018
Figure 19. Daily amplitude data measured at Kamchatka (K) (left) and Moshiri (M) (right) around the date of the Tokachi-oki EQ. A lot of nighttime fluctuations are observed before the date of EQ (25 September). After [93].
Atmosphere 16 01312 g019
Figure 20. Synchronous 16-day wave packets observed in variations in the signals received in Moshiri (M) (upper curve) and in Petropavlovsk–Kamchatski (K) (lower curve) before the Tokachi EQ indicated by a vertical dotted line. After [93].
Atmosphere 16 01312 g020
Figure 21. Positions of the EQ epicenters for 3 periods of strong seismic activity during the 2004–2006 period, and the use of the propagation path from JJY, Japan, to Petropavlovsk–Kamchatka, Russia. After [134].
Atmosphere 16 01312 g021
Figure 22. Normalized spectra of amplitude (left panel) and phase (right panel) of the LF JJY signal for three series of EQs. (a) November–December 2004—red line; (b) August 2005—pink line; (c) November 2006—blue line. Black line—averaged spectrum of 19 quiet days. Differences in spectra density between seismically active and quiet days for three series of EQs are shown in panel (d). Colors of lines correspond to the colors on panels (ac). After [134].
Atmosphere 16 01312 g022
Table 1. Labels and frequencies of the VLF/LF transmitters used in the INFREP network.
VLFFrequency (kHz)LFFrequency (kHz)
GBZ19.58RRO153
ICV20.27FRI162
HWU21.75EU1183
DHO23.4CH1198
TBB26.7MCO216
ICE37.5RRU261
NSY45.9CZE270
Disclaimer/Publisher’s Note: The statements, opinions and data contained in all publications are solely those of the individual author(s) and contributor(s) and not of MDPI and/or the editor(s). MDPI and/or the editor(s) disclaim responsibility for any injury to people or property resulting from any ideas, methods, instructions or products referred to in the content.