Article

Changes in Magnitude and Shifts in Timing of the Latvian River Annual Flood Peaks

1
Department of Geography, Faculty of Science and Technology, University of Latvia, 1 Jelgavas Street, LV-1004 Rīga, Latvia
2
Latvian State Forest Research Institute “Silava”, 111 Rīgas Street, LV-2169 Salaspils, Latvia
3
Latvian Environment, Geology and Meteorology Centre, 165 Latgales Street, LV-1019 Rīga, Latvia
*
Author to whom correspondence should be addressed.
Atmosphere 2024, 15(9), 1139; https://doi.org/10.3390/atmos15091139
Submission received: 19 August 2024 / Revised: 4 September 2024 / Accepted: 18 September 2024 / Published: 20 September 2024
(This article belongs to the Special Issue The Hydrologic Cycle in a Changing Climate)

Abstract

:
Climate change is expected to significantly impact temperature and precipitation, as well as snow accumulations and melt in mid-latitudes, including in the Baltic region, ultimately affecting the quantity and seasonal distribution of streamflow. This study aims to investigate the changes in the magnitude and timing of annual maximum discharge for 30 hydrological monitoring stations across Latvia from 1950/51 to 2021/22. Circular statistics and linear mixed effects models were applied to identify the strength of seasonality and timing. Trend analysis of the magnitude and timing of flood peaks were performed by using the Theil–Sen method and Mann–Kendall test. We analyzed regional significance of trends across different hydrological regions and country using the Walker test. Results indicate strong seasonality in annual flood peaks in catchments, with a single peak occurring in spring in the study sub-period of 1950/51–1986/87. Flood seasonality has changed over recent decades (i.e., 1987/88–2021/22) and is seen as a decrease in spring maximum discharge and increase in winter flood peaks. Alterations in annual flood occurrence also point towards a shift in flow regime from snowmelt dominated to mixed snow–rainfall dominated, with consistent changes towards the earlier timing of the flood peak, with a more or less pronounced gradation from west to east. Analysis shows that a significant trend of decrease in the magnitude and timing of annual maximum discharge was detected.

1. Introduction

Floods are natural phenomena, which can provide benefits to the environment. Floodplains and wetlands created and maintained by river floods provide unique habitats for a diverse range of flora and fauna. At the same time, floods are also natural disasters, which may lead to mortality and extensive damage to property and infrastructure [1]. Increased understanding of the flood phenomena can lead to more sustainable and resilient management of riverine and floodplain environments. Global warming due to climate change has been attributed to the increase in floods and related risks, as a warming climate has the potential to influence hydrological cycling on various scales: the global, continental, regional and local. The IPCC (2023) [2] report notes that global surface temperature was 1.09 °C higher in 2011–2020 compared to 1850–1900, with a higher increase in land areas (1.59 °C) than over oceans (0.88 °C). Additionally, the temperature rises since 1970 have been the fastest in any 50-year period over the last 2000 years.
The Baltic Sea basin, where the Baltic States, including Latvia, Estonia and Lithuania belong, is among the most sensitive regions in the world to global warming, which was stated in the first BACC [3] assessment and is still valid in the current situation [4]. More frequent extreme events in the future are likely to affect river flow timing and magnitude. Understanding and predicting flood peaks is crucial for water resources management, flood risk assessment and the evaluation of collateral climate change impacts [1,2,5,6]. Flood seasonality, a key aspect of the annual hydrograph, characterizes streamflow distribution throughout the year. Understanding changes in flood regimes and their drivers is essential for water management, hydropower, drinking water supply and river basin planning, including flood management [7,8].
These above-mentioned factors have spurred numerous studies on climate warming’s impact on hydrological processes. For example, Wasko et al. [9] analyzed floods and streamflow timing using data from 4472 global sites from the Global Runoff Data Centre. The analysis of global flood timing and its correlation with climate and topography, conducted by Torre Zaffaroni P. et al. [10], reveals that climatic factors predominantly influence flood timings. The findings indicate seasonally driven and predictable fluctuations in flood timing within cold regions; interannual and mixed patterns in temperate climates; and more irregular, highly variable and less seasonally predictable patterns in arid regions.
On the continental scale, the comprehensive study across Australia by Bari et al. [1] analyzed changes in the magnitude and timing of the largest annual observed daily flow in every water year for 596 stations. Recently, many studies have been conducted in North America such as for United States by Villarini et al. [8], Slater et al. [11], Ye et al. [12], Dhakal et al. [13] and for Canada by Beauchamp et al. [14], Henstra and Thistlethwaite [15], Zadeh et al. [16]. These studies have mainly investigated the temporal variation of flood timing, frequency and magnitude and the trends in magnitude and spatial variation.
Since 2014, a comprehensive study in Europe has addressed increasing concerns about the frequency and severity of floods [17]. A joint European flood change research network facilitated numerous studies over the past decade. Mediero et al. [18] compiled a dataset from 25 European countries, using flow series from 102 gauging stations to study flood event clustering. Research by Hall et al. [19], Blöschl et al. [20], Hall and Blöschl [21], Blöschl et al. [22] and Bertola et al. [23] utilized the European Flood Database (1960–2010) to analyze flood magnitude, timing, trends and seasonality across five regions. Findings indicated earlier spring floods in North East Europe due to earlier snowmelt, and earlier soil moisture maxima in Western Europe. Trends showed increasing flood magnitudes in North West Europe, but decreasing trends in South and East Europe.
In the Baltic Sea region, national-level studies on maximum flows have been conducted in Finland [24,25], Sweden [26], Poland [27] and the Baltic States. Latvia, part of the North East or East European region, has been included in these studies [20,21,22,23]. The long-term changes and variability in river discharge, including annual maximum discharge, in Latvia have been analyzed by many authors within the context of the Baltic countries [28,29,30], and within the context of a single country (e.g., [31,32,33,34]). The latest studies on the temporal variation and pattern changes of spring floods in Baltic States were conducted by Reihan et al. [35] and by Sarauskiene et al. [36], using long-term data series up to 2008 and 2010, respectively.
This study is a new contribution based on the scientific interest in finding out whether hydro-meteorological events over the last 12–14 years have changed the timing and magnitude for peaks of annual flows of 30 river hydrological stations from 24 catchments. In order to answer this question, the objective of our study is to find out the seasonal and long-term trends and shifts of the date of the annual maximum discharge of Latvian rivers and the peculiarities in magnitude from 1950/1951–2021/2022 for the hydrological year. Unlike previous researches, this study represents an additional contribution as follows: the extended series of annual maximum flows have been evaluated by using the hydrological year and hydrological region breakdown for the territory of Latvia; a comparison of two different hydro-meteorological periods (1950/51–1986/87 and 1987/88–2021/22) was conducted to investigate more recent changes and to address how climate change has affected the annual maximum discharge of rivers in Latvia; the seasonality of flood events and how it has changed during last decades has been investigated; the seasonality and magnitude of floods over time and their statistical significance on the regional scale and in Latvia as a whole have been clarified. The results of this study contribute to the understanding of the substantial changes in the hydrological cycle occurring in hemi-boreal regions and provide valuable knowledge on the river basin and flood management.

2. Material and Methods

2.1. Study Area

Situated at the northern edge of the mid-latitudes (Figure 1), Latvia exhibits a hemi-boreal forest landscape. Its climate is influenced by both its location in the northwestern part of the Eurasian continent (continental) and its proximity to the Atlantic Ocean (maritime). A characteristically high degree of cyclonic activity defines variable weather patterns [37].
In Latvia, the mean annual air temperature for the climatological standard normal period (1991–2020) is 6.8 °C, exhibiting spatial variation between 5.7 °C and 8.0 °C. July is the month with the highest average air temperature (17.8 °C), with territorial variations ranging from 17.1 °C to 19.4 °C. Conversely, February exhibits the lowest average air temperature (−3.1 °C), varying spatially from −1.1°C to −5.1°C. Notably, February temperatures demonstrate a meridional distribution, with a decreasing influence of oceanic air masses observed from west to east.
Latvia exhibits a mean annual precipitation of 686 mm, characterized by significant spatio-temporal variability. The months of August and July are the wettest, averaging 76.8 mm and 75.7 mm, respectively, while April is the driest (35.8 mm) (LEGMC: https://videscentrs.lvgmc.lv/lapas/latvijas-klimats, accessed 2 July 2024).
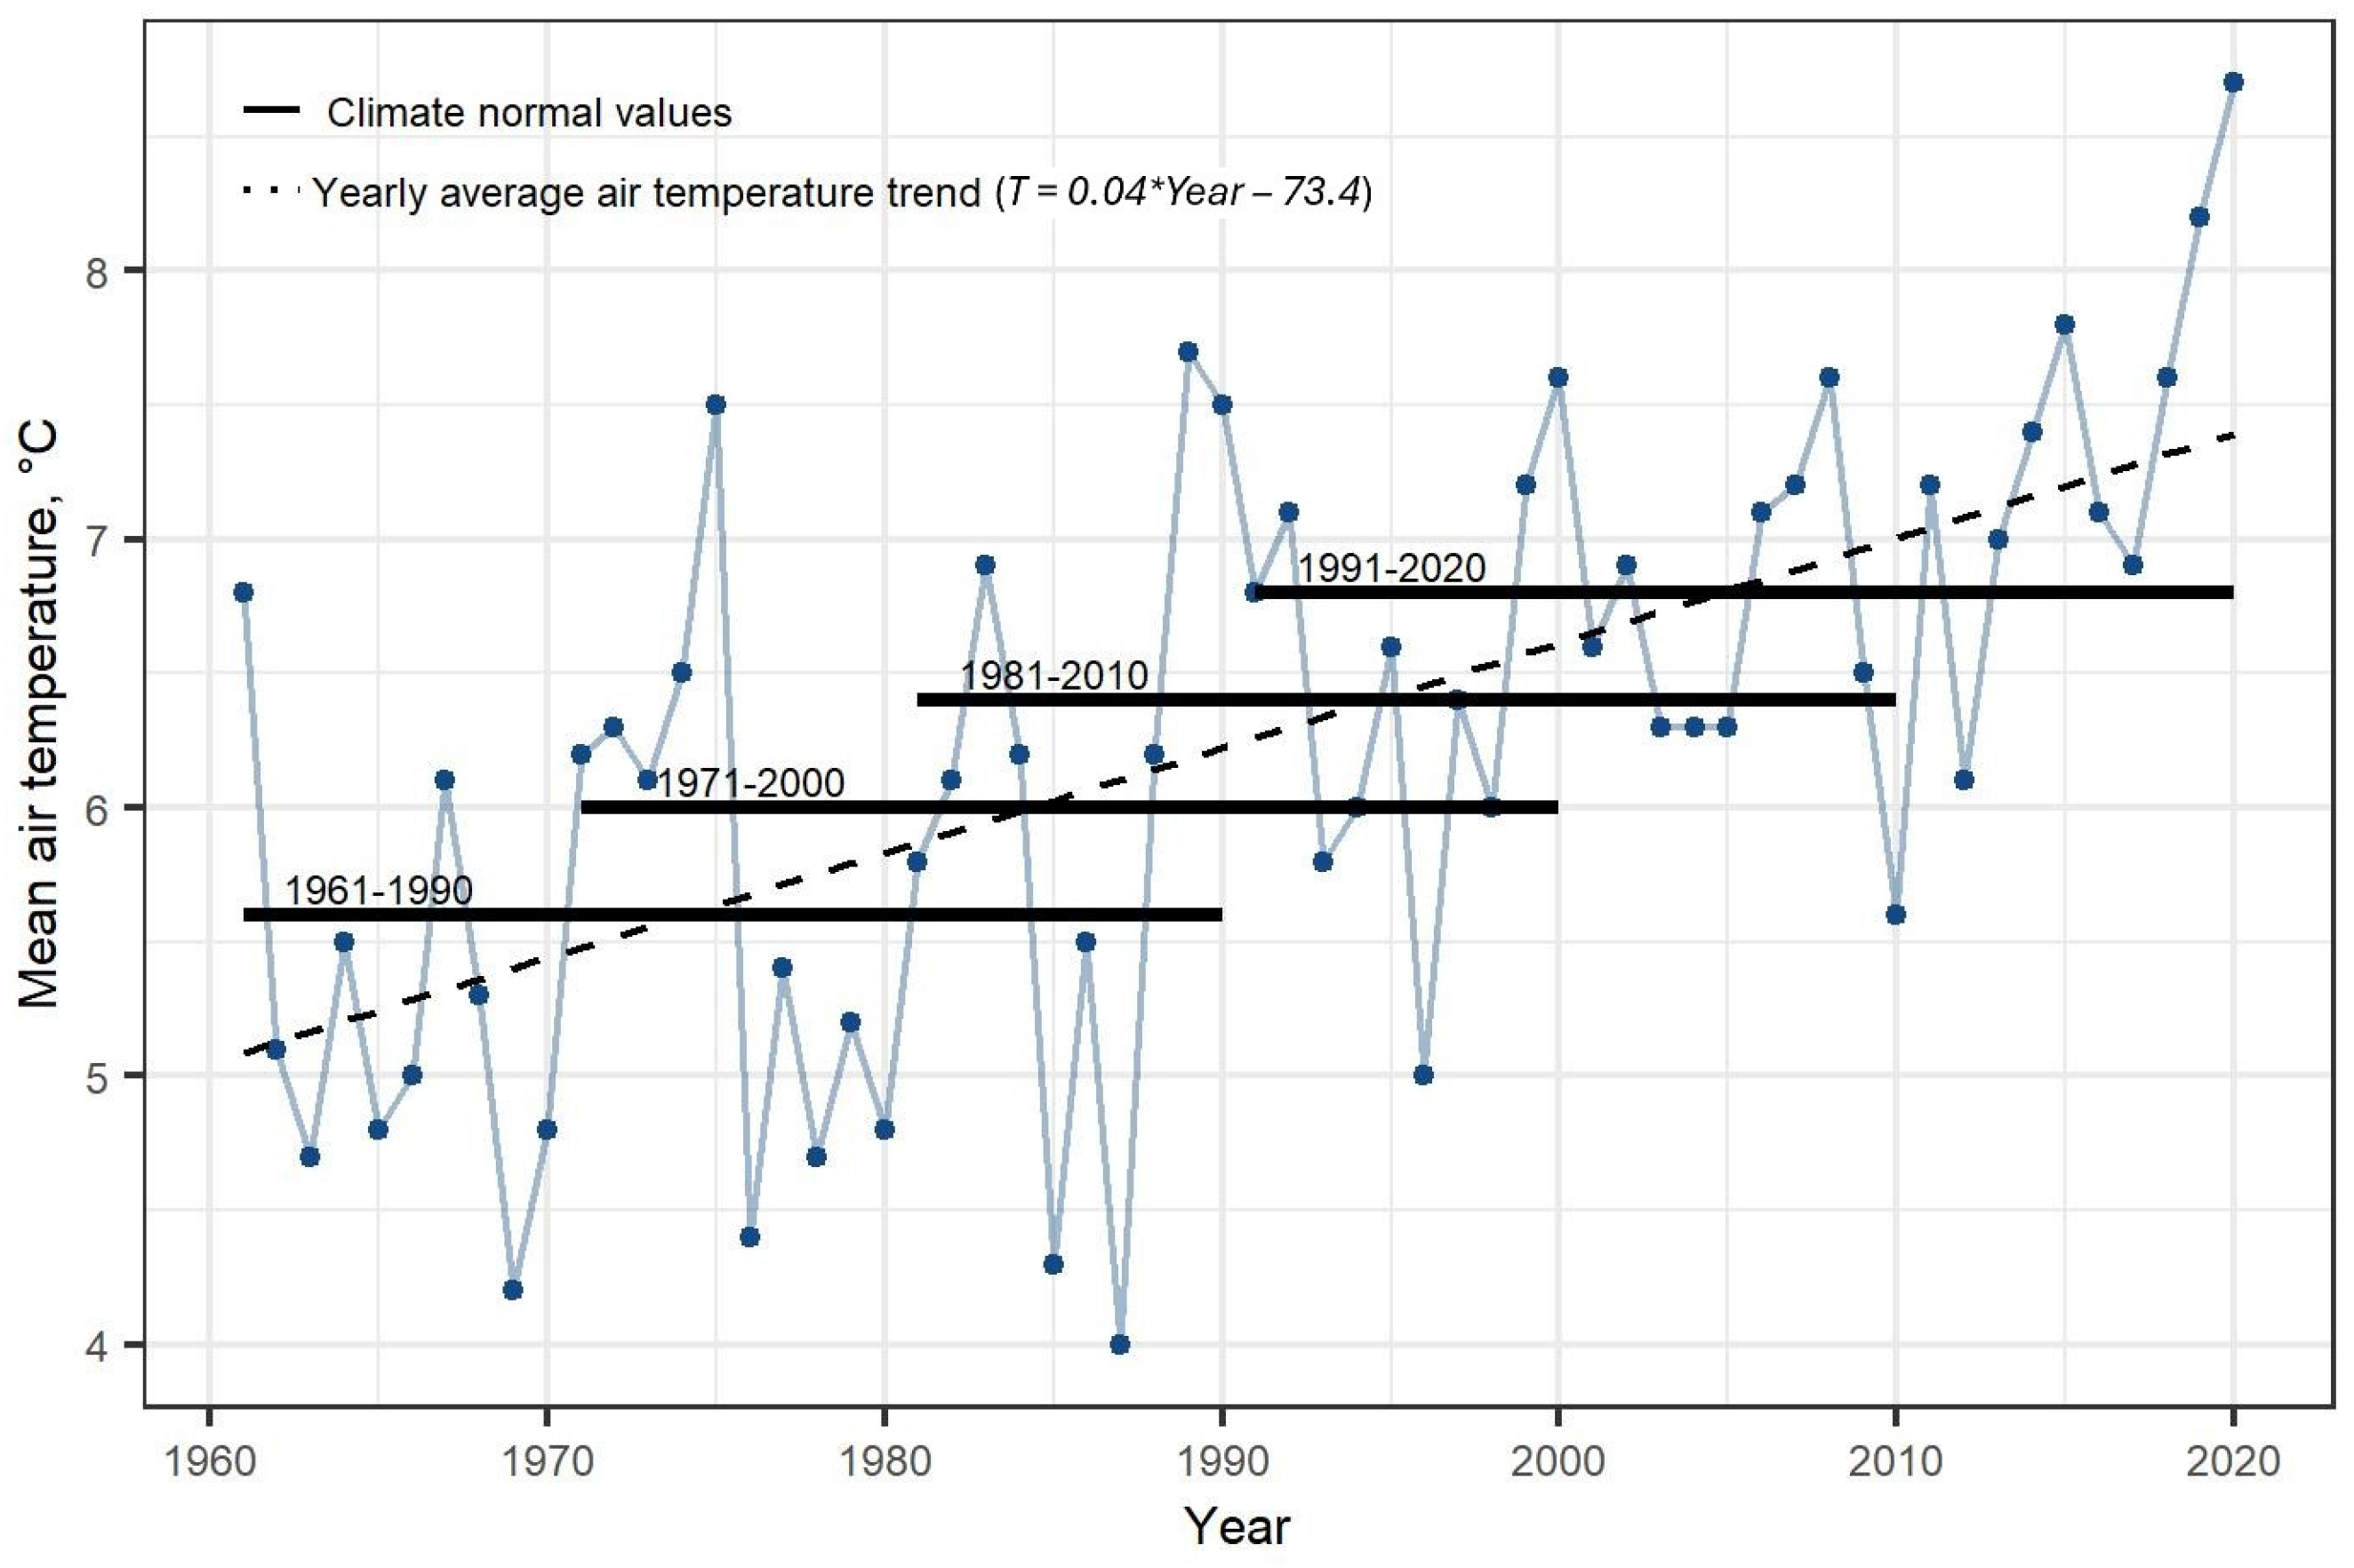
Recent studies [38,39] provide compelling evidence for ongoing climate change in Latvia. This is demonstrably reflected in the altered air temperature distribution observed during preceding climatological standard normal periods (1971–2000; 1981–2010) or the standard reference period (1961–1990) (Figure 2).
Compared to the standard reference period, the annual mean temperature in the last climate normal was 1.2 °C higher across Latvia, corresponding to a warming rate of +0.4 °C decade−1, which is greater than the European average (between 0.17 and 0.22 °C decade−1). Compared to the standard reference period, a persistent rise of winter (DJF) temperatures by around 2 °C and a rapid increase in the easternmost locations (distant from the sea) were found. Summer (JJA) and spring (MAM) temperatures rose by around 1 °C. The autumn (SON) temperature increase was less pronounced and was only evident during the last two climate normals [39].
Overall, annual precipitation tends to increase over the period 1951–2020 [40]. The amount of precipitation has statistically significantly increased in 18 out of 25 time series of observation stations. Winter (DJF) displays the most significant rise, particularly in January and February. A study of snow cover changes across the Baltic States by Rimkus et al. [41] showed that snow cover duration generally decreased throughout the winter in the study period of 1961–2015. At the same time, the largest negative changes in snow cover were observed in December and March, while the only statistically significant trend was recorded in April.
Latvian river runoff regime is shaped by a complex interplay of physical and geographical factors. These factors encompass basin location and topography; climate; geology; soil characteristics; land cover (the presence of forest, wetland and lakes); and human activity. Their influence varies, but all contribute to river behavior and can change over time. The annual cycle exhibits two high-water periods: spring snowmelt floods (peaking March–April) and autumn rain events. Conversely, winter and summer are low-water periods (Figure 3). Recent climate warming has increased winter runoff but decreased spring flood runoff. Summer low-water periods remain stable. Notably, intense rainfall or early snowmelt can trigger high discharge events throughout the warm period, as observed in recent years [42].
The average water balance in Latvia (1951–1994) is as follows: atmospheric precipitation 703 mm, evaporation 458 mm and runoff 245 mm. Consequently, only approximately 35% of precipitation contributes directly to river runoff [43].
This study utilizes Glazacheva’s [44] classification of hydrological regions of the territory of Latvia (Figure 1 and Figure 3). It divides the country into four river basin groups based on a complex analysis of discharge regimes and physical geography. Western region (Group I): the River Venta and coastal rivers exhibit a stronger influence from the North Atlantic Ocean and the Baltic Sea processes. Shorter ice cover and earlier spring floods occur. Winter and autumn rainfall contribute a higher proportion of annual runoff compared to other regions. Central region (Group II): geology and climate shape the River Lielupe basin’s hydrology and dense network. Spring floods arrive later than the west, but winter runoff remains higher than groups III and IV. Northern region (Group III): the rivers Salaca, Gauja and eastern rivers of the Gulf of Riga experience the highest annual precipitation and runoff. Eastern region (Group IV): small and medium-sized rivers in the rivers Daugava and Veļikaja basins display a more continental climate. Spring floods initiate later and have a longer duration [33,44].

2.2. Data

This study utilizes daily discharge data (Q, m3s−1) from 30 river monitoring stations encompassing 24 river catchments (Figure 3). Daily discharge data is a readily available and practical form of hydrological information. The data was obtained from the Latvian Environment, Geology and Meteorology Centre (LEGMC). These stations provide high-quality, long-term daily streamflow records suitable for detecting trends and variability in streamflow.
The analysis focuses on changes in long-term annual maximum discharge (Qmax) and its timing, derived from the calculated daily flow based on water level data (Table 1). To ensure robust long-term trend analysis, data series were extended in some cases. Missing data (6% of the total database) was were either filled from Zīverts and Strūbergs [43] or imputed using multiple linear regression. In the multiple linear regression model, all other stations that had data for particular station’s missing period, and which had significant regression coefficients were included. The coefficient of determination (r2) for these imputations ranged from 0.85 to 0.98, indicating a strong positive correlation.
We completed the analysis based on the hydrological water year in the period of 1950/51–2021/22. A hydrological water year is defined as October 1 to September 31 of the following year. This is commonly used for regions where streamflow is dominated by rainfall and snowmelt, because it makes it possible to allocate peak streamflow in the correct year. (International Glossary of Hydrology, World Meteorological Organization No 385: https://library.wmo.int/viewer/35589/?offset=#page=181&viewer=picture&o=search&n=0&q=YEAR, accessed 8 February 2024).
Runoff variations during the study period can be attributed to several factors, with climate change being a primary driver of hydrological processes. In cold regions, significant alterations in cold season conditions, particularly snow cover patterns, have demonstrably impacted the magnitude and timing of spring floods. It is important to acknowledge that other potential influences on Qmax may have occurred within the river basins over time, although their effects were not analyzed in this study. These potentially influential factors include: land-use changes over time and various forms of anthropogenic influence, including that of artificial drainage systems. The development of melioration systems (land drainage for agriculture) within the analyzed period has been dynamic. Initially, these systems were extensively constructed and maintained. However, a period of neglect followed, leading to system collapse. In recent years, efforts have been made to revive these systems.

2.3. Methods

2.3.1. Flood Seasonality

The study period was divided into two sub-periods: 1950/51–1986/87, with no significant climate change impact, and 1987/88–2021/22, with substantial climate change effects. This division is based on studies indicating shifts in atmospheric circulation, notably increased westerly circulation in winter from the mid-1980s, marking 1987 as a climate turning point. Subsequent studies confirmed the occurrence of warmer winters and early snowmelt since circa 1988, influenced by the Arctic and the North Atlantic Oscillations, which led to significant hydrological regime shifts in the Baltic region [40,45,46,47,48].
Seasons were defined in 3 months periods, as this is usual in hydro-climatological studies: spring (MAM), summer (JJA), autumn (SON) and winter (DJF).
We have used 3 approaches for the analysis of the flood seasonality: (1) mathematical calculations; (2) circular statistics; and (3) linear mixed effects models.
(1) Adding up the number of Qmax observations for the year in each month and calculating the percentage distribution of the total number of observations. Next, percentage points were calculated as the difference between the two studied periods (1987/88–2021/22 and 1950/51–1986/87).
(2) Circular or directional statistics are often applied when investigating flood peaks and timing, as these exist on a cyclical continuum [1,8,49]. This allows determining whether annual maximum daily flows occur around a certain time in the year and thus exhibit strong seasonality, or if occurrences of annual maximum daily flows are more spread out across a year [7]. Circular statistics are based on the concept that data (such as the day of the occurrence of the maximal discharge considered here) can be presented on the circumference of a unit circle, providing both a graphical as well as a statistical measure for analysis [49]. For that, each day is converted to radian angles and displayed on the circumference of a unit circle where each month represents an equal segment of the circle [50]. A hydrological year starts on October 1 at 0° (North direction) of a compass or circle and moves clockwise (e.g., January 1 is at 90°).
Generally, circular statistics are based on the null hypothesis—that the data is evenly distributed around the circle (known as uniformity) and shows no propensity for clustering in a dominant direction [49]. The hypothesis of circular uniformity can be tested by using the Rayleigh test. This test was also used, due to a prior assumption, to demonstrate that snowmelt-dominated catchments show strong seasonality and thus non-uniformity with one single peak of departure from uniformity [7]. If the null hypothesis is rejected, the data departs from uniformity and must be tested further for whether it possesses an asymmetric or reflective symmetric appearance using the asymptotic large-sample test for reflective symmetry with an unknown mean direction presented by Pewsey et al. [49]. The test was performed at the 5% significance level using R package circular [51].
(3) Linear mixed effects models, as implemented in R packages lme4 [52] and lmerTest [53], were used to compare the maximum Q-day values for two time periods (1950/51–1986/87 and 1987/88–2021/22). Analysis was performed for each region separately, and for the country as a whole. River station names were used as a random factor in all models to account for repeated measures. The model form was as follows:
y i j = μ + P + s t a t i o n j + ε i j ,
where μ refers to the overall mean maximum Q-day value, P refers to fixed effect of period (with two levels—1950/51–1986/87 and 1987/88–2021/22), (stationj) is the random effect of the station (with 30 levels corresponding to each station) and ε i j is error term.

2.3.2. Trend Statistics

Additionally, we applied the Theil–Sen non-parametric method as implemented in R package modifiedmk [54] to detect the magnitude of the linear trend for the annual data time series. Trend values are presented by changes per decade. In this case, specific runoff (Mmax, Ls−1 km−2) of rivers was used, because it makes it possible to compare observed data from river basins of different size and assess the results of statistical analysis. The catchment areas range from 207 km2 to 70,600 km2. Specific runoff was calculated as follows: a discharge value distributed with the catchment area and multiplied by a factor of a thousand.
We also determined the direction and statistical significance of trends by using the nonparametric block bootstrapped Mann–Kendall (MK) trend test [54], which is robust against outliers, distribution-free and is more powerful with non-normally distributed data. Block bootstrapped test version was used because part of the time series showed significant serial correlation. This method has been used in many streamflow trends analysis [55,56] (especially in Europe) [18]. Finally, the Walker test [57] was used for testing the regional and total Latvia significance of any monotonic trends. The α < 0.05 level was used for critical significance.
Statistical analysis was conducted by using R software, version 4.3.2. [58].

3. Results

3.1. Timing of Annual Qmax Peaks

3.1.1. Flood Seasonality Using Mathematical Calculations

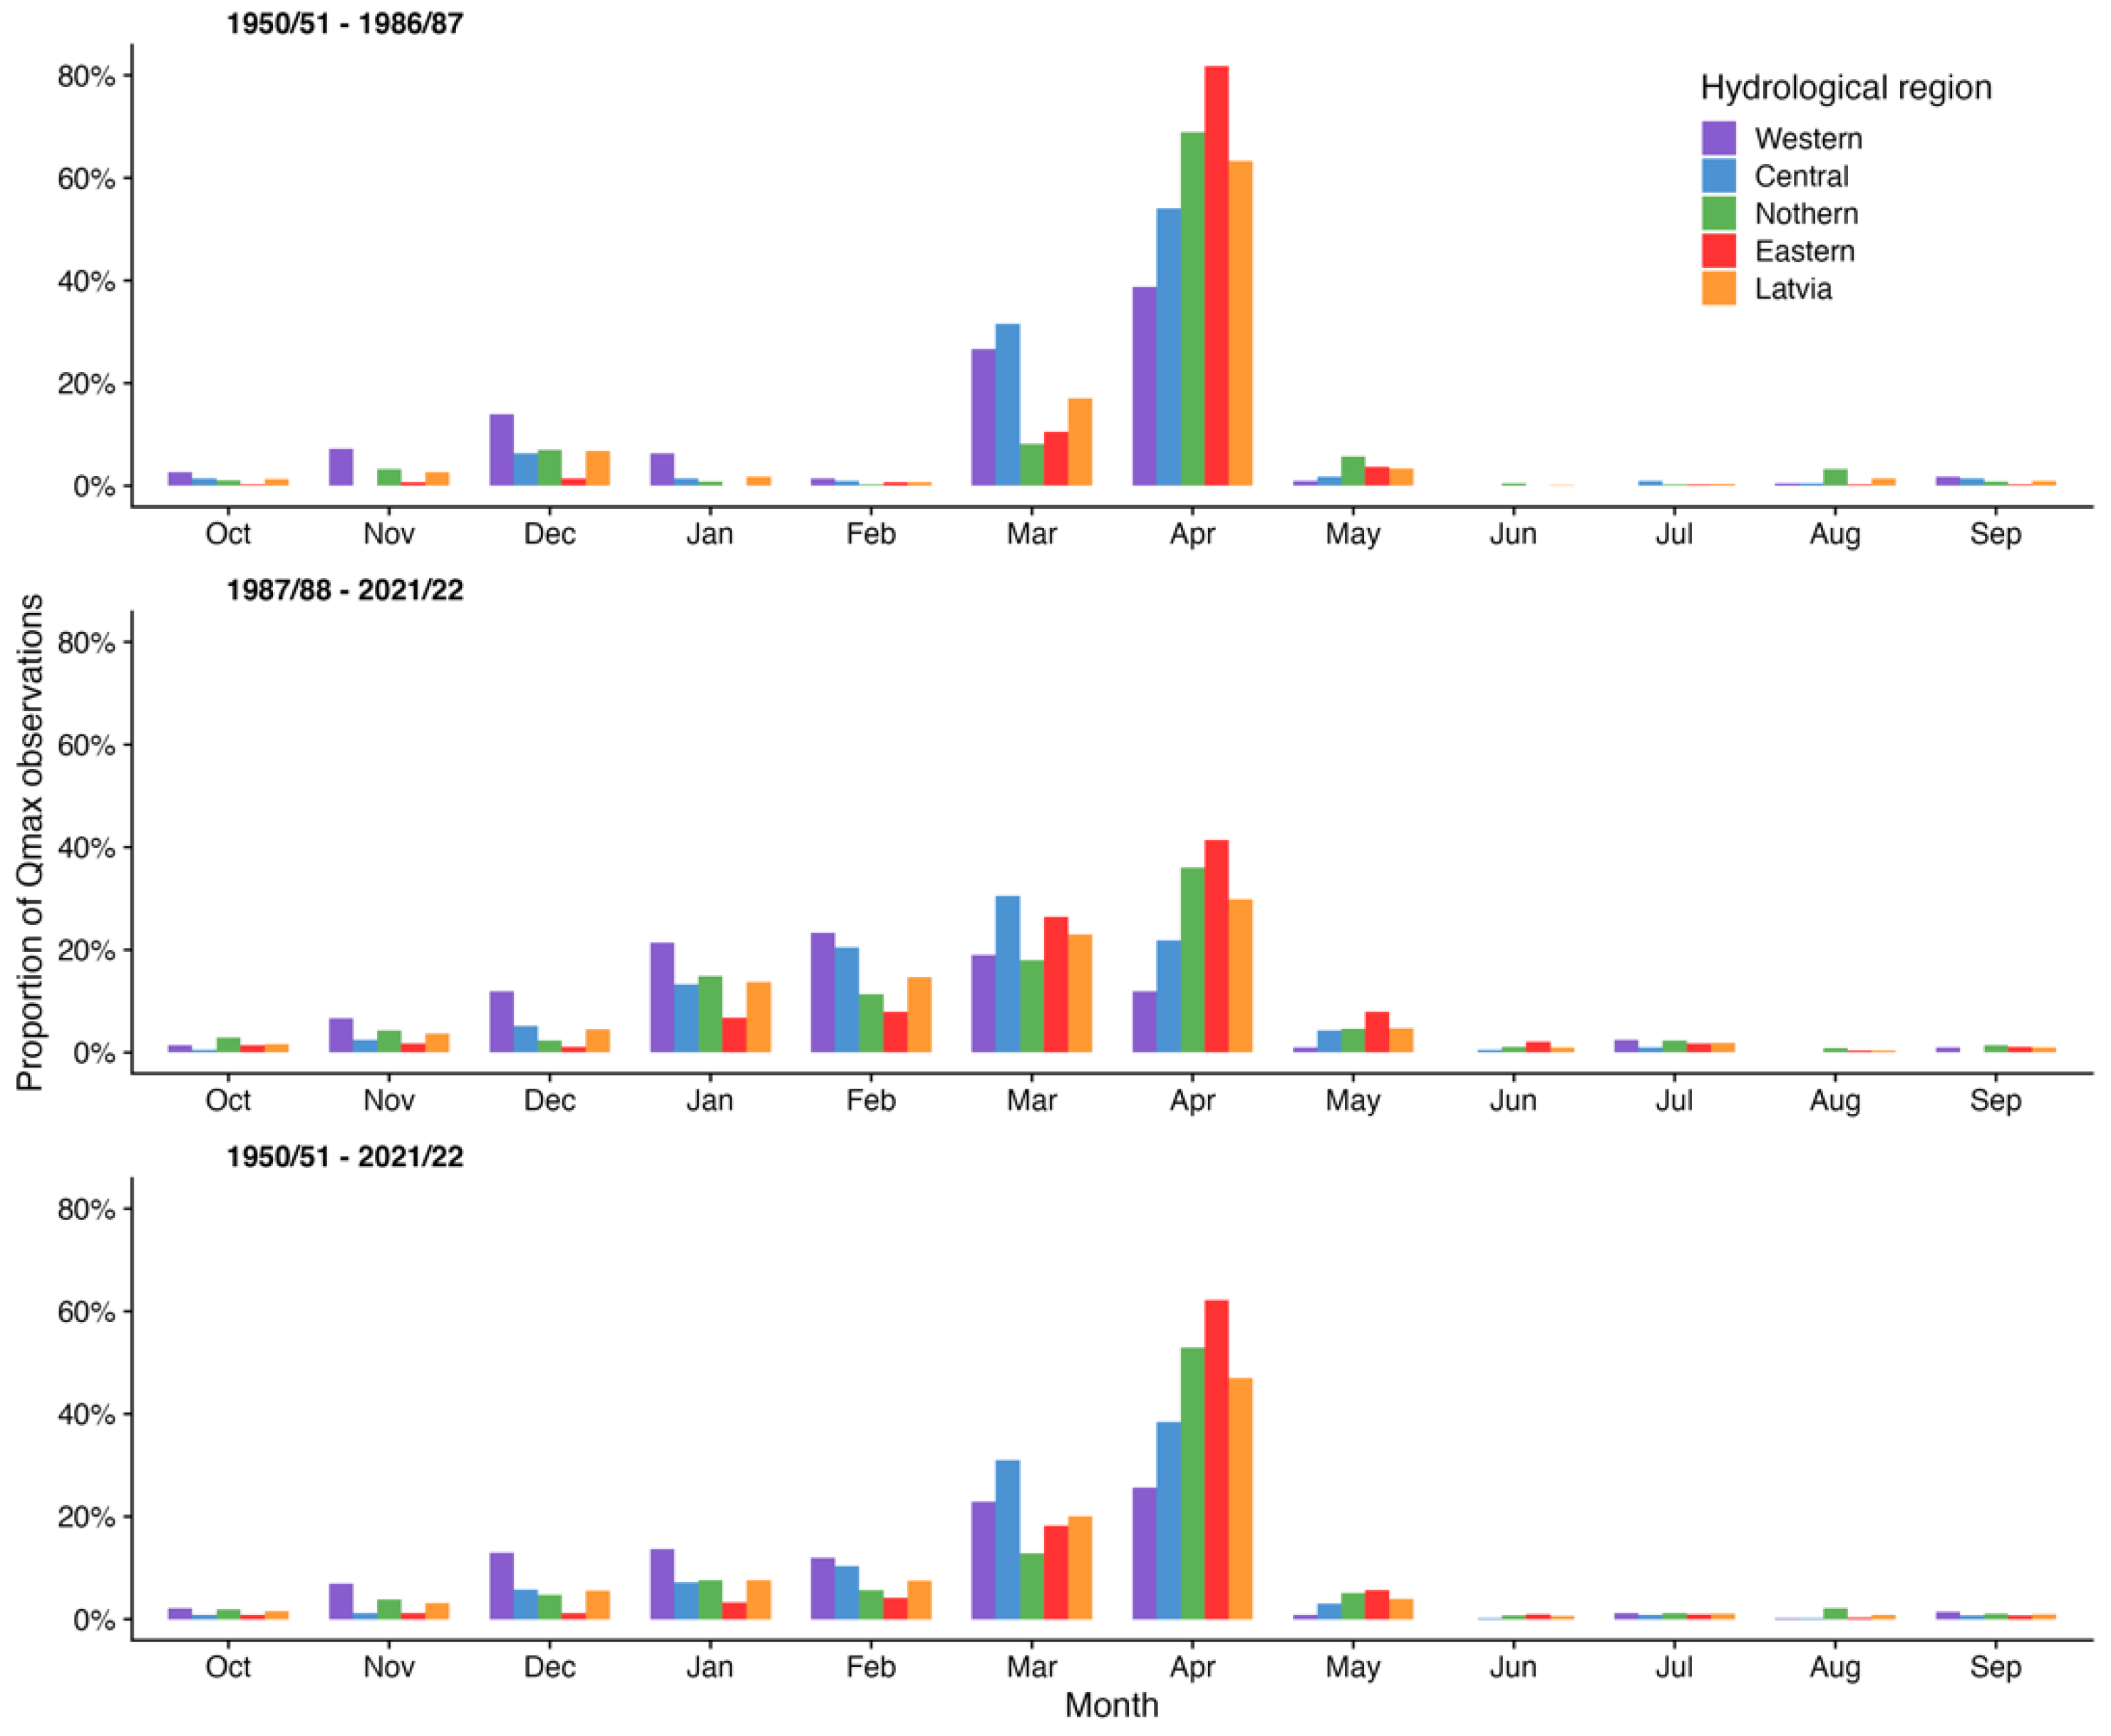
Analysis of the variation in the observed number of year-on-year Qmax events (analysis sub-period, from 1950/51–1986/87, with no substantial climate change impact on river runoff) showed, that in Latvia, Qmax events most commonly occur in April (63% of events), and the ratio of Qmax events occurring in April increases in the direction from West to East (Table 2, Figure 4). In April, the lowest number of Qmax events was observed in the rivers of the Western HR (39% of the total number of events), but the highest number in the Eastern HR (82%). The next most significant month in terms of observed Qmax events is March. In this month, the Eastern HR experienced 10% of all Qmax events, and the Western HR experienced 27%, with the national average being 17%. In this period, during April, the most annual Qmax events were observed in the Daugava-Jēkabpils monitoring station (35 times), and 33 times in the Daugava-Daugavpils station. It was observed least commonly in the Bārta-Dūkupji stations (12 times), Rīva-Pievīķi and Užava Tērande (both 13 times).
It must be noted that, in the Western HR, autumn–winter floods are more common, which form as a result of severe precipitation or, during warm winters, snowmelt. These floods account for 6.9–13.7% of the observed Qmax events, which is not typical of the other hydrological regions. Thus, the least Qmax events during autumn and winter are observed in the Eastern HR, where it is 0.7–1.2% in autumn and 1.2–4.2% in winter. This could be explained by the fact that, in the Eastern HR, the climate is more continental, where there is less liquid precipitation in autumn, and more solid precipitation in winter, which causes rivers to recede and freeze over. The annual Qmax event is almost never observed in summer months (June, July and August), where it accounts for only 0.6–1.1% of all events. In the Northern HR, the number of Qmax events occurring in summer is slightly greater when compared to other regions. This could be explained by the fact that the Northern HR region is home to the Vidzeme Highlands, the largest and highest upland in Latvia, the region which receives most precipitation in the country. For example, the average rainfall from 1951 to 2020 at Zosēni observation station was 729 mm, at Priekuļi station it was 704 mm and at Sigulda station on the Western edge of the Vidzeme Highlands—824 mm.
In the period from 1987/88 to 2021/22, it was observed that in Latvia Qmax events occur most commonly in April (30%), followed by March (23%), February (15%), January (14%), May (5%) and December (4%). In the Eastern and Northern HRs, Qmax events were observed most commonly in April (Table 2), in the Central HR—in March (30%), and in the Western HR—in February (23%) and January (21%). During the analyzed time period, in all HRs the annual Qmax event was gradually occurring earlier in the year, i.e., in December, January, February and March. During this period also Qmax events were observed most commonly in Daugava-Daugavpils and Daugava-Jēkabpils stations—21 times, and least commonly in the Užava-Tērande station—only once. Additionally, the fewest Qmax events were recorded at all monitoring stations during summer and autumn, constituting only 0–8.6% and 0–11.4% of all observed Qmax events in the analyzed period.
During the entire analyzed timeframe (1950/51 till 2021/22), the Qmax combination of both previously studied periods can be seen (Figure 4), where the substantial effect of the climate warming clearly emerges in the percentage distribution of months in each HR and Latvia as a whole. The study proved that in Latvia, the annual Qmax events occur most commonly in April (47%), followed by March (20%), February and January (both 8%), December (6%) and May (4%). The annual Qmax event was least observed in summer and fall months, constituting 1–3% of all events observed during the study period.
Comparing both sub-periods (1987/88–2021/22 to 1950/51–1986/87), the largest disparity can be seen in the months of April, February and January (i.e., −33, 14 and 12 percentage points, respectively (Figure 5). April exhibited the most substantial decline in observed Qmax events across the hydrological regions (HRs), with reductions of 41 and 33 percentage points observed in the Eastern and Northern HRs, respectively. The Western HR experienced the smallest decrease (−27 percentage points). Conversely, February displayed the most significant increase in observed Qmax events, with rises of 22 and 19 percentage points noted in the Western and Central HRs, respectively. The Eastern HR saw a 16 percentage point increase in March, while the Northern HR experienced a 15 percentage point increase in January. These changes can be explained by the fact, that, due to the climate warming, significant changes have occurred in the annual distribution of the river runoff intensity, and there have been changes in the shape of its hydrograph, caused by the decrease of the river’s runoff during spring months (April and May), and an increase in winter months (January and February) and Mach as well. Thus, the annual Qmax events occur earlier, compared to when temperate winters lasted longer into the spring.
Smaller changes in the number of Qmax observations can be seen in Latvia as a whole in the summer and autumn months: a rise in June by 0.8 percentage points, in July by 1.5 points, October by 0.4 points and November by 1.0 points. In August the number of observations decreased by −1.0 points. In this metric, there are also regional variations. For example, in the Western HR, in the months of October and November, the number of Qmax observations decreased by −1.3 points and −0.5 points, respectively. This indicates that, with the onset of warmer and drier autumns, the number of Qmax events, alongside occurrences of severe precipitation in autumn, has decreased, with the observed number of events increasing in some summer months.

3.1.2. Flood Seasonality Using Circular Statistics

Exploring the strength of annual Qmax flood seasonality using the Rayleigh test for circular statistics in the sub-period of 1950/51–1986/87, the lowest mean resultant length R is on average 0.67 in the Western region followed by the Northern region (R = 0.81), Central (R = 0.88), Eastern (R = 0.97) and for the entire country (R = 90) (Table 3, Figure 6). Higher values indicate stronger seasonality, which is typical for snowmelt-dominated catchments, like those in the rivers in the continental part of the Baltic region (in our study this is represented by the Eastern HR), whereas lower values represent a more uniform flood seasonality, such as in the catchments with a mixed snowmelt-rainfall flow regime, as it is typical for the Baltic region rivers close to the Baltic Sea (in our study this is represented by the Western HR). According to the interpretation by the authors of this paper, the mean R value in the Northern HR region should be higher than in the Central region, as this region is located further East, and it is more similar in its runoff distribution. It is likely that the mean R value in the Northern HR has been affected by rivers, whose monitoring stations are located closer to the Baltic sea.
The West–Eastward gradient in Latvia for the peak of the flood is 37 days on average (from 3 March to 10 April), with a mean day of 30 March across Latvia. The duration of time in which the West–East moving flood maximum crosses Latvia is 37 days on average (from 3 March to 10 April).
This sequence of regions for both lengths R and timing mean days of Qmax floods is also maintained in the sub-periods of 1987/88–2021/22 and 1950/51–2021/22. However, when comparing the periods of 1987/88–2021/22 to 1950/51–1986/87, the length of R is a slightly shorter for all regions (except Western), and across Latvia as a whole, and the timing of the mean day occurs earlier. This could be explained by the fact that winters became warmer, and rivers received annual snowmelt water earlier, and at a lesser intensity. Furthermore, spring flood formation increasingly depends on rainfall and snowmelt component changes in all HRs. It must be noted that in the Western HR, the inflow of rainwater is a significant factor in the entire study period. Thus, in this region drastic changes in the inflow of snowmelt and rainwater are observed, when compared to other regions.
The Rayleigh test showed that the hypothesis of uniformity could be rejected, and there was a significant deviation from uniformity in all catchments (p < 0.0001). This indicates that there is seasonality in flooding across Latvia for catchments characterized by a snowmelt-dominated and a mixed snowmelt-rainfall flow regime with a pronounced single peak in the annual hydrograph. For those catchments, asymmetry was present (Figure 6).

3.1.3. Flood Seasonality Using Linear Mixed Effects Models

The results of Linear mixed effects models are presented in Table 4 and are similar to the results of the circular statistics analysis. In both study sub-periods (1950/51–1986/87 and 1987/88–2021/22), the average annual Qmax day/date occurs earlier in Western region, followed by Central, Northern and Eastern. Additionally, the average annual Qmax day/date occurs earlier in the study period with substantial climate change impact on river runoff (1987/88–2021/22), in comparison to the period with no substantial climate change impact on river runoff. The differences between periods are statistically significant (all α values below 0.005). The variation between hydrological regions and the mean in Latvia is shown in Table 4.

3.2. Trends in Annual Qmax (Mmax)

3.2.1. Magnitude

In order to make the trend statistics comparable between river basins of different sizes, the annual Qmax was converted into a specific runoff (Mmax, Ls−1 km−2). By using the Theil–Sen approach, trend values were calculated revealing the change in annual Mmax of floods magnitude per decade (Figure 7). The Mann–Kendall test results show the long-term pattern of change in Mmax (positive or negative) and its statistical significance over the study sub-period of 1950/51–2021/22.
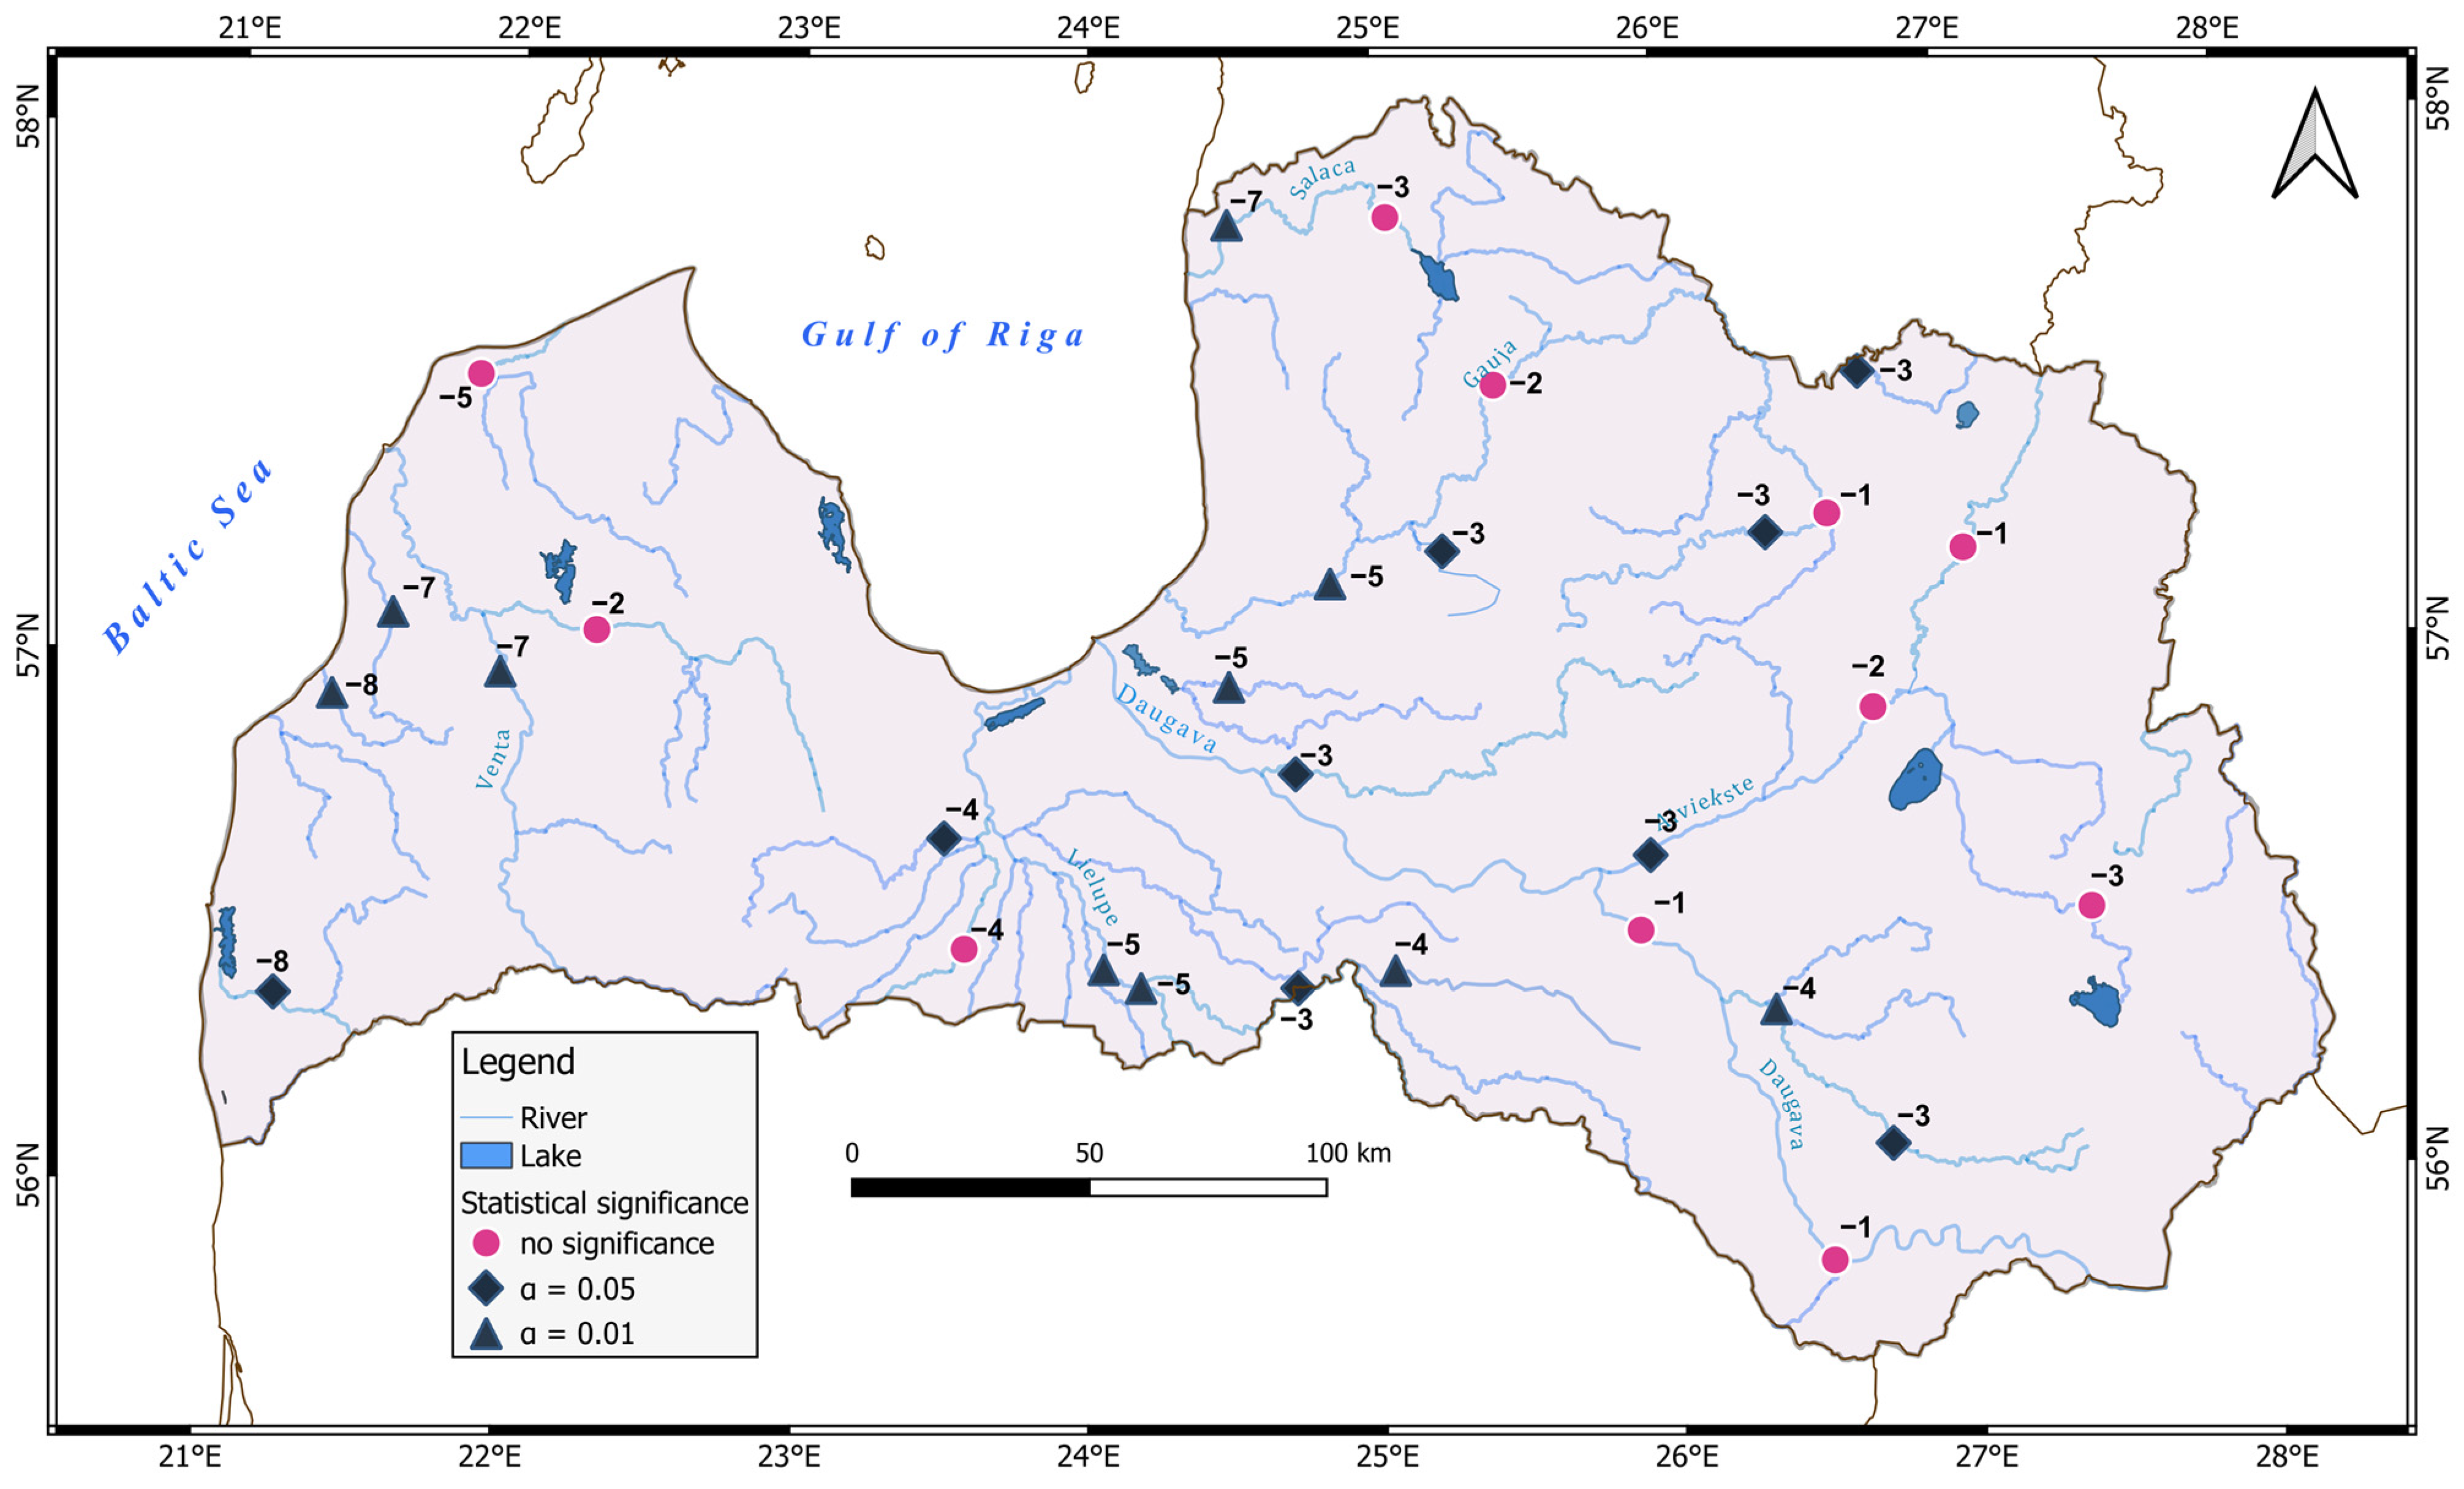
The study revealed that in Latvian rivers the annual Mmax of floods trend values were mostly negative, i.e., a decrease in flood magnitude and statistically significant. Trend values vary from −0.1 (Salaca-Lagaste HMS, very close to the Baltic Sea) to −5.4 (Ogre-Lielpēči HMS) Ls−1 km−2 decade−1. For ten rivers, the HMS trend value is equal to or greater than −4 Ls−1 km−2 decade−1 and the change is statistically significant. These HMS are mainly located in the Central and Northern HR and indicate the largest changes in Mmax magnitude. This is also shown by the calculated average trend value for the regions. The largest is for Central HR (−4.1 L/s−1 km−2 decade−1) and Northern HR (−3.0 Ls−1 km−2 decade−1), but the lowest is in Western and Eastern HR, −2.2 and −2.6 Ls−1 km−2 decade−1, respectively. In Latvia, the mean trend value is −3 Ls−1 km−2 decade−1. This indicates that relatively less hydro-climate changes have occurred in the Western and Eastern HR rivers, which have the highest (R) and lowest (A) Baltic Sea influence, respectively. However, one HMS Rīva-Pievīķi in the Western region has a trend value of 0.8 Ls−1 km−2 decade−1, but no statistically significant long-term change. This river basin is small by area (231 km2). This shows how hydro-climatic processes in small river basins can be more intense and different from changes in large river basins. Two river stations of the Western HR (Bārta-Dūkupji and Irbe-Vičaki) and four river stations of the Northern HR (Gauja-Sigulda, Vaidava-Ape, Salaca-Lagaste and Salaca-Mazsalaca) have negative trends without statistical significance. The remaining stations (77% of the rivers studied) have negative, statistically significant trends in annual Mmax at α < 0.05 confidence level. The results of the Mann–Kendall test reveal (Figure 7) that for all rivers studied the annual Mmax trend is negative, except for the Rīva-Pievīķi station.
The results of the Walker test applied in the study show that the long-term change in annual Mmax magnitude at the regional level is statistically significant at α < 0.01 confidence level for all HRs and for the entire country, and the trend for Central HR is statistically significant even at α < 0.001 confidence level.
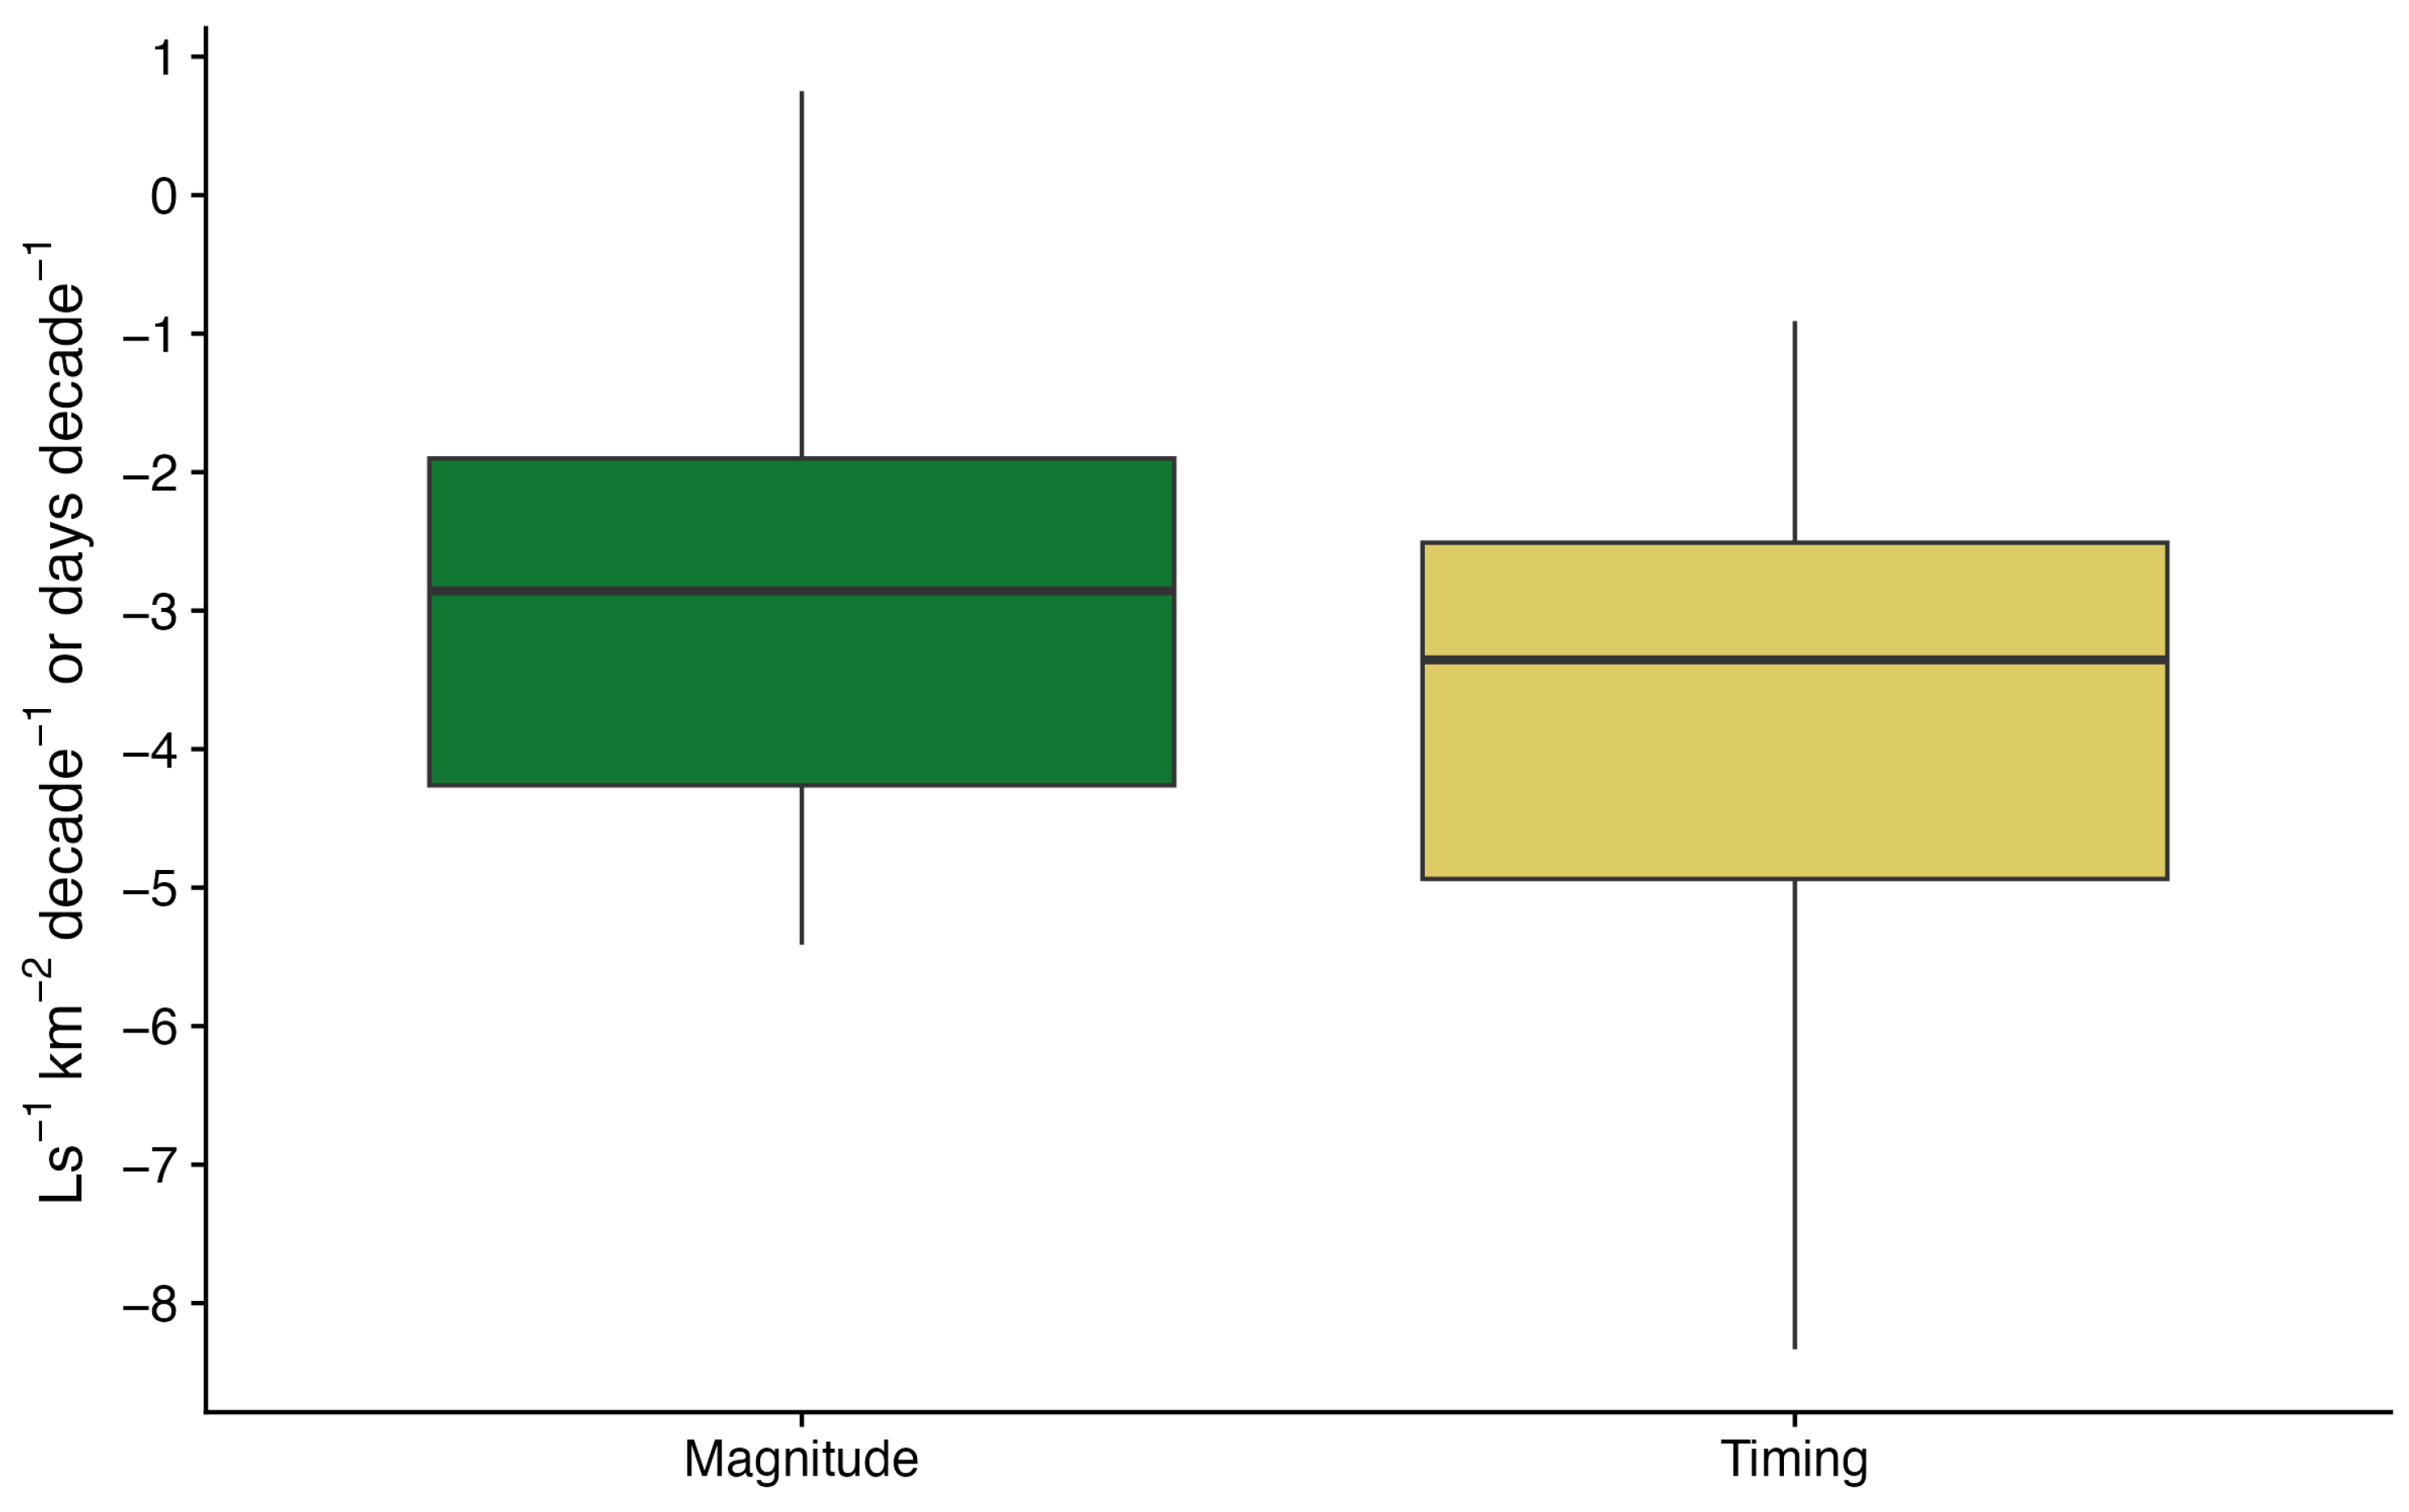
We estimated the trend slopes of data for the 30 stations by applying the Theil–Sen approach for Mmax across Latvia (Figure 8). The medians of the slopes for Mmax for trends were less than zero (negative slope) for all drainage catchments and regions. For Mmax, the median of the slopes was −2.85 Ls−1 km−2 decade−1, indicating that across Latvia, Mmax peaks have been mostly decreasing in recent years for all stations, except one station Rīva-Pievīķi in Western HR.
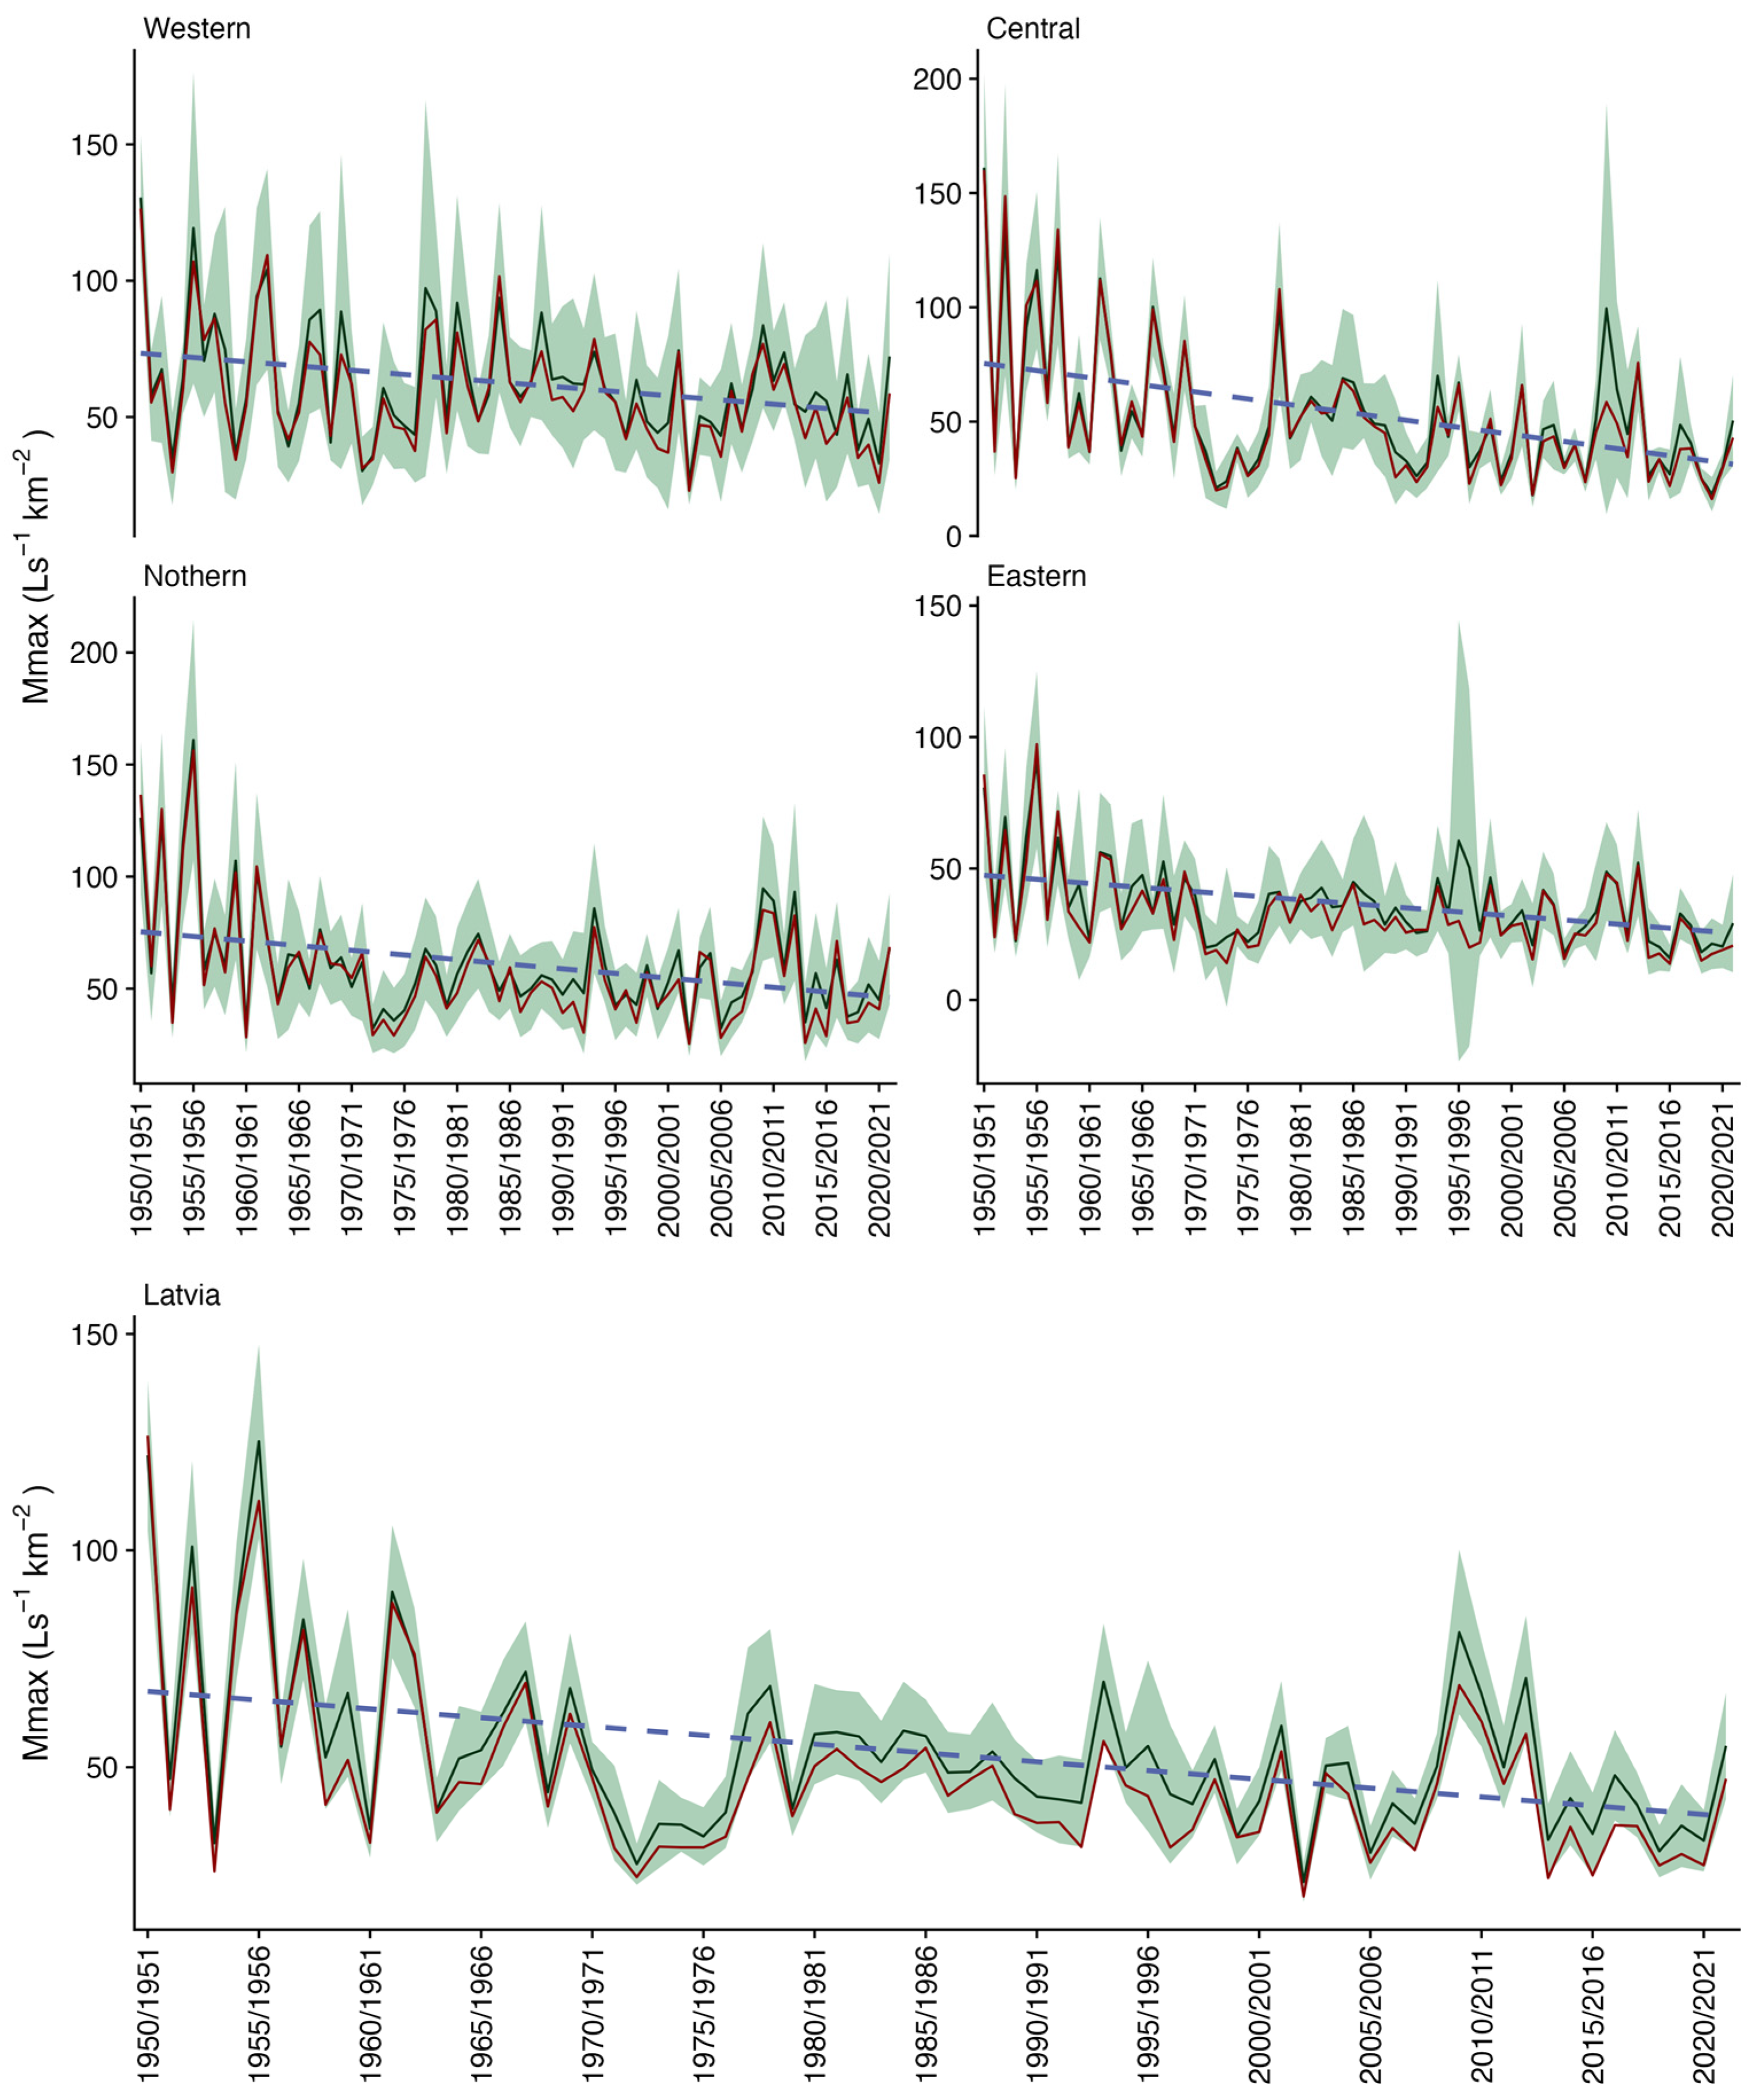
The long-term change in annual Mmax magnitude for the four HRs and for Latvia as a whole over the sub-period 1950/51–2021/22 shows a negative trend (Figure 9). For each hydrological year, the arithmetic mean value of the number of days of occurrence as well as the arithmetic mean median value is calculated and subtracted from the long-term mean value (green line) and the median mean value (red line), respectively. Both values are decreasing, as shown by the linear negative trend (blue dashed line). This shows that the Mmax magnitude, which, in recent decades, has been observed mainly in winter and spring seasons, tends to decrease in all HRs and in Latvia as a whole.
For the study period of 1950/51–2021/22, the negative trend was influenced by high annual Mmax of flood values in the 1950s, followed by a decrease in these values between 1961/62 and 1977/78. Values of the annual Mmax of flood again increased slightly in the years 2009/10 to 2012/13, followed by a decrease in the period of 2013/14–2021/22.

3.2.2. Timing

As shown in Figure 10, according to the Theil–Sen approach, for rivers of Latvia the annual Qmax onset time (number of days from the reference date of 1 October) is negative and varies from −1 day decade−1 (Daugava-Daugavpils, Daugava-Jēkabpils, Pedeze Litene and Tirza Lejasciems) to −8 days decade−1 (Barta-Dūkupji and Rīva-Pievīķi). Of the 30 river stations studied, 10 had a trend value equal to or greater than −5 days decade−1. The study showed that the Western HR rivers (−6 days decade−1) have the highest mean trend value, followed by the Central and Northern HR (−4 days decade−1) and the Eastern HR (−2 days decade−1). In Latvia as a whole, the trend value is −4 days decade−1. At 19 stations, or 63%, the trends are statistically significant at α < 0.05 and α < 0.01 confidence levels.
The Walker’s test produced the same results as described above for long-term changes in annual Mmax magnitude. Again, the long-term changes in annual Qmax timing at regional level are statistically significant at α < 0.01 confidence level for all HR and across Latvia, except for the Central HR where the trend is statistically significant already at α < 0.001 confidence level.
Therefore, we can estimate that with the persistence of warmer winters in recent decades, Qmax peaks, which previously occurred mainly in March–April, tend to occur earlier with a more or less pronounced West-to-East gradation in onset time.
We estimated the trend slopes of data for the 30 stations by applying the Theil–Sen approach for Qmax timing across Latvia. The medians of the slopes for Qmax timing for trends were less than zero (negative slope) for all drainage catchments and regions (Figure 8). For Qmax, the median of the slopes was −3.36 days decade−1, indicating that across Latvia, annual Qmax timing peaks have generally occurred early in recent years for all stations.
Figure 11 shows the long-term change in the number of annual Qmax days for the four HRs and for Latvia as a whole over the study period 1950/51–2021/22. Both values (mean and median) tend to decrease, as shown by the linear negative trend (blue, dashed line). This confirms the fact that the annual Qmax tends to set in earlier in all HRs and in Latvia as a whole. The variability of annual Qmax timing in a given year within a drainage region depends on the strength of the seasonality (Figure 4) and the timing of annual Qmax of stations within that drainage region. In the Eastern region, both values (mean and median) have the smallest variations, while the largest variations are in the Western HR (more pronounced after the late 1980s, when a more significant effect of climate warming on the hydrological regime of rivers is observed).

3.3. Relationship of Trends in Magnitude of Mmax and Changes in Timing of Qmax

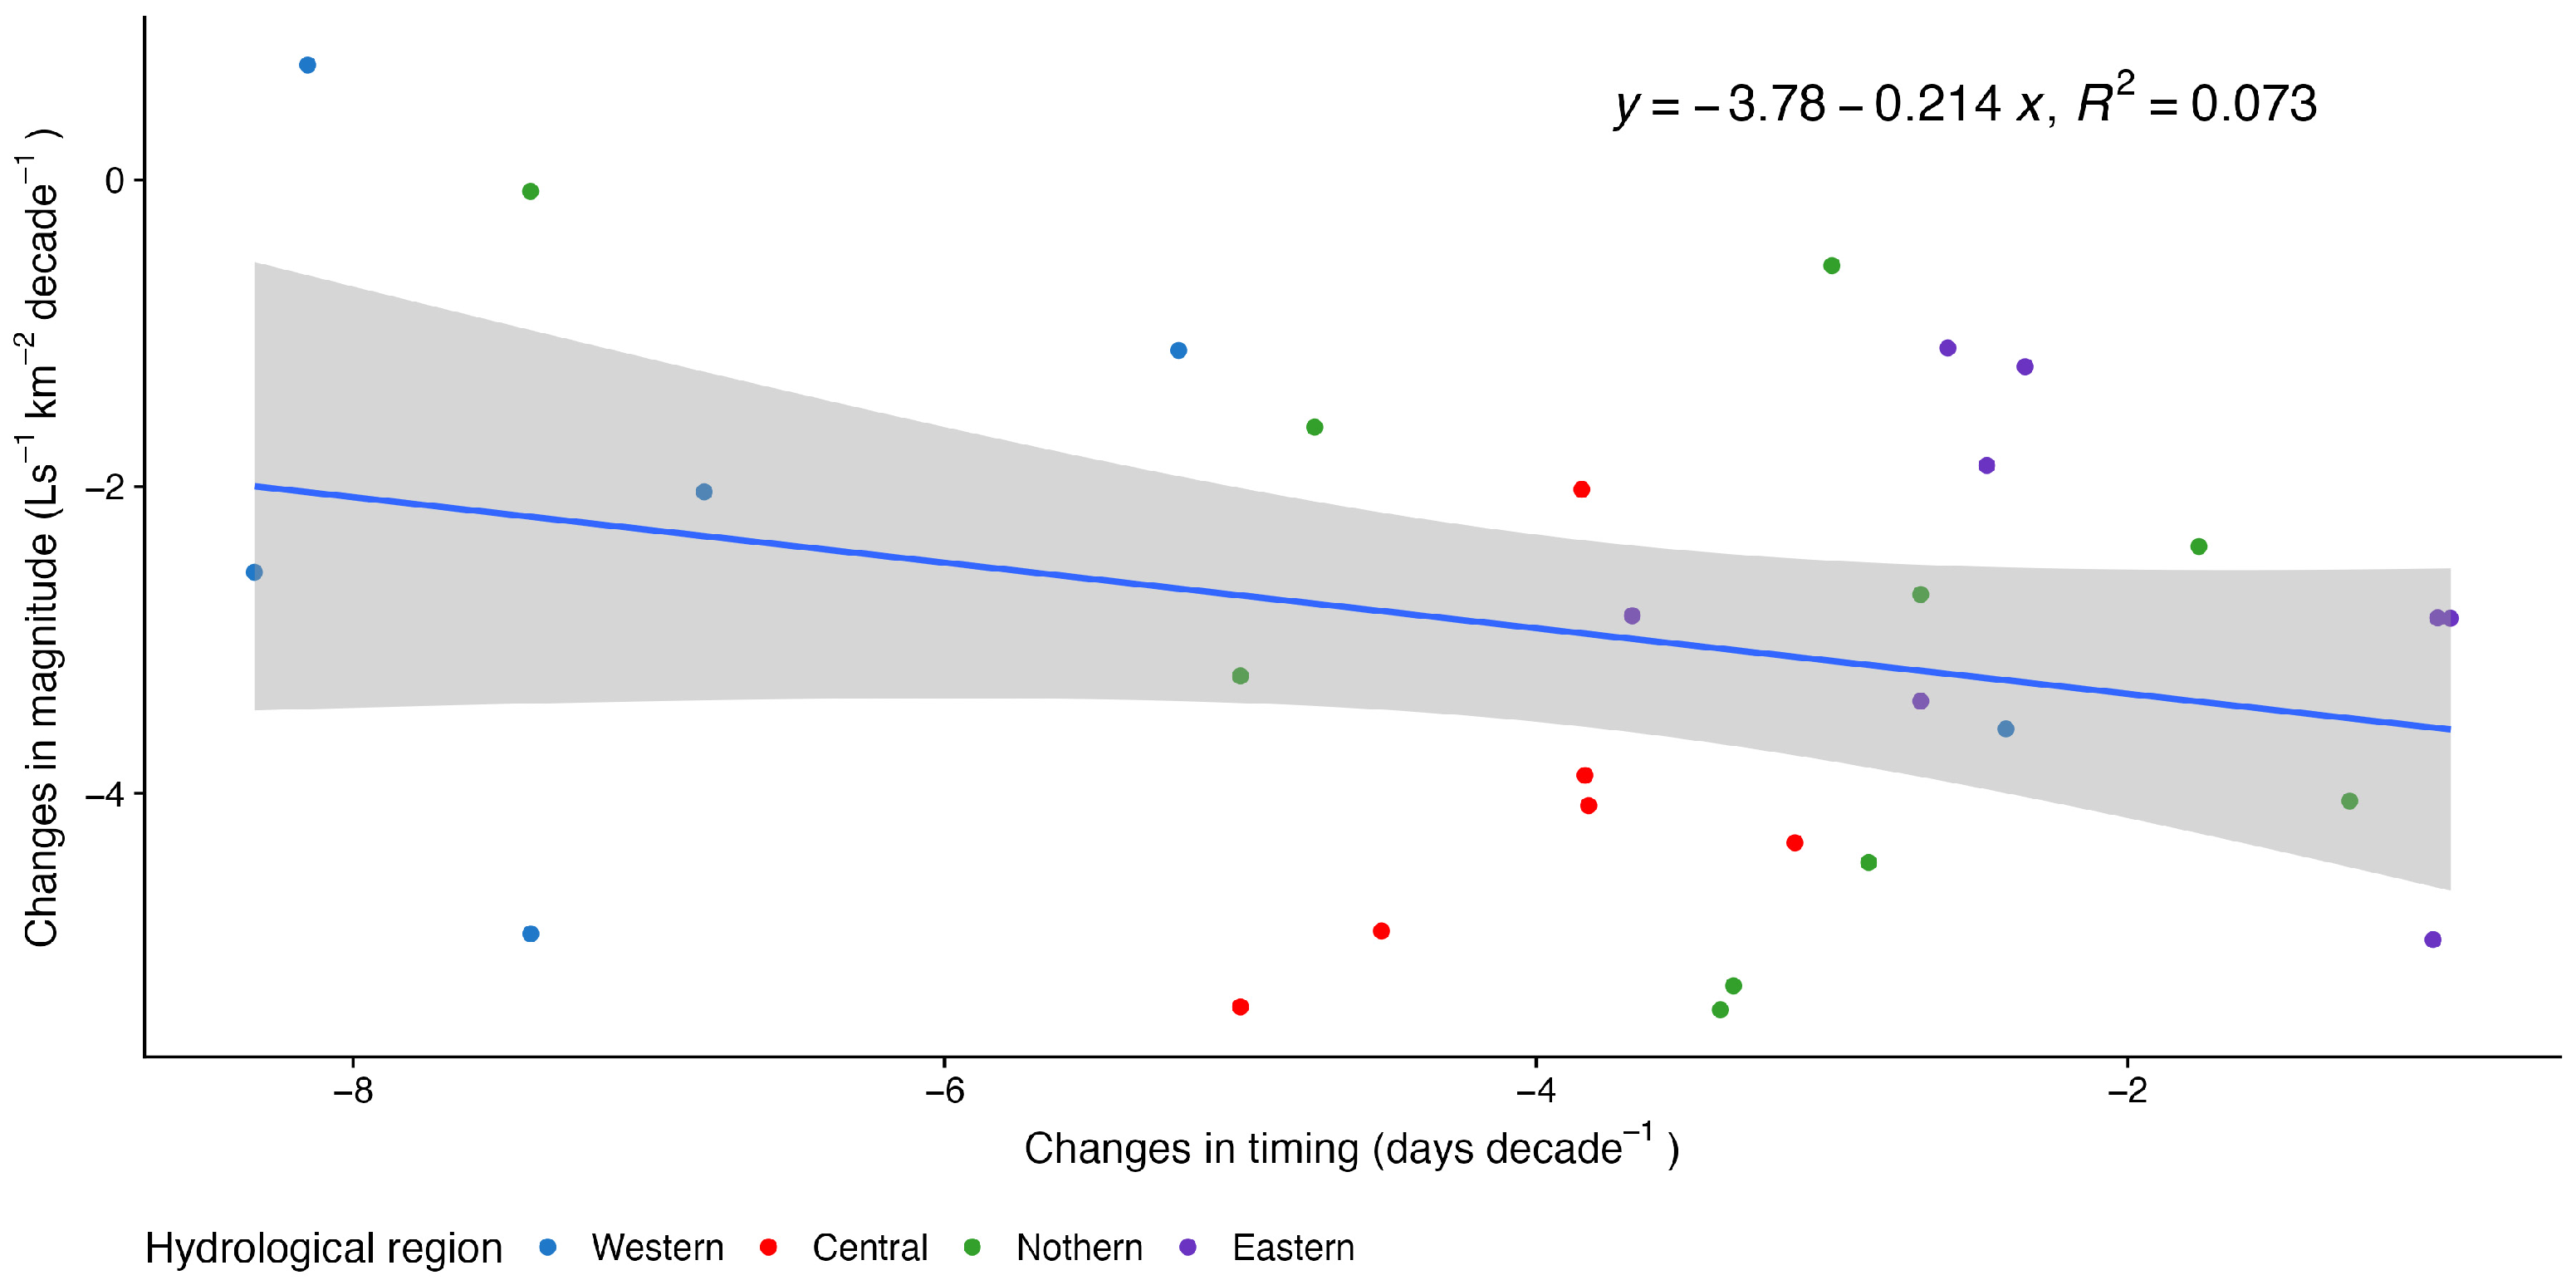
Figure 12 presents the scatter plot of changes in the trends in timing of annual Qmax and changes in magnitude of annual Mmax for all 30 stations. Most stations show decreasing (typical for Eastern region) or increasing (typical for Central region) trends in Mmax magnitude, but it is not clear how that tendency could be associated with change in timing. In addition to this, stations of Western and Northern deviations show high dispersion in the trends in timing of Qmax and changes in magnitude of Mmax.

4. Discussion

This study presents a comprehensive analysis of the annual flood magnitude trend, strength of seasonality and changes in timing at 30 stations located from 24 catchments within four different hydrological regions across Latvia during the study period of 1950/51–2021/22. In the mid-latitudes, where Latvia is located, floods are mainly seasonal, which was also proven by the results of our study on the seasonality of annual Qmax by using circular statistics, mathematical calculations and Linear mixed effects models. In Latvia, spring snowmelt floods are the most significant flood hazard, but also floods from excess rainfall mainly in the warm season and wind surges (not considered in this study) in autumn and winter tend to flood large areas. Sudden inflows of water from neighboring countries and a failure of hydrotechnical structures can also pose a flood risk, especially for the River Daugava [42].
Historically, spring flood in the Baltic region is usually a combination of snowmelt and rainfall, with dominant snowmelt contribution where the maximum discharge is many times higher than the average annual discharge of rivers [35]. Using a mathematical calculation approach, our study found that in the sub-period 1950/51–1986/87, in all hydrological regions and in Latvia as a whole, the annual Qmax was most frequently observed in April (Table 2, Figure 3). The lowest percentage of Qmax observations in April is in Western HR (i.e., 39%), but the percentage increases from West to East. The overall situation changes in the sub-period 1987/88–2021/22, when the annual Qmax is most frequently observed in February in the Western HR, in March in the Central HR, in April in the Northern and Eastern HRs, and in April in Latvia as a whole. It should be noted that similar results were obtained when analyzing changes in distribution of total annual river runoff contributed by Apsīte et al. [33]. The occurrence of the annual Qmax is therefore earlier than in the past, when strong winters in mid-latitudes were more typical and spring runoff was more dominated by snowmelt inflows. It should be noted that the shape of the hydrograph has also changed: while there used to be one relatively strong peak discharge in March or April, there are now several lower peaks in winter and early spring months.
Changes in river runoff in relation to hydroclimatic parameters has been studied by Jaag et al. [47]. The study revealed that a regime shift in temperature, precipitation, snow cover and runoff occurred in Estonia during the winter of 1988–1989. A significant downward regime shift in snow cover duration and a change in the dominant winter type in 1989 was found by Rimkus et al. (2018) [41] throughout the territory of Baltic States. Other studies [59,60] highlight reasons and state that this period was associated with very high positive NAO index values, and marked a transition from continental to more maritime winter conditions in the Baltic Sea region. Overall, these results correspond to our study and confirm that division into two distinct periods is justified for the identification of long-term changes in hydroclimatic parameters.
This study also showed that there are some years when the annual Qmax of flood occurs in summer and autumn seasons, which are associated with intense rainfall events. We found that in the last three decades (i.e., 1987/88–2021/22), due to an increase in the number of days with heavy rainfall [61], there has been a slight increase in the Qmax of floods in the summer season (especially in July). However, as September has become warmer and drier, the number of Qmax events in September has decreased. Such patterns have been found in previous studies on seasonal and long-term changes in river runoff in Latvia under modern climate conditions [33,62] and future climate conditions [31,32], changes in precipitation regimes in the Baltic States [63], as well as a study on long-term and seasonal changes in climate and river runoff in Estonia during the period 1951–2015 [47]. On the contrary, a study on changes in river flow regimes in Scandinavia from 1961–2010 revealed different results, with decreases in summer and increases in autumn and winter [7]. Similar results were obtained for Romania streamflows for both study periods 1961–2009 and 1975–2009 [64].
In this study, we obtained similar results by analyzing the mean annual Qmax onset dates by using Circular statistics and Linear mixed effects models (Table 3 and Table 4). In both sub-periods of this study, the flood peak occurs earlier in the Western HR, followed by the Central HR, Northern HR, Eastern HR. There is a gradation from West to East, influenced by the climatic meridional zonality characteristic of Latvia. With warming winters in recent decades (1987/88–2021/22), Qmax peaks, which previously occurred mainly in March–April, tend to occur earlier. This is confirmed by the results of the statistical trend analysis shown in Figure 10 and Figure 11, as well as studies by other authors such as Reihan et al. [35], Beauchamp et al. [14], Arheimer and Lindström [26], Blöschl et al. [20], Matti et al. [7], Hall and Blöschl [21], Gohari et al. [24], Venegas-Cordero et al. [27] and Lintunen et al. [25].
A summary of trends of annual Qmax (Mmax) magnitude and timing of the study period are presented in Figure 7 and Figure 9, respectively. The reason for such a trend distribution is that in all regions of Latvia the greatest river discharges in spring were observed more often in the sub-period of 1950/51–1986/87 (1951, 1956, 1958, 1970, 1979, 1981, 1983, 1985). As the magnitude of the observed high spring floods in the later sub-period of 1987/88–2021/22 was lower (1994, 1998, 2005, 2007, 2010 and 2013). During the underlined years in brackets also the largest spring floods were observed in the Baltic States according to Reihan et al. [35]. Such floods usually occur after very severe and long winters, when a lot of snow accumulates. The largest summer–autumn rainfall flood events occurred in 1952, 1974, 1997, 1998, 2005, 2017. The period of 1963–1977 was the driest period of rivers runoff in the Baltic countries [36] and across Sweden [7] as well. The period 1963–1977 was characterized by the lowest river runoff in the Baltic States [36], as well as in Sweden [7]. The driest years for river streamflow in Latvia were 2003 and 2006.
For rivers of Latvia over the whole study period 1950/51–2021/22, the magnitude and timing trends calculated for annual Qmax (Mmax) are negative and statistically significant at α < 0.05 in 63–77% of cases. As can be seen in Figure 6 and Figure 8, as a result of climate warming effects especially in recent decades, Mmax magnitude tends to decrease and Qmax to occur in earlier months. This is characteristic of the previously snowmelt-dominated river runoff regime in mid-latitudes during the spring season, which gradually changes to a mixed snowmelt-rainfall runoff regime throughout the winter-spring season.
Regional differences are evident in the magnitude and timing trends of annual Qmax (Mmax). Although not large overall, they are statistically significant at α < 0.01, according to the Walker’s test, for both hydrological regions and the country as a whole.
The results of our study on trend statistics are generally consistent with previous studies in the Baltic States and Latvia on long-term Qmax changes (e.g., [28,30,33,34,35,36]). Decreases in high flows were also found in Romania for the periods of 1961–2009 and 1975–2009 [64] and generally in Poland (particularly in the north-east) for the periods of 1956–2019 and 1981–2019 [27]. In Belarus, the study period from 1945 to 2020 reveals significant hydrological changes. Over the past 30 years, maximum spring flood discharges have decreased by 20% in the Western Dvina River Basin and by 50–60% in the Neman, Dnepr and Pripyat River Basins. Additionally, there has been a notable shift in the timing of these floods, with onset occurring 11–22 days earlier during this period [65]. High flow events show advancing timings and decreasing magnitudes, notably in the coastal region and less so in the north of Finland [24,25]. In the past century, flood seasonality has changed in Scandinavia, which has seen decreasing trends in summer and increasing trends in winter and spring daily maximum, and trending towards the earlier timing of the flood peak [7,26]. The regional trends presented the presence of predominantly positive trends in the North West Europe and negative trends in the South and East Europe for the study period of 1960–2010 [22,23].
The observed variability of annual Qmax in time is definitely climate driven with catchment properties [7,13,36], e.g., geological features, soil properties, land-use changes and human activities such as urbanization, deforestation and afforestation, artificial drainage also playing a significant role [36,42,66]. The combination of all these factors together makes the estimation and prediction of flood events very complicated and needs further investigation [36]. Future research should focus on changes in the river runoff in relation to atmospheric precipitation, as well as air temperatures, considering land-use or land-cover changes, as well as the impact of artificial drainage and others factors. This has already been done in the study on changes in runoff (including annual Qmax) of the Vienziemīte stream basin (drainage area 6 km2) conducted by Apsīte et al. [66], but studies on larger river basins in Latvia would also be needed.

5. Concluding Remarks

This study offers a thorough examination of river flood magnitude trends, seasonality, and timing changes at 30 stations across Latvia from 1950/51 to 2021/22. The division of this period into pre- and post-1987 sub-periods allowed for the assessment of climate change impacts on river flood occurrence.
Key findings indicate that annual Qmax occurrences have shifted from spring to late winter, aligning with broader warming trends and increased westerly circulation since the mid-1980s. Historically, spring floods driven by snowmelt were predominant, trends show that recent decades have seen more varied flood timings. The study highlights a west-to-east gradient in the timing of Qmax events, with floods peaking earlier in the west compared to the east. The Rayleigh test confirmed strong seasonality in flood events, especially in the snowmelt-dominated regions. Furthermore, a negative trend in the magnitude of annual flood Mmax was observed, with significant decreases in flood intensity across most monitoring stations, particularly in the Central and Northern regions.
In addition, the study highlights significant regional differences influenced by local hydro-climatic conditions and underscores the complexity of predicting future flood patterns due to the interplay of climate change, atmospheric circulation, and catchment-specific factors. Future research should continue to explore these dynamics, considering broader geographical scales and additional environmental variables. It is also necessary to assess how changes in flooding patterns may affect economic activities and associated environmental risks.

Author Contributions

Conceptualization, E.A. and D.E.; Methodology, E.A. and D.E.; Software, D.E. and J.L.; Formal Analysis, E.A. and D.E.; Investigation, E.A. and D.E.; Data Curation, D.E., E.A. and L.K.; Writing—Original Draft Preparation, E.A, J.L., A.B. and D.E.; Writing—Review & Editing, E.A., J.L., A.B., D.E. and L.K.; Visualization, J.L. and D.E.; Supervision, E.A.; Funding Acquisition, E.A. All authors have read and agreed to the published version of the manuscript.

Funding

This research was funded by the University of Latvia grant number ZD2010/AZ03.

Institutional Review Board Statement

Not applicable.

Informed Consent Statement

Not applicable.

Data Availability Statement

The used in this study are obtained from the Latvian Environment, Geology and Meteorology Centre database.

Acknowledgments

We thank the editors and reviewers for their comments and suggestions, which have significantly helped us to improve the manuscript.

Conflicts of Interest

The authors declare no conflicts of interest.

References

  1. Bari, M.A.; Amirthanathan, G.E.; Woldemeskel, F.M.; Feikema, P.M. Changes in Magnitude and Shifts in Timing of Australian Flood Peaks. Water 2023, 15, 3665. [Google Scholar] [CrossRef]
  2. Calvin, K.; Dasgupta, D.; Krinner, G.; Mukherji, A.; Thorne, P.W.; Trisos, C.; Romero, J.; Aldunce, P.; Barrett, K.; Blanco, G.; et al. IPCC, 2023: Climate Change 2023: Synthesis Report. Contribution of Working Groups I, II and III to the Sixth Assessment Report of the Intergovernmental Panel on Climate Change; Core Writing Team, Lee, H., Romero, J., Eds.; Intergovernmental Panel on Climate Change (IPCC): Geneva, Switzerland, 2023. [Google Scholar]
  3. Assessment of Climate Change for the Baltic Sea Basin; BALTEX Assessment of Climate Change for the Baltic Sea Basin. Springer London NetLibrary, Inc./Guildford Boulder: London, UK, 2008; ISBN 978-3-540-72786-6.
  4. Meier, H.E.M.; Kniebusch, M.; Dieterich, C.; Gröger, M.; Zorita, E.; Elmgren, R.; Myrberg, K.; Ahola, M.P.; Bartosova, A.; Bonsdorff, E.; et al. Climate Change in the Baltic Sea Region: A Summary. Earth Syst. Dynam. 2022, 13, 457–593. [Google Scholar] [CrossRef]
  5. Castellarin, A.; Burn, D.H.; Brath, A. Assessing the Effectiveness of Hydrological Similarity Measures for Flood Frequency Analysis. J. Hydrol. 2001, 241, 270–285. [Google Scholar] [CrossRef]
  6. Sivapalan, M.; Blöschl, G.; Merz, R.; Gutknecht, D. Linking Flood Frequency to Long-term Water Balance: Incorporating Effects of Seasonality. Water Resour. Res. 2005, 41, 2004WR003439. [Google Scholar] [CrossRef]
  7. Matti, B.; Dahlke, H.E.; Dieppois, B.; Lawler, D.M.; Lyon, S.W. Flood Seasonality across Scandinavia—Evidence of a Shifting Hydrograph? Hydrol. Process. 2017, 31, 4354–4370. [Google Scholar] [CrossRef]
  8. Villarini, G. On the Seasonality of Flooding across the Continental United States. Adv. Water Resour. 2016, 87, 80–91. [Google Scholar] [CrossRef]
  9. Wasko, C.; Nathan, R.; Peel, M.C. Trends in Global Flood and Streamflow Timing Based on Local Water Year. Water Resour. Res. 2020, 56, e2020WR027233. [Google Scholar] [CrossRef]
  10. Torre Zaffaroni, P.; Baldi, G.; Texeira, M.; Di Bella, C.M.; Jobbágy, E.G. The Timing of Global Floods and Its Association With Climate and Topography. Water Resour. Res. 2023, 59, e2022WR032968. [Google Scholar] [CrossRef]
  11. Slater, L.J.; Villarini, G. Recent Trends in U.S. Flood Risk. Geophys. Res. Lett. 2016, 43, 12428–12436. [Google Scholar] [CrossRef]
  12. Ye, S.; Li, H.-Y.; Leung, L.R.; Guo, J.; Ran, Q.; Demissie, Y.; Sivapalan, M. Understanding Flood Seasonality and Its Temporal Shifts within the Contiguous United States. J. Hydrometeorol. 2017, 18, 1997–2009. [Google Scholar] [CrossRef]
  13. Dhakal, N.; Palmer, R.N. Changing River Flood Timing in the Northeastern and Upper Midwest United States: Weakening of Seasonality over Time? Water 2020, 12, 1951. [Google Scholar] [CrossRef]
  14. Beauchamp, M.; Assani, A.A.; Landry, R.; Massicotte, P. Temporal Variability of the Magnitude and Timing of Winter Maximum Daily Flows in Southern Quebec (Canada). J. Hydrol. 2015, 529, 410–417. [Google Scholar] [CrossRef]
  15. Henstra, D.; Thistlethwaite, J. Climate Change, Floods, and Municipal Risk Sharing in Canada; Institute on Municipal Finance: Toronto, ON, CA, 2017; ISBN 978-0-7727-0974-5. [Google Scholar]
  16. Zadeh, M.S.; Burn, D.H.; O’Brien, N. Detection of Trends in Flood Magnitude and Frequency in Canada. J. Hydrol. Reg. Stud. 2020, 28, 100673. [Google Scholar] [CrossRef]
  17. Hall, J.; Arheimer, B.; Borga, M.; Brázdil, R.; Claps, P.; Kiss, A.; Kjeldsen, T.R.; Kriaučiūnienė, J.; Kundzewicz, Z.W.; Lang, M.; et al. Understanding Flood Regime Changes in Europe: A State-of-the-Art Assessment. Hydrol. Earth Syst. Sci. 2014, 18, 2735–2772. [Google Scholar] [CrossRef]
  18. Mediero, L.; Kjeldsen, T.R.; Macdonald, N.; Kohnova, S.; Merz, B.; Vorogushyn, S.; Wilson, D.; Alburquerque, T.; Blöschl, G.; Bogdanowicz, E.; et al. Identification of Coherent Flood Regions across Europe by Using the Longest Streamflow Records. J. Hydrol. 2015, 528, 341–360. [Google Scholar] [CrossRef]
  19. Hall, J.; Arheimer, B.; Aronica, G.T.; Bilibashi, A.; Boháč, M.; Bonacci, O.; Borga, M.; Burlando, P.; Castellarin, A.; Chirico, G.B.; et al. A European Flood Database: Facilitating Comprehensive Flood Research beyond Administrative Boundaries. Proc. Int. Assoc. Hydrol. Sci. 2015, 370, 89–95. [Google Scholar] [CrossRef]
  20. Blöschl, G.; Hall, J.; Parajka, J.; Perdigão, R.A.P.; Merz, B.; Arheimer, B.; Aronica, G.T.; Bilibashi, A.; Bonacci, O.; Borga, M.; et al. Changing Climate Shifts Timing of European Floods. Science 2017, 357, 588–590. [Google Scholar] [CrossRef] [PubMed]
  21. Hall, J.; Blöschl, G. Spatial Patterns and Characteristics of Flood Seasonality in Europe. Hydrol. Earth Syst. Sci. 2018, 22, 3883–3901. [Google Scholar] [CrossRef]
  22. Blöschl, G.; Hall, J.; Viglione, A.; Perdigão, R.A.P.; Parajka, J.; Merz, B.; Lun, D.; Arheimer, B.; Aronica, G.T.; Bilibashi, A.; et al. Changing Climate Both Increases and Decreases European River Floods. Nature 2019, 573, 108–111. [Google Scholar] [CrossRef]
  23. Bertola, M.; Viglione, A.; Lun, D.; Hall, J.; Blöschl, G. Flood Trends in Europe: Are Changes in Small and Big Floods Different? Hydrol. Earth Syst. Sci. 2020, 24, 1805–1822. [Google Scholar] [CrossRef]
  24. Gohari, A.; Jalali Shahrood, A.; Ghadimi, S.; Alborz, M.; Patro, E.R.; Klöve, B.; Torabi Haghighi, A. A Century of Variations in Extreme Flow across Finnish Rivers. Environ. Res. Lett. 2022, 17, 124027. [Google Scholar] [CrossRef]
  25. Lintunen, K.; Kasvi, E.; Uvo, C.B.; Alho, P. Changes in the Discharge Regime of Finnish Rivers. J. Hydrol. Reg. Stud. 2024, 53, 101749. [Google Scholar] [CrossRef]
  26. Arheimer, B.; Lindström, G. Climate Impact on Floods: Changes in High Flows in Sweden in the Past and the Future (1911–2100). Hydrol. Earth Syst. Sci. 2015, 19, 771–784. [Google Scholar] [CrossRef]
  27. Venegas-Cordero, N.; Kundzewicz, Z.W.; Jamro, S.; Piniewski, M. Detection of Trends in Observed River Floods in Poland. J. Hydrol. Reg. Stud. 2022, 41, 101098. [Google Scholar] [CrossRef]
  28. Kriauciuniene, J.; Meilutyte-Barauskiene, D.; Reihan, A.; Koltsova, T.; Lizuma, L.; Sarauskiene, D. Variability in Temperature, Precipitation and River Discharge in the Baltic States. Boreal Environ. Res. 2012, 17, 150–162. [Google Scholar]
  29. Klavins, M.; Briede, A.; Rodinov, V. Long Term Changes in Ice and Discharge Regime of Rivers in the Baltic Region in Relation to Climatic Variability. Clim. Chang. 2009, 95, 485–498. [Google Scholar] [CrossRef]
  30. Reihan, A.; Koltsova, T.; Kriauciuniene, J.; Lizuma, L.; Meilutyte-Barauskiene, D. Changes in Water Discharges of the Baltic States Rivers in the 20th Century and Its Relation to Climate Change. Hydrol. Res. 2007, 38, 401–412. [Google Scholar] [CrossRef]
  31. Apsite, E.; Bakute, A.; Elferts, D.; Kurpniece, L.; Pallo, I. Climate Change Impacts on River Runoff in Latvia. Clim. Res. 2011, 48, 57–71. [Google Scholar] [CrossRef]
  32. Latkovska, I.; Apsite, E.; Elferts, D.; Kurpniece, L. Forecasted Changes in the Climate and the River Runoff Regime in Latvian River Basins. Baltica 2012, 25, 143–152. [Google Scholar] [CrossRef]
  33. Apsite, E.; Rudlapa, I.; Latkovska, I.; Elferts, D. Changes in Latvian River Discharge Regime at the Turn of the Century. Hydrol. Res. 2013, 44, 554–569. [Google Scholar] [CrossRef]
  34. Klavins, M.; Rodinov, V. Long-Term Changes of River Discharge Regime in Latvia. Hydrol. Res. 2008, 39, 133–141. [Google Scholar] [CrossRef]
  35. Reihan, A.; Kriauciuniene, J.; Meilutyte-Barauskiene, D.; Kolcova, T. Temporal Variation of Spring Flood in Rivers of the Baltic States. Hydrol. Res. 2012, 43, 301–314. [Google Scholar] [CrossRef]
  36. Sarauskiene, D.; Kriauciuniene, J.; Reihan, A.; Klavins, M. Flood Pattern Changes in the Rivers of the Baltic Countries. J. Environ. Eng. Landsc. Manag. 2015, 23, 28–38. [Google Scholar] [CrossRef]
  37. Avotniece, Z.; Rodinov, V.; Lizuma, L.; Briede, A.; Kļaviņš, M. Trends in the Frequency of Extreme Climate Events in Latvia. Baltica 2010, 23, 135–148. [Google Scholar]
  38. Kalvane, G.; Kalvans, A.; Briede, A. Shifts of the Air Temperature in Latvia from 1991 to 2020. Folia Geogr. 2021, XIX, 118–132. [Google Scholar] [CrossRef]
  39. Kalvāns, A.; Kalvāne, G.; Zandersons, V.; Gaile, D.; Briede, A. Recent Seasonally Contrasting and Persistent Warming Trends in Latvia. Theor. Appl. Climatol. 2023, 154, 125–139. [Google Scholar] [CrossRef]
  40. Briede, A.; Apsīte, E.; Elferts, D.; Koļcova, T. Trends and Regime Shifts in Climatic Parameters and River Runoff in Latvia for the Period 1951–2020. In Proceedings of the XXXI Nordic Hydrological Conference: Hydrology and Water-related Ecosystems, Tallinn, Estonia, 15–18 August 2022. [Google Scholar]
  41. Rimkus, E.; Briede, A.; Jaagus, J.; Stonevicius, E.; Kilpys, J.; Viru, B. Snow-Cover Regime in Lithuania, Latvia and Estonia and Its Relationship to Climatic and Geographical Factors in 1961–2015. Boreal Environ. Res. 2018, 23, 193–208. [Google Scholar]
  42. Apsīte, E.; Latkovska, I.; Kļaviņš, M.; Strautnieks, I.; Aigars, J.; Ruskule, A.; Veidemane, K. Surface waters. In Latvia, Land, Nature, Nation, State; Nikodemus, O., Kļaviņš, M., Krišjāne, Z., Zelčs, V., Eds.; The University of Latvia Press: Rīga, Latvia, 2018; pp. 273–321. ISBN 978-9934-18-297-6. [Google Scholar]
  43. Zīverts, A.; Strūbergs, J. Hydrological Calculations in LATVIA (Compact Disc); Latvian University of Agriculture Press: Jelgava, Latvia, 2000. [Google Scholar]
  44. Glazacheva, L. Hydrological Districts. The Elaboration of Methodology; The University of Latvia Press: Rīga, Latvia, 1980. [Google Scholar]
  45. Kļaviņš, M.; Rodinov, V.; Draveniece, A. Largescale Atmospheric Circulation Processes as a Driving Force in the Climatic Turning Points and Regime Shifts in the Baltic Region. In Climate Change in Latvia; Kļaviņš, M., Ed.; The University of Latvia Press: Rīga, Latvia, 2017; ISBN 9984-802-70-1. [Google Scholar]
  46. Stips, A.K.; Lilover, M. Yet Another Assessment of Climate Change in the Baltic Sea Area; Breakpoints in Climate Time Series: Rīga, Latvia, 2010; pp. 1–9. [Google Scholar]
  47. Jaagus, J.; Sepp, M.; Tamm, T.; Järvet, A.; Mõisja, K. Trends and Regime Shifts in Climatic Conditions and River Runoff in Estonia during 1951–2015. Earth Syst. Dynam. 2017, 8, 963–976. [Google Scholar] [CrossRef]
  48. Wrzesiński, D.; Marsz, A.A.; Sobkowiak, L.; Styszyńska, A. Response of Low Flows of Polish Rivers to Climate Change in 1987–1989. Water 2022, 14, 2780. [Google Scholar] [CrossRef]
  49. Pewsey, A.; Neuhäuser, M.; Rxton, G.D. Circular Statistics in R; Oxford University Press: Oxford, UK, 2013. [Google Scholar]
  50. Cunderlik, J.M.; Ouarda, T.B.M.J.; Bobée, B. Determination of Flood Seasonality from Hydrological Records / Détermination de La Saisonnalité Des Crues à Partir de Séries Hydrologiques. Hydrol. Sci. J. 2004, 49, 11. [Google Scholar] [CrossRef]
  51. Agostinelli, C.; Lund, U. R Package “Circular”: Circular Statistics (Version 0.5-0). 2023. Available online: https://CRAN.R-project.org/package=circular (accessed on 15 August 2024).
  52. Bates, D.; Mächler, M.; Bolker, B.; Walker, S. Fitting Linear Mixed-Effects Models Using Lme4. J. Stat. Soft. 2015, 67, 1–48. [Google Scholar] [CrossRef]
  53. Kuznetsova, A.; Brockhoff, P.B.; Christensen, R.H.B. lmerTest Package: Tests in Linear Mixed Effects Models. J. Stat. Soft. 2017, 82, 1–26. [Google Scholar] [CrossRef]
  54. Patakamuri, S.; O’Brien, N. Modifiedmk: Modified Versions of Mann Kendall and Spearman’s Rho Trend Tests_. R Package Version 1.6. 2021. Available online: https://CRAN.R-project.Org/package=modifiedmk (accessed on 15 August 2024).
  55. Abdul Aziz, O.I.; Burn, D.H. Trends and Variability in the Hydrological Regime of the Mackenzie River Basin. J. Hydrol. 2006, 319, 282–294. [Google Scholar] [CrossRef]
  56. Birsan, M.-V.; Molnar, P.; Burlando, P.; Pfaundler, M. Streamflow Trends in Switzerland. J. Hydrol. 2005, 314, 312–329. [Google Scholar] [CrossRef]
  57. Wilks, D.S. On “Field Significance” and the False Discovery Rate. J. Appl. Meteorol. Climatol. 2006, 45, 1181–1189. [Google Scholar] [CrossRef]
  58. R Core Team, R. A Language and Environment for Statistical Computing; R Foundation for Statistical Computing: Vienna, Austria, 2023; Available online: https://www.R-Project.Org/ (accessed on 15 August 2024).
  59. Hagen, E.; Feistel, R. Climatic Turning Points and Regime Shifts in the Baltic Sea Region: The Baltic Winter Index (WIBIX) 1659–2002. Boreal Environ. Res. 2005, 10, 211–224. [Google Scholar]
  60. Rimkus, E.; Kažys, J.; Butkutė, S.; Gečaitė, I. Snow Cover Variability in Lithuania over the Last 50 Years and Its Relationship with Large-Scale Atmospheric Circulation. Boreal Environ. Res. 2014, 19, 337–357. [Google Scholar]
  61. Avotniece, Z. Characteristics and Long-Term Changes of Extreme Climate Events and Hazardous Hydrometeorological Phenomena in Latvia. Ph.D. Thesis, The University of Latvia, Rīga, Latvia, 2018. [Google Scholar]
  62. Apsite, E.; Briede, A. Trends in River Runoff in Latvia for the Period 1951–2020. Folia Geogr. 2023, 20, 7–14. [Google Scholar] [CrossRef]
  63. Jaagus, J.; Briede, A.; Rimkus, E.; Sepp, M. Changes in Precipitation Regime in the Baltic Countries in 1966–2015. Theor. Appl. Climatol. 2018, 131, 433–443. [Google Scholar] [CrossRef]
  64. Birsan, M.-V.; Zaharia, L.; Chendes, V.; Branescu, E. Seasonal Trends in Romanian Streamflow. Hydrol. Process. 2014, 28, 4496–4505. [Google Scholar] [CrossRef]
  65. Danilovich, I.S.; Loginov, V.F.; Groisman, P.Y. Changes of Hydrological Extremes in the Center of Eastern Europe and Their Plausible Causes. Water 2023, 15, 2992. [Google Scholar] [CrossRef]
  66. Apsīte, E.; Nikodemus, O.; Brūmelis, G.; Lagzdiņš, A.; Elferts, D.; Rendenieks, Z.; Klints, L. Impact of Climate Variability, Drainage and Land-Cover Changes on Hemiboreal Streamflow. Hydrol. Sci. J. 2017, 62, 2558–2570. [Google Scholar] [CrossRef]
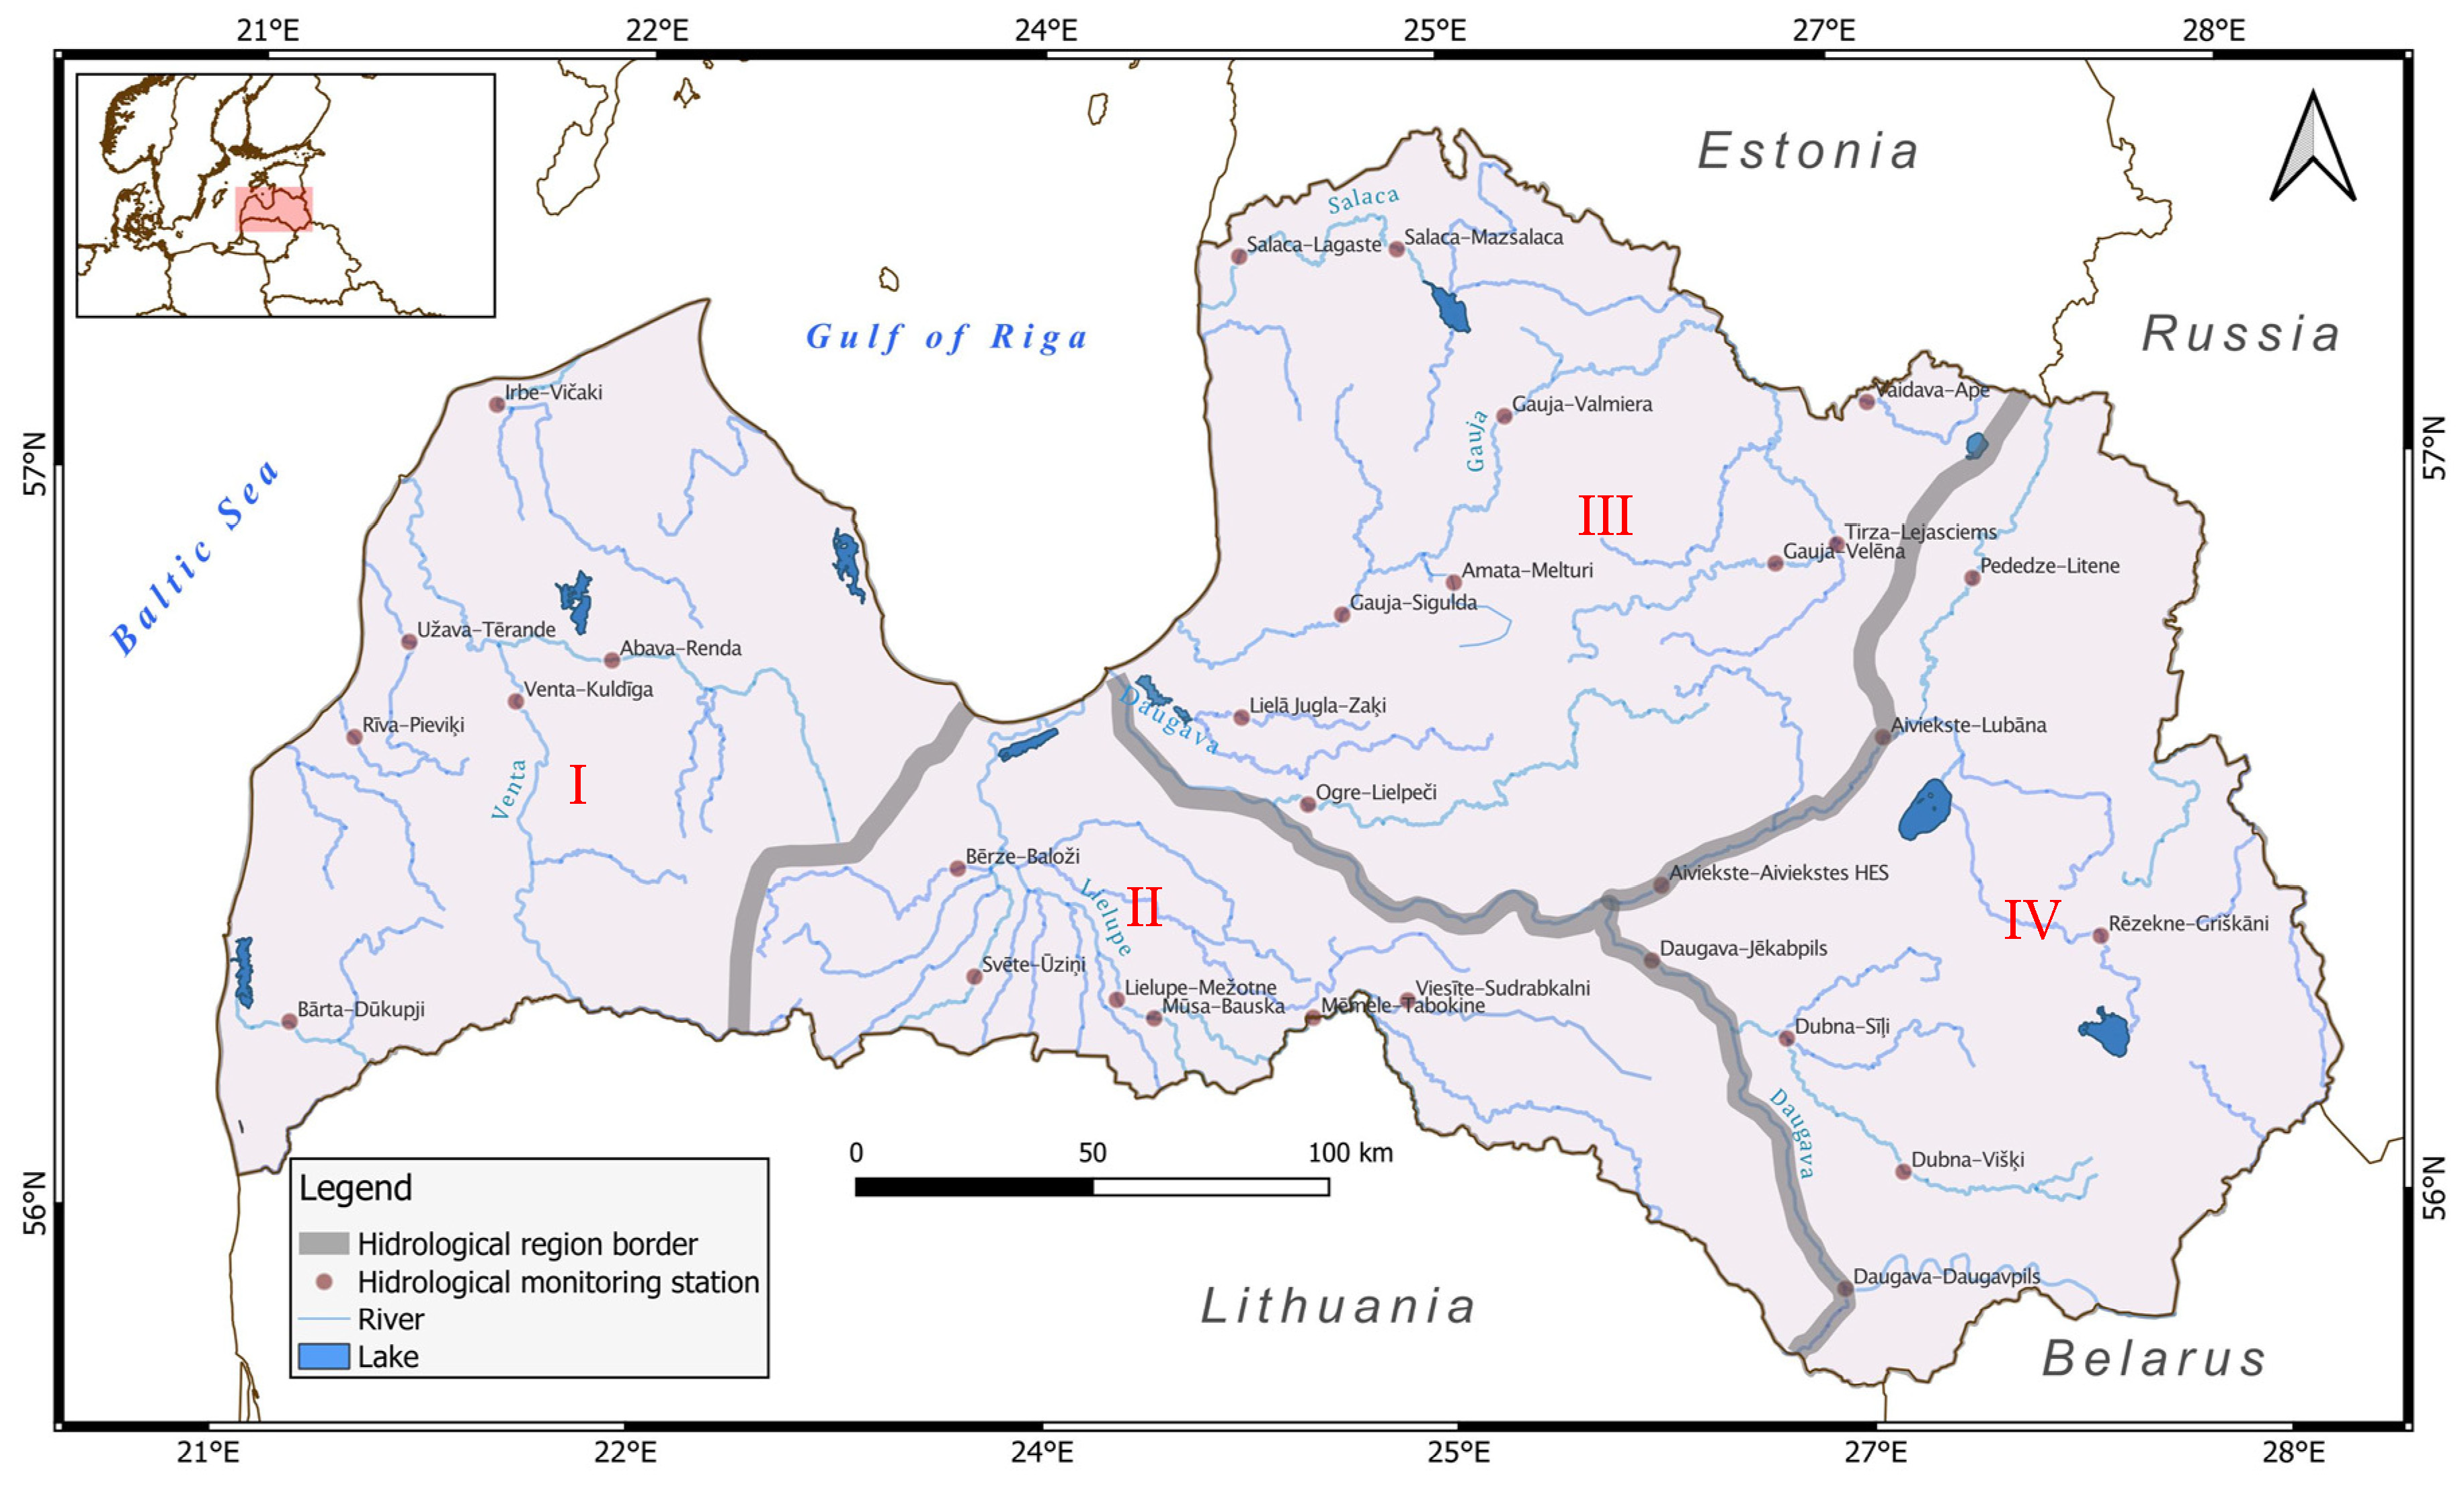
Figure 1. Map showing the location of hydrological stations and drainage regions: I—Western; II—Central; III—Northern; and IV—Eastern. The background information used for the map was obtained from the Latvian Geospatial Information Agency. The map was developed using the open-source software QGIS3.34.
Atmosphere 15 01139 g001
Figure 2. Annual mean air temperature for the period 1961–2020 mean value for Latvia (blue dots and solid line) its corresponding linear trend (dashed line) and the mean air temperature of four consecutive climate normal (thick black lines) (n = 25) Using Sen’s slope, statistically significant (p < 0.001) with a rate of change of 0.4 °C decade−1 [39].
Atmosphere 15 01139 g002
Figure 3. River hydrograph in Latvia and four hydrological regions of Latvia [33].
Atmosphere 15 01139 g003
Figure 4. Distribution of the annual Qmax observations in percentage per months, study periods, hydrological districts and Latvia as a whole.
Atmosphere 15 01139 g004
Figure 5. Percentage point changes in the distribution of the number of Qmax observations per months comparing years 1987/88−2021/22 to years 1950/51−1986/87 per hydrological regions and in Latvia.
Atmosphere 15 01139 g005
Figure 6. Results of the circular statistics analysis by using the Rayleigh test. Circular plot (grey bars) showing the mean direction and mean resultant length (from 0 at the center and 1 at the outermost line) of the annual maximum peak discharge data for each river station in a particular time period. The colored bars represent the mean resultant vector for each of the regions and Latvia as a whole (see Table 3).
Atmosphere 15 01139 g006
Figure 7. Map showing the results of trends in Mmax magnitude by using the Mann–Kendal test with blue and red symbols (see the legend) and the Theil–Sen approach with the numbers in the study period of 1950/51–2021/22 (if the mean trend value was positive, then all trends at the stations would also be positive and vice versa).
Atmosphere 15 01139 g007
Figure 8. Box-plot of Theil–Sen slope in Ls−1 km−2 decade−1 for Mmax magnitude and days per decade for Qmax timing for stations (n = 30) showing trends across Latvia.
Atmosphere 15 01139 g008
Figure 9. Long-term temporal changes in annual Mmax of floods in four hydrological regions and across Latvia in the study period of 1950/51–2021/22. Green lines present Mmax mean values and red lines present median values over the entire drainage region and across Latvia. The green area represents 95% confidence interval for the mean annual Mmax values of the hydrological year. Blue, dashed lines present the linear trend.
Atmosphere 15 01139 g009
Figure 10. Map showing the results of trends in annual Qmax timing using the Mann–Kendal test with blue and red symbols (see legend) and the Theil–Sen approach with the numbers in the study period of 1950/51–2021/22 (if the mean trend value was positive, then all trends at the stations would also be positive and vice versa).
Atmosphere 15 01139 g010
Figure 11. Long-term temporal changes in timing of annual Qmax in four drainage regions and across Latvia in the study period of 1950/51–2021/22. Green lines show mean values and red lines show median values timing across drainage regions and the country. The green area represents a 95% confidence interval for the mean timing values of the hydrological year. Blue, dashed lines show a linear decreasing trend.
Atmosphere 15 01139 g011
Figure 12. Relationship of trends in magnitude of annual Mmax and changes in timing of annual Qmax. Negative values in timing indicate early changes. The grey area represents 95% confidence interval for the period of 1950/51–2021/22.
Atmosphere 15 01139 g012
Table 1. The number of records, number and percentage of missing records, minimal, maximal, mean, median, standard deviation (SD), skewness of daily discharge data (Q, m3s−1) for each station for the whole analyzed time period.
StationNumber of RecordsMissing Records (Number)Missing Records (% of Total)MinimalMaximalMeanMedianSDSkewness
Abava Renda21,183511519.450.7281.414.27.618.13.7
Aiviekste Aiviekstes HES24,10621928.343.2540.658.338.356.22.0
Aiviekste Lubāna22,280401815.281.6301.041.928.140.41.9
Amata Melturi26,298000.199.53.51.75.24.8
Bārta Dūkupji26,298000.3382.019.88.628.03.2
Bērze Baloži22,645365313.890.285.15.22.86.63.4
Daugava Daugavpils26,2980051.06230.0443.7262.0511.63.4
Daugava Jēkabpils23,010328812.531.76923.0504.5306.4570.63.4
Dubna Sīļi26,298000.7207.013.78.715.03.3
Dubna Višķi24,51517836.78−0.348.85.43.84.71.9
Gauja Sigulda26,298006.1870.072.649.367.63.5
Gauja Valmiera26,298002.7730.046.829.748.93.7
Gauja Velēna23,74125579.72−1.2127.96.33.48.34.1
Irbe Vičaki24,83714615.561.9185.216.311.115.32.2
Lielupe Mežotne26,298002.01680.054.324.985.55.4
Lielā Jugla Zaķi25,8504481.70.2126.06.63.68.23.5
Mūsa Bauska26,1751230.470.6924.024.49.344.06.4
Ogre Lielpēči26,29080.030.5333.017.89.522.73.3
Pededze Litene22,748355013.5−7.7301.98.74.314.77.6
Rēzekne Griškāni25,03312654.810.056.63.12.03.54.1
Rīva Pieviķi21,781451717.18−2.129.32.11.22.63.0
Salaca Lagaste26,298000.8400.132.523.630.22.4
Salaca Mazsalaca26,298001.7153.020.314.916.81.7
Svēte Ūziņi26,298000.1103.02.71.14.76.2
Tabokine Mēmele26,297000.3684.019.99.731.75.6
Tirza Lejasciems25,20210964.170.1101.04.32.26.45.0
Užava Tērande21,947435116.540.458.94.12.54.12.8
Vaidava Ape26,298000.260.43.72.53.83.9
Venta Kuldīga26,298004.31300.067.935.688.73.6
Viesīte Sudrabkalni18,202809630.790.155.42.61.33.64.3
Table 2. The largest percentage share of Qmax events observed within one month, from the total number of events observed during that year, in three study periods.
Region1950/51–1986/871987/88–2021/221950/51–2021/22
WesternApril/39%February/23%April/26%
CentralApril/54%March/30%April/38%
NorthernApril/69%April/36%April/53%
EasternApril/82%April/41%April/62%
LatviaApril/63%April/30%April/47%
Table 3. Results of the circular statistics analysis by using the Rayleigh test: R shows mean resultant length, where high values indicate strong seasonality; significance level; and the average timing (day and date) of the annual flood peak over three recorded study periods (direction).
RegionRp-ValueDayDate
1950/51–1986/87
Western0.67<0.00011543 March
Central0.88<0.000118029 March
Northern0.81<0.00011886 April
Eastern0.97<0.000119210 April
Latvia0.90<0.000118130 March
1987/88–2021/22
Western0.79<0.00011285 February
Central0.87<0.00011565 March
Northern0.76<0.000116312 March
Eastern0.87<0.000117726 March
Latvia0.86<0.00011587 March
1950/51–2021/22
Western0.71<0.000114017 February
Central0.86<0.000116817 March
Northern0.77<0.000117625 March
Eastern0.91<0.00011853 April
Latvia0.86<0.000117019 March
Table 4. Results of linear mixed effects models.
RegionAverage Day/DateDifferences between Periods
1950/51–1986/871987/88–2021/22in Daysp-Value
Western153/2 March135/12 February−180.002
Central179/28 March154/3 March−25<0.0001
Northern184/2 April163/12 March−21<0.0001
Eastern191/9 April179/28 March−120.0002
in Latvia179/28 March160/9 March−19<0.0001
Disclaimer/Publisher’s Note: The statements, opinions and data contained in all publications are solely those of the individual author(s) and contributor(s) and not of MDPI and/or the editor(s). MDPI and/or the editor(s) disclaim responsibility for any injury to people or property resulting from any ideas, methods, instructions or products referred to in the content.