
Spatial Dynamic Interaction Effects and Formation Mechanisms of Air Pollution in the Central Plains Urban Agglomeration in China


Abstract
1. Introduction
2. Materials and Methods
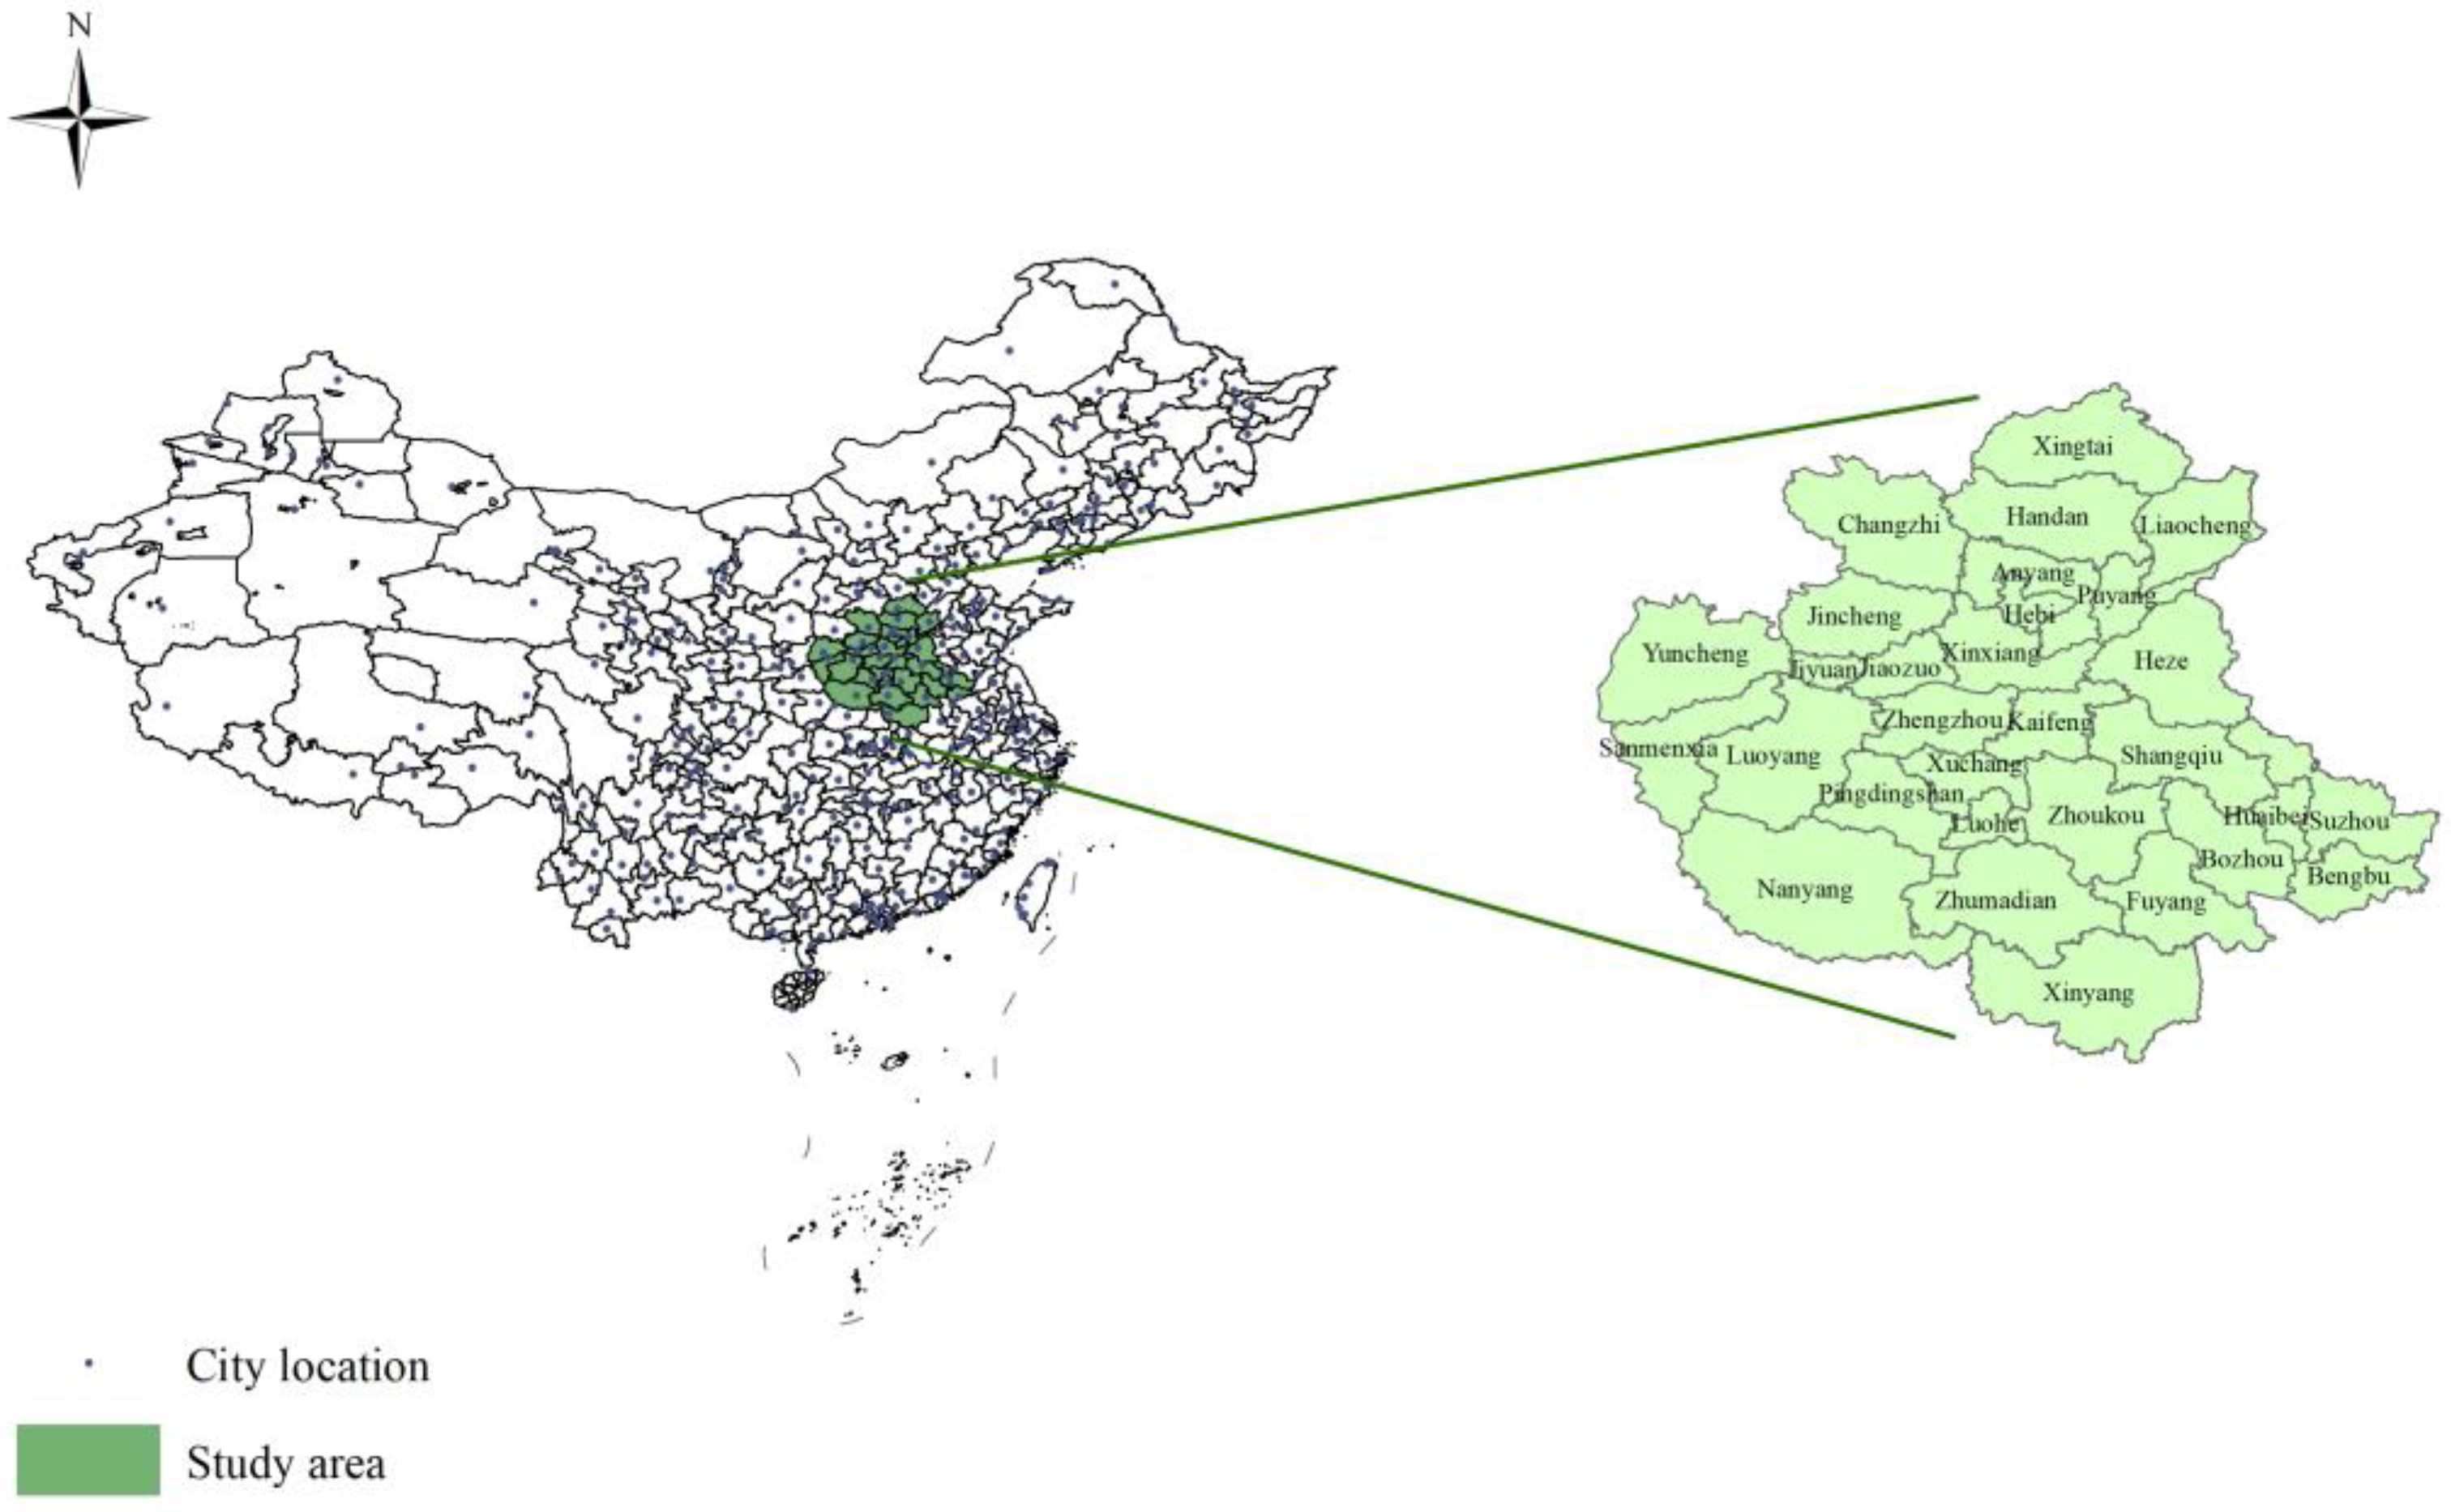
2.1. Study Area
2.2. Research Methods
2.2.1. Convergent Cross Mapping
2.2.2. Social Network Analysis
2.2.3. Block Model Analysis
2.2.4. Exponential Random Graph Models
2.3. Data Description
3. Results and Discussion
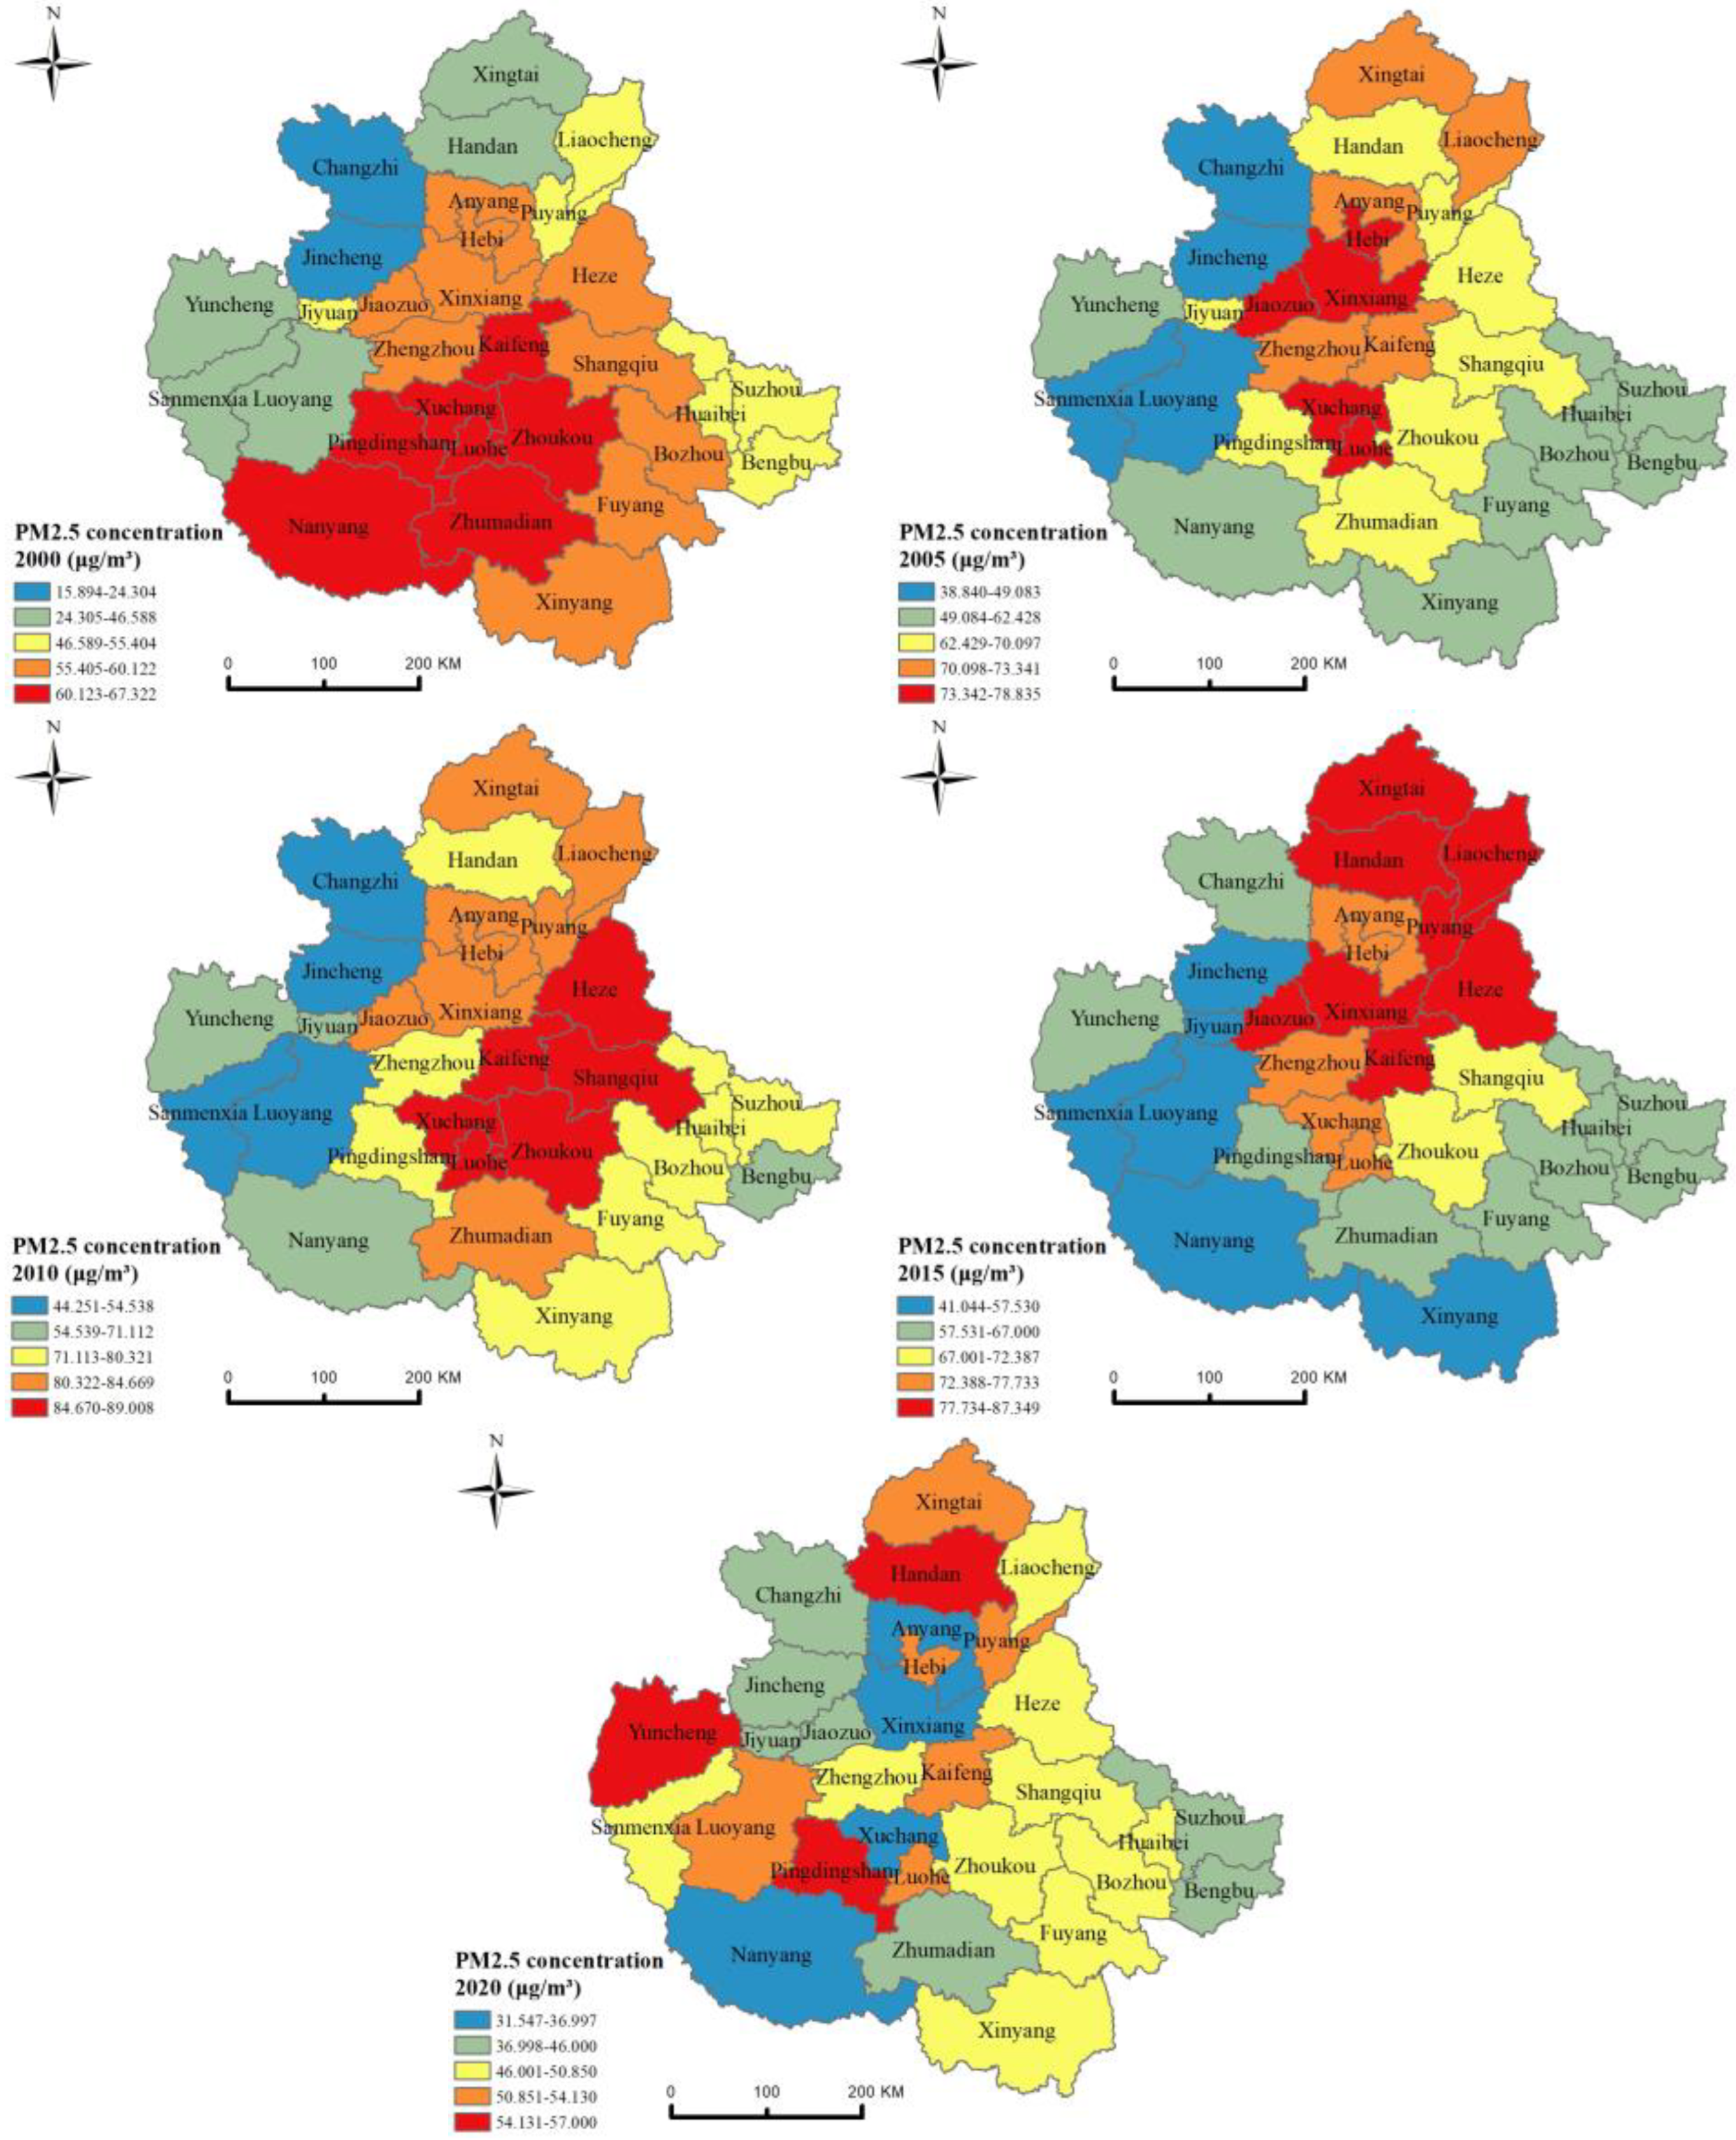
3.1. Spatial Distribution Patterns
3.2. Spatial Dynamic Interactions of Air Pollution
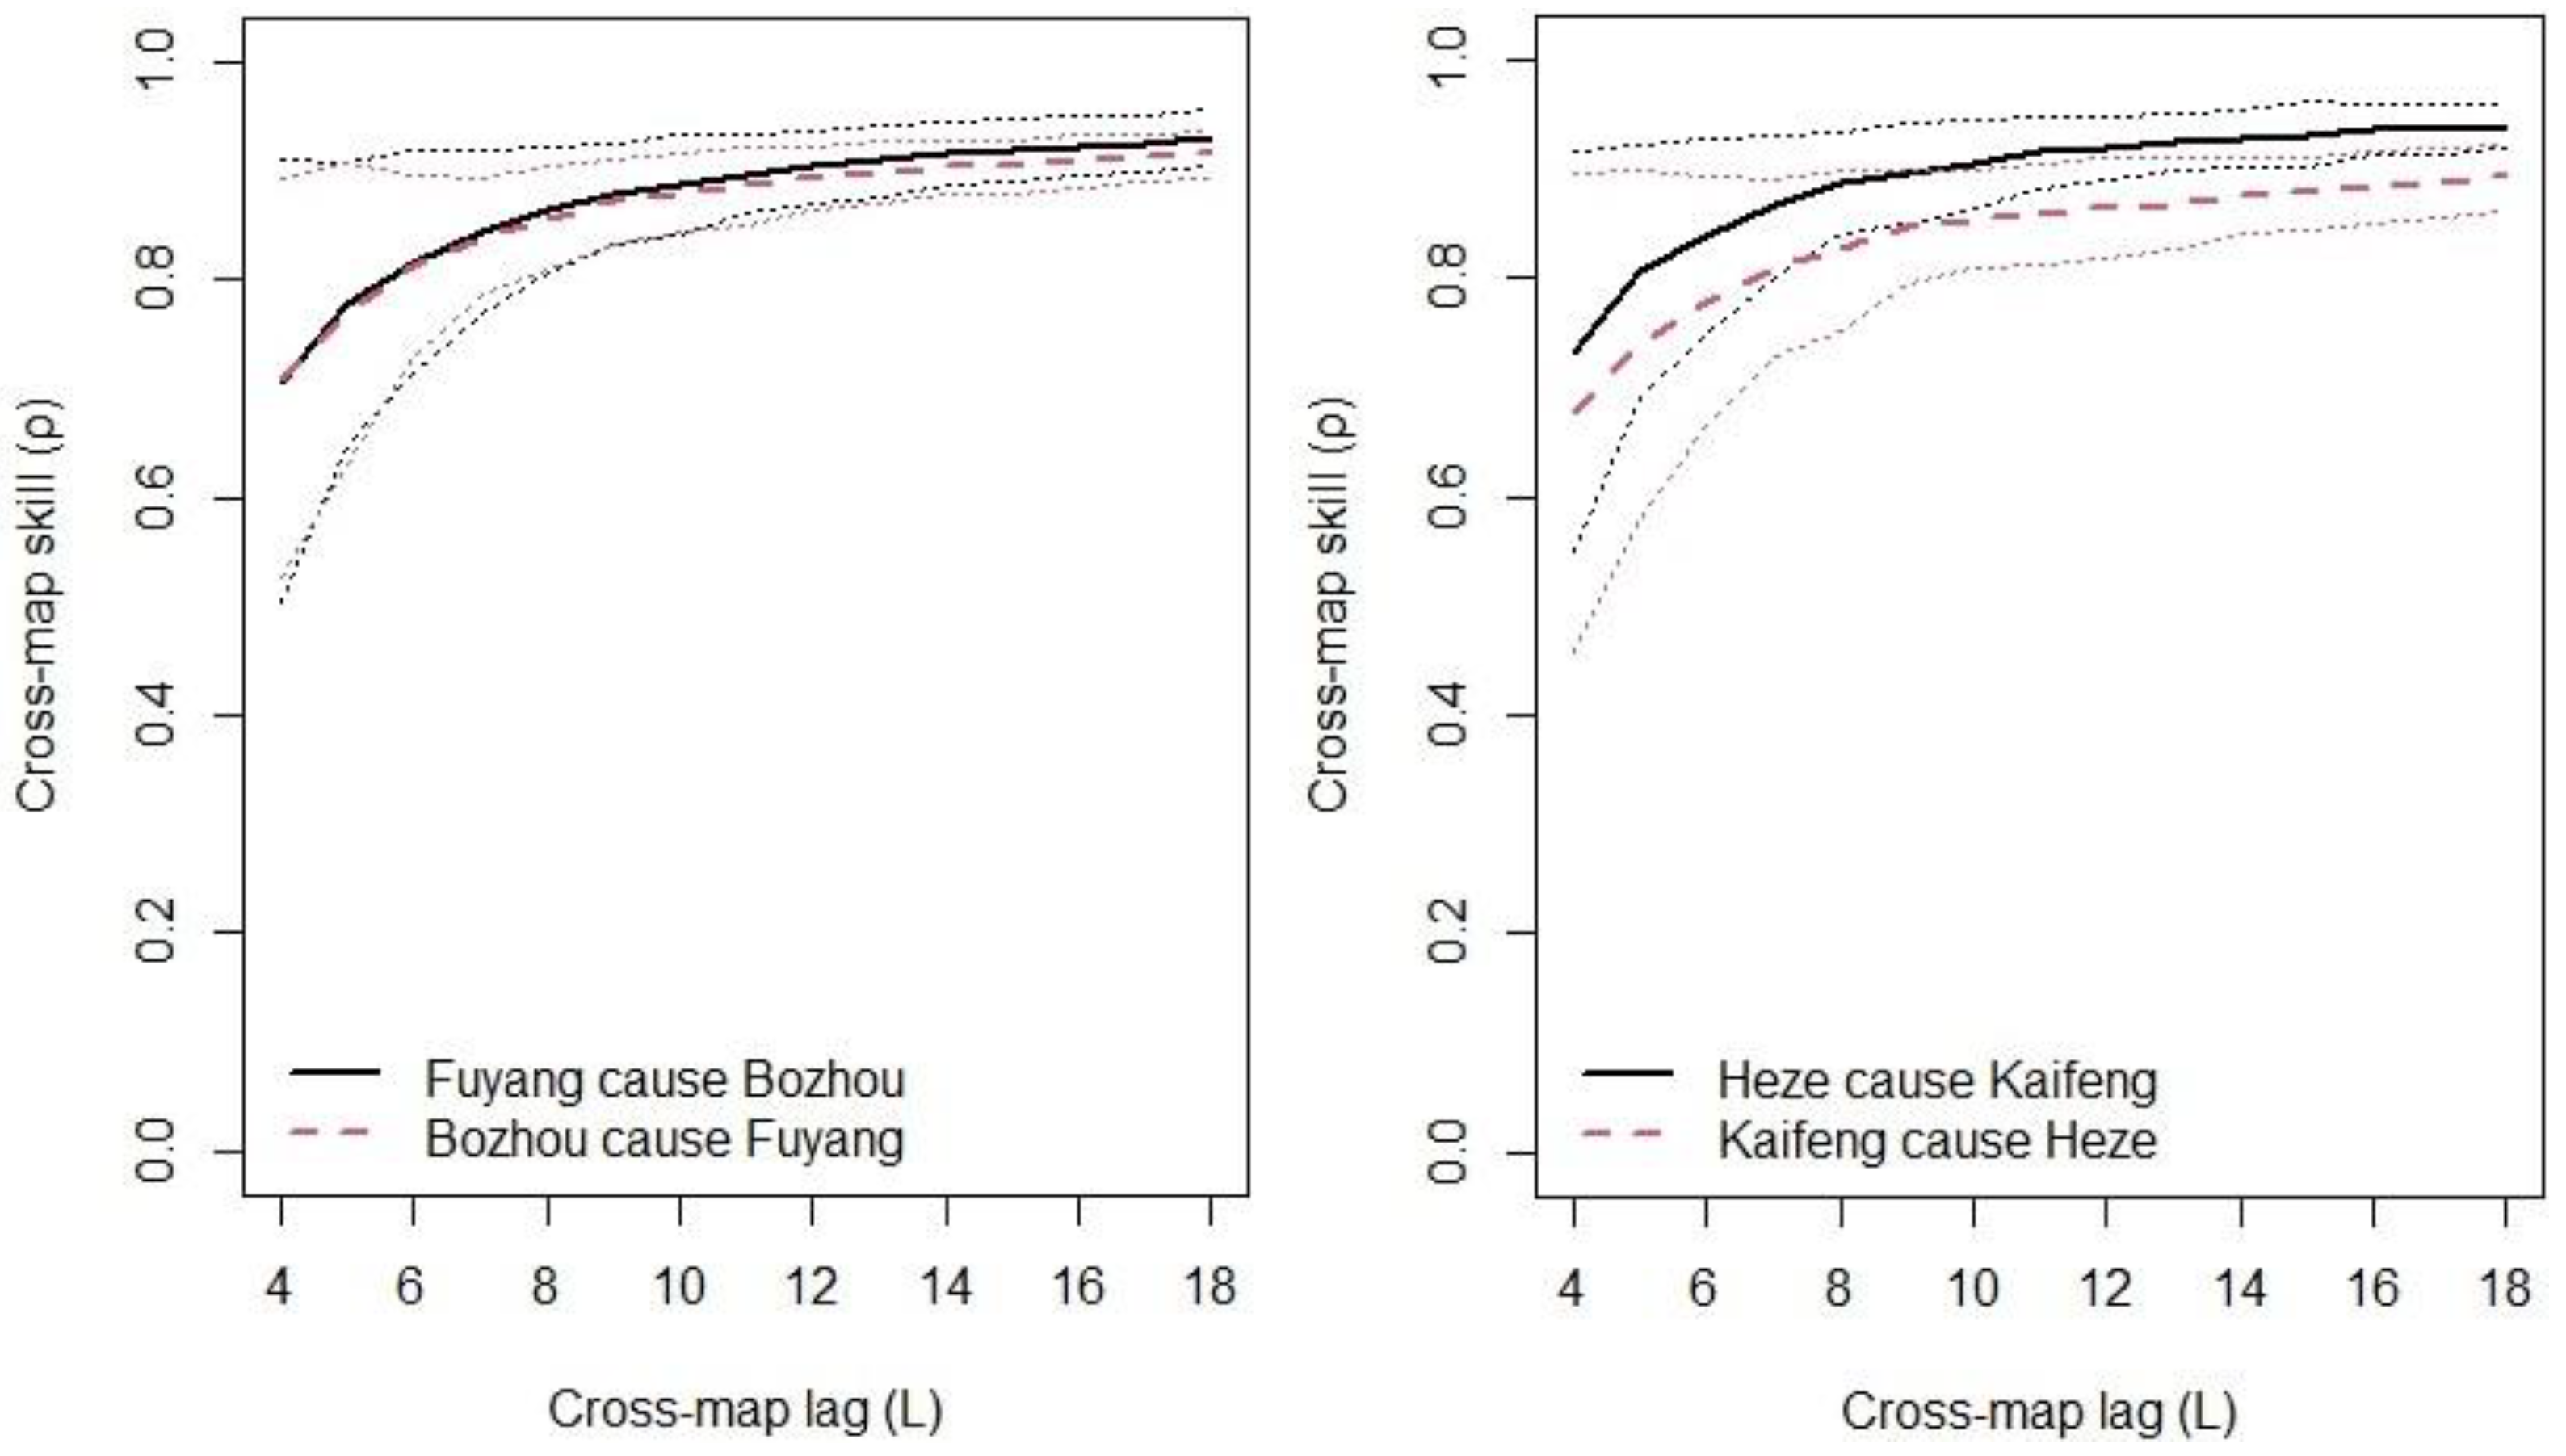
3.2.1. CCM Causality Identification
3.2.2. Overall Spatial Dynamics Interaction Effects
3.2.3. Spatial Dynamics Interaction by Period
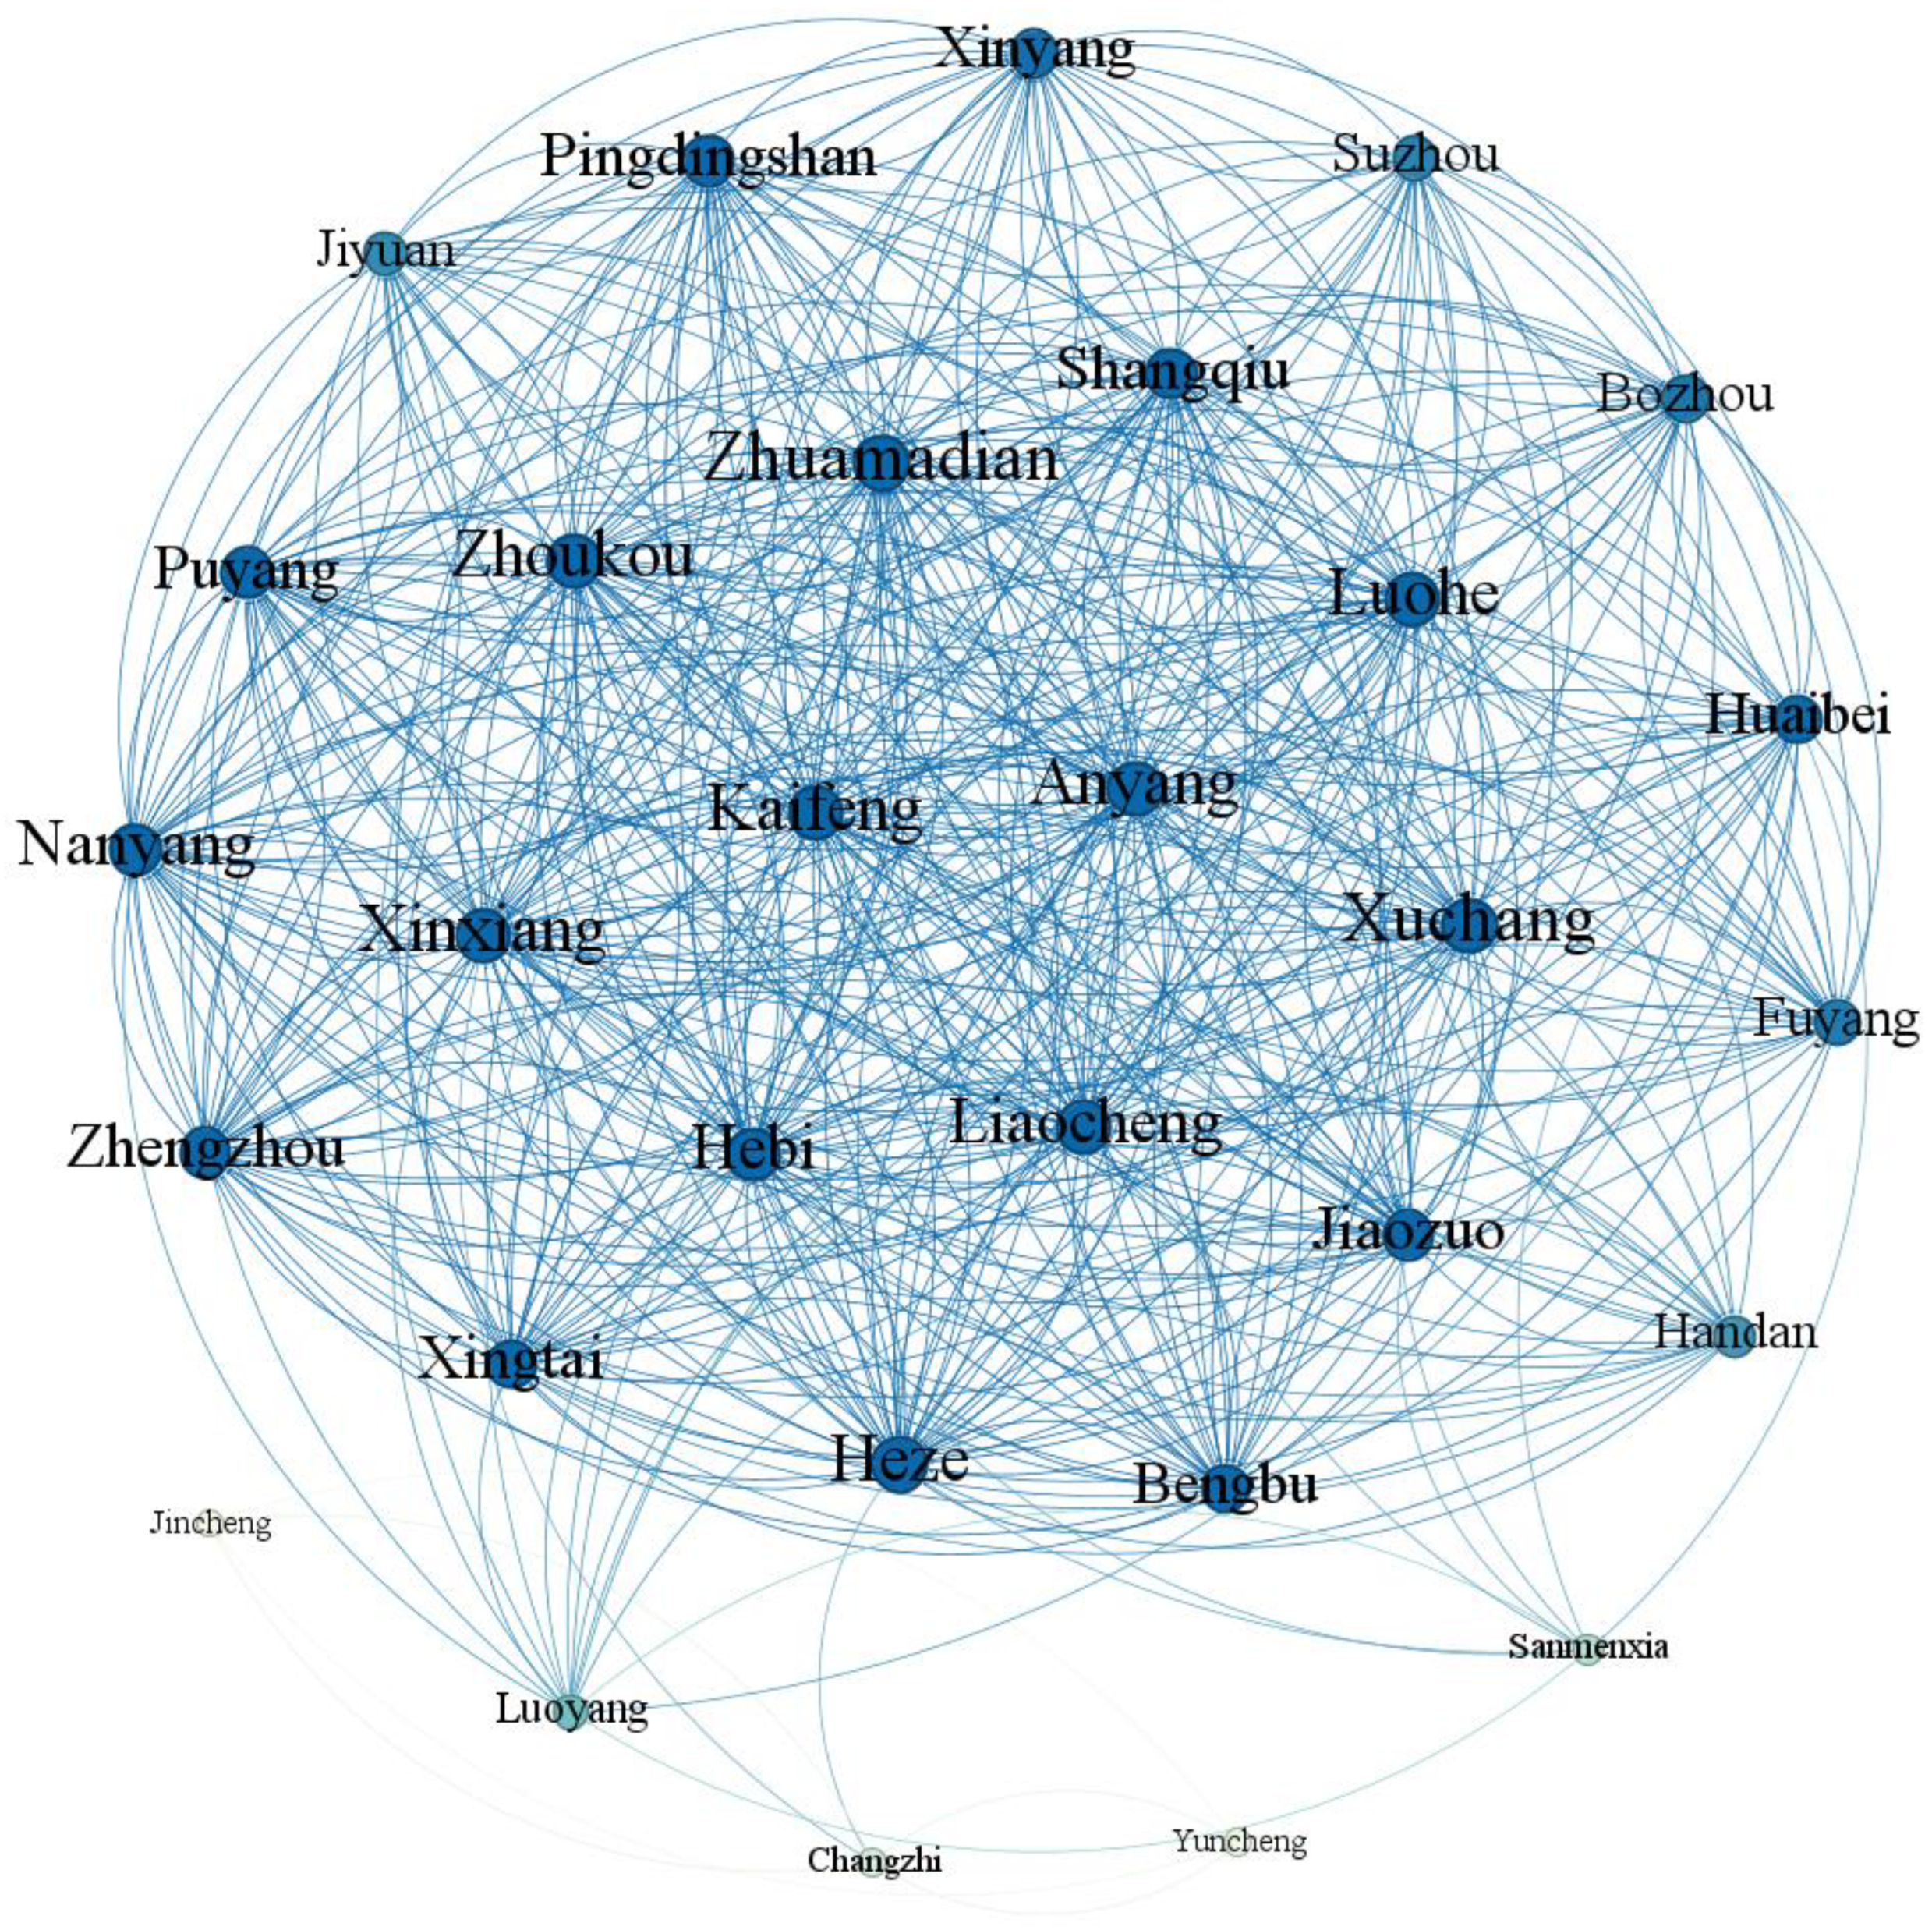
3.3. Social Network Analysis
3.3.1. Overall Characteristic Analysis
3.3.2. Individual Node Characteristics Analysis
3.3.3. Spatial Clustering Analysis
3.4. Network Influence Factors Analysis
4. Conclusions and Policy Recommendations
4.1. Conclusions
4.2. Policy Recommendations
4.3. Limitations
Author Contributions
Funding
Institutional Review Board Statement
Informed Consent Statement
Data Availability Statement
Conflicts of Interest
References
- Power, A.L.; Tennant, R.K.; Stewart, A.G.; Gosden, C.; Worsley, A.T.; Jones, R.; Love, J. The evolution of atmospheric particulate matter in an urban landscape since the Industrial Revolution. Sci. Rep. 2023, 13, 8964. [Google Scholar] [CrossRef]
- Ye, W.-F.; Ma, Z.-Y.; Ha, X.-Z. Spatial-temporal patterns of PM2.5 concentrations for 338 Chinese cities. Sci. Total Environ. 2018, 63, 524–533. [Google Scholar] [CrossRef]
- Sun, X.; Zhang, R.; Wang, G.; Guo, J.; Liu, Z. Factor decomposition, reduction potential, and rebound effect of energy consumption related PM2.5 in China. J. Clean. Prod. 2021, 322, 129088. [Google Scholar] [CrossRef]
- Song, J.; Wang, B.; Fang, K.; Yang, W. Unraveling economic and environmental implications of cutting overcapacity of industries: A city-level empirical simulation with input-output approach. J. Clean. Prod. 2019, 222, 722–732. [Google Scholar] [CrossRef]
- Zhang, Q.; Zheng, Y.; Tong, D.; Shao, M.; Wang, S.; Zhang, Y.; Hao, J. Drivers of improved PM2.5 air quality in China from 2013 to 2017. Proc. Natl. Acad. Sci. USA 2019, 116, 24463–24469. [Google Scholar] [CrossRef]
- Bisht, D.S.; Srivastava, A.K.; Pipal, A.S.; Srivastava, M.K.; Pandey, A.K.; Tiwari, S.; Pandithurai, G. Aerosol characteristics at a rural station in southern peninsular India during CAIPEEX-IGOC: Physical and chemical properties. Environ. Sci. Pollut. Res. 2015, 22, 5293–5304. [Google Scholar] [CrossRef]
- Mavroulidou, M.; Hughes, S.J.; Hellawell, E.E. A qualitative tool combining an interaction matrix and a GIS to map vulnerability to traffic induced air pollution. J. Environ. Manag. 2004, 70, 283–289. [Google Scholar] [CrossRef]
- Cheng, Z. The spatial correlation and interaction between manufacturing agglomeration and environmental pollution. Ecol. Indic. 2016, 61, 1024–1032. [Google Scholar] [CrossRef]
- Berkowicz, R.; Palmgren, F.; Hertel, O.; Vignati, E. Using measurements of air pollution in streets for evaluation of urban air quality—Meterological analysis and model calculations. Sci. Total Environ. 1996, 189, 259–265. [Google Scholar] [CrossRef]
- Chang, J.C.; Hanna, S.R. Air quality model performance evaluation. Meteorol. Atmos. Phys. 2004, 87, 167–196. [Google Scholar] [CrossRef]
- Shaddick, G.; Thomas, M.L.; Green, A.; Brauer, M.; Donkelaar, A.; Burnett, R.; Prüss-Ustün, A. Data integration model for air quality: A hierarchical approach to the global estimation of exposures to ambient air pollution. J. R. Stat. Soc. Ser. C Appl. Stat. 2018, 67, 231–253. [Google Scholar] [CrossRef]
- Vallero, D.A. Fundamentals of Air Pollution; Academic Press: Cambridge, MA, USA, 2014. [Google Scholar]
- Cogliani, E. Air pollution forecast in cities by an air pollution index highly correlated with meteorological variables. Atmos. Environ. 2001, 35, 2871–2877. [Google Scholar] [CrossRef]
- Rohrer, J.M. Thinking clearly about correlations and causation: Graphical causal models for observational data. Adv. Methods Pract. Psychol. Sci. 2018, 1, 27–42. [Google Scholar] [CrossRef]
- Zhang, Y. Dynamic effect analysis of meteorological conditions on air pollution: A case study from Beijing. Sci. Total Environ. 2019, 684, 178–185. [Google Scholar] [CrossRef]
- Liu, H.; Cui, W.; Zhang, M. Exploring the causal relationship between urbanization and air pollution: Evidence from China. Sustain. Cities Soc. 2022, 80, 103783. [Google Scholar] [CrossRef]
- Sugihara, G.; May, R.; Ye, H.; Hsieh, C.-H.; Deyle, E.; Fogarty, M.; Munch, S. Detecting causality in complex ecosystems. Science 2012, 338, 496–500. [Google Scholar] [CrossRef]
- Wu, H.; Zhang, Y.-F.; Han, S.-Q.; Wu, J.-H.; Bi, X.-H.; Shi, G.-L.; Wang, J.; Yao, Q.; Cai, Z.-Y.; Liu, J.-L.; et al. Vertical characteristics of PM2.5 during the heating season in Tianjin, China. Sci. Total Environ. 2015, 523, 152–160. [Google Scholar] [CrossRef]
- Huang, X.; Tang, G.; Zhang, J.; Liu, B.; Liu, C.; Zhang, J.; Cong, L.; Cheng, M.; Yan, G.; Gao, W.; et al. Characteristics of PM2.5 pollution in Beijing after the improvement of air quality. J. Environ. Sci. 2021, 100, 1–10. [Google Scholar] [CrossRef]
- Yu, G.; Shi, H.; Wang, S.; Zou, F.; Zhao, C. Temporal variation of air quality in Xinyang city. J. Xinyang Norm. Univ. (Nat. Sci. Ed.) 2019, 32, 426–430. [Google Scholar]
- Li, X.; Yan, H.; Zhang, Z.; Wang, H.; Fan, B. Changes of air quality index and its relationship with meteorological elements in Xinyang City. J. Xinyang Norm. Univ. (Nat. Sci. Ed.) 2020, 33, 258–264. [Google Scholar]
- Zhou, L.; Zhou, C.; Yang, F.; Che, L.; Wang, B.; Sun, D. Spatio-temporal evolution and the influencing factors of PM2.5 in China between 2000 and 2015. J. Geogr. Sci. 2019, 29, 253–270. [Google Scholar] [CrossRef]
- Hao, Y.; Liu, Y.M. The influential factors of urban PM2.5 concentrations in China: A spatial econometric analysis. J. Clean. Prod. 2016, 112, 1443–1453. [Google Scholar] [CrossRef]
- Zhai, L.; Li, S.; Zou, B.; Sang, H.; Fang, X.; Xu, S. An improved geographically weighted regression model for PM2.5 concentration estimation in large areas. Atmos. Environ. 2018, 181, 145–154. [Google Scholar] [CrossRef]
- Shisong, C.; Wenji, Z.; Hongliang, G.; Deyong, H.; You, M.; Wenhui, Z.; Shanshan, L. Comparison of remotely sensed PM2.5 concentrations between developed and developing countries: Results from the US, Europe, China, and India. J. Clean. Prod. 2018, 182, 672–681. [Google Scholar] [CrossRef]
- Habibi, R.; Alesheikh, A.A.; Mohammadinia, A.; Sharif, M. An assessment of spatial pattern characterization of air pollution: A case study of CO and PM2.5 in Tehran, Iran. ISPRS Int. J. Geo-Inf. 2017, 6, 270. [Google Scholar] [CrossRef]
- Liu, H.J.; Liu, C.M.; Sun, Y.N. Spatial correlation network structure of energy consumption and its effect in China. China Ind. Econ. 2015, 5, 83–95. [Google Scholar]
- Zhang, P.; Zhao, Y.; Zhu, X.; Cai, Z.; Xu, J.; Shi, S. Spatial structure of urban agglomeration under the impact of high-speed railway construction: Based on the social network analysis. Sustain. Cities Soc. 2020, 62, 102404. [Google Scholar] [CrossRef]
- Leng, Z.; Sun, H.; Cheng, J.; Wang, H.; Yao, Z. China’s rare earth industry technological innovation structure and driving factors: A social network analysis based on patents. Resour. Policy 2021, 73, 102233. [Google Scholar] [CrossRef]
- Tabassum, S.; Pereira, F.S.F.; Fernandes, S.; Gama, J. Social network analysis: An overview. WIREs Data Min. Knowl. Discov. 2018, 8, e1256. [Google Scholar] [CrossRef]
- Liu, S.; Chevallier, J.; Xiao, Q. Identifying influential countries in air pollution control technologies: A social network analysis approach. J. Clean. Prod. 2023, 389, 136018. [Google Scholar] [CrossRef]
- Li, X.; Zhao, J.; Wang, Y. Research on industrial division of labor and economic relations in Central Plains urban agglomerations. J. Xinyang Norm. Univ. (Nat. Sci. Ed.) 2009, 22, 418–422. [Google Scholar]
- Friedkin, N.E. The development of structure in random networks: An analysis of the effects of increasing network density on five measures of structure. Soc. Netw. 1981, 3, 41–52. [Google Scholar] [CrossRef]
- Ibarra, H.; Andrews, S.B. Power, social influence, and sense making: Effects of network centrality and proximity on employee perceptions. Adm. Sci. Q. 1993, 38, 277–303. [Google Scholar] [CrossRef]
- Wang, M. Evolution and influencing factors of international trade implied carbon emission network pattern. J. Xinyang Norm. Univ. (Philos. Soc. Sci. Ed.) 2020, 40, 19–26. [Google Scholar]
- Gong, Y.; Sun, H.; Wang, Z.; Ding, C. Spatial correlation network pattern and evolution mechanism of natural gas consumption in China—Complex network-based ERGM model. Energy 2023, 285, 129400. [Google Scholar] [CrossRef]
- Wasserman, S.; Pattison, P. Logit models and logistic regressions for social networks: I. An introduction to Markov graphs and p. Psychometrika 1996, 61, 401–425. [Google Scholar] [CrossRef]
- Roberts, S. Interactions between particulate air pollution and temperature in air pollution mortality time series studies. Environ. Res. 2004, 96, 328–337. [Google Scholar] [CrossRef]
- Cerveny, R.S.; Balling, R.C. Weekly cycles of air pollutants, precipitation and tropical cyclones in the coastal NW Atlantic region. Nature 1998, 394, 561–563. [Google Scholar] [CrossRef]
- Rosenfeld, D.; Dai, J.; Yu, X.; Yao, Z.; Xu, X.; Yang, X.; Du, C. Inverse relations between amounts of air pollution and orographic precipitation. Science 2007, 315, 1396–1398. [Google Scholar] [CrossRef]
- Carson, R.T.; Jeon, Y.; McCubbin, D.R. The relationship between air pollution emissions and income: US data. Environ. Dev. Econ. 1997, 2, 433–450. [Google Scholar] [CrossRef]
- Song, W.; Wang, C.; Chen, W.; Zhang, X.; Li, H.; Li, J. Unlocking the spatial heterogeneous relationship between Per Capita GDP and nearby air quality using bivariate local indicator of spatial association. Resour. Conserv. Recycl. 2020, 160, 104880. [Google Scholar] [CrossRef]
- Chen, B.; Kan, H. Air pollution and population health: A global challenge. Environ. Health Prev. Med. 2008, 13, 94–101. [Google Scholar] [CrossRef]
- Chen, J.; Wang, B.; Huang, S.; Song, M. The influence of increased population density in China on air pollution. Sci. Total Environ. 2020, 735, 139456. [Google Scholar] [CrossRef] [PubMed]
- Fujii, H.; Managi, S. Economic development and multiple air pollutant emissions from the industrial sector. Environ. Sci. Pollut. Res. 2016, 23, 2802–2812. [Google Scholar] [CrossRef] [PubMed]
- Sugihara, G.; May, R.M. Nonlinear forecasting as a way of distinguishing chaos from measurement error in time series. Nature 1990, 344, 734–741. [Google Scholar] [CrossRef]
- Chen, H.; Mehra, A.; Tasselli, S.; Borgatti, S.P. Network dynamics and organizations: A review and research agenda. J. Manag. 2022, 48, 1602–1660. [Google Scholar] [CrossRef]
- Johannes, P. Introduction to network modeling using exponential random graph models (ERGM): Theory and an application using R-project. Comput. Econ. 2019, 54, 845–875. [Google Scholar]
- Li, J. Structural Characteristics and Evolution Trend of Collaborative Governance of Air Pollution in “2 + 26” Cities from the Perspective of Social Network Analysis. Sustainability 2023, 15, 5943. [Google Scholar] [CrossRef]
- Guo, F.; Wang, Z.; Ji, S.; Lu, Q. Influential nodes identification in the air pollution spatial correlation weighted networks and collaborative governance: Taking China’s three urban agglomerations as examples. Int. J. Environ. Res. Public Health 2022, 19, 4461. [Google Scholar] [CrossRef]
- Li, X.; Yan, J.; Niu, J.; Chen, F.; Yan, J. Spatial and temporal characteristics of PM2.5-O3 composite pollution in Henan Province from 2015 to 2021. J. Xinyang Norm. Univ. (Nat. Sci. Ed.) 2024, 37, 281–285. [Google Scholar]
- Yang, C.; Zhuo, Q.; Chen, J.; Fang, Z.; Xu, Y. Analysis of the spatio-temporal network of air pollution in the Yangtze River Delta urban agglomeration, China. PLoS ONE 2022, 17, e0262444. [Google Scholar] [CrossRef] [PubMed]
- Zhang, D.; Lu, Y.; Tian, Y. Spatial association effect of haze pollution in Cheng-Yu urban agglomeration. Sci. Rep. 2020, 10, 9753. [Google Scholar] [CrossRef] [PubMed]
- Su, Y.; Yu, Y.-Q. Spatial association effect of regional pollution control. J. Clean. Prod. 2019, 213, 540–552. [Google Scholar] [CrossRef]


| Window Phase | Emission Effect Intensity | Receiving Effect Intensity | ||||||||
|---|---|---|---|---|---|---|---|---|---|---|
| Heze | Kaifeng | Liaocheng | Zhoukou | Puyang | Luohe | Xuchang | Xinxiang | Kaifeng | Anyang | |
| 00–02 | 20.206 | 20.214 | 19.506 | 19.334 | 19.309 | 20.289 | 20.264 | 20.194 | 20.203 | 20.049 |
| 01–03 | 20.209 | 20.179 | 19.439 | 19.349 | 19.227 | 20.349 | 20.307 | 20.254 | 20.220 | 20.143 |
| 02–04 | 20.255 | 20.250 | 19.589 | 19.488 | 19.413 | 20.597 | 20.513 | 20.428 | 20.379 | 20.224 |
| 03–05 | 20.282 | 20.209 | 19.622 | 19.523 | 19.428 | 20.667 | 20.653 | 20.483 | 20.419 | 20.403 |
| 04–06 | 20.316 | 20.297 | 19.627 | 19.610 | 19.567 | 20.761 | 20.769 | 20.537 | 20.467 | 20.557 |
| 05–07 | 20.441 | 20.388 | 19.834 | 19.731 | 19.613 | 20.998 | 20.800 | 20.764 | 20.616 | 20.609 |
| 06–08 | 20.471 | 20.419 | 19.642 | 19.687 | 19.813 | 20.943 | 21.016 | 20.671 | 20.584 | 20.694 |
| 07–09 | 20.523 | 20.375 | 19.751 | 19.734 | 19.711 | 21.386 | 21.285 | 21.022 | 20.961 | 20.686 |
| 08–10 | 20.491 | 20.461 | 19.169 | 19.910 | 20.019 | 21.546 | 21.642 | 20.492 | 21.164 | 20.641 |
| 09–11 | 20.621 | 20.698 | 20.049 | 20.416 | 20.049 | 21.849 | 21.489 | 21.067 | 20.894 | 20.889 |
| 10–12 | 20.792 | 20.641 | 20.541 | 19.843 | 20.112 | 22.064 | 21.249 | 21.649 | 21.349 | 20.984 |
| 11–13 | 20.471 | 20.556 | 20.040 | 19.671 | 19.876 | 21.649 | 21.164 | 21.421 | 20.876 | 20.661 |
| 12–14 | 20.667 | 20.417 | 20.331 | 20.001 | 20.134 | 21.669 | 21.541 | 21.341 | 21.034 | 20.871 |
| 13–15 | 20.613 | 20.399 | 20.201 | 20.164 | 19.864 | 21.541 | 21.473 | 20.864 | 20.671 | 20.314 |
| 14–16 | 20.743 | 20.541 | 20.246 | 20.019 | 20.164 | 21.550 | 21.400 | 20.946 | 20.764 | 20.513 |
| 15–17 | 20.640 | 20.216 | 20.349 | 19.671 | 19.943 | 21.506 | 21.246 | 20.716 | 20.664 | 20.530 |
| 16–18 | 20.513 | 20.016 | 19.973 | 19.780 | 19.641 | 21.300 | 21.149 | 20.846 | 20.604 | 20.431 |
| 17–19 | 20.556 | 20.164 | 20.049 | 19.704 | 19.430 | 21.294 | 21.204 | 20.877 | 20.159 | 20.300 |
| 18–20 | 20.319 | 20.013 | 19.870 | 19.647 | 19.216 | 21.001 | 20.846 | 20.613 | 20.443 | 20.304 |
| City | Outdegree | Indegree | Degree | Betweenness | Closeness |
|---|---|---|---|---|---|
| Handan | 15 | 11 | 26 | 0.000 | 4.947 |
| Xingtai | 18 | 20 | 38 | 2.363 | 5.375 |
| Changzhi | 4 | 2 | 6 | 54.000 | 1.807 |
| Jincheng | 2 | 2 | 4 | 0.000 | 0.867 |
| Yuncheng | 2 | 2 | 4 | 0.000 | 0.867 |
| Bengbu | 21 | 16 | 37 | 3.859 | 5.441 |
| Huaibei | 21 | 16 | 37 | 62.456 | 5.446 |
| Fuyang | 16 | 17 | 33 | 3.014 | 5.300 |
| Suzhou | 21 | 10 | 31 | 1.787 | 5.441 |
| Bozhou | 18 | 16 | 34 | 2.832 | 5.300 |
| Liaocheng | 23 | 22 | 45 | 8.325 | 5.672 |
| Heze | 23 | 24 | 47 | 53.387 | 5.723 |
| Zhengzhou | 20 | 21 | 41 | 5.343 | 5.505 |
| Kaifeng | 23 | 24 | 47 | 8.909 | 5.619 |
| Luoyang | 14 | 2 | 16 | 1.313 | 4.829 |
| Pingdingshan | 18 | 24 | 42 | 4.911 | 5.620 |
| Anyang | 22 | 24 | 46 | 9.412 | 5.724 |
| Hebi | 20 | 25 | 45 | 9.853 | 5.724 |
| Xinxiang | 21 | 25 | 46 | 39.307 | 5.871 |
| Jiaozuo | 20 | 20 | 40 | 7.650 | 5.508 |
| Puyang | 20 | 22 | 42 | 4.185 | 5.564 |
| Xuchang | 22 | 26 | 48 | 11.918 | 5.724 |
| Luohe | 21 | 25 | 46 | 7.023 | 5.672 |
| Sanmenxia | 7 | 2 | 9 | 0.000 | 3.613 |
| Nanyang | 20 | 24 | 44 | 5.116 | 5.620 |
| Shangqiu | 20 | 21 | 41 | 3.824 | 5.504 |
| Xinyang | 14 | 22 | 36 | 5.373 | 5.504 |
| Zhoukou | 23 | 23 | 46 | 8.729 | 5.563 |
| Zhumadian | 23 | 25 | 48 | 11.532 | 5.672 |
| Jiyuan | 15 | 14 | 29 | 1.576 | 4.942 |
| Plate | Relations Received | Relations Sent | Expected Internal Relations | Actual Internal Relations | ||
|---|---|---|---|---|---|---|
| Inside | Outside | Inside | Outside | |||
| I | 205 | 115 | 205 | 116 | 51.724% | 63.863% |
| II | 78 | 119 | 78 | 99 | 27.586% | 44.068% |
| III | 6 | 0 | 6 | 2 | 6.897% | 75.000% |
| IV | 2 | 12 | 2 | 19 | 3.448% | 9.524% |
| Plate | Density Matrix | Image Matrix | ||||||
|---|---|---|---|---|---|---|---|---|
| I | II | III | IV | I | II | III | IV | |
| I | 0.958 | 0.632 | 1 | 0 | 1 | 1 | 1 | 0 |
| II | 0.722 | 0.986 | 0 | 0.111 | 1 | 1 | 0 | 0 |
| III | 0.021 | 0.037 | 1 | 0 | 0 | 0 | 1 | 0 |
| IV | 0.531 | 0.611 | 0 | 1 | 0 | 1 | 0 | 1 |
| Base Model | Node Covariate | Network Covariate | ||
|---|---|---|---|---|
| (1) | (2) | (3) | (4) | |
| Network self-organization effect | ||||
| Edges | −2.1567 (0.0196) | −1.9234 (0.0179) | −2.4691 (0.0579) | −2.8973 (0.0713) |
| Mutual | 1.1784 (0.0271) | 1.2620 (0.0304) | 1.1648 (0.0288) | 1.0094 (0.0416) |
| Individual attribute effect | ||||
| Mid AP | 0.2861 (0.0112) | 0.1457 (0.0211) | 0.1978 (0.0164) | 0.1447 (0.0184) |
| High AP | 0.5547 (0.0195) | 0.5249 (0.0260) | 0.3267 (0.0228) | 0.2513 (0.0307) |
| Rain | −0.0237 (0.0118) | 0.0201 (0.0123) | ||
| Temp | 0.0328 (0.0579) | 0.0319 (0.0649) | ||
| Rgdp | 0.1597 (0.0249) | 0.1794 (0.0230) | ||
| Pop | 0.0198 (0.0106) | 0.0202 (0.0109) | ||
| Ind | 0.1312 (0.0306) | 0.0165 (0.0284) | ||
| Exogenous network effect | ||||
| Geographic location | 1.1216 (0.3197) | |||
| Climate linkage | 0.2449 (0.0497) | |||
| Economic linkage | 0.3167 (0.0515) | |||
Disclaimer/Publisher’s Note: The statements, opinions and data contained in all publications are solely those of the individual author(s) and contributor(s) and not of MDPI and/or the editor(s). MDPI and/or the editor(s) disclaim responsibility for any injury to people or property resulting from any ideas, methods, instructions or products referred to in the content. |
© 2024 by the authors. Licensee MDPI, Basel, Switzerland. This article is an open access article distributed under the terms and conditions of the Creative Commons Attribution (CC BY) license (https://creativecommons.org/licenses/by/4.0/).
Share and Cite
Huang, J.; Lu, H.; Huang, Y. Spatial Dynamic Interaction Effects and Formation Mechanisms of Air Pollution in the Central Plains Urban Agglomeration in China. Atmosphere 2024, 15, 984. https://doi.org/10.3390/atmos15080984
Huang J, Lu H, Huang Y. Spatial Dynamic Interaction Effects and Formation Mechanisms of Air Pollution in the Central Plains Urban Agglomeration in China. Atmosphere. 2024; 15(8):984. https://doi.org/10.3390/atmos15080984
Chicago/Turabian StyleHuang, Jie, Hongyang Lu, and Yajun Huang. 2024. "Spatial Dynamic Interaction Effects and Formation Mechanisms of Air Pollution in the Central Plains Urban Agglomeration in China" Atmosphere 15, no. 8: 984. https://doi.org/10.3390/atmos15080984
APA StyleHuang, J., Lu, H., & Huang, Y. (2024). Spatial Dynamic Interaction Effects and Formation Mechanisms of Air Pollution in the Central Plains Urban Agglomeration in China. Atmosphere, 15(8), 984. https://doi.org/10.3390/atmos15080984