Abstract
The Tarim Basin in the western part of Northwest China (NWC) is the largest inland basin in the world and one of the most arid regions in the middle latitudes. In recent years, heavy precipitation events have occurred frequently in this region, especially in the western Tarim Basin (WTB), due to the climate change. Based on the hourly precipitation data from 2010 to 2022, the diurnal variation in summer precipitation and the characteristics of precipitation events with different durations in WTB have been analyzed. The results mainly show that (1) the diurnal variations in the precipitation amount (PA), precipitation frequency (PF) and precipitation intensity (PI) mainly present a unimodal pattern, but the times of maximum value do not coincide. The peak value of PA and PF appears between 01:00 and 03:00 BJT (Beijing Time), while the valley value appears around 18:00 BJT, yet the peak value of PI appears between 20:00 and 23:00 BJT with no obvious valley value. (2) There are some differences in the diurnal variation characteristics of precipitation among different summer months and different regions. (3) During the past decade, the precipitation structure in WTB has been continuously adjusted, and short-duration- and long-duration-precipitation-dominant periods appear alternately. On the whole, short-duration precipitation has been more frequent in summer, accounting for 70% of the total precipitation events and 40% of the total accumulated precipitation amount. These results can help us to better understand the refined physical characteristics of precipitation events and enhance our understanding of the local climate in the WTB under the background of climate change.
1. Introduction
Diurnal variation in precipitation is caused by the joint influence of atmospheric thermal and dynamic processes on the hydrological cycle [1,2,3], which involves multiple physical and chemical processes of water vapor phase transition, and it is also affected by the comprehensive effects of different scales of sea–land–air systems and complex terrain [4,5,6,7]. Detailed analyses of precipitation diurnal variation help researchers to acquire the physical characteristics of refined weather processes or precipitation events, enhance understanding of the local climate [8,9,10,11,12,13] and are conducive to the validating of certain parameterization schemes in numerical models [14,15,16]. Using all of the multi-source observation data, especially the long-series observation data from surface stations, to analyze and study the characteristics of precipitation diurnal variation is an important aspect of weather and climate research and forecasting [17,18].
The Tarim Basin in the western part of Northwest China (NWC) is the largest inland basin in the world and one of the most arid regions in the middle latitudes, surrounded by the Tibet Plateau, Pamir Plateau and Tianshan Mountains, with the Taklimakan Desert at its center [19]. Due to the complex and fragile mountain–desert–oasis ecosystem in the Tarim Basin [20,21,22], precipitation has a great impact on the local ecological environment and water resources. Understanding the precipitation variations in this region and their physical process is very important, not only for the regional ecosystem but also for the environmental management of East Asian countries. With the climate in the arid region in NWC presenting a “warming and wetting” trend [20,23,24,25], heavy precipitation events have occurred frequently in the Tarim Basin in recent years, especially in the western Tarim Basin (WTB) [26,27]. Due to the maximum daily precipitation observed by the regional station in this region in the summer, which is similar to the average annual precipitation (the annual precipitation in the Tarim Basin is generally less than 100 mm [28]), such short-duration heavy precipitation events are highly disastrous. Based on the existing research achievements and forecasting technology, the ability to finely forecast heavy rain and torrential rain in this region is weak [29,30], which seriously affects the development of water resources and the security of the ecological environment. Meanwhile, the Tarim Basin is an important production area for major agricultural products and characteristic fruits in NWC, as well as a core region of the “Silk Road Economic Belt” and the starting point of the “China-Pakistan economic corridor” [16]. Therefore, a comprehensive and in-depth study of the characteristics of precipitation change in this region has important theoretical and practical significance.
At present, limited by the spatial density and time length of the observation data, the studies on diurnal variation characteristics of precipitation in the WTB are mostly based on the observation data from Kashi station (station ID is 51709), and the study period ends before 2014 [31,32,33]. In-depth statistical analysis of precipitation diurnal variation characteristics in the last ten years is still lacking. Therefore, this study aims to conduct a statistical analysis of the diurnal variation characteristics of summer precipitation in this region based on the hourly precipitation observation data of ten national meteorological observation stations over the recent decade. Additionally, we investigate the characteristics of precipitation events with different durations, so as to deepen understanding of precipitation in this region.
2. Materials and Methods
In this study, the automatically recorded hourly precipitation data over the WTB were analyzed. The surface precipitation dataset was obtained from the National Meteorological Information Center of the China Meteorological Administration, and it was quality-controlled and consistency-checked. Because of the sparse distribution of observation stations and the reduced annual precipitation, except at Kashi Station (station ID is 51709), hourly observation data have only been available since the 2000s at other stations in the WTB. Moreover, there are also gaps in observation data due to site changes and observation service adjustments [34,35]. By considering the integrity of the dataset, the hourly precipitation data of ten national stations in this region from 2010 to 2022 in summer (from June to August) were used to analyze the diurnal variation characteristics of precipitation. The selected period was consistent with the recently published research on the dry–wet interdecadal transition in the Tarim Basin region [23]. The distribution of ten national stations in this region is depicted in Figure 1.
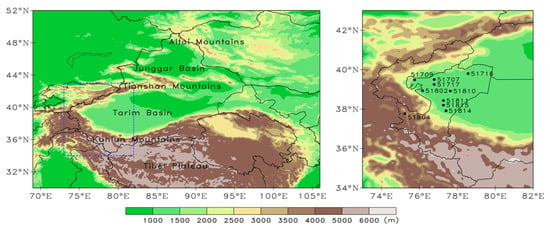
Figure 1.
The location distribution of ten national observation stations in the western Tarim Basin (WTB) (The right picture is the blue dotted line box in the left picture.). Shading denotes the topographic height (m).
The hourly rainfall event was identified when the accumulated precipitation amount at a certain station was equal to or larger than 0.1 mm within an hour [36]. This study primarily focused on the following aspects. Firstly, the multi-year averaged summer precipitation amount (APA), daily precipitation frequency (DPF) and precipitation intensity (DPI) were calculated, and the maximum daily precipitation amount (DPA) of each observation station in summer was analyzed. Secondly, the hourly mean precipitation amount (PA), precipitation frequency (PF) and precipitation intensity (PI) were calculated to analyze the diurnal variation characteristics of precipitation. Thirdly, the peak precipitation amount (PPA), peak precipitation frequency (PPF) and peak precipitation intensity (PPI) were analyzed [9,17]. The “peak” was defined as the maximum value in the sequence. Finally, the characteristics and yearly evolution of the precipitation events with different durations were analyzed. The calculation formulas and statistical method were as follows:
The hourly rainfall event was further classified according to its continuous durations without any intermittence or at most 1 h intermittence. That is, the rainfall after intermittence was considered to be a new rainfall event if the intermittence lasted for 2 h or longer. The number of hours between the start and the end of every event was defined as the duration. Precipitation with a duration less than or equal to 3 h was defined as short-duration precipitation, and precipitation with a duration greater than or equal to 6 h was defined as long-duration precipitation [9,37].
3. Results
3.1. The Basic Characteristics of Precipitation in Summer
According to the statistical results of summer precipitation from 2010 to 2022 (Figure 2 and Table 1), the precipitation in WTB has obvious regional characteristics. In the basin, there are no obvious variations among stations. The APA ranges from 43 to 55 mm, with DPF ranging from 17% to 21% and DPI ranging from 2.6 to 3.1 mm d−1, predominantly comprising light rain. In the mountain region, the APA is 46.8 mm, the DPF is 25% and the DPI is 2.0 mm d−1. It can be seen that the APA in the mountain region is consistent with that in the basin, but the DPF is higher and the DPI is lower than in the basin, contrary to the previous conclusion that the frequency and intensity of summer precipitation in the Tianshan Mountains region are both greater than those in the basin region [38].
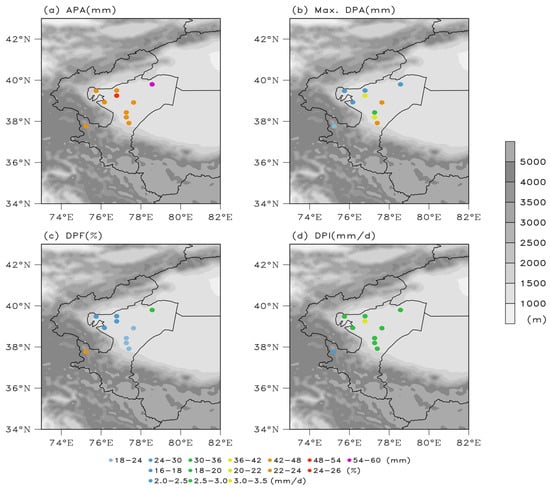
Figure 2.
The spatial distribution of the annual averaged precipitation amount (a) (mm), daily precipitation frequency (c) (%), daily precipitation intensity (d) (mm d−1) and maximum daily precipitation amount (b) (mm) in summer over the WTB from 2010 to 2022. Shading denotes the topographic height (m).

Table 1.
The annual averaged precipitation amount (APA, mm), the daily precipitation frequency (DPF, %), the daily precipitation intensity (DPI, mm d−1) and the maximum daily precipitation amount (Max. DPA, mm) in summer from 2010 to 2022.
In addition, the maximum DPA is an important feature of precipitation. According to the statistical results, the daily maximum DPA in summer at all stations is above the torrential rain level (the precipitation standard adopted in this paper is suitable for the arid and semi-arid areas [39]: 0.1 mm ≤ R < 6.0 mm is light rain, 6.1 mm ≤ R < 12.0 mm is moderate rain, 12.1 mm ≤ R < 24.0 mm is heavy rain, 24.1 mm ≤ R < 48.0 mm is rainstorm and R > 48.0 mm is heavy rainstorm; R is 24 h accumulated precipitation), except for the stations in the mountain region. Most stations can reach 60% of the average summer precipitation, while some stations even exceed the average summer precipitation. This result reflects the locality and discontinuity of precipitation in arid regions and also indicates that summer precipitation in this region has a certain extremity.
3.2. The Diurnal Variation Characteristics of Precipitation in Summer
3.2.1. Region Averaged
Figure 3 illustrates the diurnal variation characteristics of precipitation averaged over the WTB in each month and the whole summer average. In summer (Figure 3a–c), the PA and PF during night time exceed those during daytime in this region. The diurnal variation in the region-averaged PA is mainly unimodal, with the peak value appearing at 01:00–03:00 BJT and the valley value at around 18:00 BJT. The maximum value of the PA is about 0.04 mm h−1, and the minimum value is less than 0.01 mm h−1, which is an order of magnitude different from those in non-arid areas of Central–Eastern China [3,40,41]. The diurnal variation in the PF is basically consistent with that of the PA. The peak is about 4% and occurs during 00:00–06:00 BJT, while the valley value is about 1% and occurs during 17:00–19:00 BJT. The daily variation in PI is also basically unimodal: the peak value is about 1.2 mm h−1 and the rest is nearly 0.8 mm h−1. Different from the PA and PF, the peak value of PI appears at 20:00–23:00 BJT, not before dawn.
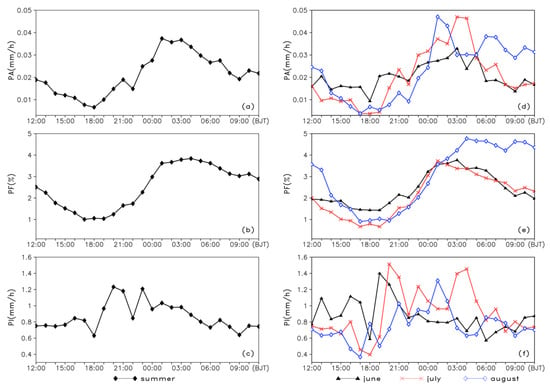
Figure 3.
Diurnal variation in the precipitation amount (PA, mm h−1), precipitation frequency (PF, %) and precipitation intensity (PI, mm h−1) in summer (a–c) and each summer month (d–f) averaged over the WTB from 2010 to 2022 (BJT: Beijing Time).
In Figure 3d–f, the daily variation trend of the PA and PF in each month is generally consistent with that of summer average. In July and August, the PA exhibits a basic unimodal pattern, peaking at 03:00–04:00 BJT in July and at 01:00–02:00 BJT in August, while in June there is no obvious peak or valley. The daily variation in the PF in each month is consistent, with higher values from 00:00 BJT to 06:00 BJT and the lowest value around 18:00 BJT. It is worth noting that the PF in August is higher (about 4%) than in other months, and the peak period is also longer. The peak time of the PI occurs later: in June, it occurs at around 19:00 BJT; in July, it occurs at around 20:00 BJT (with another peak at 04:00 BJT); and in August, it occurs at nearly 01:00 BJT. The PI in July is relatively high; Table 1 shows that six out of the ten stations have the maximum daily precipitation in July.
3.2.2. Regional Differences
In order to show the regional differences in precipitation in the WTB, the spatial distribution of the value and occurrence times of the PPA, PPF and PPI are given in Figure 4. The peak time is divided into eight periods (00:00–03:00, 03:00–06:00, 06:00–09:00, 09:00–12:00, 12:00–15:00, 15:00–18:00, 18:00–21:00, 21:00–00:00 BJT). The results show that the occurrence times of PPA, PPF and PPI at various stations are relatively close and consistent. The PPA mainly occurs between 00:00 and 03:00 BJT, the PPF mainly occurs between 03:00 and 06:00 BJT and the PPI mainly occurs between 20:00 and 23:00 BJT. Relevant studies have indicated that various factors such as large-scale circulation evolution and local topography may result in the hastening or delaying of the diurnal precipitation phases [42,43,44]. The WTB, with its complex terrain surrounded by mountains on three sides and the heating of the underlying surface by solar radiation in the evening to night, leads to the instability of the lower atmosphere and can easily result in precipitation related to thermal convection. The occurrence time of PPA is delayed by the PPI but is hastened by the PPF, which is likely a reflection of the asymmetry in temporal evolution and the development of convective cloud systems during precipitation’s progression.
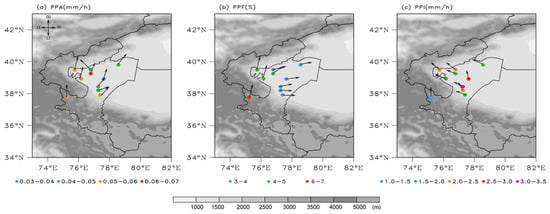
Figure 4.
The spatial distribution of the value (dots) and occurrence time (arrow) of the peak precipitation amount (a) (mm h−1), the peak precipitation frequency (b) (%) and the peak precipitation intensity (c) (mm h−1) in summer over the WTB from 2010 to 2022.
Meanwhile, the value of the PPF is higher and that of the PPI is relatively lower in high-altitude mountain stations than other stations. In addition, besides the high-altitude mountain station, there are no obvious differences between the APA and DPI at all stations (as shown in Table 1). Therefore, to investigate the regional differences in diurnal precipitation characteristics, the ten stations (seen in Figure 1) are divided into two regions: high-altitude mountain region (altitude greater than 3000 m) (R1: 51804) and other stations (R2). The results in Figure 5 indicate that the diurnal variation characteristics of precipitation in R1 are somewhat different from those in R2. Although the diurnal variations in precipitation in R1 and R2 are unimodal, the peak times of the PA, PF and PI are basically coincident (between 00:00 and 01:00 BJT) in R1. On the whole, the PF is higher and the PI is weaker in R1 than that in R2.
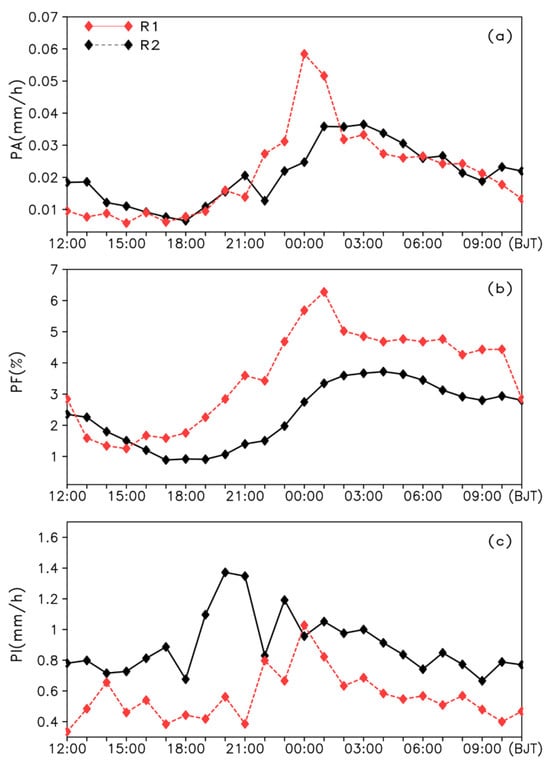
Figure 5.
Diurnal variations in the precipitation amount (a) (PA, mm h−1), precipitation frequency (b) (PF, %) and precipitation intensity (c) (PI, mm h−1) averaged in the high-altitude mountain region (R1, red dotted line) and the basin region (R2, black solid line) in summer from 2010 to 2022.
3.3. The Characteristics and Annual Evolution of Precipitation Events
The summer precipitation events from 2010 to 2022 are classified based on their durations, and the precipitation events with different durations from 1 h to 24 h are counted separately. According to the multi-year average results (Figure 6), most of the precipitation in the WTB is short-term precipitation. The frequency of precipitation events within 6 h is close to 90%, while that within 1–3 h is close to 70%. For the whole region (Figure 6a,b), the accumulated precipitation of different durations from 1 h to 6 h is similar, and each is about 10% of the total precipitation. The accumulated precipitation of different durations from 7 h to 12 h is also similar, and each is about 5% of the total precipitation. In region R2, considering station 51709 as an example (Figure 6c,d), the frequency of short-duration precipitation events is close to 70%, with 90% of the total precipitation amount (the frequency of 1 h precipitation events is 40%, and the frequency of 2 h precipitation events is 20%). In region R1 (Figure 6e,f), the frequency of precipitation with different durations is consistent with that in the basin, but the accumulated precipitation is not concentrated in short-duration precipitation. The precipitation events with different durations from 7 h to 12 h each account for 5% of the total precipitation.
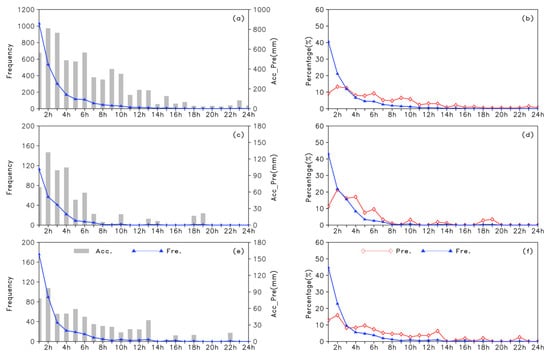
Figure 6.
The accumulated precipitation and frequency of precipitation events with different durations and their percentages for all precipitation events in summer from 2010 to 2022 in the WTB (a,b), in R1 (e,f) and at an example station (51709) in R2 (c,d).
Figure 7 shows the annual evolution characteristics of precipitation with different durations. Short-duration precipitation, lasting 1–3 h, is more active, while precipitation lasting more than 12 h occurs in fewer years, and the frequency of long-duration precipitation has shown an increasing trend since 2020. From the annual percentage of accumulated precipitation with different durations of precipitation (Figure 8), for the multi-year average, the accumulated precipitation with a duration of less than 6 h accounted for 65% of the total precipitation (less than 3 h accounts for 40% of the total precipitation), and the accumulated precipitation with a duration of more than 12 h accounted for 10% of the total precipitation. Notably, in 2011 and 2020, the accumulated precipitation with a duration of less than 6 h accounted for about 85% of the total precipitation (of which the precipitation for less than 3 h accounted for 60% of the total precipitation); however, in 2015 and 2021, the accumulated precipitation, lasting over 6 h, accounted for nearly 70% of the total precipitation, and sustained precipitation over 12 h accounted for 40% of the total precipitation. It can be seen that summer precipitation in the WTB also underwent structural adjustment in the past decade, and the dominant period of short-duration precipitation and the dominant period of long-duration precipitation alternately appeared.
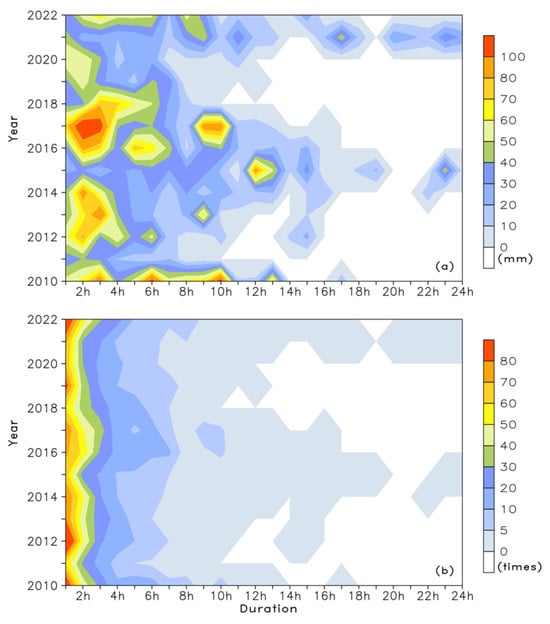
Figure 7.
The annual evolution of the accumulative precipitation (a) (in mm) and the number of precipitation events (b) with different durations in summer from 2010 to 2022 in the WTB.
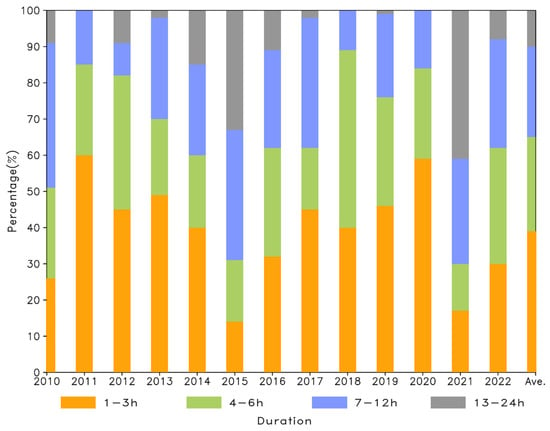
Figure 8.
Percentage of accumulated precipitation with different durations in summer from 2010 to 2022 in the WTB.
4. Discussion and Conclusions
The WTB is located in a typical arid region, enclosed by mountains on three sides and bordered by the Taklimakan Desert to the east, resulting in distinct regional precipitation characteristics. This study analyzes the basic characteristics of and diurnal variations in summer precipitation in the WTB based on the hourly precipitation observation data of ten national stations from 2010 to 2022. The results show that in the last decade, the average summer precipitation in the WTB ranged from 43 to 55 mm, with a daily precipitation frequency of 17% to 25% and a daily precipitation intensity of 2.0 to 3.1 mm d−1. However, at some stations, the daily maximum precipitation was close to or exceeded the average summer precipitation, indicating that although the region is located in a typical arid region, precipitation also has a certain locality and extremity. In summer, in the WTB, the diurnal variations in the PA, PF and PI primarily follow a unimodal pattern. The peaks of the PA and PF typically occur between 01:00 BJT and 03:00 BJT, while the valley occurs at around 18:00 BJT. The peak value of PI occurs between 20:00 BJT and 23:00 BJT, without obvious valley value. The maximum PA is 0.04 mm h−1 as the WTB is located in the arid region, which is an order of magnitude different from that in non-arid areas of Central–Eastern China. These characteristics of precipitation diurnal variation are related to the topography and weather systems over the WTB, as well as the vast desert underlying surface in the central of the Tarim Basin. The interaction between the westerly wind over the mountains and the hot easterly wind in the basin creates dynamic and thermal shear, which can easily trigger precipitation at night [8,9,45]. In addition, there are obvious differences between the diurnal variations in precipitation in the WTB and eastern Tarim Basin (ETB). Previous studies have pointed out that the peak values of PA and PF typically occur around 17:00 BJT in the ETB. This is mainly because the west-moving weather system weakens rapidly from west to east after climbing the mountains and rarely reaches the ETB, meaning that precipitation in this area is mainly triggered by thermal instability in the afternoon [46]. The diurnal variation characteristics of summer precipitation in the WTB are basically the same in each month, and the peak time of the PI is pushed back each month, with June being the earliest and August being the latest. The average summer PA in the western mountain region is close to that in the basin; the PF is higher, while the PI is smaller. This conclusion is different from that drawn in the Tianshan Mountains, where both the PF and PI surpass those in the plain area [38]. In addition, the peaks of the PA, PF and PI in mountain stations are basically the same (between 00:00 BJT and 01:00 BJT).
Based on the multi-year evolution results of precipitation events with different durations, short-duration precipitation, lasting 1–3 h, is more active in the WTB in summer, accounting for 70% of the total precipitation events and 40% of the total accumulated precipitation. Over the past decade, there has been a structural adjustment in summer precipitation, and short-duration precipitation and long-duration precipitation appear alternately.
In conclusion, this study utilizes long-term precipitation observation data to reveal the diurnal variation characteristics of and evolutions in summer precipitation in this region. However, the mechanism behind the diurnal variation in precipitation remains unclear. The comprehensive use of multi-source observation data, reanalysis data and high-resolution numerical models is necessary to further investigate the mechanism of diurnal precipitation changes. In addition, the diurnal variation characteristics of precipitation in the WTB differ from those in the ETB. In the future, we also aim to study the diurnal variation characteristics of precipitation in the ETB based on long-time-series precipitation data, so as to gain a comprehensive understanding of the precipitation characteristics present in the entire Tarim Basin.
Author Contributions
M.L.: Methodology, Formal analysis, Writing—original draft. Z.Z.: Conceptualization, Methodology, Writing—reviewing and editing. C.J.: Visualization, Writing—reviewing and editing. J.Y.: Writing—reviewing and editing. All authors have read and agreed to the published version of the manuscript.
Funding
This study was supported by the Natural Science Foundation of Xinjiang Uygur Autonomous Region (2022D01D86), the JinFeng Huayun Development Fund (Hyj202402) and the Xinjiang Meteorological Bureau Research Fund (YD202302).
Institutional Review Board Statement
Not applicable.
Informed Consent Statement
Not applicable.
Data Availability Statement
The observation data used in this study are from the China Ground Hourly Observation dataset provided by the China Meteorological Administration.
Acknowledgments
The authors thank their colleagues and the anonymous reviewers and editors for their constructive comments on this manuscript, which have led to the significant improvement of this manuscript.
Conflicts of Interest
The authors declare no conflicts of interest.
References
- Sorooshian, S.; Gao, X.; Hsu, K.; Hong, Y. Diurnal variability of tropical rainfall retrieved from combined GOES and TRMM satellite information. J. Clim. 2002, 15, 983–1001. [Google Scholar] [CrossRef]
- Dai, A.; Trenberth, K.E. The diurnal cycle and its depiction in the community climate system model. J. Clim. 2004, 17, 930–951. [Google Scholar] [CrossRef]
- Zhao, W.; Hao, C.; Cao, J.; Zhou, X.; Lu, L. Diurnal variation characteristics of summer precipitation and precipitation events with different durations in Beijing in the past 40 years. Chin. J. Atmos. Sci. 2022, 46, 1167–1176. (In Chinese) [Google Scholar] [CrossRef]
- Yang, G.Y.; Slingo, J. The diurnal cycle in the tropics. Mon. Wea. Rev. 2001, 129, 784–801. [Google Scholar] [CrossRef]
- Yu, R.; Li, J.; Chen, H.; Yuan, W. Progress in studies of the precipitation diurnal variation over contiguous China. J. Meteorol. Res.-PRC 2014, 28, 877–902. [Google Scholar] [CrossRef]
- Zhu, L.; Meng, Z.; Zhang, F.; Markowski, P.M. The influence of sea and land breeze circulations on the diurnal variability in precipitation over a tropical island. Atmos. Chem. Phys. 2017, 17, 13213–13232. [Google Scholar] [CrossRef]
- Song, Y.; Wei, J. Diurnal cycle of summer precipitation over the North China Plain and associated land–atmosphere interactions: Evaluation of ERA5 and MERRA-2. Int. J. Climatol. 2021, 41, 6031–6046. [Google Scholar] [CrossRef]
- Yu, R.; Xu, Y.; Zhou, T.; Li, J. Relation between rainfall duration and diurnal variation in the warm season precipitation over central eastern China. Geophys. Res. Lett. 2007, 34, L13703. [Google Scholar] [CrossRef]
- Yu, R.; Zhou, T.; Xiong, A.; Zhu, Y.; Li, J. Diurnal variations of summer precipitation over contiguous China. Geophys. Res. Lett. 2007, 34, L01704. [Google Scholar] [CrossRef]
- Li, J.; Yu, R.; Zhou, T. Seasonal variation of the diurnal cycle of rainfall in Southern contiguous China. J. Clim. 2008, 21, 6036–6043. [Google Scholar] [CrossRef]
- Jo, E.; Park, C.; Son, S.W.; Roh, J.W.; Lee, G.W.; Lee, Y.H. Classification of localized heavy rainfall events in South Korea. Asia-Pac. J. Atmos. Sci. 2019, 56, 77–88. [Google Scholar] [CrossRef]
- Li, L.; Li, J.; Yu, R. Characteristics of summer regional rainfall events over Ili River Valley in Northwest China. Atmos. Res. 2020, 243, 104996. [Google Scholar] [CrossRef]
- Park, C.K.; Chang, M.; Ho, C.H.; Ha, K.J.; Kim, J.; Sohn, B.J. Two Types of Diurnal Variations in Heavy Rainfall during July over Korea. Adv. Atmos. Sci. 2021, 38, 2201–2211. [Google Scholar] [CrossRef]
- Qian, J.H.; Robertson, A.W.; Moron, V. Interaction among ENSO, the Monsoon, and diurnal cycle in rainfall variability over Java, Indonesia. J. Atmos. Sci. 2010, 67, 3509–3524. [Google Scholar] [CrossRef]
- Zhang, Y.; Chen, H.M. Comparing CAM5 and super parameterized CAM5 simulations of summer precipitation characteristics over continental East Asia: Mean state, frequency-intensity relationship, diurnal cycle, and influencing factors. J. Clim. 2016, 29, 1067–1089. [Google Scholar] [CrossRef]
- Zhang, A.Q.; Chen, Y.L.; Zhou, S.N.; Cui, C.G.; Wan, R.; Fu, Y.F. Diurnal variation of Meiyu rainfall in the Yangtze plain during atypical Meiyu years. J. Geophys. Res. Atmos. 2020, 125, e2019JD031742. [Google Scholar] [CrossRef]
- Zhou, T.; Yu, R.; Chen, H.; Dai, A.; Pan, Y. Summer precipitation frequency, intensity, and diurnal cycle over China: A comparison of satellite data with rain gauge observations. J. Clim. 2008, 21, 3997–4010. [Google Scholar] [CrossRef]
- Yu, R.; Li, J.; Chen, H.; Yuan, W. Diurnal Variation of Precipitation in China; Science Press: Beijing, China, 2021. (In Chinese) [Google Scholar]
- Zhao, Y.; Huang, A.; Zhou, Y.; Huang, D.; Yang, Q.; Ma, Y.; Li, M.; Wei, G. Impact of the middle and upper tropospheric cooling over central Asia on the summer rainfall in the Tarim Basin, China. J. Clim. 2014, 27, 4721–4732. [Google Scholar] [CrossRef]
- Yao, J.; Chen, Y.; Guan, X.; Zhao, Y.; Chen, J.; Mao, W. Recent climate and hydrological changes in a mountain-basin system in Xinjiang, China. Earth-Sci. Rev. 2022, 226, 103957. [Google Scholar] [CrossRef]
- Chen, Y.; Li, B.; Fan, Y.; Sun, C.; Fang, G. Hydrological and water cycle processes of inland river basins in the arid region of Northwest China. J. Arid Land 2019, 11, 161–179. [Google Scholar] [CrossRef]
- Yao, J.; Chen, Y.; Zhao, Y.; Guan, X.; Mao, W.; Yang, L. Climatic and associated atmospheric water cycle changes over the Xinjiang, China. J. Hydrol. 2020, 585, 124823. [Google Scholar] [CrossRef]
- Yang, J.; Zhang, Q.; Lu, G. Climate transition from warm-dry to warm-wet in eastern Northwest China. Atmosphere 2021, 12, 548. [Google Scholar] [CrossRef]
- Yao, J.; Li, M.; Dilinuer, T.; Chen, J.; Mao, W. The assessment on “warming-wetting” trend in Xinjiang at multi-scale during 1961–2019. Arid Zone Res. 2022, 39, 333–346. (In Chinese) [Google Scholar] [CrossRef]
- Qu, L.; Yao, J.; Zhao, Y. Mechanism analysis of the summer dry-wet interdecadal transition in the Tarim Basin, Northwest China. Atmos. Res. 2023, 291, 106840. [Google Scholar] [CrossRef]
- Jin, C.; He, Q.; Huang, Q. A review on rainstorm research in southern Xinjiang. Trans. Atmos. Sci. 2023, 46, 82–96. (In Chinese) [Google Scholar] [CrossRef]
- Zhang, J.; Li, H.; Tang, H. Preliminary analysis of the synergistic influence of westerly wind and Indian monsoon on rainstorm over Tarim Basin. Trans. Atmos. Sci. 2023, 46, 242–258. (In Chinese) [Google Scholar] [CrossRef]
- Zhang, X.; Zhang, J. Xinjiang Meteorological Manual; China Meteorological Press: Beijing, China, 2006; pp. 91–92. (In Chinese) [Google Scholar]
- Li, M.; Ju, C.; Xin, Y.; Du, J.; Ma, Y.; Ma, X. Evaluation of 24h precipitation forecasting with DOGRAFS system during the summer of 2016. Desert Oasis Meteorol. 2018, 12, 15–21. (In Chinese) [Google Scholar] [CrossRef]
- Zeng, X.; Tang, H.; Zhang, J.; Dai, K. Forecast performance evaluation of QPF from ECMWF in Xinjiang. Desert Oasis Meteorol. 2021, 15, 50–57. (In Chinese) [Google Scholar]
- Huang, W.; Feng, S.; Chen, J.; Chen, F. Physical mechanisms of summer precipitation variations in the Tarim Basin in Northwestern China. J. Clim. 2015, 28, 3579–3591. [Google Scholar] [CrossRef]
- Zhao, K.; Guligena, H.; Meilibanu, A.; Abulimitijiang, A.; Yang, X. Characteristic analysis on the diurnal variation of precipitation in Kashgar. Desert Oasis Meteorol. 2016, 10, 31–35. (In Chinese) [Google Scholar] [CrossRef]
- Chen, C.; Wang, J.; Tang, Y.; Mao, W. Diurnal variations of summer precipitation in Xinjiang. J. Appl. Meteorol. Sci. 2017, 28, 72–85. (In Chinese) [Google Scholar] [CrossRef]
- Zhang, Q.; Zhao, Y.; Fan, S. Development of hourly precipitation datasets for national meteorological stations in China. Torrential Rain Disasters 2016, 35, 182–186. (In Chinese) [Google Scholar] [CrossRef]
- Qing, R.; Yao, Z.; Wang, Q.; Jin, L.; Hu, Y.; Yang, X.; Zhang, J.; Yang, H. Data comparison and analysis of Kashgar national reference climatological station before and after moving. Desert Oasis Meteorol. 2015, 9, 55–61. (In Chinese) [Google Scholar] [CrossRef]
- China Meteorological Administration. The Criterion of Surface Meteorological Observation; China Meteorological Press: Beijing, China, 2023. (In Chinese) [Google Scholar]
- Zhuo, H.; Zhao, P.; Zhou, T. Diurnal cycle of summer rainfall in Shandong of eastern China. Int. J. Climatol. 2013, 34, 742–750. [Google Scholar] [CrossRef]
- Guo, Y.; Zhao, Y.; Zhou, Y.; Huang, Q.; Yu, Z.; Gu, Z. Diurnal variation of summer precipitation and its relationship with altitude in Tianshan Mountains of Xinjiang. Arid Land Geogr. 2022, 45, 57–65. (In Chinese) [Google Scholar]
- Xiaokaiti, D. Classification of precipitation magnitude standard in Xinjiang. Xinjiang Meteor. 2005, 28, 7–8. (In Chinese) [Google Scholar] [CrossRef]
- Han, H.; Wu, H.; Huang, A. Temporal and spatial distributions of the diurnal cycle of summer precipitation over North China. Chin. J. Atmos. Sci. 2017, 41, 263–274. (In Chinese) [Google Scholar] [CrossRef]
- Zhao, Y.; Wang, Y. Numerical Study of the Diurnal Variations in Second Rainy Season Rainfall in the Coastal and Mixed Topographical Regions of Southeast China. Chin. J. Atmos. Sci. 2020, 44, 371–389. (In Chinese) [Google Scholar] [CrossRef]
- Chen, H.; Yu, R.; Li, J.; Yuan, W.; Zhou, T. Why nocturnal long-duration rainfall presents an eastward-delayed diurnal phase of rainfall down the Yangtze River Valley. J. Clim. 2010, 23, 905–917. [Google Scholar] [CrossRef]
- Yuan, W.; Sun, W.; Chen, H.; Yu, R. Topographic effects on spatiotemporal variations of short-duration rainfall events in warm season of central North China. J. Geophys. Res. Atmos. 2014, 119, 11223–11234. [Google Scholar] [CrossRef]
- Yu, R.; Li, J. Reginonal characteristics of diurnal peak phases of precipitation over contiguous China. Acta Meteorol. Sin. 2016, 74, 18–30. (In Chinese) [Google Scholar] [CrossRef]
- Li, R.; Sun, M.; Li, A.; Li, J.; Tang, Y. Dynamic and Thermal Characteristics on Rainstorm over the West of Southern Xinjiang. Desert Oasis Meteorol. 2017, 11, 7. (In Chinese) [Google Scholar] [CrossRef]
- Zhao, Z.; Ding, G.; Arken. Eastern edge of the Taklimakan Desert rainfall diurnal variation. Arid Land Geogr. 2016, 39, 1182–1185. (In Chinese) [Google Scholar]
Disclaimer/Publisher’s Note: The statements, opinions and data contained in all publications are solely those of the individual author(s) and contributor(s) and not of MDPI and/or the editor(s). MDPI and/or the editor(s) disclaim responsibility for any injury to people or property resulting from any ideas, methods, instructions or products referred to in the content. |
© 2024 by the authors. Licensee MDPI, Basel, Switzerland. This article is an open access article distributed under the terms and conditions of the Creative Commons Attribution (CC BY) license (https://creativecommons.org/licenses/by/4.0/).