Article

Multi-Source Dataset Assessment and Variation Characteristics of Snow Depth in Eurasia from 1980 to 2018

1
Key Laboratory of Environmental Change and Natural Disasters of Chinese Ministry of Education, Beijing Normal University, Beijing 100875, China
2
State Key Laboratory of Earth Surface Processes and Resource Ecology, Beijing Normal University, Beijing 100875, China
3
Academy of Disaster Reduction and Emergency Management, Ministry of Emergency Management and Ministry of Education, Beijing 100875, China
4
Faculty of Geographical Science, Beijing Normal University, Beijing 100875, China
*
Author to whom correspondence should be addressed.
Atmosphere 2024, 15(5), 530; https://doi.org/10.3390/atmos15050530
Submission received: 19 March 2024 / Revised: 18 April 2024 / Accepted: 24 April 2024 / Published: 26 April 2024
(This article belongs to the Section Meteorology)

Abstract

:
Snow is an indicator of climate change. Its variation can affect surface energy, water balance, and atmospheric circulation, providing important feedback on climate change. There is a lack of assessment of the spatial characteristics of multi-source snow data in Eurasia, and these data exhibit high spatial variability and other differences. Therefore, using data obtained from the Global Historical Climatology Network Daily (GHCND) from 1980 to 2018, snow depth information from ERA5, MERRA2, and GlobSnow is assessed in this study. The spatiotemporal variation characteristics and the primary spatial modes of seasonal variations in snow depth are analyzed. The results show that the snow depth, according to GlobSnow data, is closer to that of the measured site data, while the ERA5_Land and MERRA2 data are overestimated. The annual variations in snow depth are consistent with seasonal variations in winter and spring, with an increasing trend in the mountains of Central Asia and Siberia and a decreasing trend in most of the rest of Eurasia. The dominant patterns of snow depth in late autumn, winter, and spring are all north–south dipole patterns, and there is overall consistency in summer.

1. Introduction

Snow, a crucial element of the cryosphere, is regarded as a climate change indicator because of its distinct physical characteristics. Variations in snow can have an important impact on later climate and may affect processes including hydrology, atmospheric circulation, surface energy budget, and surface thermal conditions [1,2,3,4,5,6,7] (Barnett et al., 1989; Douville et al., 1996; Walland et al., 1996; Blanford, 1997; Chen et al., 2012; Wei et al., 2015; Zhang, 2016). In addition, snow exerts certain impacts on regional vegetation ecosystems, greenhouse gas emissions, engineering infrastructure, etc. Research has demonstrated that extremely high snowfall is associated with intense haze and increased dust concentrations [8,9] and that variations in spring snowmelt are related to extreme temperatures and wildfire activity during the following summer [10,11]. Snow also has an impact on people’s productive lives, and more technologies to safeguard health are being researched, developed, and applied [12,13,14,15]. In addition, snow is a natural reservoir that can be used as a source of fresh water and can provide tourism support for countries with abundant ice and snow cover [16,17,18,19], thus being of both practical and economic value.
In the context of global warming, the start of snow accumulation in the Northern Hemisphere has been delayed since the mid-20th century, with the largest snowfall being observed in spring. The main driving factors are temperature and precipitation, but snow accumulation can also be affected by other factors such as humidity and proximity to large freshwater bodies. The snow melting time has advanced [20], the snow depth has gradually become shallower, and the snow water equivalent has decreased over the long term [21,22]. There is also a downward trend in terms of timescales, with snow cover from 1972 to 1992 declining by an average of approximately 10% per year [23]. Data from weather stations across Europe show that the average snow depth in Europe generally decreased by 12% every decade from 1951 to 2017, with the trend being most obvious at low latitudes [24]. Overall snow in the Northern Hemisphere is on the decline, but research suggests that increased snowfall in sufficiently cold climates may be able to offset shorter snow seasons [25], with the snow water equivalent increasing in the coldest climates in northern Scandinavia [24,26]. Many scholars have also simulated the spatiotemporal variations in future snow. Under the high-emission scenario, large-scale snowfall will occur in Eurasia by the end of the 21st century, but the time will be delayed due to rising surface temperatures. The overall snow water equivalent in the Northern Hemisphere will show a downward trend [27], and in Europe, it may drop by 20–30%. However, in areas with extremely cold climates, such as Siberia, the snow water equivalent shows an increasing trend under both medium- and high-emission scenarios. Marty et al. [28] used regional model simulations to demonstrate that across all altitudes, periods, and emission scenarios, snow will drastically decrease throughout northern Europe, except for the highest elevations in northern Scandinavia [29]. Yue et al. [30] studied the spatial and temporal distribution and variation characteristics of snow depth in the Northern Hemisphere and nine typical zones from 1988 to 2018 based on the GlobSnow snow water equivalent dataset from the European Space Agency (ESA) and the Northern Hemisphere Long Time Series Snow Depth (NHSD) dataset from the National Tibetan Plateau Science Data Center. According to the variation characteristics, the variation in snow depth in most areas shows a downward trend, except for the East Siberian Mountains and the Alps of Eurasia.
There are two main sources of data for studying spatiotemporal variations in snow: ground stations and remote sensing data [31]. Both types of data have advantages and disadvantages. Snow in Eurasia is mainly distributed in mid- and high-dimensional areas. The observation time series of snow stations is longer and the time resolution is higher, but the spatial continuity of the station data is poor; this, coupled with the differences in the time series and snow observation methods used by snow stations in different countries and regions, means that snow data are limited, especially high-quality snow data. Satellite remote sensing data can quickly and periodically observe variations in snow throughout the day and is more suitable for the study of large-scale climate change. However, the data are of short duration, and the accuracy is easily affected by atmospheric conditions, sensors, pixel size, and other factors [32]. In addition to the above-mentioned main data sources, currently, reanalysis data based on model simulations are also used by many scholars. Significant determinants of snow models include temperature and precipitation, and the uncertainties related to these variables can have a direct impact on the accuracy of the reanalysis data [33]. Because various data sources have their advantages and disadvantages, many scholars have evaluated multi-source snow data at different spatial and temporal scales. Xiao et al. (2019) used site observation data to evaluate the applicability of five types of snow depth data (AMSR-E, WESTDC, GlobSnow, ERA-Interim, and MERRA2), from 2003 to 2011, to variations in snow depth in China. The results show that AMSR-E is more suitable for the study of instantaneous snow in the central and southeastern regions, WESTDC is more suitable for the study of snow depth in the north, and MERRA2 is more suitable for the statistical analysis of large areas. Zhang et al. [34] used monthly snow depth observations at 325 stations from 1981 to 2018 to evaluate the ability of five reanalysis datasets (JRA-55, MERRA-2, GLDAS2, ERA5, and ERA5L) to simulate spatiotemporal variations in snow. The results show that MERRA-2 is more suitable for studying variations in snow depth in China. Xiao et al. [35] used the 1992–2016 NHSnow dataset, which obtained data using the support vector regression (SVR) snow depth inversion algorithm, and compared it with GlobSnow, ERA-Interim/Land, and weather-station-measured snow depth data to evaluate the accuracy of the data for the Northern Hemisphere. The results show that the error and root mean square error (RMSE) of the NHSnow dataset are smaller than for the other two datasets, and ERA-Interim/Land is more likely to overestimate snow depth in the Northern Hemisphere. Wegmann et al. [36] compared reanalysis datasets (ERA-Interim, ERA-Interim/Land, ERA-20C, ERA-20C land, 20CRv2, and 20CRv2c) with Russian snow depth observation data. The results showed that the reanalysis data mostly overestimated Russian snow depth during the snowfall season (October and November) and snowmelt month (April) from 1981 to 2010.
Many results are currently available from the research carried out on snow. Many scholars have used a variety of snow data to examine snow depth at regional and hemispheric scales and to analyze spatiotemporal variations. There is high spatial variability in snow depth because the distribution of snow is influenced by factors such as temperature, precipitation, topography, and altitude, as well as atmospheric conditions, circulation, humidity, and radiation. There is still a lack of evaluation of multi-source snow data for Eurasia and no unified understanding of the variation characteristics of snow depth in local areas. Therefore, the main aims of this study are to assess the representativeness of the snow depth data obtained from ERA5, MERRA2, and GlobSnow and to analyze the dominant variations in snow depths. Eurasia is the world’s main snow cover area, and it is expected that this work can help provide a better understanding of the variation characteristics of snow in this region.

2. Data and Methods

2.1. Overview of the Study Area

Approximately 98% of the globe’s total seasonal snow is found in the Northern Hemisphere, mainly in Eurasia, where winter snow accounts for 60–65% of the total snow. The main snow areas in Eurasia are distributed at high latitudes, such as Siberia, and high altitudes, such as the Tibetan Plateau and the Alps. The distribution of snow depth has latitudinal and vertical zonal characteristics [30]. When conducting data assessment, the study area was divided into six regions, and a representative site from each region was selected for the comparative analysis of ERA5_Land, MERRA2, and GlobSnow data. The six areas were Siberia (60° E–120° E, 55° N–73° N), Central Asia (60° E–85° E, 40° N–53° N), the East Siberian Mountains (125° E–180° E, 55° N–73° N), the Alps (5° E–15° E, 43° N–48° N), north-west Europe (5° E–20° E, 50° N–70° N), and the East European Plain (30° E–55° E, 50° N–70° N).

2.2. Data

In this study, the latest fifth-generation reanalysis (ERA5_Land) monthly snow depth data from the European Center for Medium-Range Weather Forecasts (ECMWF), MERRA2 monthly snow depth data, and GlobSnow monthly snow water equivalent data were used to conduct the data evaluation and to analyze the spatiotemporal variation characteristics of snow. Many scholars have also used these data for snow analysis [30,33,36,37,38].
ERA5 is a comprehensive reanalysis of data generated by 4D-Var data assimilation from the ECMWF’s Integrated Forecast System (IFS) and the CY41R2 model forecast. The ERA5 atmospheric model is coupled with a land surface model and a wave model, supporting real-time data from 1979 to the present day. ERA5_Land reruns the land component of ERA5 at improved spatial resolution [34] and uses the atmospheric forcing of ERA5 as the model input. ERA5_Land provides monthly snow depth data from January 1950 to the present day (https://cds.climate.copernicus.eu/cdsapp#!/dataset/reanalysis-era5-land-monthly-means?tab=overview, accessed on 23 April 2024). The original spatial resolution of the acquired data is 0.1° × 0.1°, the temporal resolution is monthly, and the projection coordinate system is WGS84.
MERRA2 is the latest version of the satellite-era global atmospheric reanalysis produced by the National Aeronautics and Space Administration (NASA)’s Global Modeling and Assimilation Office (GMAO) using version 5.12.4 of the Goddard Earth Observing System (GEOS) model. The snow model of these data has three layers, and the precipitation data generated by the model is also corrected using observed precipitation data (rain gauges). Among them, the correction amplitude is larger at low latitudes, while at points north of 62.58° N, no precipitation correction is performed because the station has relatively few precipitation data and the data quality is not high [39,40]. MERRA2 provides data from January 1980 to the present day (https://disc.gsfc.nasa.gov/datasets/M2TUNXLND_5.12.4/summary?keywords=MEERA2, accessed on 23 April 2024). The original spatial resolution of the acquired data is 0.625° (longitude) × 0.5° (latitude), the temporal resolution is monthly, and the projected coordinate system is WGS84.
GlobSnow is a monthly snow water equivalent dataset for the Northern Hemisphere released by the European Space Agency (ESA). The data production process mainly uses site data, passive microwave brightness temperature data (SMMR, SMMI, and SMMI/S), and the HUT (Helsinki University of Technology) snow radiative transfer model [41,42]. GlobSnow provides data from January 1979 to May 2018 (https://www.globsnow.info/swe/, accessed on 23 April 2024), and there is a large amount of missing data from June to September. The original spatial resolution of the acquired data is 25 km, the temporal resolution is monthly, and the projection coordinate system is EASE-GRID, covering the area from 35° N to 85° N.
The reference truth value for the evaluation is the Global Historical Climatology Network Daily (GHCND) database, which is a comprehensive database containing field observation data from more than one hundred thousand weather stations in 180 countries and regions around the world. The goal of compiling GHCND source data is to maximize spatial coverage, and records from many institutions have been collected and quality controlled. To reduce the possibility of redundancy, new data are cross-checked with previously included data before being added to a dataset. This ensures record uniqueness, spatial consistency, and temporal consistency [43,44,45]. The station’s data include daily snow depth data from 1 September 1980 to 30 August 2018. The site data are densely distributed in the central and western parts of Eurasia and sparsely distributed in the eastern part.

2.3. Methods

This study used station data to evaluate ERA5, MERRA2, and GlobSnow data and defined the hydrological year of each snow from September of the current year to August of the following year. Taking into account the spatial and temporal resolution of the four datasets to ensure data consistency, the time range of this study was set as September 1980 to August 2018. The spatial resolution of the data was unified to 0.1° × 0.1°. For MERRA2, we linearly interpolated the data. For GlobSnow v3.0, we used the “NEAREST” method in ArcMap after converting the coordinate system. Because GlobSnow involves snow water equivalent data and its projected coordinate system is inconsistent with the rest of the data, preprocessing was carried out [30]. This process was divided into two steps. First, the EASE-GRID projection of the GlobSnow data was converted to WGS84; second, the snow water equivalent value obtained from GlobSnow and the snow density (0.24 g·cm−3) were divided to obtain the snow depth data.
The site data (GHCND) are daily data; thus, they were adjusted according to the processing method described by Yue et al. [30] and processed into monthly data. The processing steps were as follows. Firstly, each month was divided into six groups. The first five groups were all 5 days in length. The length of the data in the last group was uncertain because of the different number of days in various months. Secondly, a determination was made as to whether the number of days with values in each data group was greater than or equal to 2. If it was, the mean of the group was calculated. Otherwise, the mean of the group was considered to be an invalid value (NaN). Finally, if the sum of the means of the 6 groups was greater than or equal to 4, the sum of the effective values was averaged and used as the monthly average. Otherwise, it was regarded as NaN.
When analyzing the snow data, we discovered that certain datasets had extremely high values. Therefore, by consulting the literature [46,47,48,49] (Liu Y, 2021; Chu et al., 2018; Klein et al., 2016; Zhong et al., 2018) and calculating the maximum snow depth of the site data, a threshold of 20 m was set for the monthly snow depth data. Then, all of the grid snow depth data were matched spatiotemporally with the site snow depth data and initially assessed using the bias and root mean square error (RMSE). The variations in the snow depth in each set of data were compared and analyzed by selecting the representative stations based on the above regions.
The calculations of the bias, RMSE, and mean absolute error (MAE) are shown in Equations (1), (2), and (3), respectively.
BIAS = X m X s
RMSE = i = 1 n X m , i X s , i 2 n
MAE = 1 n i = 1 n X m , i X s , i  
where Xm and Xs denote the snow depths of the reanalysis data and the corresponding station, respectively; n denotes the number of valid values for the station; and i represents the month.
The analysis of the spatial and temporal variations in the snow was carried out after assessing the monthly snow depth data from Eurasia (0° E–180° E, 25° N–80° N) during the study period, and the main modes of variation in seasonal snow were analyzed using the empirical orthogonal function (EOF) method. The snow depths were standardized and detrended before the EOF analyses.

3. Results and Analysis

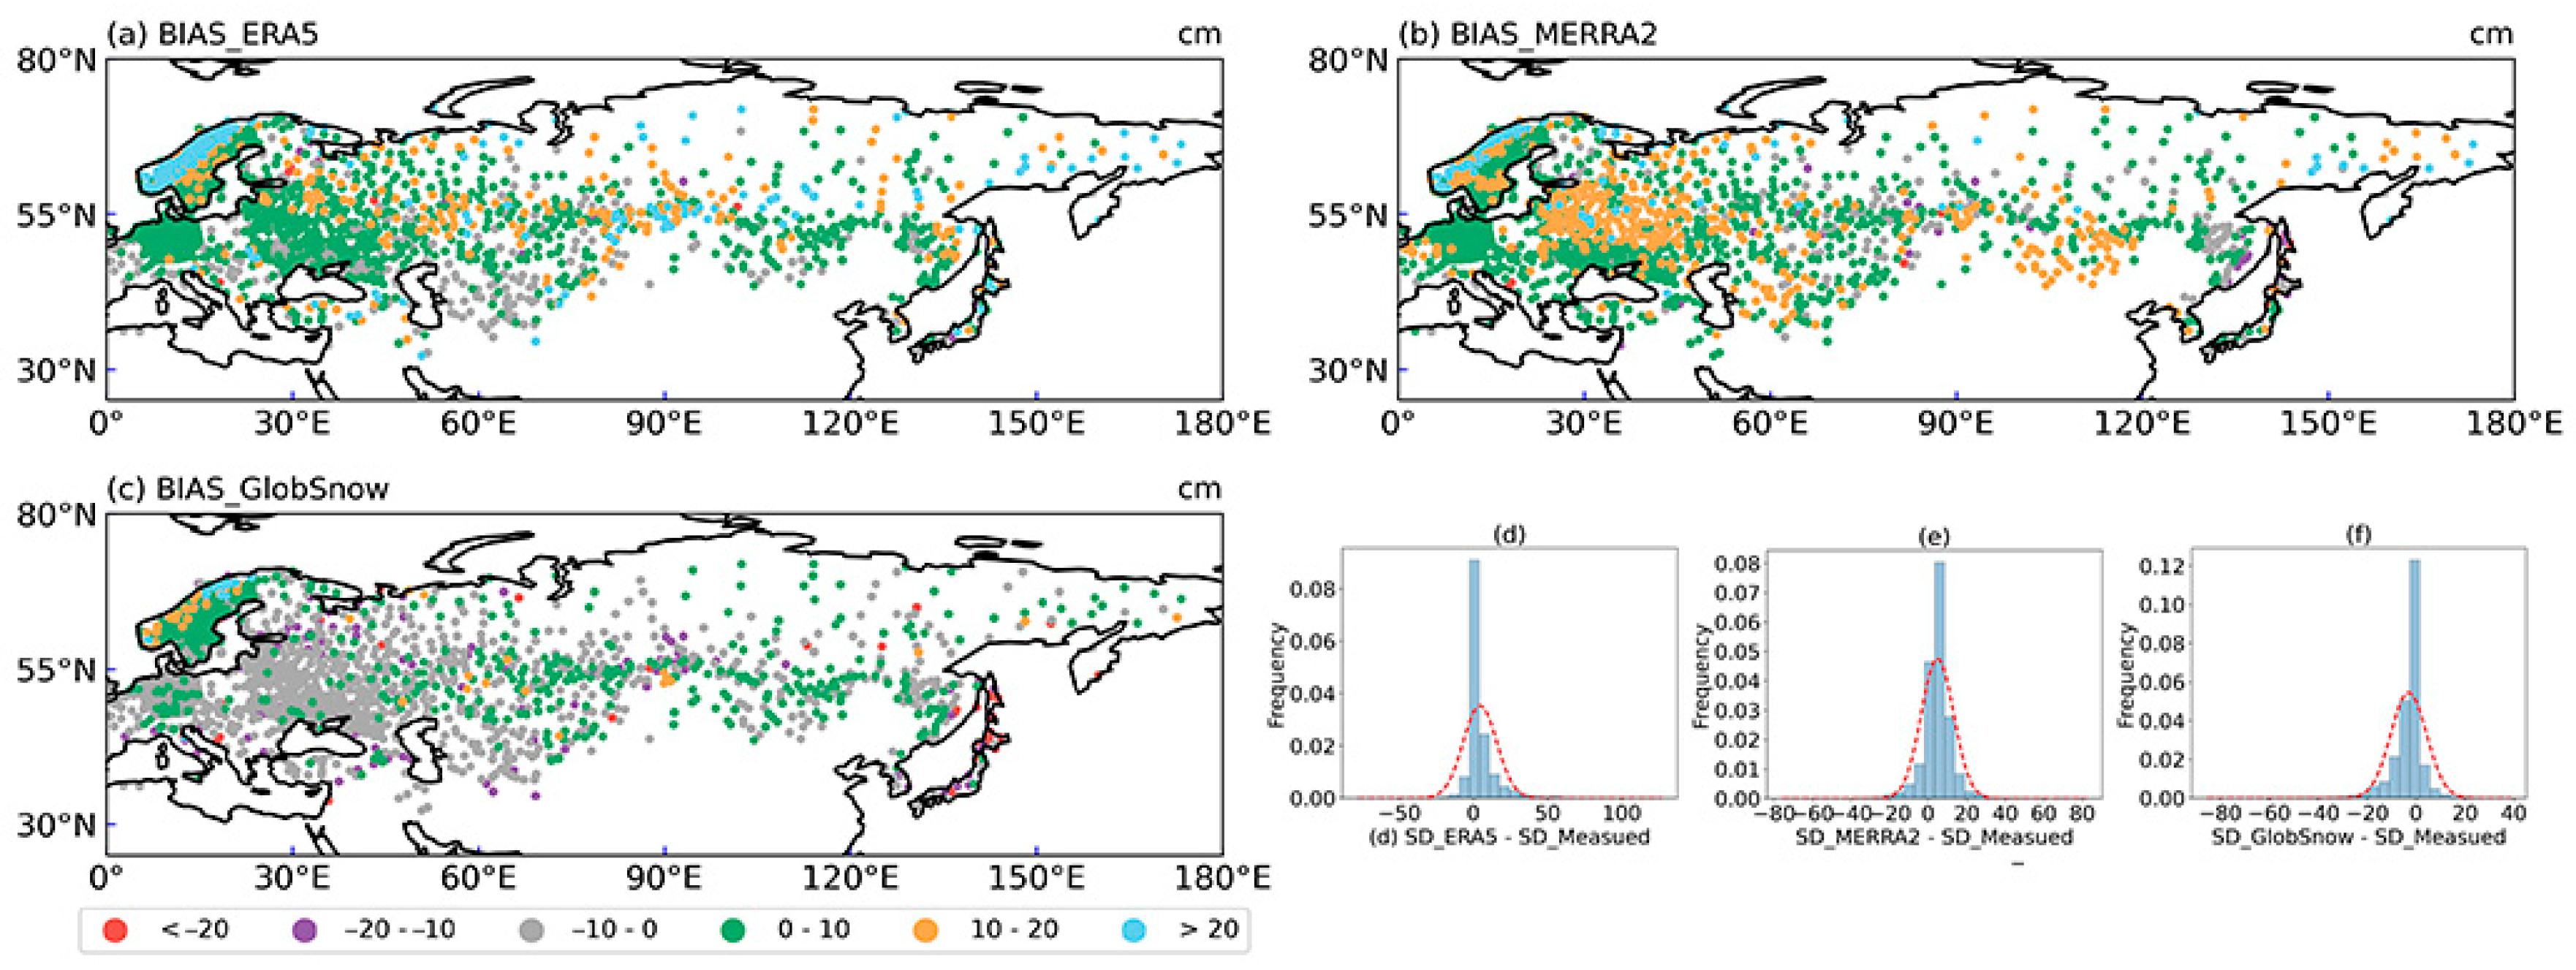
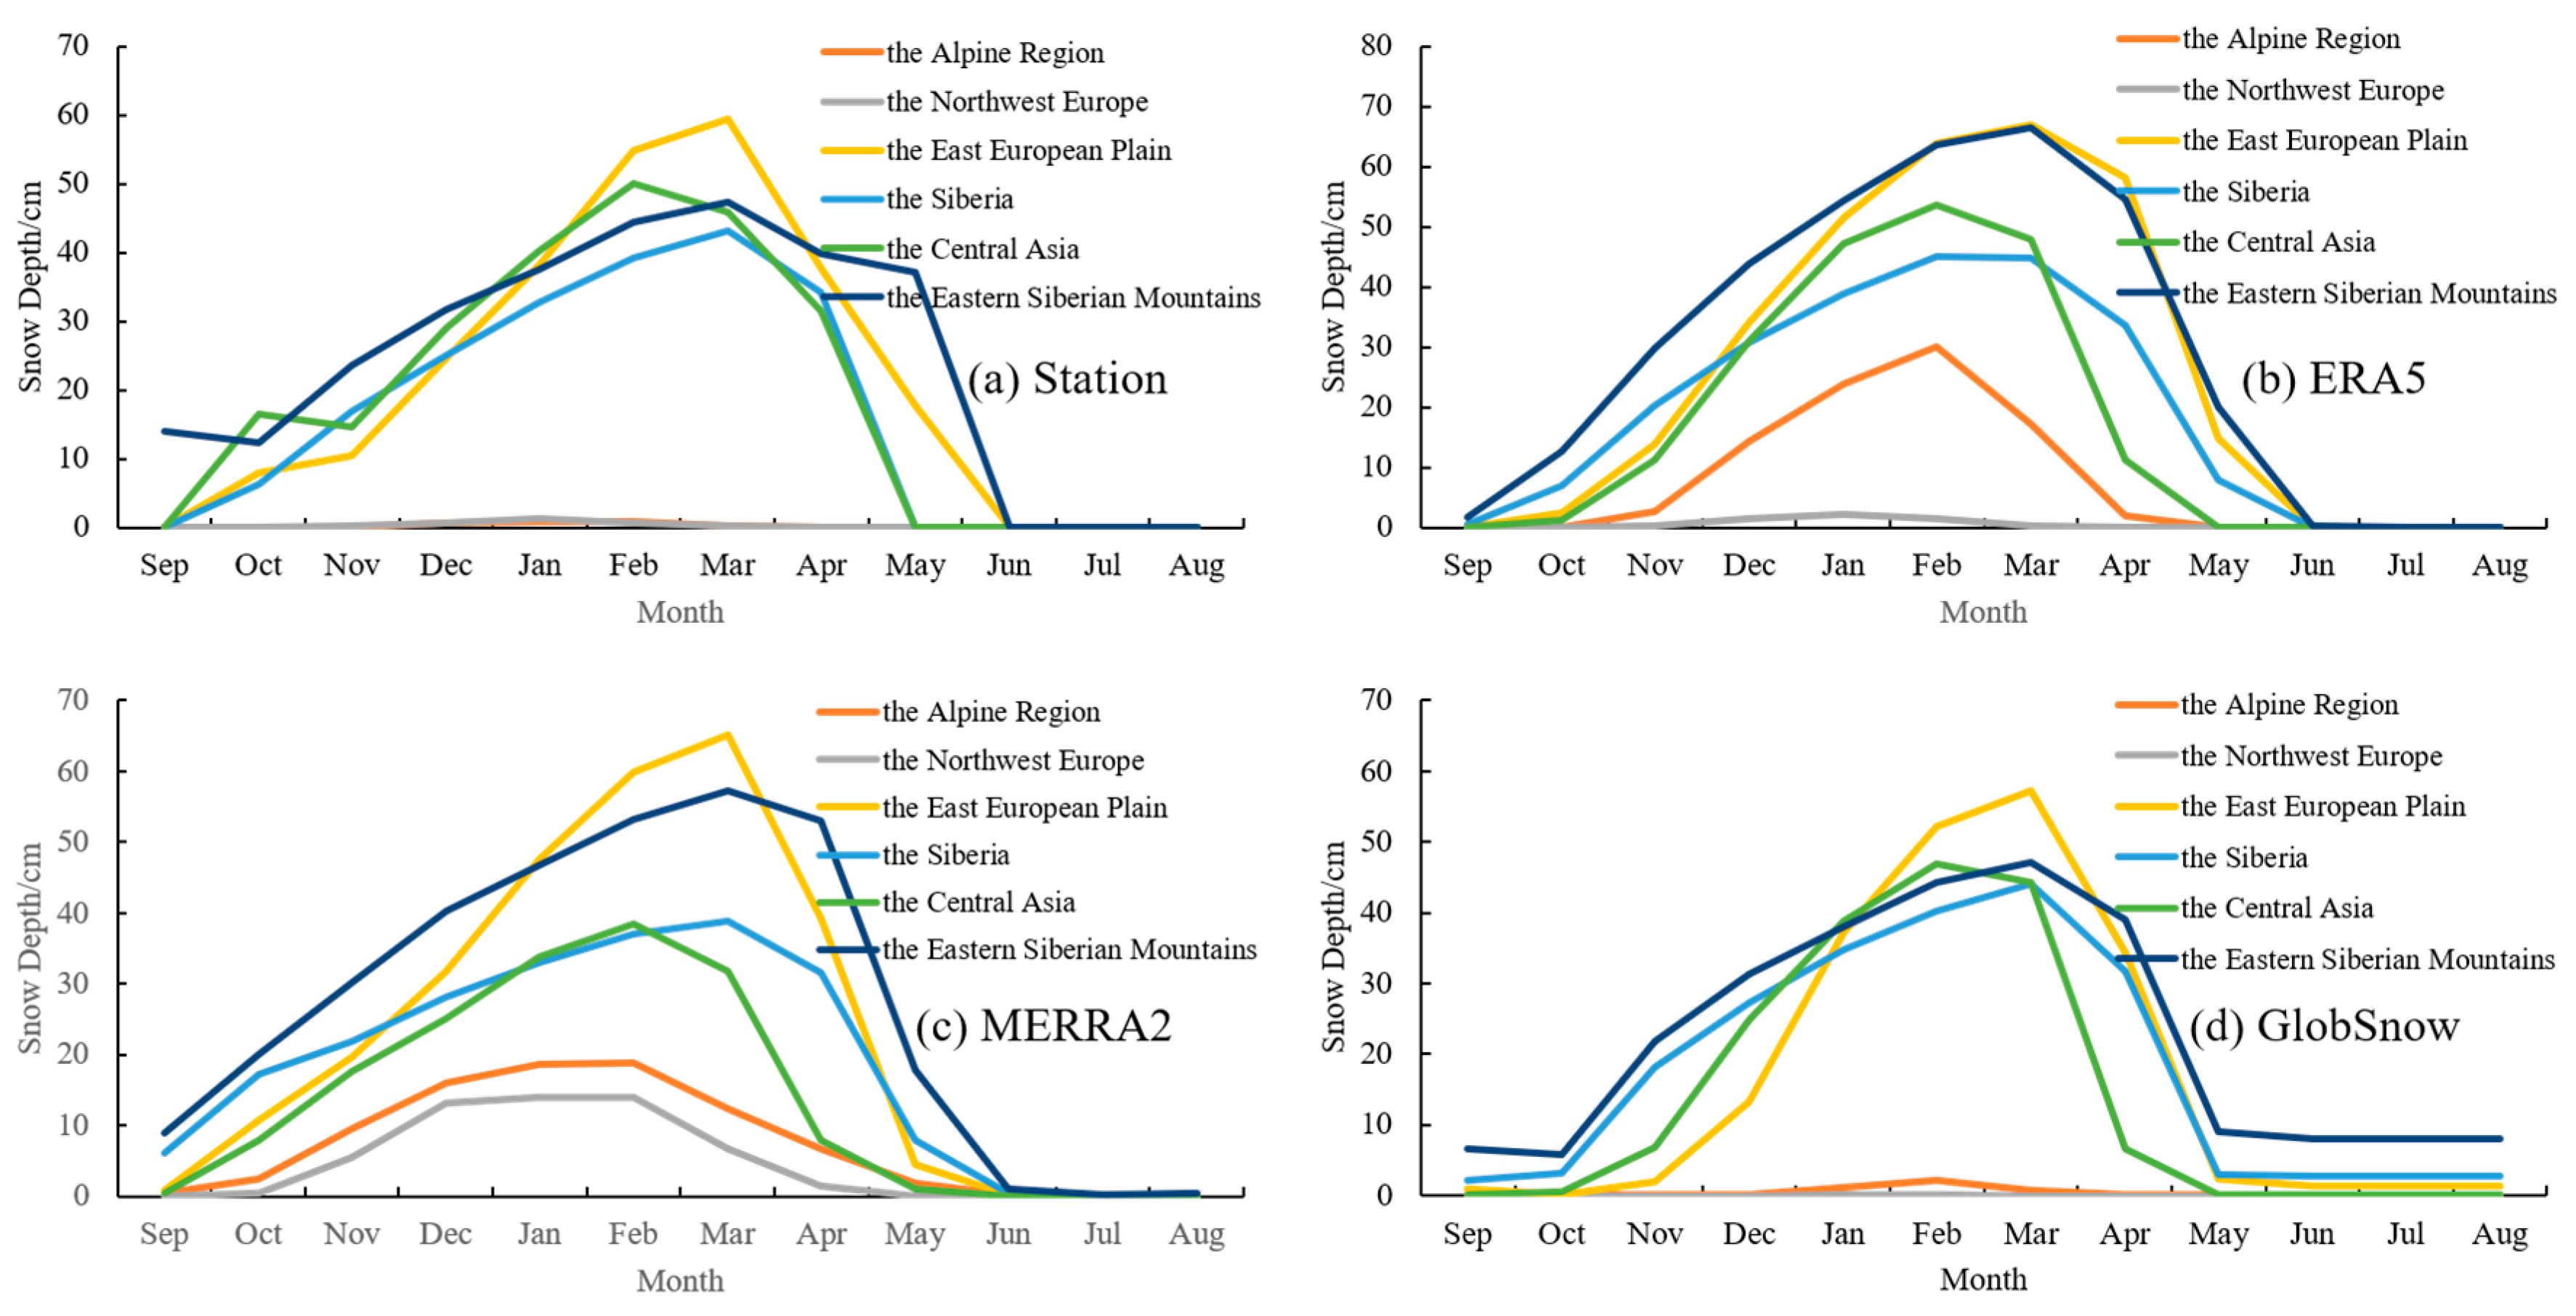
3.1. Multi-Source Snow Dataset Assessment

Using the snow station data, the representativeness of the ERA5, MERRA2, and GlobSnow snow datasets was assessed. The representative stations in each of the six regions were selected for conducting a comparative analysis of the snow variation trends.
Figure 1 shows the spatial distributions and frequency histograms of the snow depth bias between the Eurasian multi-source data and the station. It can be seen that the positive and negative biases of snow depth in Eurasia are mostly distributed between 0 and 20 cm, with the deviation being larger in the northwest of the Scandinavian Mountains. Both ERA5 and MERRA2 have higher positive deviations, accounting for four-fifths or more of the total. However, the positive deviation number is higher for MERRA2 than for ERA5. More negative deviations are seen in GlobSnow v3.0. Xiao et al. [35] evaluated NHSnow, ERA5, and GlobSnow snow depth data from 1992 to 2016 using measured site information. The results show that the GlobSnow underestimates the snow depth in the East European Plain and that the ERA5_Land data are more likely to overestimate the snow depth in the Northern Hemisphere, which are findings consistent with those of this study.
The spatial distributions of the MAE and RMSE of the snow depths between the Eurasian multi-source snow data and the station data are shown in Figure 2. The average absolute deviation and RMSE of ERA5 and MERRA2 are larger in the area north of 55° N, ranging between 10 and 20 cm. Among them, the distributions of MAE and RMSE for ERA5 show a strip-like distribution, with the deviation increasing from low latitude to high latitude. The largest MAE and RMSE of MERRA2 are found in the East European Plain, in addition to the area north of 55° N. The average absolute deviation and RMSE of GlobSnow data fall mainly between 0 and 10 cm, and the RMSE is larger in the East European Plain. In addition, the errors of the three data types are larger in the Scandinavian Mountains.
Table 1 shows the overall absolute deviation and RMSE of the six subregions. For the GlobSnow data, the snow depth accuracy is relatively high, with an overall mean deviation of −3 cm, a mean absolute error of 5.74 cm, and an RMSE of 8.51 cm. Its MAE and RMSE in each region are small. ERA5 ranks second, with an overall mean deviation of 4.41 cm, a mean absolute error of 6.76 cm, and an RMSE of 9.27 cm. Because the bias of ERA5 increases zonally, the bias is higher in the Siberian and Eastern Siberian regions. The overall mean deviation of MERRA2 is 4.82 cm, the mean absolute error is 8.53 cm, and the RMSE is 11.13 cm.
The variations in the annual mean snow depth at representative stations in each subregion are different (Figure 3). There is significant regional diversity in terms of snow depth due to factors such as temperature, precipitation, geography, altitude [50,51,52,53], circulation, humidity, and radiation, which influence the distribution of snow. The snow depth and snowmelt time vary in mid- to high-latitude areas and under different terrain conditions. Representative stations in different regions show that the snow depth in mountainous areas is smaller than that in other mid- and high-latitude areas of Eurasia, and the peak snow depth is reached earlier at low latitudes. The snow depth in the Alpine region and in northwest Europe is smaller than that in other middle- and high-latitude areas of Eurasia, and it reaches peak snow depth faster. The snow depth in Central Asia at mid-latitudes reached its peak in February, and the East European Plain, Siberia, and the East Siberian Mountains at higher latitudes all reached their peak snow depth in March. Yue et al. [30] reached a similar conclusion and also found that the snowmelt time in Eurasia varied with latitude when exploring variations in spring snowmelt in Eurasia from 1979 to 2018.
From Figure 4, we can see the variations in the annual mean snow depth at representative stations for four datasets in major regions of Eurasia, with the measured site data (ERA5, MERRA2, and GlobSnow) from left to right and the representative sites of the major regions of the Eurasian continent from top to bottom. Due to severe deficiencies in the GlobSnow data for high mountainous areas, there were anomalies in the data comparisons in the Alpine region that are not shown here. Declining trends are exhibited in the Alpine region, northwest Europe, the East European Plain, and Siberia, with an increasing trend in snow depth in the Eastern Siberian Mountain area, which is consistent with the findings of Yue’s [30] study. Meanwhile, a study carried out by Marcolini et al. [54] showed an increase in the number of stations with negative snow depth trends and consecutive negative anomalies in the Austrian Alps starting in the late 1980s and early 1990s. Furthermore, it is worth noting that representative stations in Central Asia show an increasing trend in terms of snow depth. Studies conducted by Yue et al. [30] and Zhong et al. [49] also showed that the snow depth decreased in some areas of Central Asia and increased in others. The main factors affecting snow are temperature and precipitation, but they are also affected by other factors such as humidity and proximity to large freshwater bodies. Studies have shown that the surface temperature of the Northern Hemisphere is warming; in particular, the surface temperature of high latitudes is rising at the fastest rate in the world, and the total precipitation and precipitation intensity are increasing. However, an increase in precipitation does not equate to an increase in snowfall because warming shortens the snow season and leads to variations in the ratio of rain to snow. This is the reason why the snow depth in Eurasia is decreasing in most places. At the same time, research also shows that increased snowfall in sufficiently cold climates may be able to offset the shorter snow season, leading to an increase in snow depth in the Eastern Siberian Mountain region [25,27].
Figure 5 shows the variations in the mean spring snow depth at representative stations for four datasets in major regions of Eurasia. These variations are consistent with snow variations, and the GlobSnow data are in better agreement with the station data for snow depth modeling on a seasonal scale. In winter, the ERA5, MERRA2, and GlobSnow data demonstrate snow depth variations consistent with the representative sites, which are not shown in the mapping here. In spring, the snow depth trends of both ERA5 and MERRA2 in Central Asia do not coincide with the representative station (Figure 5r,s). The snow depth variation trend of MERRA2 in Siberia is also inconsistent with station data, except for Central Asia (Figure 5w). Yang et al. [38] explored variations in the spring (March–May) snowmelt in Eurasia from 1979 to 2018 and found that the decline in spring snowmelt in western Eurasia was associated with a decrease in the previous season’s snow. At the same time, the authors suggested that this may be due to warmer temperatures in western Eurasia together with an increase in the proportion of precipitation, which is consistent with this study’s finding of a decrease in winter snow depth at representative stations in the European region. Central Asia is the world’s largest non-zonal arid region and is deeply inland and far from the ocean, and the strength and trajectory of the westerly circulation directly affect the precipitation in the region. Moreover, due to the complex topography of the Central Asian region, the westerly circulation encounters high topography, which produces weather-scale westerly disturbances, leading to an increase in the uncertainty of precipitation [55]. Precipitation is one of the important driving factors of snow models, and its uncertainty has a considerable impact on ERA5 and MERRA2. Li et al. [55] studied the spatiotemporal evolution characteristics of extreme snowfall in Central Asia and various climate zones in winter from 1979 to 2017 and found that extreme snowfall in East Asia increased in winter.

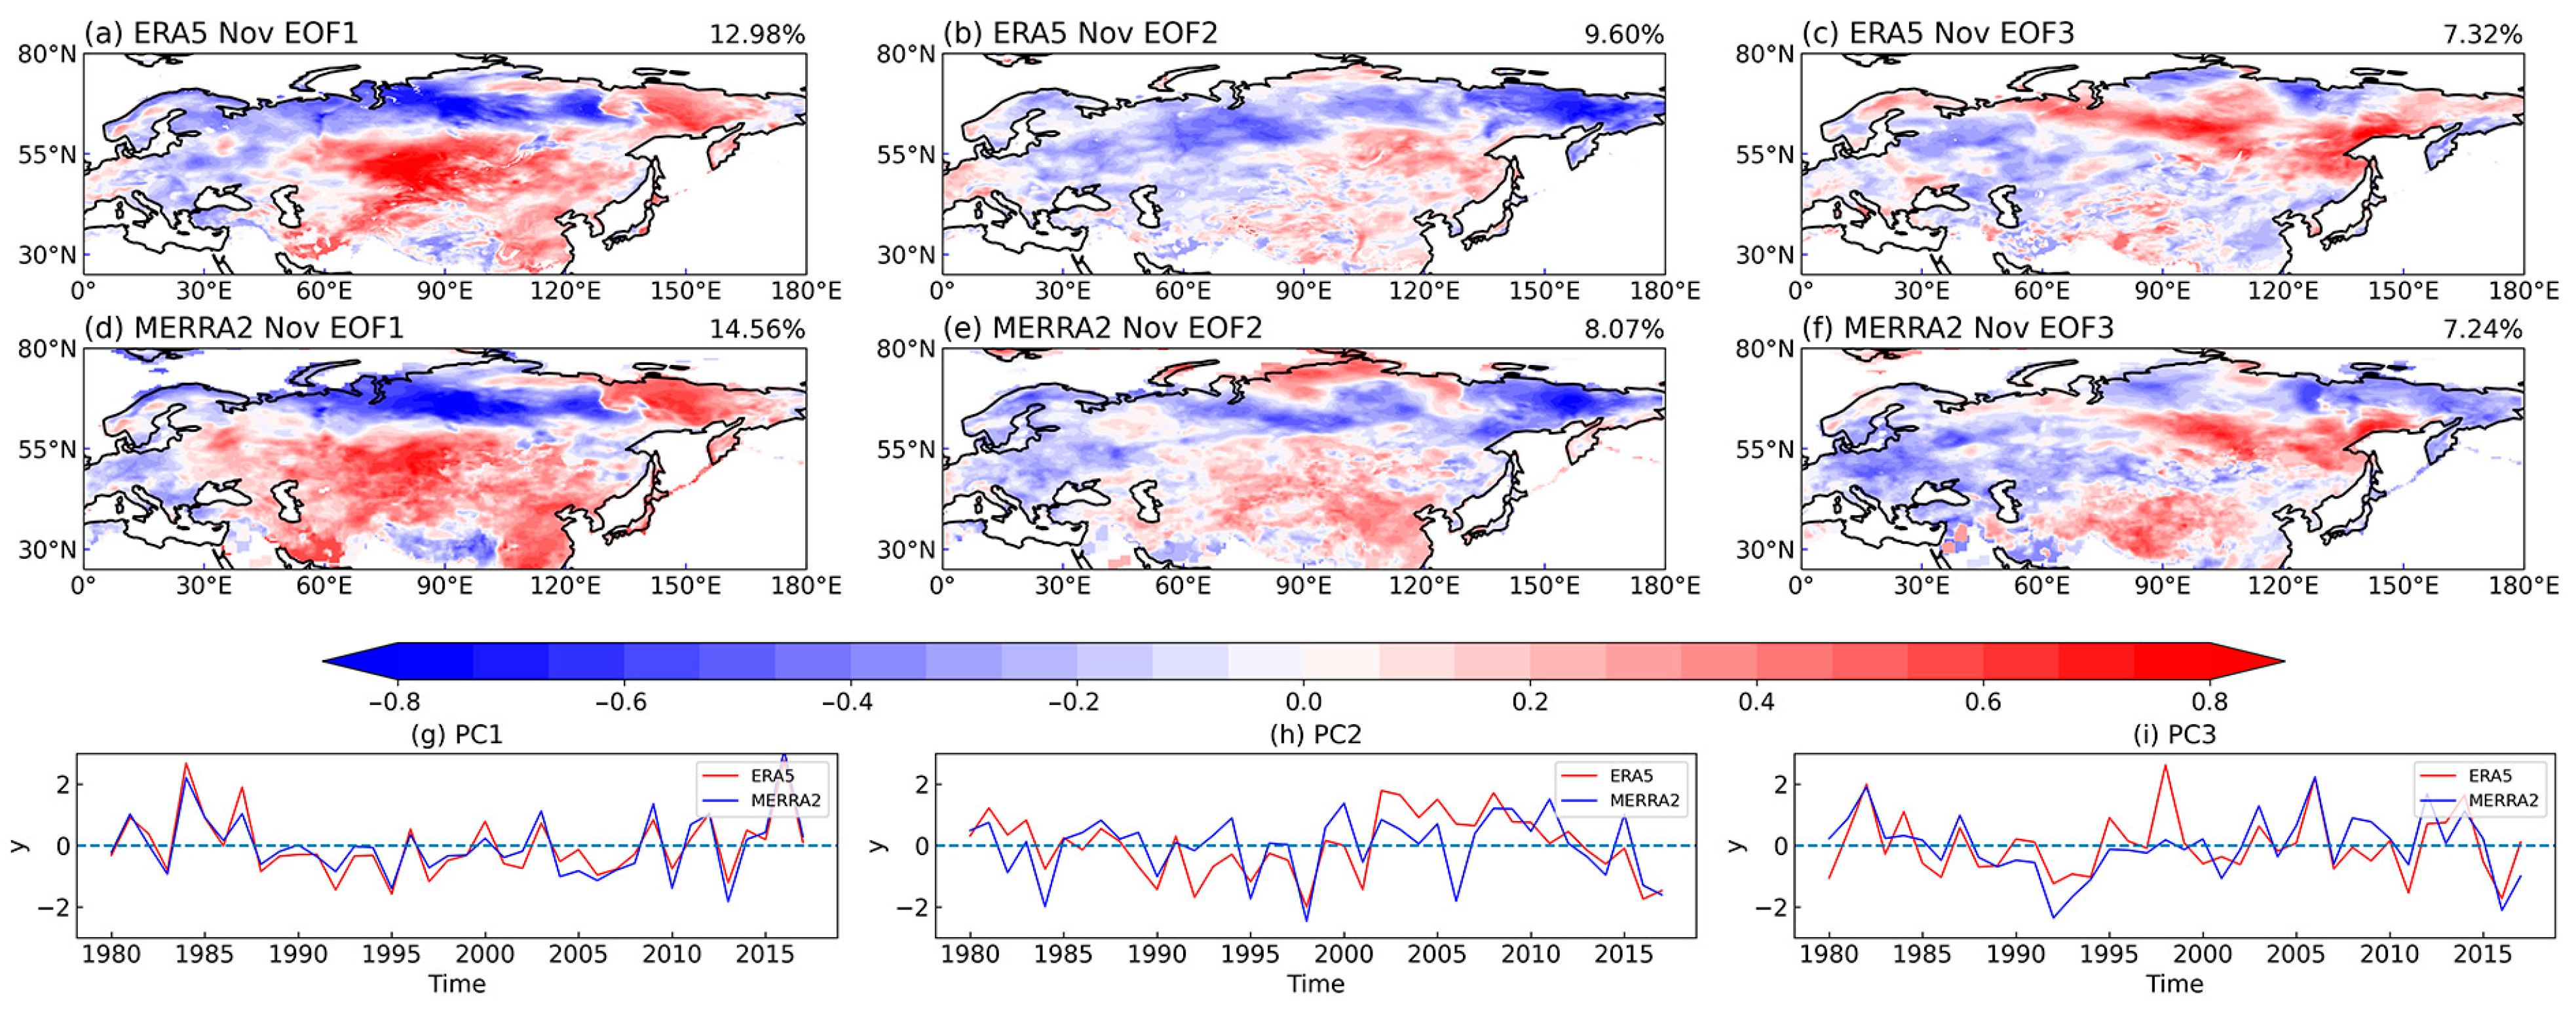
3.2. Temporal and Spatial Variation Characteristics of Snow in Eurasia

Using the ERA5, MERRA2, and GlobSnow snow datasets, the spatiotemporal variation characteristics of snow were examined using EOF and standard deviation analysis techniques.
The spatial distributions of the multi-year average snow depth in Eurasia shown by the three types of snow datasets are consistent (Figure 6). The distribution mainly covers the area north of 50° N, and there is more snow on the mid- and low-latitude Tibetan Plateau. The main areas of variation in snow depth are in central, western, and far eastern Siberia; the northern parts of the East European Plain; and the Scandinavian Mountains. GlobSnow has a large amount of missing data from June to September, so GlobSnow’s multi-year average snow depth mainly covers October to May. GlobSnow data can show the spatial distribution of multi-year snow depth, but its value is slightly smaller than those for the other two datasets, and there are no data for areas south of 35° N.
Figure 7 shows the spatial distributions of the mean snow depth and the standard deviation variations in the four seasons in Eurasia according to the ERA5, MERRA2, and GlobSnow datasets. Because there is a large amount of data missing from GlobSnow from June to September, the variations in snow depth in summer and autumn were not analyzed. The snow in Eurasia is most extensive in winter, with the main areas of snow depth variation being observed for the Western Siberian Plain and the Far Eastern Siberian Coast. The main snow cover area in spring is north of 55° N, and the main snow depth variation area is consistent with winter. Only the Western Siberian Plain and the Tibetan Plateau accumulate more snow in summer, which is consistent with the spatial and temporal distribution of snow observed by Zhong et al. [49]. From summer to autumn, the main area of variation in snow is in Siberia. From autumn to winter, the snow depth increases in the northern parts of the East European Plain and Scandinavia.
Figure 8 shows the spatial distributions and corresponding normalized principal components of the first three EOF modes in winter from 1980 to 2018. When displaying the graph, the first two EOF modes of the GlobSnow dataset were switched around because they are the opposite of the first two EOF modes of ERA5 and MERRA2. In winter, the variance contributions of the first EOF mode of ERA5, MERRA2, and GlobSnow data are 12.23%, 14.03%, and 14.49%, respectively (Figure 8a,d,h). GlobSnow data’s first mode is consistent with ERA5 and MERRA2’s second mode, while its second modality agrees with ERA5 and MERRA2’s first mode. The spatial distribution characteristic of the first dominant mode (mainly EOF1 for ERA5 and MERRA2) is that the snow depth is roughly distributed in anti-phase along the north and south of 60° N, which is a south–north dipole mode. In northern Eurasia, the snow depths in the Siberian region and the far east of Siberia also show an inverse variation. The normalized principal components corresponding to the north and south dipole patterns of the three data types all show obvious interannual variations. When the snow depth increases in northern Eurasia, except in the far east of Eurasia, the snow depth decreases in southern Eurasia (Figure 8j). In winter, the variance contributions of the second EOF mode of ERA5, MERRA2, and GlobSnow data are 9.72%, 9.24%, and 9.05%, respectively (Figure 8b,e,g). The second mode exhibits a spatial distribution characterized by an east–west dipole pattern, with snow depths in eastern and northern Eurasia inversely distributed with western and southern Eurasia. The normalized principal components corresponding to the east–west dipole pattern also show significant interannual variability, and the normalized principal components of the ERA5 and MERRA2 data are more consistent (Figure 8k). The spatial distribution characteristics of the third EOF mode of snow depth in winter indicate that the snow depth variations in the East European Plain are distributed inversely compared to those in north-west Eurasia and Siberia, showing an east–central–west tripole pattern. This spatial feature does not include ERA5 because its spatial distribution is not particularly consistent with those of the other two datasets (Figure 8c,f,i). The normalized principal component corresponding to the east–central–west tripole pattern is dominated by interannual variation (Figure 8l). Chen et al. [5] used daily snow depth data for the former Soviet Union from 1948 to 1994 provided by the National Snow and Ice Data Center to study the spatial mode of the Eurasian continent in winter (December–February). The results showed that the first mode is the north–south dipole mode, which is consistent with the results of this study. The three datasets are the same except for the third EOF spatial mode of ERA5, which is inconsistent with the rest, and the variations in the corresponding normalized principal components of the three datasets are also consistent. It can be observed that the three datasets, ERA5, MERRA2, and GlobSnow, demonstrate the winter snow depth variations.
Figure 9 shows the spatial distributions and corresponding time series of the first three EOF modes in spring from 1980 to 2018. In spring, the variance contributions of the first EOF mode of ERA5, MERRA2, and GlobSnow data are 11.84%, 15.48%, and 22.26%, respectively (Figure 9a,d,g). The spatial distribution characteristics of the first dominant mode are consistent with the first mode of winter snow depth. The snow depth is roughly distributed in anti-phase along the north and south of 60° N, which is a south–north dipole pattern. From winter to spring, snow depth in northern Eurasia varies from east–west inversion to consistent variation. The normalized principal component corresponding to the first spatial mode shows significant interannual variability, with snow depth decreasing in southern Eurasia and increasing in northern Eurasia (Figure 9j). Zhang et al. [56] analyzed the EOF spatial modes of snow water equivalent in winter (December–February) and spring (March–April) in the Eurasian mid- to high-latitude region (20°–140° E, 40°–70° N) from 1979 to 2015 and found that the north–south dipole modes of snow water equivalent in the Eurasian middle- and high-latitude regions may persist from winter to spring. The results of this study are consistent with this finding. The spatial distributions of the second and third spatial modes displayed by the three snow depth data are inconsistent, except for the far east of Eurasia.
Figure 10 shows the spatial distributions and corresponding normalized principal components of three EOF modes in early summer (June) from 1980 to 2018. In early summer (June), the variance contributions of the first EOF mode of ERA5 and MERRA2 are 19.11% and 30.83%, respectively (Figure 10a,d). The spatial distribution characteristics reflected by the first mode show that the main characteristic of snow depth variation in Eurasia is one of overall consistency. The normalized principal components correspond to the first mode, characterized by both interannual and interdecadal variability, with a turning point in about 2000 (Figure 10g). In general, the snow depth in Eurasia shows an increasing trend in both periods before and after 2000, and the snow depth obviously decreases after 2000. In early summer (June), the variance contributions of the second EOF mode of ERA5 and MERRA2 are 14.72% and 11.88%, respectively. The distribution is characterized by an inverse variation of snow depth in the Siberian region and the East European Plain (Figure 10b,e). The corresponding normalized principal component for the second mode (PC2) is similar to the first mode principal component, and there is also a turning point in the variation in snow depth in about 2000 (Figure 10h). In early summer (June), the variance contributions of the third EOF mode of ERA5 and MERRA2 are 11.12% and 10.2%, respectively. The distribution is characterized by snow depth loadings centered in the Siberian region (Figure 10c,f), and the corresponding normalized principal component shows significant interannual variability (Figure 10i). For the three datasets, each mode shows consistent variations in snow depth over Scandinavia (Figure 10).
Figure 11 shows the spatial distributions and corresponding normalized principal components of the first three EOF modes of the two snow depth datasets in late autumn (November) from 1980 to 2018. In late autumn, the variance contributions of the first EOF modes of ERA5 and MERRA2 were 12.98% and 14.56%, respectively (Figure 11a,d). The spatial distribution characteristics reflected by the first mode are consistent with the first dominant mode in winter and spring, showing a south–north dipole mode. In northern Eurasia, the snow depth also shows an inverse variation in Siberia and Far East Siberia. The normalized principal component corresponding to the first mode shows significant interannual variations, and the principal components of the two datasets are well aligned (Figure 11g). The snow depths decrease in northern Eurasia, except in the far east, and increase in the far east and south of Eurasia. In late autumn, the variance contributions of the second EOF mode of ERA5 and MERRA2 are 9.6% and 8.07%, respectively. The distribution of the second mode is characterized by the snow depth varying inversely between northern and southern Eurasia, showing a north–south dipole mode (Figure 11b,e). Among them, the normalized principal component corresponding to the second mode of MERRA2 data also shows significant interannual variability. The normalized principal component from ERA5 data shows interdecadal variability, with the turnaround year located near the year 2000 (Figure 11k,h). After 2000, the snow depths in the north decrease but increase more frequently in the south. The spatial distribution characteristics of the third EOF mode of the two datasets indicate that the snow depth decreases in western Eurasia and increases in parts of eastern Eurasia, roughly showing an east–west dipole mode (Figure 11c,f). The normalized principal component corresponding to the third mode exhibits significant interannual variation (Figure 11i). The main modes of snow cover in late autumn have been previously analyzed by scholars, showing an east–west dipole mode [57,58,59]. Among them, Ye et al. [57] used correlation to analyze the relationship between late autumn snow cover and snow depth in Eurasia (0° E–180° E, 40° N–80° N) from 1973 to 2013. It was discovered that the west–east dipole mode’s snow cover and the north–south dipole mode’s snow depth are related, and the relationship could be explained by temperature and snowfall. Reduced snowfall and increased temperatures in November resulted in smaller snow depths in northern Siberia, and increased snowfall appears to have led to increased snow depths in far eastern Eurasia. This is consistent with our demonstration of a north–south dipole pattern in snow depth in late autumn. Therefore, by combining the main spatial types of snow depth in winter and spring, we find that the variation in snow depth has consistency from late autumn to the following spring, both of which are in the north–south dipole mode. Furthermore, the snow depth in Siberia and the far east of Siberia varies inversely in the late autumn and winter, with consistent variations in spring.

4. Discussion and Conclusions

4.1. Discussion

This study found that both ERA5 and MERRA2 overestimate snow depths and that the seasonal trends at some of the representative stations are inconsistent with the measured station data. Compared to MERRA2, which tends to overestimate snow depth, ERA5_Land performs better. Both ERA5_Land and MERRA2 are long-term series products, with MERRA2 having lower spatial resolution and inferior performance for station-scale snow depth simulations than ERA5. The GlobSnow v3.0 data are more consistent with variations in snow depth, although there is a slight underestimation. Its data are missing from June to September, covering the area from 35° to 85° N. The coverage in the Tibetan Plateau is incomplete for GlobSnow v3.0 data, which does not include high mountainous areas. Studies have shown that GlobSnow v3.0 data are more suitable for areas where the snow depth is approximately 0.05 to 1 m. The bright temperature signal usually saturates at an SWE larger than 150 mm and at snow depths greater than 1 m, which can cause an underestimation of SWE [60]. Some scholars have also used measured snow depth station data to evaluate the applicability of GlobSnow data in the Chinese region, with unsatisfactory results [33].
Seasonal indicators of snow depth may be complexly affected by temperature characteristics and weather system characteristics. For example, Eurasian spring snow cover variations are closely related to teleconnections in the Arctic Oscillation (AO), EA–western Russia (EAWR), Polar–Eurasian (POL), and Western Pacific (WP) patterns [37]. The variations in snow in late autumn are affected by East Atlantic (EA), EAWR, and Scandinavian (SCAND) patterns [58]. The climate characteristics of the European winter are modulated by the North Atlantic Oscillation (NAO). The relationship between the NAO index and annual snow days or snow depth is statistically significant in Central Europe. However, it gradually weakens toward the east, and its impact on snow depth in Eastern Europe is limited to early and late winter [61,62,63]. In addition, the distribution of snow is affected by topography, altitude, radiation, and so on. Thus, the spatial variability of the snow is high, and it is difficult to use seasonal depth variations in the regional snow to represent representative station variations. Bulygina et al. [64] analyzed the variations in snow depth in winter from 1966 to 2010 using 958 weather stations in Russia and found that the multi-year snow depth and maximum snow depth in Western Siberia showed an increasing trend, while the far east of Eurasia showed a decreasing trend. Xiao et al. [35] analyzed the maximum and average snow depths for the seasons of autumn (September to November), winter (December to February), and spring (March to May) from 1992 to 2016 using the NHSnow dataset and found that the snow depths over a wide area of the Far East of Eurasia showed a significant decreasing trend in winter and a significant increase in spring. However, the conclusions of these studies are mainly on a regional scale, providing us with a picture of the wide-scale variation in snow depth. In this study, we accessed ERA5, MERRA2, and GlobSnow data from the perspective of representative stations and found that the variations in snow depth were consistent in winter and spring, with decreasing trends in the Alpine region, Northwest Europe, the East European Plain, and Siberia and increasing trends in Central Asia and the East Siberian Mountains. Moreover, the variations in snow depth at the representative stations in winter and spring are consistent with the regional snow depth variations in Yue et al.’s [30] study.
In this study, we used site data to evaluate ERA5_Land, MERRA2, and GlobSnow data with some limitations. Firstly, the sample size was small; we selected three snow datasets for assessment based on data length, but a variety of snow datasets exist that could also be studied. Secondly, effective data are limited. Because the selected area was Eurasia, which has a large spatial range, there are few station datasets with consistent data quality over a long period of time. This study selected sites with a more complete time series of snow depth in each region for assessment. The selected sites were random and scattered, but they were small in number. Subsequent studies could be narrowed down to provide a more detailed analysis in areas with dense sites and more complete data records. Thirdly, the structure of the snow had an impact. In this paper, we refer to the way most studies convert snow water equivalent to snow depth using a constant snow density. However, there are differences in the nature and structure of the snow under different climates and water vapor sources. Subsequent studies that use GlobSnow data for snow depth assessment may consider zoning the snow density.

4.2. Conclusions

In this study, ERA5, MERRA2, and GlobSnow data were assessed using Eurasian measured snow depth station data (GHCND) from 1980 to 2018. The spatial and temporal variability of snow depth was also characterized from two perspectives: the selection of representative stations in the subregion and the Eurasian continent as a whole. The main spatial modes of seasonal variation calculated using the three snow depth data were explored, and the main conclusions are presented below.
(1) Using measured site data to assess ERA5, MERRA2, and GlobSnow data, it was found that ERA5 and MERRA2 overestimate the snow depth, and the proportion of positive deviations is greater than or equivalent to four-fifths. Among them, ERA5’s overestimation of snow depth increases from low latitude to high latitude, while MERRA2’s overestimation occurs in all regions. GlobSnow underestimates the snow depth with a mean deviation of −3 cm, which is closer to the station’s observed snow depth in terms of absolute deviation (5.74 cm) and RMSE (8.51 cm).
(2) The annual variations in snow depth are consistent with seasonal variations in winter and spring, with an increasing trend observed in the mountains of Central Asia and Siberia and a decreasing trend seen in most of the rest of Eurasia. Both ERA5 and MERRA2 data are less accurate for modeling Central Asia due to its unique topographic and climatic conditions. In addition, due to the lower spatial resolution of MERRA2, the snow trend in spring in the Eastern Siberian region, according to MERRA2 data, is not consistent with the rest of the data. The snow depth variations shown by MERRA2 are weaker than those from ERA5.
(3) On the whole, the three datasets can reflect the annual and seasonal variations in snow, and the main variation areas are consistent. The distribution of snow depth has latitudinal and vertical zonal characteristics. Except for the Tibetan Plateau, the main winter coverage area is to the north of 50° N, with a latitudinal narrowing of the range in spring. Only the Western Siberian Plain and the Tibetan Plateau accumulate more snow in the summer. The snow depth variations are mainly on the Tibetan Plateau, in Siberia, in the northern parts of the East European Plain, and in the Scandinavian Mountains.
(4) The seasonal spatial patterns of the snow depths from the three datasets are consistent. The dominant patterns of snow depth in late autumn, winter, and spring are all north–south dipole patterns. The spatial distribution of snow depth is roughly inversely distributed along 60° N in winter and spring, and the dividing line in late autumn is northward. In late autumn (November) and winter, the first mode of the EOF of snow depth shows an inverse variation in Siberia, including the far east. The main characteristic of snow depth variation in Eurasia is one of overall consistency in summer. An inter-decadal turning point of snow depth occurred around the year 2000 in Eurasia, and the snow depth obviously decreased after 2000.

Author Contributions

Conceptualization: Z.W. methodology: Z.W. and K.C. formal analysis and investigation: Z.W. and K.C. writing—original draft preparation: K.C. and Z.W. writing—review and editing: Z.W., K.C., X.L. and L.M. funding acquisition: Z.W. All authors have read and agreed to the published version of the manuscript.

Funding

The National Key R&D Program of China (2022YFF0801703) provided funding for this study.

Institutional Review Board Statement

Not applicable.

Informed Consent Statement

Not applicable.

Data Availability Statement

ERA5-Land data can be obtained from the European Centre for Medium-Range Weather Forecasts (https://cds.climate.copernicus.eu/cdsapp#!/dataset/reanalysis-era5-land-monthly-means?tab=overview, accessed on 23 April 2024). MERRA2 data can be obtained from MDISC (https://disc.gsfc.nasa.gov/datasets/M2TUNXLND_5.12.4/summary?keywords=MEERA2, accessed on 23 April 2024). GlobSnow v3.0 NH SWE data can be obtained from the European Space Agency (https://www.globsnow.info/swe/, accessed on 23 April 2024). Global Historical Climatology Network Daily (GHCND) data can be obtained from the National Centers for Environmental Information (https://www.ncei.noaa.gov/products/land-based-station/global-historical-climatology-network-daily, accessed on 23 April 2024).

Conflicts of Interest

The authors declare no competing interests.

References

  1. Barnett, T.P.; Dümenil, L.; Schlese, U.; Roeckner, E.; Latif, M. The Effect of Eurasian Snow Cover on Regional and Global Climate Variations. J. Atmos. Sci. 1989, 46, 661–686. [Google Scholar]
  2. Douville, H.; Royer, J.F. Sensitivity of the Asian summer monsoon to an anomalous Eurasian snow cover within the Météo-France GCM. Clim. Dyn. 1996, 12, 449–466. [Google Scholar] [CrossRef]
  3. Walland, D.J.; Simmonds, I. Modelled atmospheric response to changes in Northern Hemisphere snow cover. Clim. Dyn. 1996, 13, 25–34. [Google Scholar] [CrossRef]
  4. Blanford, H.F., II. On the connexion of the Himalayas snowfall with dry winds and seasons of drought in India. Proc. R. Soc. Lond. 1997, 37, 3–22. [Google Scholar] [CrossRef]
  5. Chen, H.; Xu, B. Spatial and Temporal Features of Snow Depth in Winter over Eurasian Continent and Its Impacting Factors. Geogr. Sci. 2012, 32, 129–135. [Google Scholar]
  6. Wei, Z.; Dong, W. Assessment of Simulations of Snow Depth in the Qinghai-Tibetan Plateau Using CMIP5 Multi-Models. Arctic, Antarct. Alp. Res. 2015, 47, 611–625. [Google Scholar] [CrossRef]
  7. Zhang, R.; Zhang, R.; Zuo, Z. Characteristics of Winter Snow in China and the Impact of Eurasian Snow on China’s climate. J. Appl. Meteorol. Sci. 2016, 27, 513–526. [Google Scholar]
  8. Zou, Y.; Wang, Y.; Zhang, Y.; Koo, J. Arctic sea ice, Eurasia snow, and extreme winter haze in China. Sci. Adv. 2017, 3, e1602751. [Google Scholar] [CrossRef] [PubMed]
  9. Liu, H.; Liu, X.; Dong, B. Influence of Central Siberian Snow-Albedo Feedback on the Spring East Asian Dust Cycle and Connection With the Preceding Winter Arctic Oscillation. J. Geophys. Res. Atmos. 2018, 123, 13368–13385. [Google Scholar] [CrossRef]
  10. Diffenbaugh, N.S.; Pal, J.S.; Trapp, R.J.; Giorgi, F. Fine-scale processes regulate the response of extreme events to global climate change. Proc. Natl. Acad. Sci. USA 2005, 102, 15774–15778. [Google Scholar] [CrossRef]
  11. Westerling, A.L. Increasing western US forest wildfire activity: Sensitivity to changes in the timing of spring. Philos. Trans. R. Soc. B Biol. Sci. 2016, 371, 20150178. [Google Scholar] [CrossRef] [PubMed]
  12. Phan, D.T.; Nguyen, C.H.; Nguyen TD, P.; Tran, L.H.; Park, S.; Choi, J.; Lee, B.; Oh, J. A Flexible, Wearable, and Wireless Biosensor Patch with Internet of Medical Things Applications. Biosensors 2022, 12, 139. [Google Scholar] [CrossRef]
  13. Phan, D.T.; Ta, Q.B.; Huynh, T.C.; Vo, T.H.; Nguyen, C.H.; Park, S.; Choi, J.; Oh, J. A smart LED therapy device with an automatic facial acne vulgaris diagnosis based on deep learning and internet of things application. Comput. Biol. Med. 2021, 136, 104610. [Google Scholar] [CrossRef]
  14. Phan, D.T.; Ta, Q.B.; Ly, C.D.; Nguyen, C.H.; Park, S.; Choi, J.; Se, H.O.; Oh, J. Smart Low Level Laser Therapy System for Automatic Facial Dermatological Disorder Diagnosis. IEEE J. Biomed. Health Inform. 2023, 27, 1546–1557. [Google Scholar] [CrossRef]
  15. Phan, D.T.; Yap, K.H.; Garg, K.; Han, B.S. Vision-Based Early Fire and Smoke Detection for Smart Factory Applications Using FFS-YOLO. In Proceedings of the 2023 IEEE 25th International Workshop on Multimedia Signal Processing (MMSP), Poitiers, France, 27–29 September 2023. [Google Scholar] [CrossRef]
  16. Barnett, T.P.; Adam, J.C.; Lettenmaier, D.P. Potential impacts of a warming climate on water availability in snow-dominated regions. Nature 2005, 438, 303–309. [Google Scholar] [CrossRef] [PubMed]
  17. Ruosteenoja, K.; Markkanen, T.; Venäläinen, A.; Räisänen, P.; Peltola, H. Seasonal soil moisture and drought occurrence in Europe in CMIP5 projections for the 21st century. Clim. Dyn. 2018, 50, 1177–1192. [Google Scholar] [CrossRef]
  18. Damm, A.; Greuell, W.; Landgren, O.; Prettenthaler, F. Impacts of +2 °C global warming on winter tourism demand in Europe. Clim. Serv. 2017, 7, 31–46. [Google Scholar] [CrossRef]
  19. Steiger, R.; Scott, D.; Abegg, B.; Pons, M.; Aall, C. A critical review of climate change risk for ski tourism. Curr. Issues Tour. 2019, 22, 1343–1379. [Google Scholar] [CrossRef]
  20. Chen, X.; Liang, S.; Cao, Y.; He, T.; Wang, D. Observed contrast changes in snow cover phenology in northern middle and high latitudes from 2001–2014. Sci. Rep. 2015, 5, 16820. [Google Scholar] [CrossRef]
  21. Mudryk, L.R.; Kushner, P.J.; Derksen, C. Interpreting observed northern hemisphere snow trends with large ensembles of climate simulations. Clim. Dyn. 2014, 43, 345–359. [Google Scholar] [CrossRef]
  22. Kunkel, K.E.; Robinson, D.A.; Champion, S.; Yin, X.; Estilow, T.; Frankson, R.M. Trends and Extremes in Northern Hemisphere Snow Characteristics. Curr. Clim. Chang. Rep. 2016, 2, 65–73. [Google Scholar] [CrossRef]
  23. Groisman, P.Y.; Karl, T.R.; Knight, R.W.; Stenchikov, G.L. Changes in Snow Cover, Temperature, and Radiative Heat Balance over the Northern Hemisphere. J. Clim. 1994, 7, 1633–1656. [Google Scholar]
  24. Fontrodona Bach, A.; van der Schrier, G.; Melsen, L.A.; Klein Tank, A.M.G.; Teuling, A.J. Widespread and Accelerated Decrease of Observed Mean and Extreme Snow Depth over Europe. Geophys. Res. Lett. 2018, 45, 12312–12319. [Google Scholar] [CrossRef]
  25. Brown, R.D.; Mote, P.W. The Response of Northern Hemisphere Snow Cover to a Changing Climate. J. Clim. 2009, 22, 2124–2145. [Google Scholar] [CrossRef]
  26. Beniston, M.; Farinotti, D.; Stoffel, M.; Andreassen, L.M.; Coppola, E.; Eckert, N.; Fantini, A.; Giacona, F.; Hauck, C.; Huss, M.; et al. The European mountain cryosphere: A review of its current state, trends, and future challenges. Cryosphere 2018, 12, 759–794. [Google Scholar] [CrossRef]
  27. Thackeray, C.W.; Derksen, C.; Fletcher, C.G.; Hall, A. Snow and Climate: Feedbacks, Drivers, and Indices of Change. Curr. Clim. Chang. Rep. 2019, 5, 322–333. [Google Scholar] [CrossRef]
  28. Marty, C.; Schlögl, S.; Bavay, M.; Lehning, M. How much can we save? Impact of different emission scenarios on future snow cover in the Alps. Cryosphere 2017, 11, 517–529. [Google Scholar] [CrossRef]
  29. Räisänen, J. Twenty-first century changes in snowfall climate in Northern Europe in ENSEMBLES regional climate models. Clim. Dyn. 2016, 46, 339–353. [Google Scholar] [CrossRef]
  30. Yue, S.; Che, T.; Dai, L.; Xiao, L.; Deng, J. Temporal and Spatial Distribution and Variation Characteristic of Snow Depth in the Northern Hemisphere and Typical Areas. Remote Sens. Technol. Appl. 2020, 35, 1263–1272. [Google Scholar]
  31. Lin, Y.; Jiang, M. Maximum temperature drove snow cover expansion from the Arctic, 2000–2008. Sci. Rep. 2017, 7, 15090. [Google Scholar] [CrossRef]
  32. Hu, Y. The Relationship between Snow Cover and Climate Change from 1996 to 2012 across the Eurasian Continent. Master’s Thesis, Lanzhou University, Lanzhou, China, 2018. [Google Scholar]
  33. Xiao, L.; Che, T.; Dai, L. Evaluation on the Spatial Characteristics of Multiple Snow Depth Datasets over China. Remote Sens. Technol. Appl. 2019, 34, 1133–1145. [Google Scholar]
  34. Zhang, H.; Zhang, F.; Che, T.; Yan, W.; Ye, M. Investigating the Ability of Multiple Reanalysis Datasets to Simulate Snow Depth Variability over Mainland China from 1981 to 2018. J. Clim. 2021, 34, 9957–9972. [Google Scholar] [CrossRef]
  35. Xiao, X.; Zhang, T.; Zhong, X.; Li, X. Spatiotemporal Variation of Snow Depth in the Northern Hemisphere from 1992 to 2016. Remote Sens. 2020, 12, 2728. [Google Scholar] [CrossRef]
  36. Wegmann, M.; Orsolini, Y.; Dutra, E.; Bulygina, O.; Sterin, A.; Brönnimann, S. Eurasian snow depth in long-term climate reanalyses. Cryosphere 2017, 11, 923–935. [Google Scholar] [CrossRef]
  37. Zhang, T.; Wang, T.; Zhao, Y.; Xu, C.; Feng, Y.; Liu, D. Drivers of Eurasian Spring Snow-Cover Variability. J. Clim. 2021, 34, 2037–2052. [Google Scholar] [CrossRef]
  38. Yang, Y.; You, Q.; Smith, T.; Kelly, R.; Kang, S. Spatiotemporal dipole variations of spring snowmelt over Eurasia. Atmos. Res. 2023, 295, 107042. [Google Scholar] [CrossRef]
  39. Buchard, V.; Randles, C.A.; Da Silva, A.M.; Darmenov, A.; Colarco, P.R.; Govindaraju, R.; Ferrare, R.; Hair, J.; Beyersdorf, A.J.; Ziemba, L.D.; et al. The MERRA-2 Aerosol Reanalysis, 1980 Onward. Part II: Evaluation and Case Studies. J. Clim. 2017, 30, 6851–6872. [Google Scholar] [CrossRef]
  40. Randles, C.A.; Da Silva, A.M.; Buchard, V.; Colarco, P.R.; Darmenov, A.; Govindaraju, R.; Smirnov, A.; Holben, B.; Ferrare, R.; Hair, J.; et al. The MERRA-2 Aerosol Reanalysis, 1980 Onward. Part I: System Description and Data Assimilation Evaluation. J. Clim. 2017, 30, 6823–6850. [Google Scholar] [CrossRef]
  41. Takala, M.; Luojus, K.; Pulliainen, J.; Derksen, C.; Lemmetyinen, J.; Kärnä, J.; Koskinen, J.; Bojkov, B. Estimating northern hemisphere snow water equivalent for climate research through assimilation of space-borne radiometer data and ground-based measurements. Remote Sens. Environ. 2011, 115, 3517–3529. [Google Scholar] [CrossRef]
  42. Pulliainen, J. Mapping of snow water equivalent and snow depth in boreal and sub-arctic zones by assimilating space-borne microwave radiometer data and ground-based observations. Remote Sens. Environ. 2006, 101, 257–269. [Google Scholar] [CrossRef]
  43. Menne, M.J.; Durre, I.; Vose, R.S.; Gleason, B.E.; Houston, T.G. An Overview of the Global Historical Climatology Network-Daily Database. J. Atmos. Ocean. Technol. 2012, 29, 897–910. [Google Scholar] [CrossRef]
  44. Durre, I.; Menne, M.J.; Vose, R.S. Strategies for Evaluating Quality Assurance Procedures. J. Appl. Meteorol. Climatol. 2008, 47, 1785–1791. [Google Scholar] [CrossRef]
  45. Durre, I.; Menne, M.J.; Gleason, B.E.; Houston, T.G.; Vose, R.S. Comprehensive Automated Quality Assurance of Daily Surface Observations. J. Appl. Meteorol. Climatol. 2010, 49, 1615–1633. [Google Scholar] [CrossRef]
  46. Liu, Y. Study on Apatial-Temporal Variation of Snow Water Equivalent Loss in Eurasia and Its Relationship between Climate Change. Master’s Thesis, Lanzhou University, Lanzhou, China, 2021. [Google Scholar] [CrossRef]
  47. Chu, D.; Luo, S.; Lin, Z.; Yang, Y. Spatio-Temporal Variation of Snow Depth on Tibetan over the Last 30 Years. Meteorol. Mon. 2018, 44, 233–243. [Google Scholar]
  48. Klein, G.; Vitasse, Y.; Rixen, C.; Marty, C.; Rebetez, M. Shorter snow cover duration since 1970 in the Swiss Alps due to earlier snowmelt more than to later snow onset. Clim. Chang. 2016, 139, 637–649. [Google Scholar] [CrossRef]
  49. Zhong, X.; Zhang, T.; Kang, S.; Wang, K.; Zheng, L.; Hu, Y.; Wang, H. Spatiotemporal variability of snow depth across the Eurasian continent from 1966 to 2012. Cryosphere 2018, 12, 227–245. [Google Scholar] [CrossRef]
  50. Che, T.; Dai, L.; Zheng, X.; Li, X.; Zhao, K. Estimation of snow depth from passive microwave brightness temperature data in forest regions of northeast China. Remote Sens. Environ. 2016, 183, 334–349. [Google Scholar] [CrossRef]
  51. Grippa, M.; Mognard, N.; Le Toan, T.; Josberger, E.G. Siberia snow depth climatology derived from SSM/I data using a combined dynamic and static algorithm. Remote Sens. Environ. 2004, 93, 30–41. [Google Scholar] [CrossRef]
  52. Smith, T.; Bookhagen, B. Assessing uncertainty and sensor biases in passive microwave data across High Mountain Asia. Remote Sens. Environ. 2016, 181, 174–185. [Google Scholar] [CrossRef]
  53. Vander Jagt, B.J.; Durand, M.T.; Margulis, S.A.; Kim, E.J.; Molotch, N.P. The effect of spatial variability on the sensitivity of passive microwave measurements to snow water equivalent. Remote Sens. Environ. 2013, 136, 163–179. [Google Scholar] [CrossRef]
  54. Marcolini, G.; Koch, R.; Chimani, B.; Schöner, W.; Bellin, A.; Disse, M.; Chiogna, G. Evaluation of homogenization methods for seasonal snow depth data in the Austrian Alps, 1930–2010. Int. J. Climatol. 2019, 39, 4514–4530. [Google Scholar] [CrossRef] [PubMed]
  55. Li, S.; Zhang, J.; Chen, Z. The Relationship between the Increase of Extreme Snowfall in Winter of Central Asia and the Enhancement of Two SST Modes in the North Atlantic. Plateau Meteorol. 2022, 41, 1124–1140. [Google Scholar]
  56. Zhang, R.; Sun, C.; Zhang, R.; Li, W.; Zuo, J. Role of Eurasian Snow Cover in Linking Winter-Spring Eurasian Coldness to the Autumn Arctic Sea Ice Retreat. J. Geophys. Res. Atmos. 2019, 124, 9205–9221. [Google Scholar] [CrossRef]
  57. Ye, K.; Wu, R. Autumn snow cover variability over northern Eurasia and roles of atmospheric circulation. Adv. Atmos. Sci. 2017, 34, 847–858. [Google Scholar] [CrossRef]
  58. Gastineau, G.; García-Serrano, J.; Frankignoul, C. The Influence of Autumnal Eurasian Snow Cover on Climate and Its Link with Arctic Sea Ice Cover. J. Clim. 2017, 30, 7599–7619. [Google Scholar] [CrossRef]
  59. Han, S.; Sun, J. Impacts of Autumnal Eurasian Snow Cover on Predominant Modes of Boreal Winter Surface Air Temperature Over Eurasia. J. Geophys. Res. Atmos. 2018, 123, 10076–10091. [Google Scholar] [CrossRef]
  60. Luojus, K.; Pulliainen, J.; Takala, M.; Lemmetyinen, J.; Mortimer, C.; Derksen, C.; Mudryk, L.; Moisander, M.; Hiltunen, M.; Smolander, T.; et al. GlobSnow v3.0 Northern Hemisphere snow water equivalent dataset. Sci. Data 2021, 8, 163. [Google Scholar] [CrossRef]
  61. Bednorz, E. Snow cover in western Poland and macro-scale circulation conditions. Int. J. Climatol. 2002, 22, 533–541. [Google Scholar] [CrossRef]
  62. Bednorz, E.; Wibig, J. Snow depth in eastern Europe in relation to circulation patterns. Ann. Glaciol. 2008, 48, 135–149. [Google Scholar] [CrossRef]
  63. Seager, R.; Kushnir, Y.; Nakamura, J.; Colarco, P.R.; Darmenov, A.; Govindaraju, R.; Smirnov, A.; Holben, B.; Ferrare, R.; Hair, J.; et al. Northern Hemisphere winter snow anomalies: ENSO, NAO and the winter of 2009/10. Geophys. Res. Lett. 2010, 37, L14703. [Google Scholar] [CrossRef]
  64. Bulygina, O.N.; Groisman, P.Y.; Razuvaev, V.N.; Korshunova, N.N. Changes in snow cover characteristics over Northern Eurasia since 1966. Environ. Res. Lett. 2011, 6, 045204. [Google Scholar] [CrossRef]
Figure 1. Distributions and frequency histograms of the snow depth biases between the Eurasian multi-source data and the station data. (a,d) ERA5; (b,e) MERRA2; (c,f) GlobSnow.
Atmosphere 15 00530 g001
Figure 2. Spatial distribution of the MAE (left) and RMSE (right). (a,b) ERA5, (c,d) MERRA2, (e,f) GlobSnow.
Atmosphere 15 00530 g002
Figure 3. Annual variations in the mean snow depth at each regional representative station. (a) Station data, (b) ERA5, (c) MERRA, (d) GlobSnow.
Atmosphere 15 00530 g003
Figure 4. Variations in the mean annual snow depth at representative stations for four datasets (stations, ERA5, MERRA2, and GlobSnow) in major regions of Eurasia. (ac) Alpine region, (eh) Northwest Europe, (il) East European Plain, (mp) Siberia, (qt) Central Asia, (ux) Eastern Siberian Mountains.
Atmosphere 15 00530 g004
Figure 5. Same as Figure 4 but for spring.
Atmosphere 15 00530 g005
Figure 6. Spatial distributions of the mean snow depth (left) and the standard deviation (right) from 1980 to 2018. (a,b) ERA5, (c,d) MERRA2, (e,f) GlobSnow.
Atmosphere 15 00530 g006
Figure 7. Spatial distributions of the mean snow depth (left) and the standard deviation (right) in each season from 1980 to 2018: winter (upper left), spring (upper right), summer (lower left), and autumn (lower right). (a,b) ERA5, (c,d) MERRA2, (e,f) GlobSnow.
Atmosphere 15 00530 g007
Figure 8. Spatial distributions and corresponding normalized principal components of the first three EOF modes in winter. (ac) ERA5, (df) MERRA2, (gi) GlobSnow, (jl) normalized principal components corresponding to the three EOF modes—red solid line: ERA5, blue solid line: MERRA2, green solid line: GlobSnow.
Atmosphere 15 00530 g008
Figure 9. Spatial distributions and corresponding normalized principal components of the first three EOF modes in spring. (ac) ERA5, (df) MERRA2, (gi) GlobSnow, (jl) normalized principal components corresponding to the three EOF modes—red solid line: ERA5, blue solid line: MERRA2, green solid line: GlobSnow.
Atmosphere 15 00530 g009
Figure 10. Spatial distributions and corresponding normalized principal components of the first three EOF modes in early summer (June). (ac) ERA5, (df) MERRA2, (gi) normalized principal components corresponding to the three EOF modes—red solid line: ERA5, blue solid line: MERRA2.
Atmosphere 15 00530 g010
Figure 11. Spatial distributions and corresponding normalized principal components of the first three EOF modes in late autumn (November). (ac) ERA5, (df) MERRA2, (gi) normalized principal components corresponding to the three EOF modes—red solid line: ERA5, blue solid line: MERRA2.
Atmosphere 15 00530 g011
Table 1. MAE and RMSE.
MAERMSE
ERA5MERRA2GlobSnowERA5MERRA2GlobSnow
Alpine region3.856.774.676.699.457.12
Northwest Europe5.937.255.378.9310.518.81
East European Plain7.0311.916.249.0813.718.71
Siberia14.1310.797.2516.7512.839.63
Central Asia8.1910.036.510.111.458.08
Eastern Siberian Mountains17.1713.346.9620.5215.569.14
Disclaimer/Publisher’s Note: The statements, opinions and data contained in all publications are solely those of the individual author(s) and contributor(s) and not of MDPI and/or the editor(s). MDPI and/or the editor(s) disclaim responsibility for any injury to people or property resulting from any ideas, methods, instructions or products referred to in the content.

