Abstract
On 6 June 2017, four severe clear-air turbulence (CAT) events were observed over northern China within 3 h. These events mainly occurred at altitudes between 8.1 and 9.5 km. The characteristics and possible mechanisms of the CAT events in the different regions are investigated here using the weather research and forecasting (WRF) model. The simulated wind and temperature fields in a 27 km coarse domain were found to be in good agreement with those of the ERA5 (European Centre for Medium-Range Weather Forecasts Reanalysis v5) and the observed soundings of operational radiosondes over northern China. In terms of synoptic features, the region where the turbulence occurred is characterized by a southwest–northeast upper-level jet stream. The upper-level jet stream observed at an altitude of 10.4 km consistently moved eastwards, with a maximum wind speed of 61.7 m/s. Simultaneously, the upper-level front–jet system on the cyclonic shear side of the upper-level jet stream also exhibited an eastward motion. The developed upper-level front–jet system induced significant vertical wind shear (VWS) and tropopause folding in the vicinity of these CAT events. Despite the high stability resulting from tropopause folding, the presence of strong VWS (1.90 × 10⁻² s−1–2.55 × 10⁻² s−1) led to a low Richardson number (Ri) (0.24–0.88) and caused Kelvin–Helmholtz instability (KHI), which ultimately induced CAT. Although a standard numerical weather forecast resolution of tens of kilometers is adequate to capture turbulence for most CAT events, it is still necessary to use high-resolution numerical simulations (such as 3 km) to calculate more accurate CAT indices (such as Ri) for CAT prediction in some specific cases.
1. Introduction
Clear-air turbulence (CAT) refers to bumps that an aircraft encounters at cruise levels over 20,000 ft within a cloud-free or stratiform cloud condition [1]. CAT is characterized by turbulent eddies spanning 10 to 1000 m in the free atmosphere, earning it the moniker the “invisible killer” due to its substantial threat to flight safety and potential for in-flight injuries [2,3]. Indeed, turbulence at cruising altitudes accounts for over 70% of weather-related accidents involving commercial jet aircraft [4]. Globally, commercial aircraft experience tens of thousands of moderate-or-greater turbulence incidents each year, leading to hundreds of passenger injuries or fatalities, substantial financial losses, and damage to aircraft structures [5]. Moreover, the influence of global climate change is anticipated to heighten both the frequency and intensity of turbulence, especially within the mid-latitude region, owing to the amplified vertical wind shear (VWS) near upper-level jet streams. Climate modeling studies predict a significant increase of 40–170% in the incidence of moderate-or-greater CAT events on transatlantic flight routes during winter [5,6,7]. In addition, atmospheric turbulence can affect the performance and reliability of a free-space optical communication system, with the values of received power, quality factor, and signal-to-noise ratio being higher in the case of atmospheric turbulence during rain than in the case of fog [8]. Thus, it is imperative to bolster research on CAT.
Various mechanisms contribute to the occurrence of CAT. Early studies observed that CAT frequently occurs in the vicinity of the upper-level front–jet system, where strong VWS can induce Kelvin–Helmholtz instability (KHI), leading to the onset of CAT. KHI magnitude can be assessed by employing the Richardson number (Ri) [9]. Consequently, operational forecasting has implemented a diagnostic index based on the Ri, providing specific forecasts for CAT linked to mountain waves [10]. The threshold for KHI resulting in CAT is an Ri below 0.25, although this criterion is relaxed to 1 in the case of three-dimensional nonlinear flow [11]. Nonetheless, this diagnostic approach falls short in explaining CAT events in terrain-free areas, especially in cases of moderate-or-greater CAT [12].
Furthermore, the existence of inertial instability in conjunction with anticyclonic flow is acknowledged as a substantial factor contributing to CAT. In strong anticyclones, both inertial instability and geostrophic adjustment are considered more reliable sources of CAT [13]. Furthermore, Clark et al. observed a strong correlation between the incidence of CAT events and the existence of horizontal vortex tubes in particular regions [14]. This observation implies that the formation of horizontal vortex tubes is a probable cause of CAT. Basse extended the modeling of an interaction between an aircraft and a vortex tube to include an arbitrary vortex tube angle [15]. As a result, Kaplan introduced the NCSU2 index, which employs vertical vorticity and pressure gradient force to measure the intensity of horizontal vortex tubes for predicting CAT [16]. Simulation results have shown that the NCSU2 index is an effective predictor of severe CAT events in areas with anticyclonic flow [17].
Another significant mechanism is a breakdown of gravity waves induced by topography or convective processes. Gravity waves play a pivotal role in transferring energy and momentum within the atmosphere [18]. As gravity waves propagate vertically from the troposphere, they ultimately break as atmospheric density decreases and amplitude progressively increases. This leads to the intensification of local turbulence. Multiple explanations exist for gravity wave breaking. One posits complete wave breakdown [19] while the other suggests wave saturation with the transfer of surplus energy [20]. Lane and Sharman performed numerical simulations to examine the small-scale gravity wave-breaking process, utilizing a three-dimensional cloud resolution model with 150 m grid spacing. The results revealed a significant increase in turbulence kinetic energy in the wave-breaking region, offering insight into the potential energy transfer from gravity waves to turbulence [21]. Jiang and Lane proposed that the breaking of large-amplitude topographic gravity waves over complex terrain constitutes another noteworthy mechanism for generating small-scale turbulence, which directly affects aircraft turbulence [22,23,24]. Three main factors contribute to CAT induced by mountain waves. First, the amplitude of vertically propagating topographic gravity waves steadily increases due to decreasing air density [25], ultimately leading to wave breakdown at higher altitudes [23,26]. Second, increased atmospheric stability near the tropopause results in shorter vertical wavelengths of mountain waves, thereby heightening the likelihood of wave breaking [27]. Third, when the phase velocity of the gravity wave aligns with the background wind speed (at the height of the critical layer), the gravity wave undergoes breaking [28,29,30].
Observational turbulence studies in the free atmosphere have mainly been conducted using radar, aircraft, and rocket observations, all of which have their own advantages and disadvantages [31]. Recently, turbulence estimations based on the Thorpe method [32] using high vertical-resolution radiosonde data have been conducted over vast regions for long periods [33]. Ko et al. estimated the eddy dissipation rate and the thickness of the turbulence layer in the free atmosphere (z = 3–30 km) based on the Thorpe method using high-vertical-resolution radiosonde data, which show that strong and thick turbulence occurs more in the troposphere than in the stratosphere, and that the generation of turbulence is mainly favored in weak static stability conditions [34].
The wind and turbulence structures of a tropical cyclone attract significant interests, which can facilitate proactive TC hazard prevention. He et al. conducted an observational study of the wind and turbulence structures of two super typhoons based on data from the 356 m-high Shenzhen Meteorological Gradient Tower. The results indicated that shear production is 70–110% larger than dissipation at a 10 m height, but 10–60% smaller than dissipation at greater heights [35]. New technologies are constantly applied to models to improve turbulence forecasting, for example, the cell perturbation technique works to increase microscale wind speed fluctuation energy to achieve specified turbulence statistics during a typhoon [36]. Submesoscale turbulence (1–50 km) plays a key role in the ocean energy cascade. With the improvements in model simulations, the inverse kinetic energy cascade expands farther down to the submesoscale, to 15 km, and both mesoscale and submesoscale turbulence show good vertically consistent seasonal variability in the upper ocean [37].
The persistence of the subtropical westerly jet stream in East Asia heightens the probability of encountering CAT over China [38]. Moreover, owing to complex terrain features like the Qinghai–Tibet Plateau, the factors contributing to CAT incidents in China may be more intricate and may warrant detailed investigation.
This study aimed to understand the generation mechanism of these CAT events using a weather research and forecasting (WRF)–advanced research WRF (ARW) mesoscale model. Previous studies on CAT events over northern China paid little attention to the role of upper-level front–jet systems and tropopause folding. Our research reveals the mechanism behind the upper-level front–jet systems and tropopause folding adjusting the VWS to induce CAT, and the model shows good simulation results, which provides great confidence for forecasters to predict such CAT events in the future. The outcome of this study is expected to enhance the understanding of CAT generation, improve the numerical simulation of CAT events, and facilitate CAT hazard prevention.
2. Materials and Methods
2.1. Observation of Turbulence Encounters
During the early hours of 6 June 2017, pilot reports (PIREPs) documented four instances of severe turbulence over northern China. This event was particularly rare, and the consecutive presence of severe turbulence over a 3 h period had a significant impact on aviation safety. The timing, longitude, latitude, flight altitude, and turbulence intensity of these events, derived from PIREPs, are presented in Table 1. It is worth noting that PIREPs are widely utilized in routine civil aviation operations. However, PIREPs are inherently subjective and may contain inaccuracies regarding timing and location. Currently, PIREPs represent one of the few available data sources for studying aviation turbulence [39,40]. The four turbulence events mainly occurred within a 3 h window from 0030 UTC to 0330 UTC on 6 June 2017. All of these events occurred near 36.53° N, with a latitude difference of no more than 1° N between them. The longitude of these events ranged from 112.86° E to 117.20° E. The flight altitudes during these events ranged from 8.1 km to 9.5 km, which are classified as high altitudes in air traffic management. All four turbulence events were categorized as severe turbulence, denoting the most severe level of aircraft turbulence.

Table 1.
Time, latitude, longitude, flight level, and intensity of four turbulence events over northern China reported in PIREPs on 6 June 2017.
Figure 1 presents the infrared and water vapor images over eastern China at 0000 UTC on 6 June 2017, which were provided by the Japan Meteorological Agency, aiming to investigate the relationship between these turbulence events and convection. Figure 1a illustrates a notable concentration of clouds in the northeastern and southern regions of China, with few cloud bands over the Loess Plateau. In contrast, the areas where these turbulence events occurred (Figure 1a) showed limited cloud cover. Moreover, the regions where these turbulence events took place (Figure 1b) displayed a lack of water vapor. The turbulence encountered by these aircraft can be categorized as CAT, following the definition provided by Ellrod et al. [1].
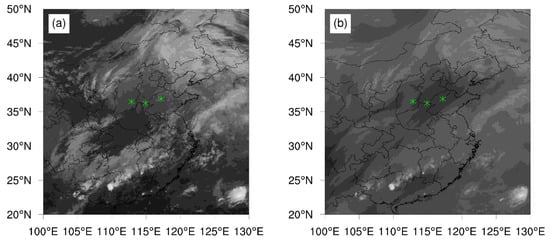
Figure 1.
Composite images of Himawari-8: (a) IR channel and (b) water vapor channel over eastern China at 0000 UTC 6 June 2017. The green asterisks indicate the locations of turbulence encounters.
2.2. Configuration of WRF Model
This study simulates CAT events using the WRF-ARW mesoscale model (version 4.0), a nonhydrostatic and compressible model developed by NCAR. Previous research has employed this model to simulate real aircraft turbulence events [39,40].
Figure 2 illustrates the simulation area comprising three domains. Domains 1 (D1), 2 (D2), and 3 (D3) have horizontal grid spacings of 27 km, 9 km, and 3 km, respectively, and two-way nesting is implemented across all domains. The model encompasses 92 vertical levels, with a top level at 20 hPa. The integrations were conducted for 36 h from 0000 UTC 5 to 1200 UTC 6 June 2017. The initial field, derived from the National Centers for Environmental Prediction (NCEP) Final Operational Global Analysis (FNL) reanalysis data at a resolution of 1° × 1°, was updated every 6 h. The simulation included various parameterization schemes, including the WRF single-component (WSM) 6-class microphysical process scheme, the Mellor–Yamada–Janjic (MYJ) planetary boundary layer (PBL) scheme, the rapid radiative transfer model (RRTM) long-wave scheme, and the Dudhia short-wave scheme. The Kain–Fritsch cumulus scheme was exclusively applied to D1 and D2. Rayleigh damping was applied to the uppermost 7 km to minimize any artificial reflections of gravity waves.
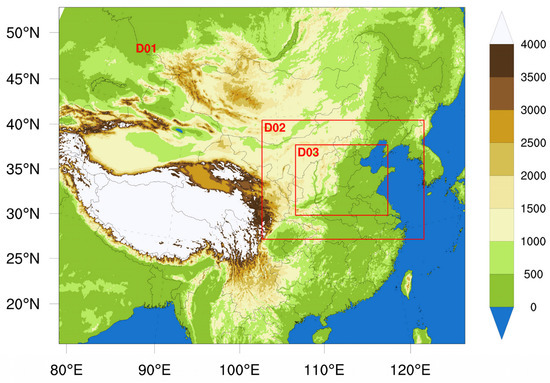
Figure 2.
Terrain height (m) in the numerical simulation domain and locations of three domains (D1 with Δx = 27 km, D2 with Δx = 9 km, and D3 with Δx = 3 km).
3. Results
3.1. Verification of Numerical Simulations
In this section, we compare the simulated weather situation from WRF with the ERA5 reanalysis data. Figure 3a illustrates the presence of two ridges and one trough in mid-high latitudes at 200 hPa, as obtained from the WRF simulation at 0000 UTC on 6 June 2017. The trough extended from Baikal Lake to Mongolia, while the two ridges were located near Balkash Lake and east of the Great Khingan Mountains in China. Furthermore, the two jet streams were divided by the 100° E meridian. The synoptic situation generally matched the ERA5 reanalysis results, except that the WRF simulation showed slightly higher maximum wind speeds in the jet streams, as indicated in Figure 3a,b. At the surface, two low-pressure systems were observed to the east of Lake Baikal and above the Yangtze–Huaihe region of China, with a high-pressure system over Japan (Figure 3c). Nevertheless, the low-pressure system above the Yangtze–Huaihe region of China in the WRF simulation is marginally stronger than that in the ERA5 reanalysis data (Figure 3c,d). The simulated results were generally in agreement with the ERA5 reanalysis.
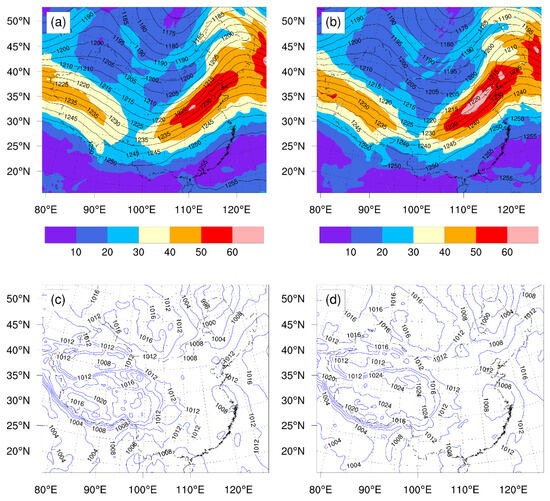
Figure 3.
(a,b) Geopotential height (contours, geopotential 10 m) superimposed on horizontal wind speed (shading; m s−1) at 200 hPa and (c,d) sea-level pressure (contours) at 0000 UTC, 6 June 2017, obtained from (left) the WRF model output in D1 and (right) the 0.25° × 0.25° ERA5 data. The contour intervals of the geopotential height and the sea-level pressure are 50 gpm and 5 hPa, respectively.
To validate the simulated vertical atmosphere structure, we selected radiosonde data from the two nearest stations to the CAT event locations for comparison with the WRF simulation results. Given the relatively similar simulation results across the three domains, this study primarily discusses the results from D1 for comparison. In Figure 4a, the temperature at Zhangqiu Station closely matches the dew-point temperature below 500 hPa, suggesting a relatively high atmospheric saturation. However, above 500 hPa, the atmosphere exhibits dry conditions. Simultaneously, the simulated temperature and dew-point temperature closely match the observed results at various altitudes, except for a slight deviation in the dew-point temperature above 600 hPa. At Zhangqiu Station, the observed wind direction was easterly at 1000 hPa, southerly at 850 hPa, and southwesterly above 700 hPa. The simulated wind direction closely aligns with the observations. The maximum wind speed recorded at Zhangqiu Station was approximately 58.1 m/s, observed at an altitude of 10.4 km, which aligns with the simulated result. Furthermore, the simulated wind speed at different altitudes generally agrees with the observations. Additionally, the simulated wind speeds at different altitudes generally align with the observations. However, in the boundary layer, the simulated wind speed is slightly lower than the observed results, while it is slightly higher at upper levels.
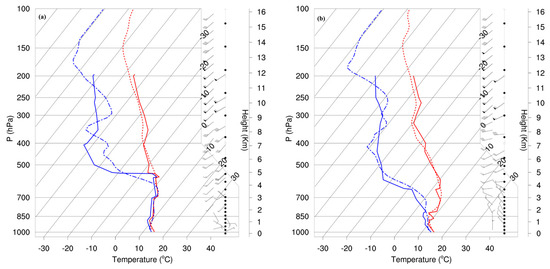
Figure 4.
Skew T-logp diagrams (red, temperature; blue, dew-point temperature) obtained from the observed (solid) and the simulated (dashed) soundings at Zhangqiu (a) and Zhengzhou (b) Stations in northern China at 0000 UTC, 6 June 2017. (Right) Simulated and (far right) observed wind speeds at each level with full (10 m s−1) and half (5 m s−1) barbs and a pennant (50 m s−1). Isotherms in 10 °C intervals are denoted by slantwise thin lines in both panels.
Figure 4b displays the observations from Zhengzhou Station. Below 850 hPa, the atmosphere exhibited relatively high saturation, while the temperature–dew-point temperature difference gradually increased with height, reaching a maximum difference of nearly 2 °C, signifying a very dry atmosphere. Furthermore, the saturation layer over Zhengzhou Station was notably thinner than that over Zhangqiu Station, consistent with the findings from the satellite cloud images in Figure 1. The observed wind direction was northerly at 1000 hPa and westerly above 500 hPa, and the simulated wind direction aligned well with the observations. The maximum wind speed recorded at Zhengzhou Station was 61.7 m/s, observed at an altitude of 10.4 km, which was slightly lower than the simulated maximum wind speed. Although the height of the maximum wind speed was consistent, both Zhangqiu and Zhengzhou Stations recorded maximum wind speeds at approximately 10.4 km, indicating the presence of the jet stream. However, the maximum wind speed at Zhengzhou Station was higher, suggesting a closer position of the jet stream. This observation aligns with the horizontal wind speed distribution shown in Figure 3. Additionally, CAT events occurred at heights between 8.1 and 9.5 km, coinciding with the location of strong VWS just below the maximum wind speed. The relationship between VWS and CAT events will be discussed in the following section.
Figure 5 presents the horizontal and vertical distribution of turbulent kinetic energy (TKE) at 8.9 km altitude in D3, which represents the average conditions during the four CAT events at 0210 UTC on 6 June 2017. Notably, the TKE values near the locations of the four CAT events exhibited substantial magnitudes (≥0.12 m2 s−2). Interestingly, even though event 2 was farther from the jet core than the others, the TKE near event 2 exceeded that of the other CAT events (Figure 5a). Vertically, the region with high TKE values showed a concentration between 8 and 10 km, sloping downward along the longitudinal direction. This belt-like distribution corresponded with the dense area of potential temperature contours (Figure 5a). TKE, an indicator of atmospheric turbulence, exhibited a significant correlation with CAT occurrences, confirming the model’s effective ability to capture CAT events.
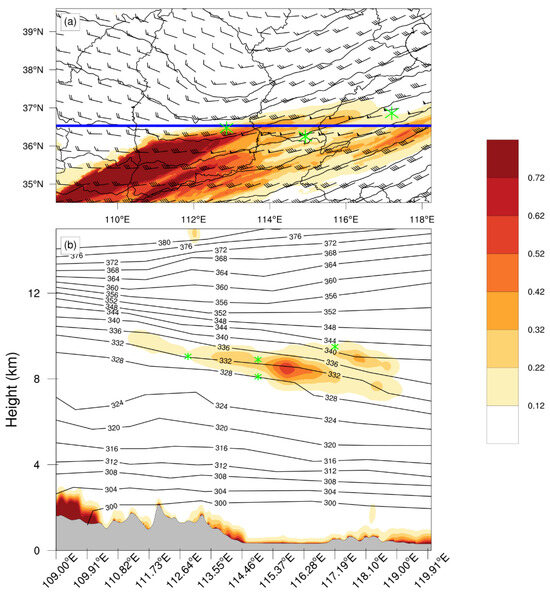
Figure 5.
Simulated results in D3 at 0210 UTC, 6 June 2017: (a) horizontal wind vectors and pressure (contours) superimposed on TKE (shading, m2 s−2) at an altitude of 8.9 km and (b) potential temperature (contours, K) superimposed on TKE (shading, m2 s−2) along 36.53° N, as indicated by the blue line in (a). Green asterisks in the plots indicate the locations of CAT events. Additionally, the gray-shaded zone at the bottom of the plot represents the terrain height.
In summary, the WRF model demonstrated remarkable effectiveness in simulating the weather background, atmospheric vertical structure characteristics, and the locations of CAT events. Consequently, the following sections of this paper will utilize the WRF output to investigate the factors contributing to CAT events.
3.2. Model Results
Figure 6 displays the horizontal distribution of potential temperature at 8.9 km in D2, comparing conditions at 1200 UTC on 5 June and 0210 UTC on 6 June 2017. It also presents the horizontal wind speed distribution at 11 km, overlaying geopotential height. At 1200 UTC on 5 June, a relatively strong meridional temperature gradient in a frontal zone was located from Shanxi Province to Sichuan Province in China, signifying the presence of a frontal zone (Figure 6a). The four CAT events occurred ahead of this frontal zone. By 0210 UTC on 6 June, as the frontal zone shifted eastward to Henan Province and Shandong Province, the potential temperature gradient intensified in the vicinity of the four CAT events (Figure 6b). Concurrently, the upper-level jet stream gradually strengthened, as depicted in Figure 6c. The maximum wind speed within the jet stream exceeded 60 m/s, and the regions where turbulence occurred underwent gradual transitions from the anticyclonic zone on the southern side of the upper-level jet stream to the cyclonic shear zone on the northern side.
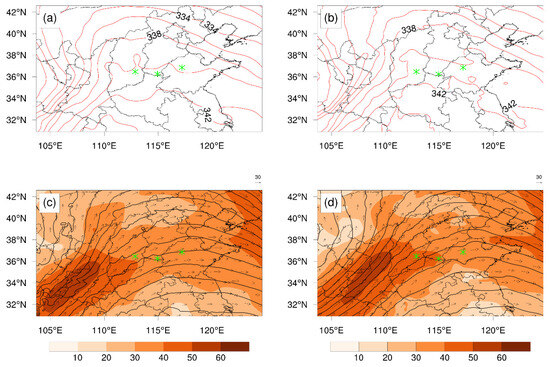
Figure 6.
Simulated results in D2 at (left) 1200 UTC, 5 June 2017, and (right) 0210 UTC, 6 June 2017: (a,b) potential temperature (contours, K) at z = 8.9 km and (c,d) horizontal wind vectors and geopotential height (contours, every 10 gpm) superimposed on horizontal wind speed (shading, m s−1) at z = 11 km. Green asterisks in the plots indicate the locations of CAT events.
Changes in the position and intensity of the upper-level front–jet system have the potential to trigger shear instability. To explore the possible connection between shear instability driven by the upper-level front–jet system and the incidence of CAT events, we conducted a further analysis. In Figure 7, we present the Brunt–Väisälä frequency (N2), VWS, and Ri at 1200 UTC on June 5 and 0210 UTC on June 6. The Brunt–Väisälä frequency exhibited a noteworthy increase within the region of CAT events, signifying heightened stability (Figure 7a,b). This phenomenon may be linked to tropopause folding, a topic we will address later. Despite this rise in stability, VWS displayed a strengthening trend (Figure 7c,d). Consequently, the Ri decreased from values exceeding 1 to below 0.25 (Figure 7e,f), suggesting that the development of CAT events was significantly influenced by KHI, attributed to intense vertical shear. This pattern shares similarities with multiple CAT events associated with the front–jet system, as previously documented in the literature [39,41].
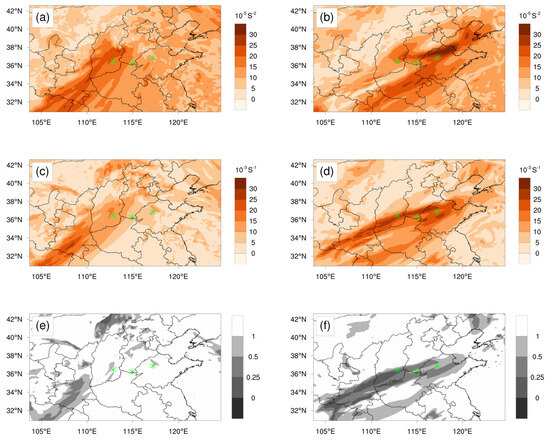
Figure 7.
Simulated results at (left) 1200 UTC, 5 June 2017, and (right) 0210 UTC, 6 June 2017: (a,b) Brunt–Väisälä frequency (shading), (c,d) VWS (shading), and (e,f) Ri (shading), at 8.9 km obtained from the WRF results in D2. Green asterisks in the plots indicate the locations of CAT events.
Figure 8 illustrates vertical cross sections showing horizontal wind speed, Ri, VWS, Brunt–Väisälä frequency, potential temperature, and 1.5 PVU (1 PVU = 1.0 × 10⁻⁶ K kg−1 m2 s−1) contours along 36.53° N, which represent the average latitude of the four CAT events in Table 1. The core of the jet stream was centered at 11 km, with an inclined and concentrated potential temperature contour between 8 and 12 km and between 107 and 112° E below the jet core (Figure 8a,b), indicating the presence of the upper-level frontal zone. Between 1200 UTC on 5 June and 0210 UTC on 6 June, the upper-level jet stream intensified and shifted eastward as the upper-level frontal zone progressed, with the maximum wind speed within the jet stream exceeding 60 m/s (Figure 8b). This strengthening of the upper-level front–jet system heightened the horizontal gradient of potential temperature, resulting in increased VWS (Figure 8h), in accordance with the thermal wind relationship. Consequently, the Ri decreased (Figure 8d). Notably, significant tropopause folding was observed. At 1200 UTC on 5 June, the dynamic tropopause extended eastward to 114° E and descended to an altitude of 8 km (Figure 8a). Subsequently, at 0210 UTC on 6 June, the dynamic tropopause extended further east to approximately 120° E and descended to around 7 km. Tropopause folding played a dual role. Firstly, it facilitated the downward transport of stably stratified stratospheric air to the troposphere, increasing static stability within the folding area (Figure 8f). Additionally, tropopause folding induced a positive anomaly of potential vorticity in the folding area, leading to an amplified potential temperature gradient and subsequent enhancement in VWS. Consequently, the Ri decreased. This reduction in the Ri contributed to the emergence of KHI and was a combined result of the upper-level front–jet system and tropopause folding.
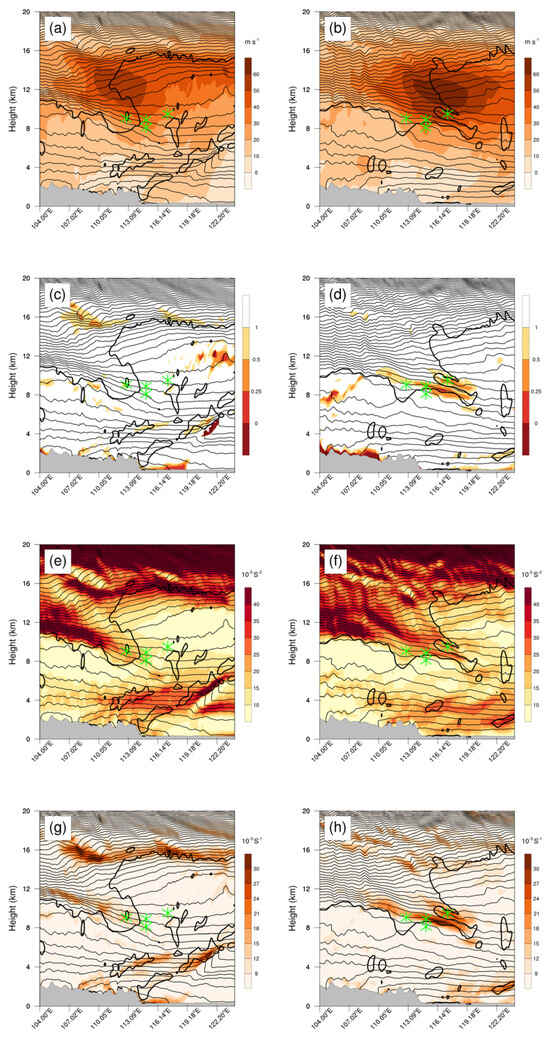
Figure 8.
Potential temperature (contours) and potential vorticity (thick line, 1.5 PVU) superimposed on (a,b) horizontal wind speed (shading, m s−1), (c,d) the Ri (shading), (e,f) Brunt–Väisälä frequency (shading), and (g,h) VWS (shading) along 36.53° N at (left) 1200 UTC, 5 June 2017, and at (right) 0210 UTC, 6 June 2017, from the WRF results in D2. Contour intervals are 4 K. Green asterisks in the plots indicate the locations of CAT events. Additionally, the gray-shaded zone at the bottom of the plot represents the terrain height.
To investigate the spatial resolution dependence of model resolution on the simulation results, Figure 9 provides vertical cross sections of Ri superimposed on the potential temperature of three domains for comparison. It is noteworthy that the structural characteristics of tropopause folding and the upper-level frontal zone exhibit significant similarities in all three domains. However, compared with D1, the model can simulate stronger KHI (regions with Ri less than 0.25) in D2 and D3. The main reason is that the increase in spatial resolution leads to an increase in temperature gradient and VWS, resulting in a decrease in Ri. The VWS and Ri for the four CAT events are calculated from the simulations over all three domains. As shown in Table 2, the values of VWS and Ri of the three domains are generally close, revealing the existence of strong wind shear, which in turn induces turbulence. The results of D3 are closest to the observation when the VWS ranges from 1.90 × 10⁻² s−1 to 2.55 × 10⁻² s−1 and the local Ri ranges from 0.24 to 0.88. Compared with D1, the diagnostic values over D3 are quite similar to those over D2. The model with the coarse spatial resolution of 27 km is obviously slightly less accurate. It is worth noting the calculation results of event 3: Ri over D3 is less than 1 (0.88) which means dynamical instability, and Ri over D2 is equal to 1, while Ri over D3 is greater than 1 (1.31). This may be due to the fact that the location of event 3 is located at the edge of the turbulent region (Figure 5). When Ri = 1.00 and VWS = 0.0182, the Brunt–Väisälä frequency is 0.0182, which indicates weak static stability. Additionally, the generation of turbulence is mainly favored in weak static stability conditions. This is the same as the results of Ko et al. [34]. Overall, the impact of model resolution on the simulation results is small, and a model with a resolution of about 9 km is sufficient to predict the occurrence of CAT under such weather backgrounds.
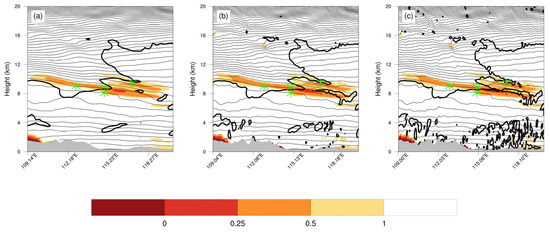
Figure 9.
Potential temperature (contours), and 1.5 PVU (thick line, 10−6 K kg−1 m2 s−1) superimposed on the Ri (shading) along 36.53° N in (a) D1, (b) D2, and (c) D3, at 0200 UTC, 6 June 2017. Contour intervals are 4 K. Green asterisks in the plots indicate the locations of CAT events. Additionally, the gray-shaded zone at the bottom of the plot represents the terrain height.

Table 2.
WRF-simulated VWS and Ri in D1, D2, and D3 for the CAT events over northern China on 6 June 2017. The numbers correspond to those listed in Table 1.
Recognizing the potential impact of gravity waves on turbulence formation, it is crucial to account for the existence of complex terrains west of the CAT event region, known to generate gravity waves. In this context, we analyzed the vertical velocities at different altitudes within D3 at 0210 UTC on June 6. Figure 10a reveals the complex terrain to the west of the CAT locations and the presence of small-scale waves near the Qinling Mountains. These waves exhibited a steady presence over the Qinling Mountains, indicative of stationary mountain waves. Additionally, the wavelength gradually increased with altitude, suggesting that small-scale waves may have been reflected or absorbed within the lower troposphere. It is clear that the mountain wave is unlikely to be the potential mechanism of the observed CAT event. This is because the wave amplitudes were exceedingly weak, and the presence of the zonal wind exceeding 50 m/s upstream from the incident region at 8.9 km altitude does not offer favorable conditions for the mountain waves to break [22].

Figure 10.
Simulated horizontal wind vectors superimposed on vertical velocity (shading, m s−1) and horizontal wind direction (arrowhead) at z = (a) 2.9, (b) 5.9, and (c) 8.9 km at 0210 UTC, 6 June 2017, obtained from the WRF results in D3. Contours represent terrain heights, and the contour intervals are 300 m. Green asterisks in the plots indicate the locations of CAT events.
4. Conclusions
In the early hours of 6 June 2017, four severe turbulence events were documented in pilot reports (PIREPs) over northern China. These turbulence events occurred near 36.53° N, with flight altitudes ranging between 8.1 km and 9.5 km. Notably, an analysis of the satellite cloud images revealed that these turbulence events occurred in nearly cloudless conditions, classifying them as CAT events.
To investigate the mechanisms of these CAT events, we employed the WRF model to perform a high-resolution numerical simulation with resolutions of 27 km, 9 km, and 3 km. The simulation results accurately reproduced the atmospheric background conditions. At 200 hPa, there existed two ridges and one trough in the mid-high latitudes. There was a strong upper-level jet stream with a maximum wind speed of 61.7 m/s extending from the southwest to northeast in eastern China, which played a crucial role in CAT generation. The intensifying upper-level frontal zone was formed by a strong meridional temperature gradient through the thermal wind relationship, and upper-level frontogenesis caused strengthening of the jet stream over northern China, which finally introduced a maximized VWS (1.90 × 10⁻² s−1–2.55 × 10⁻² s−1) below the jet core. Tropopause folding led to the local Ri (0.24–0.88) becoming smaller, which triggered the KHI. We used Ri to diagnose the occurrence of CAT. For most of the CAT events, Ri was less than 1 but greater than 0.25. Ri was less than 0.25 for event 2 in D2 and D3, and Ri was greater or equal than 1 for event 3 in D1 and D2 (discussed below). This result is inconsistent with the research results of Hu et al. [42] (0.25 < Ri < 1 for CAT events), and those of Kim et al. [39] and Lee et al. [40] (Ri < 0.25 for CAT events). This suggests that 0.25 or 1 cannot be used simply as a criterion for the occurrence of CAT in real cases.
In addition, the simulation results show that the horizontal resolution of the model has no obvious dependence on the model. At the horizontal resolutions of 27 km, 9 km, and 3 km, the model can effectively simulate the upper-level front–jet system and tropopause folding related to CAT events. However, different horizontal resolutions still show some differences in diagnosis for a single point. In particular, the Ri calculation results for different resolution are completely different in event 3: Ri < 1 for 3 km, Ri = 1 for 9 km, and Ri > 1 for 27 km. The reason for this is that event 3 is located at the edge of the jet stream, where VWS and Brunt–Väisälä frequency both vary greatly in time and space. The calculation accuracy of an output from a low-resolution simulation is lower than that from a high-resolution simulation under this condition, which leads to this difference in the calculation of Ri. This is a good case for operational forecasts. We cannot simply depend on the diagnostic results, such as Ri, to determine the possibility of CAT occurrence. We also need to comprehensively consider the effects of the model resolution and surrounding weather system.
Moreover, we found a significant correlation between TKE and CAT events. This has an important implication: the current model-forecasted turbulence can be used directly instead of calculating diagnostic CAT indices. Therefore, the capability of model to simulate individual CAT depends not only on the model resolution but also on its generation mechanism. For most of the CAT processes considered, standard numerical weather prediction resolutions of tens of kilometers (such as 9 or 27 km) are adequate to capture the CAT events, given that turbulence generated by large-scale forcing is explicitly represented in the numerical simulation. Additionally, this is consistent with the conclusion of Kim et al. [39]. However, in some specific cases, it is still necessary to use high-resolution numerical simulations (such as 3 km) to calculate more accurate CAT indices (such as Ri) for CAT prediction.
The numerical experiment in this study is helpful for understanding the generation mechanism of CAT events over northern China and improving the accuracy of CAT prediction. It confirms the important role of the upper-level front–jet system and tropopause folding. However, more CAT cases that occur under various conditions need to be investigated considering the complex topography and subtropical upper-level jet streams over China.
Author Contributions
Writing—original draft preparation, R.Y.; investigation, K.L. and S.Y., supervision, H.L. All authors have read and agreed to the published version of the manuscript.
Funding
This work was supported by the State Key Program of the Joint Fund of the National Natural Science Foundation of China and the Civil Aviation Administration of China (U2033207) and the Fundamental Research Funds for the Central Universities (3122022QD12).
Institutional Review Board Statement
Not applicable.
Informed Consent Statement
Not applicable.
Data Availability Statement
The data presented in this study are available on request from the corresponding author. The data are not publicly available due to considerations of group privacy and the protection of intellectual property rights.
Conflicts of Interest
The authors declare no conflicts of interest.
References
- Chambers, E. Clear air turbulence and civil jet operations. Aeronaut. J. 1955, 59, 613–628. [Google Scholar] [CrossRef]
- Lester, P.F. Turbulence: A New Perspective for Pilots; Jeppesen Sanderson: Englewood, CO, USA, 1993; p. 212. [Google Scholar]
- Koch, S.E.; Jamison, B.D.; Lu, C.G.; Smith, T.L.; Tollerud, E.I.; Girz, C.; Wang, N.; Lane, T.P.; Shapiro, M.A.; Parrish, D.D.; et al. Turbulence and gravity waves within an upper-level front. J. Atmos. Sci. 2005, 62, 3885–3908. [Google Scholar] [CrossRef]
- Gultepe, I.; Sharman, R.; Williams, P.D.; Zhou, B.; Ellrod, G.; Minnis, P.; Trier, S.; Griffin, S.; Yum, S.S.; Gharabaghi, B.; et al. A Review of High Impact Weather for Aviation Meteorology. Pure Appl. Geophys. 2019, 176, 1869–1921. [Google Scholar] [CrossRef]
- Williams, P.D.; Joshi, M.M. Intensification of winter transatlantic aviation turbulence in response to climate change. Nat. Clim. Chang. 2013, 3, 644–648. [Google Scholar] [CrossRef]
- Williams, P.D. Increased Light, Moderate, and Severe Clear-Air Turbulence in Response to Climate Change. Adv. Atmos. Sci. 2017, 34, 576–586. [Google Scholar] [CrossRef]
- Storer, L.N.; Williams, P.D.; Joshi, M.M. Global Response of Clear-Air Turbulence to Climate Change. Geophys. Res. Lett. 2017, 44, 9976–9984. [Google Scholar] [CrossRef]
- Al-Gazzi, E.K.; Ali, E.H.; Mohammed, A.J. Performances Study of PSK and ASK Modulation Technique under Atmospheric Turbulence in FSO Communication System. Eng. Technol. J. 2024, 42, 276–287. [Google Scholar] [CrossRef]
- Dutton, J.A.; Panofsky, H.A. Clear air turbulence: A mystery may be unfolding. Science 1970, 167, 937–944. [Google Scholar] [CrossRef] [PubMed]
- Bacmeister, J.T.; Newman, P.A.; Gary, B.L.; Chan, K.R. An algorithm for forecasting mountain wave–related turbulence in the stratosphere. Weather Forecast. 1994, 9, 241–253. [Google Scholar] [CrossRef]
- Miles, J. Richardson’s criterion for the stability of stratified shear flow. Phys. Fluids 1986, 29, 3470–3471. [Google Scholar] [CrossRef]
- Dutton, M. Probability forecasts of clear-air turbulence based on numerical model output. Meteorol. Mag. 1980, 109, 293–306. [Google Scholar]
- Knox, J.A. Possible mechanisms of clear-air turbulence in strongly anticyclonic flows. Mon. Weather Rev. 1997, 125, 1251–1259. [Google Scholar] [CrossRef]
- Clark, T.L.; Hall, W.D.; Kerr, R.M.; Middleton, D.; Radke, L.; Ralph, F.M.; Neiman, P.J.; Levinson, D. Origins of aircraft-damaging clear-air turbulence during the 9 December 1992 Colorado downslope windstorm: Numerical simulations and comparison with observations. J. Atmos. Sci. 2000, 57, 1105–1131. [Google Scholar] [CrossRef]
- Basse, N.T. Modelling of vortex-induced aviation turbulence. Meteorol. Atmos. Phys. 2020, 132, 401–411. [Google Scholar] [CrossRef]
- Kaplan, M.L.; Huffman, A.W.; Lux, K.M.; Charney, J.J.; Riordan, A.J.; Lin, Y.-L. Characterizing the severe turbulence environments associated with commercial aviation accidents. Part 1: A 44-case study synoptic observational analyses. Meteorol. Atmos. Phys. 2005, 88, 129–152. [Google Scholar] [CrossRef]
- Kaplan, M.L.; Charney, J.J.; Waight, K.T.; Lux, K.M.; Cetola, J.D.; Huffman, A.W.; Riordan, A.J.; Slusser, S.D.; Kiefer, M.T.; Suffern, P.S.; et al. Characterizing the severe turbulence environments associated with commercial aviation accidents. A real-time turbulence model (RTTM) designed for the operational prediction of hazardous aviation turbulence environments. Meteorol. Atmos. Phys. 2006, 94, 235–270. [Google Scholar] [CrossRef]
- Yang, R.; Ran, L.K.; Zhang, Y.L.; Liu, Y. Analysis and Simulation of the Stratospheric Quasi-zero Wind Layer over Korla, Xinjiang Province, China. Adv. Atmos. Sci. 2019, 36, 1143–1155. [Google Scholar] [CrossRef]
- Andreassen, O.; Wasberg, C.E.; Fritts, D.C.; Isler, J.R. Gravity wave breaking in two and three dimensions: 1. Model description and comparison of two-dimensional evolutions. J. Geophys. Res.-Atmos. 1994, 99, 8095–8108. [Google Scholar]
- Lindzen, R.S. Turbulence and Stress Owing to Gravity Wave and Tidal Breakdown. J. Geophys. Res.-Oceans 1981, 86, 9707–9714. [Google Scholar] [CrossRef]
- Lane, T.P.; Sharman, R.D. Gravity wave breaking, secondary wave generation, and mixing above deep convection in a three-dimensional cloud model. Geophys. Res. Lett. 2006, 33, L23813. [Google Scholar] [CrossRef]
- Jiang, Q.F.; Doyle, J.D. Gravity wave breaking over the central Alps: Role of complex terrain. J. Atmos. Sci. 2004, 61, 2249–2266. [Google Scholar] [CrossRef]
- Doyle, J.D.; Shapiro, M.A.; Jiang, Q.F.; Bartels, D.L. Large-amplitude mountain wave breaking over Greenland. J. Atmos. Sci. 2005, 62, 3106–3126. [Google Scholar] [CrossRef]
- Lane, T.P.; Doyle, J.D.; Sharman, R.D.; Shapiro, M.A.; Watson, C.D. Statistics and Dynamics of Aircraft Encounters of Turbulence over Greenland. Mon. Weather Rev. 2009, 137, 2687–2702. [Google Scholar] [CrossRef]
- Lindzen, R.S. Thermally driven diurnal tide in the atmosphere. Q. J. R. Meteorol. Soc. 1967, 93, 18–42. [Google Scholar] [CrossRef]
- Prusa, J.M.; Smolarkiewicz, P.K.; Garcia, R.R. Propagation and breaking at high altitudes of gravity waves excited by tropospheric forcing. J. Atmos. Sci. 1996, 53, 2186–2216. [Google Scholar] [CrossRef][Green Version]
- VanZandt, T.E.; Fritts, D.C. A theory of enhanced saturation of the gravity wave spectrum due to increases in atmospheric stability. Pure Appl. Geophys. 1989, 130, 399–420. [Google Scholar] [CrossRef]
- Smith, R.B.; Skubis, S.; Doyle, J.D.; Broad, A.S.; Kiemle, C.; Volkert, H. Mountain waves over Mont Blanc: Influence of a stagnant boundary layer. J. Atmos. Sci. 2002, 59, 2073–2092. [Google Scholar] [CrossRef][Green Version]
- Smith, R.B. The influence of mountains on the atmosphere. In Advances in Geophysics; Elsevier: Amsterdam, The Netherlands, 1979; Volume 21, pp. 87–230. [Google Scholar]
- Lilly, D.K. A severe downslope windstorm and aircraft turbulence event induced by a mountain wave. J. Atmos. Sci. 1978, 35, 59–77. [Google Scholar] [CrossRef]
- Zhang, J.; Zhang, S.D.; Huang, C.M.; Huang, K.M.; Gong, Y.; Gan, Q.; Zhang, Y.H. Latitudinal and Topographical Variabilities of Free Atmospheric Turbulence From High-Resolution Radiosonde Data Sets. J. Geophys. Res.-Atmos. 2019, 124, 4283–4298. [Google Scholar] [CrossRef]
- Thorpe, S.A.; Deacon, G.E.R. Turbulence and mixing in a Scottish Loch. Philos. Trans. R. Soc. Lond. Ser. A-Math. Phys. Sci. 1977, 286, 125–181. [Google Scholar]
- Geller, M.A.; Love, P.T.; Wang, L. A Climatology of Unstable Layers in the Troposphere and Lower Stratosphere: Some Early Results. Mon. Weather Rev. 2021, 149, 1233–1245. [Google Scholar] [CrossRef]
- Ko, H.-C.; Chun, H.-Y. Potential sources of atmospheric turbulence estimated using the Thorpe method and operational radiosonde data in the United States. Atmos. Res. 2022, 265, 105891. [Google Scholar] [CrossRef]
- He, J.Y.; Chan, P.W.; Li, Q.S.; Li, L.; Zhang, L.; Yang, H.L. Observations of wind and turbulence structures of Super Typhoons Hato and Mangkhut over land from a 356 m high meteorological tower. Atmos. Res. 2022, 265, 105910. [Google Scholar] [CrossRef]
- Singh, J.; Zhang, Y.; Yuan, H.; Cao, S. Numerical generation of inflow turbulence by cell perturbation technique in WRF simulation. J. Wind Eng. Ind. Aerodyn. 2020, 206, 104395. [Google Scholar] [CrossRef]
- Wang, S.; Song, Z.; Ma, W.; Shu, Q.; Qiao, F. Mesoscale and submesoscale turbulence in the Northwest Pacific Ocean revealed by numerical simulations. Deep Sea Res. Pt. II 2022, 206, 105221. [Google Scholar] [CrossRef]
- Jaeger, E.B.; Sprenger, M. A Northern Hemispheric climatology of indices for clear air turbulence in the tropopause region derived from ERA40 reanalysis data. J. Geophys. Res.-Atmos. 2007, 112, D20106. [Google Scholar] [CrossRef]
- Kim, J.-H.; Chun, H.-Y. A Numerical Study of Clear-Air Turbulence (CAT) Encounters over South Korea on 2 April 2007. J. Appl. Meteorol. Clim. 2010, 49, 2381–2403. [Google Scholar] [CrossRef]
- Lee, D.-B.; Chun, H.-Y. A Numerical Study of Aviation Turbulence Encountered on 13 February 2013 over the Yellow Sea between China and the Korean Peninsula. J. Appl. Meteorol. Clim. 2018, 57, 1043–1060. [Google Scholar] [CrossRef]
- Kaplan, M.L.; Huffman, A.W.; Lux, K.M.; Cetola, J.D.; Charney, J.J.; Riordan, A.J.; Lin, Y.-L.; Waight, K.T., III. Characterizing the severe turbulence environments associated with commercial aviation accidents. Part 2: Hydrostatic mesoscale numerical simulations of supergradient wind flow and streamwise ageostrophic frontogenesis. Meteorol. Atmos. Phys. 2005, 88, 153–173. [Google Scholar] [CrossRef]
- Hu, B.Y.; Hui, P.H.; Ding, J.F.; Tang, J.P. Clear-Air Turbulence (CAT) Encounters on 13 November 2019 over Central and Eastern China: Numerical Simulation and Generation Mechanism. Weather Forecast. 2023, 38, 1643–1660. [Google Scholar] [CrossRef]
Disclaimer/Publisher’s Note: The statements, opinions and data contained in all publications are solely those of the individual author(s) and contributor(s) and not of MDPI and/or the editor(s). MDPI and/or the editor(s) disclaim responsibility for any injury to people or property resulting from any ideas, methods, instructions or products referred to in the content. |
© 2024 by the authors. Licensee MDPI, Basel, Switzerland. This article is an open access article distributed under the terms and conditions of the Creative Commons Attribution (CC BY) license (https://creativecommons.org/licenses/by/4.0/).