Article

Investigation of Tropical Cyclones in the North Indian Ocean and the Linkage to Extreme Weather Events over Sri Lanka

1
International Centre for Water Hazard and Risk Management (ICHARM), Public Works Research Institute (PWRI), 1-6 Minamihara, Tsukuba 305-8516, Japan
2
National Graduate Institute for Policy Studies (GRIPS), Roppongi, Minato-ku, Tokyo 106-8677, Japan
3
Faculty of Life and Environmental Sciences, University of Tsukuba, 1-1-1 Tennoudai, Tsukuba 305-8572, Japan
*
Author to whom correspondence should be addressed.
Atmosphere 2024, 15(4), 390; https://doi.org/10.3390/atmos15040390
Submission received: 26 February 2024 / Revised: 18 March 2024 / Accepted: 20 March 2024 / Published: 22 March 2024
(This article belongs to the Section Meteorology)

Abstract

:
Heavy rainfall due to tropical cyclones (TCs) in the North Indian Ocean (NIO) adversely impacts nations frequently. Though extensive research has focused on TCs in the NIO, less attention has been given to the connection between TCs and extreme events in Sri Lanka. This study examined atmospheric characteristics during sixteen extreme events, focusing on linkages between TCs, the Indian Ocean Dipole (IOD), and mechanisms behind heavy rainfall associated with TCs over Sri Lanka. The results showed that in the pre-monsoon period, TCs move northward with high water vapor (WV) content accumulated in the Southern Hemisphere. This main WV flow over the equatorial Indian Ocean (EIO) is connected with TCs, causing considerable damage in the southwestern part of Sri Lanka. During negative IOD years, strong westerly winds create cyclonic circulations on either side of the equator. Conversely, during the post-monsoon period, the IOD phase has no significant effect. TCs generally followed westward tracks, supported by winds from the Northern Hemisphere, and caused heavy rainfall in the Eastern, Northern, and Northcentral provinces in Sri Lanka. These TCs are isolated from the main WV flow over EIO. Such observed common characteristics during pre-monsoon and post-monsoon seasons are key factors contributing to extreme rainfall in Sri Lanka.

1. Introduction

Sri Lanka is an island in the North Indian Ocean (NIO). The topographical features and the surrounding ocean area strongly affect the rainfall in Sri Lanka, which has frequently been experiencing heavy rainy weather [1]. Further, being a tropical island in a disaster-prone region, Sri Lanka is vulnerable to severe weather extremes such as heavy rainfall, strong wind, and drought. Hydrometeorological hazards such as floods, flash floods, and landslides are common, especially in the southwestern part of Sri Lanka. Citizens mainly in Colombo, Kalutara, Rathnapura, and Galle districts (Figure 1) have suffered from frequent floods every year. Among the severe cyclonic storms of the past century, the Trinco-Mannar cyclone in December 1964 and the Batticaloa cyclone in November 1978 were the worst in terms of loss of lives and severe damage to infrastructure [2]. In 1964, the death toll was estimated to be over 1000, and approximately 5800 houses were destroyed. In 1978, the Batticaloa cyclone claimed 915 lives and severely damaged over 100,000 buildings [2]. Further, in May 2003, Very Severe Cyclonic Storm BOB01 did not cross the island, and its track was approximately 700 km away from the east coast [2], resulting in heavy rainfall all over the island. It deluged southwestern Sri Lanka, and floods and landslides claimed 260 lives [3].
The increasing trend of temperature in the Indian Ocean (IO) relates to the increase in extreme weather events in the region [4]. However, the seven-year running mean of tropical cyclone (TC) numbers for the period 1891–2007 shows a decreasing trend of TCs over the Bay of Bengal (BoB) [5]. Jayawardena et al. [1] found that the trends in extreme precipitation events increased at most locations in Sri Lanka and that the intensity of the rainfall also increased. The climatological annual cycle of TCs over the BoB exhibits a bimodal character [6,7,8]. TCs and low-pressure systems (LPSs) occur during two peak periods in the BoB in the NIO, namely the pre-monsoon/spring season (March to May) and the post-monsoon/fall season (October to December) [4]. The first third (1–10) of November is the most favored period of TC formation over the BoB [5,6,7,8,9] Li et al. [9] pointed out the reasons for the bimodal feature as the presence of convergence zones and convergence centers in the lower troposphere over the BoB, along with the influence of high-pressure ridges in the upper troposphere. Extensive research has been conducted on TCs in the NIO. However, the relationship between TCs and extreme weather events in Sri Lanka has received relatively less attention. The present study aimed to address this gap by examining the atmospheric characteristics during sixteen past extreme events, and the focus of the investigation was on the linkages between these events and TCs during pre-monsoon and post-monsoon periods.
Koralegedara et al. [4] revealed that continuous low-level moisture supplies from the BoB and the sustaining low-level convergence zone are the main reasons for heavy rain in May 2016. Several studies [10,11,12,13] have analyzed the two extreme rainfall events in 2018 and 2019 in Kerala, India. They pointed out that the synoptic conditions look similar in both cases and that strong low-level westerly winds over the central Arabian Sea with high low-level moisture flux and depression over the BoB directly impact the rainfall over the peninsular regions of India. Diagnostic analysis of previous studies related to India revealed that the high convective instability due to the strong westerly jet, moisture-rich mid-troposphere, and conductive vertical shear of horizontal wind were possible factors leading to localized heavy precipitation in India in the presence of a cyclonic system in the BoB. Although the losses along with the extreme rainfall due to TCs are huge in Sri Lanka, the possible factors leading to the occurrence of localized heavy precipitation have not been specifically identified. Therefore, in this study, we investigated atmospheric conditions associated with extreme events due to TCs in Sri Lanka.
Xiao-ting et al. [14] explain that there are instances of TCs during the post-monsoon season due to the higher moisture content in the mid-troposphere, while the proportion of strong cyclones is higher in pre-monsoon months as a result of the higher sea surface temperature. Further, according to Xiao-ting et al. [14], TC tracks over the BoB are classified into three categories: westward, northwestward, and northeastward. These types of TC tracks accounted for a similar proportion of about 33%. Further, Bhardwaj et al. [15] explained that there is a wide variation in the tracks observed during these two peak seasons and that most of the TCs followed the northward track in the pre-monsoon season and made landfall over the Bangladesh and Myanmar coasts. TCs of the post-monsoon season affected the entire coast of the BoB. Accordingly, this study further investigated the tracks of sixteen TCs during two seasons which caused extreme rainfall over Sri Lanka.
The Indian Ocean Dipole (IOD) is a non-regular fluctuation in sea surface temperatures, characterized by the western part of the IO warming (positive phase) and subsequently cooling (negative phase) in comparison to the eastern region near Sumatra. The IOD encompasses an irregular cycle of sea surface temperatures, transitioning through positive, neutral, and negative phases [16,17]. The IOD mode influences TC activity mainly by changing convection, low-level vorticity, and mid-level steering flows [18,19]. Yuan et al. [18] explain that when the IO is in the positive (negative) phase of the IOD, weak (strong) convection over the BoB and in the eastern Arabian Sea causes anomalous anticyclonic (cyclonic) atmospheric circulations at low levels. This is an unfavorable (favorable) condition for TC genesis and reduces (increases) TC occurrence frequencies in the NIO. The initial condition for the genesis of two cyclonic circulations on either side of the equator is a westerly wind burst over the equatorial Indian Ocean (EIO). Another important condition for twin cyclogenesis is the cloud cluster which splits into two convective clusters with independent vortices, one vortex in the Northern Hemisphere (NH) and the other one in the Southern Hemisphere (SH) [20]. This study also aims to examine the correlation between IOD years and extreme precipitation in Sri Lanka during the two seasons. Furthermore, it also explores the likelihood of substantial damage in Sri Lanka when cyclones formed in IOD years.
Many research approaches have been specific to a particular region. Few studies have investigated the synoptic and mesoscale atmospheric fields associated with extreme events in Sri Lanka. Several TCs in the NIO had a devastating effect on Sri Lanka, and detailed analyses of extreme events due to TCs are rare. This research will examine the effect of TCs and LPSs in the NIO leading to extreme weather events in Sri Lanka. Specifically, this study seeks to identify the common characteristics of selected extreme events that occurred in pre-monsoon and post-monsoon periods. The research findings are expected to contribute to a more comprehensive understanding of the relationship between TCs, the Indian Ocean Dipole (IOD), and the mechanisms behind heavy rainfall associated with TCs in Sri Lanka. This understanding will facilitate the development of effective disaster risk reduction measures. The layout of this paper is as follows: Section 2 provides a detailed description of the data and methodology used in the study. Section 3 presents the results for the pre-monsoon and post-monsoon cases. Section 4 provides the discussion, and finally, Section 5 summarizes the findings and suggests directions for future study.

2. Materials and Methods

The meteorological and oceanic factors contributing to the extreme rainfall events were studied through atmospheric and oceanic data analysis. The connection of TC occurrence with IOD mode was also studied. Extreme rainfall events that occurred in Sri Lanka in 23 years, from 2000 to 2022, were selected; reanalysis data are available for this period. Details of the selected events that occurred in the pre-monsoon period and the post-monsoon period are listed in Table 1 and Table 2. In this case study, extreme events were selected based on the number of reported victims in each event. Our selection criteria focused on cases with the highest number of victims. Therefore, these extreme events were selected mainly taking into account the damage caused due to cyclones formed in the NIO.
In this research, three types of data sources were used for the analysis. Japanese 55-year atmospheric reanalysis (JRA-55) data [22,23,24], Joint Typhoon Warning Centre (JTWC) best track data [25,26], and daily rainfall observation data from the Department of Meteorology, Sri Lanka, were used for this analysis to examine the characteristics of the atmosphere in the past extreme events.
Climate Prediction Division of Japan Meteorological Agency conducted the Japanese global atmospheric reanalysis which is JRA-55 [22]. JRA55 was chosen for this study since several studies [27,28] identified that the JRA55 provides the best wind speed estimates over Asia. This system consists of data from 1958. It includes horizontal-resolution 1.25° × 1.25° latitude/longitude grid data. To investigate the vertically integrated WV flux (IVT), zonal and meridional WV flux of the total column analysis field (anl_column125) were used. Total column analysis fields were produced by integrating the corresponding fields vertically from the bottom to the top of the atmosphere. Further, the u-component of wind and the v-component of wind of the isobaric analysis field (anl_p125) were used to analyze the low-level winds in the NIO. Also, sea level pressure was analyzed using anl_surf125. All these fields are produced every six hours at 00, 06, 12, and 18 Coordinated Universal Time (UTC).
The NIO best track data are available on the United States government website “Naval Oceanography Portal” [26], and the best track data files of TCs in the NIO from the year 1945 to 2022 can be found. The NIO covers both the BoB and Arabian Sea basins. Each best track file contains TC center locations and intensities at six-hour intervals. Information about the cyclone, including basin, annual cyclone number, warning date, latitude, longitude, maximum 1 min mean sustained 10 m wind speed in knots, minimum sea level pressure, and level of tropical cyclone development, is available. Observed daily rainfall data from the Department of Meteorology in Sri Lanka were used for this analysis. There are 23 synoptic stations and 498 daily rainfall measuring stations. The daily rainfall stations measure 24 h of rainfall at 0300 UTC each day. In synoptic stations, the measurements are taken every 3 h.
Extreme rainfall events that occurred in Sri Lanka during 2000–2022 were selected for this analysis. They were chosen mainly considering the damage caused due to the cyclone among all the TCs that occurred in the NIO. Then, the TC track, sea level pressure, low-level wind at 850 hPa, vertically integrated WV flux, and rainfall distribution were investigated in each case. Finally, the meteorological features of the TCs in pre-monsoon and post-monsoon seasons with the presence of the IOD (Table 3) and also the underlying mechanism for the heavy rainfall over the country were identified.

3. Results

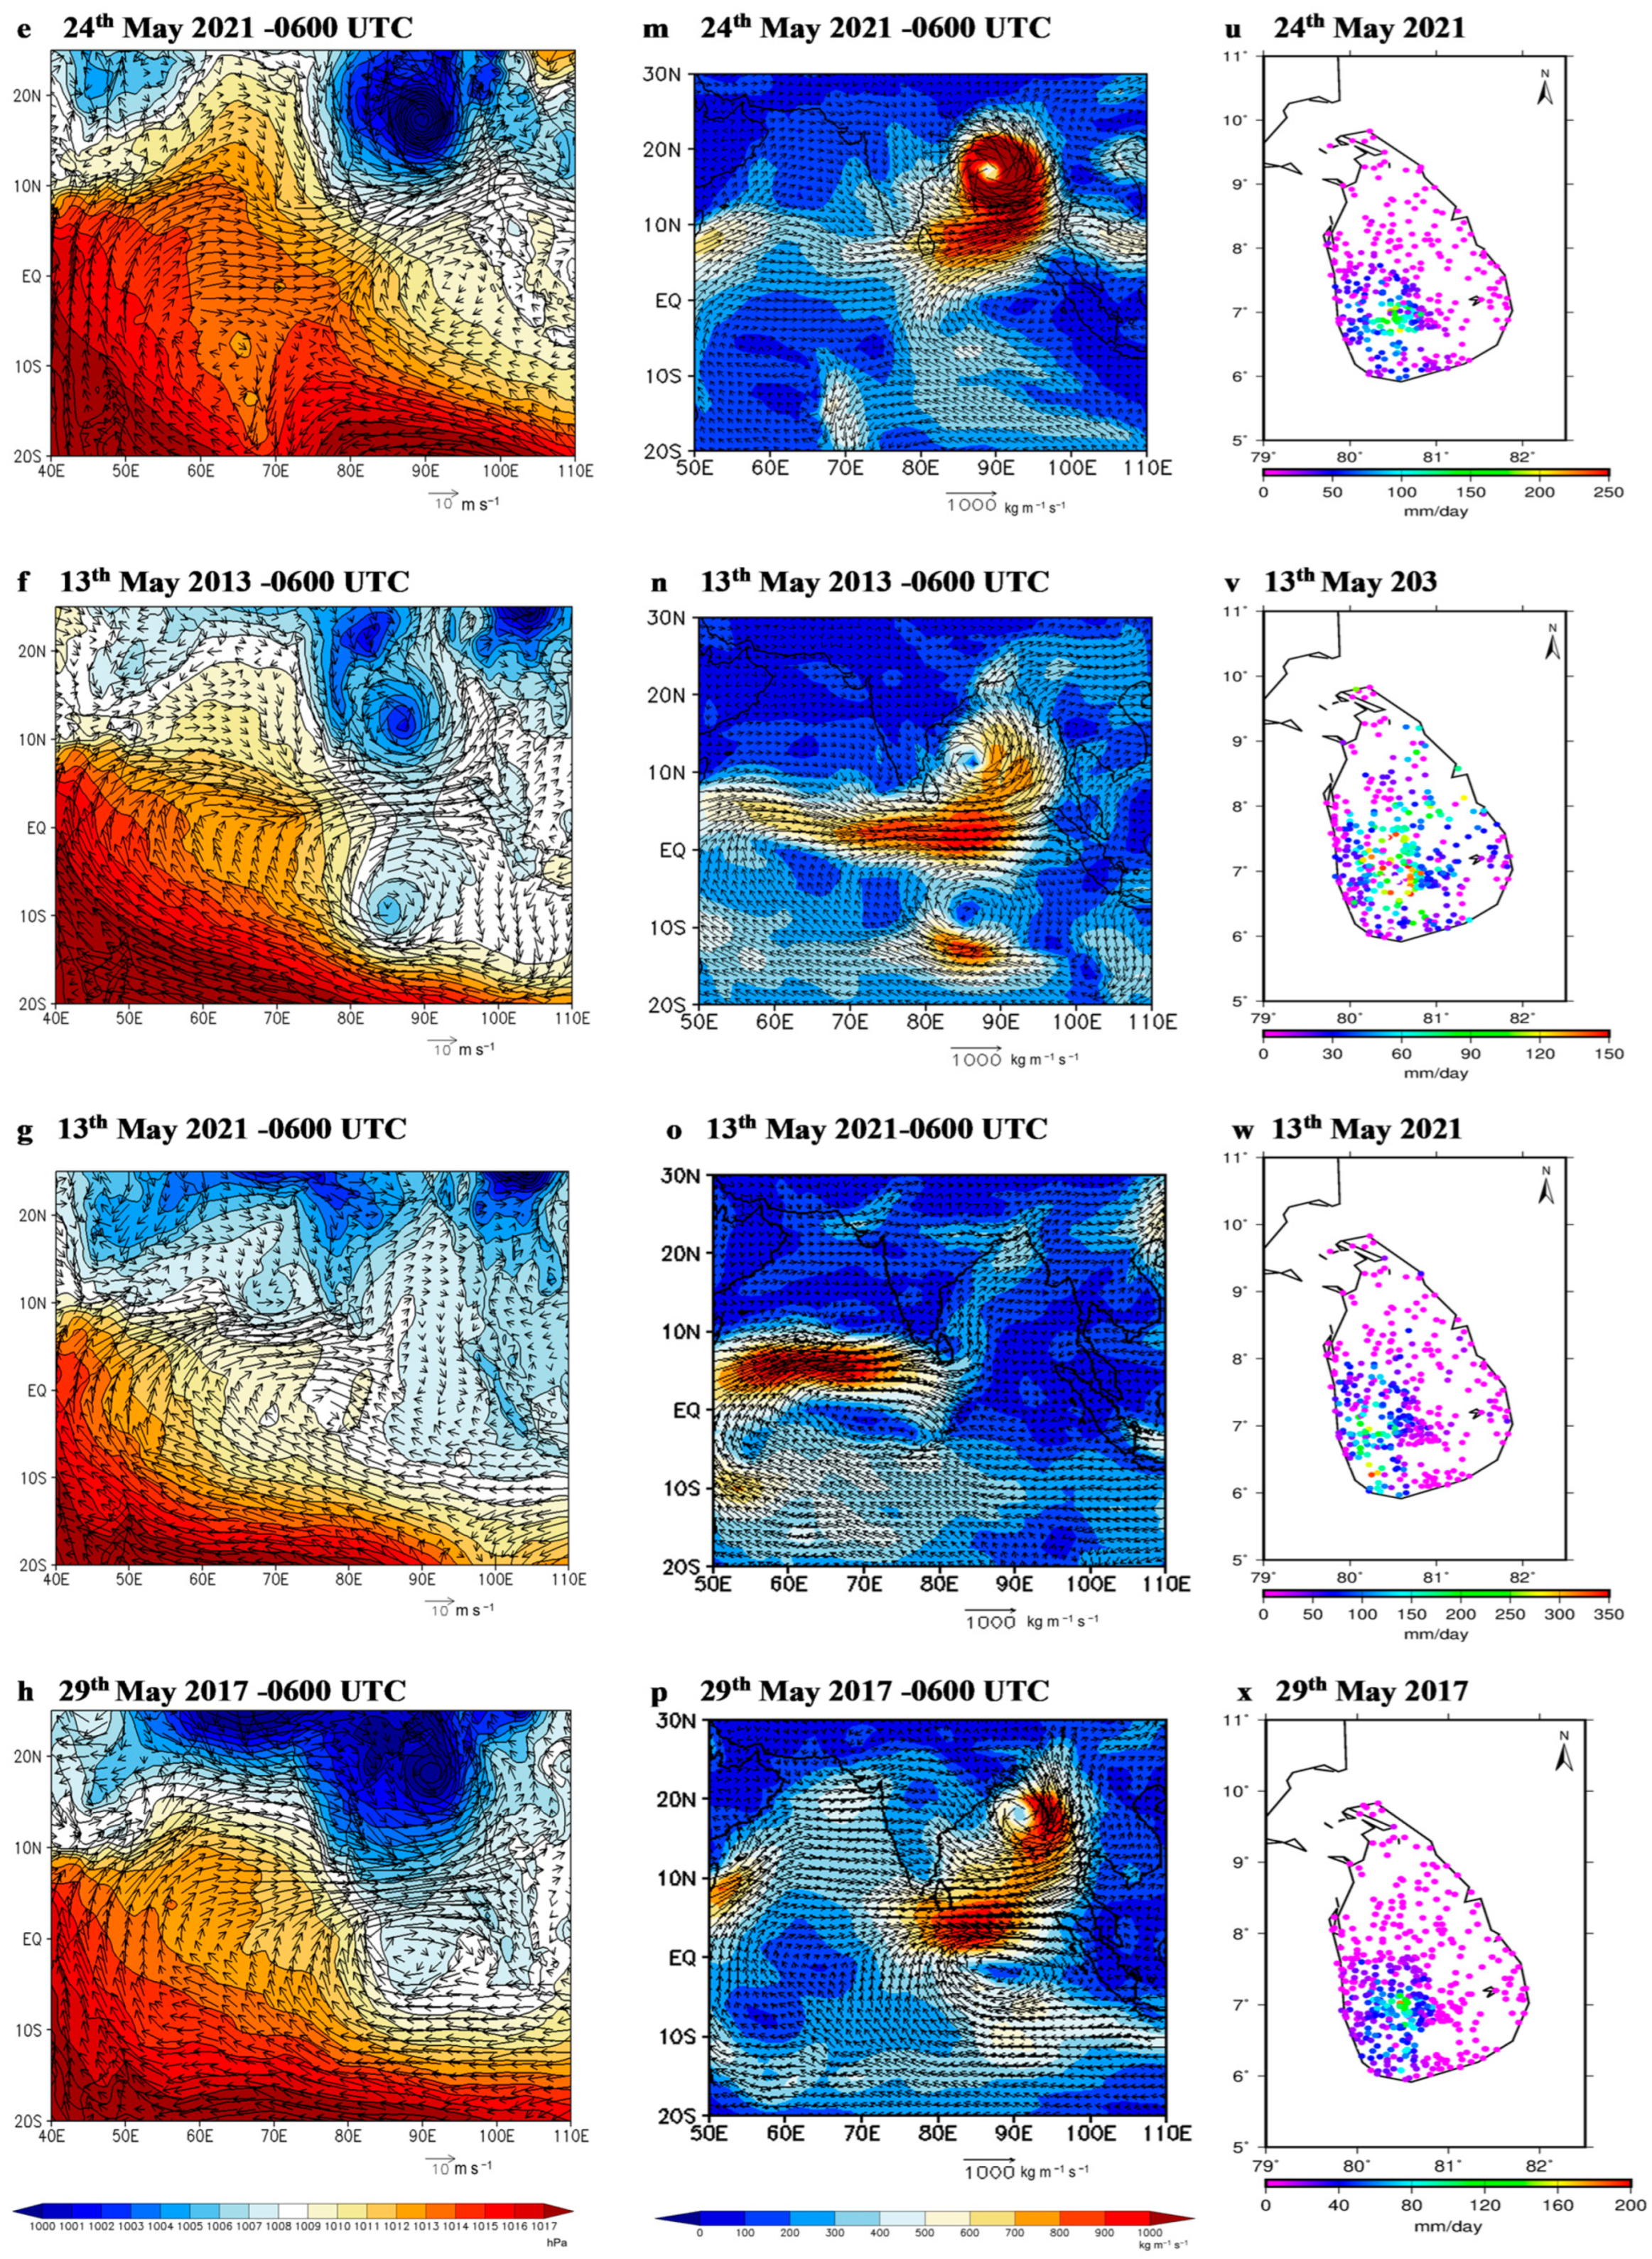
3.1. TCs in the Pre-Monsoon Period

Over the NIO, there are two peak periods known to produce TCs. The first peak period is the pre-monsoon/spring season from March to May [4]. The rainfall and wind patterns of Sri Lanka are connected with the motion of the Inter-Tropical Convergence Zone (ITCZ) during the pre-monsoon periods. In the first analysis here, eight events were selected from among all the TCs in the NIO that occurred in the pre-monsoon period, taking into account the damage caused by the cyclones. The details of the selected cyclones are given in Table 1.
Figure 2 presents the tracks of the above-mentioned cyclones which originated in the NIO. There is a high possibility of cyclone formation in the BoB during this period due to high sea surface temperature [9]. In this figure, the JTWC location data are given after the LPS concentrates into a tropical depression, and after that, the cyclones persisted for more than 5 days in the NIO (according to Table 1). Within 6–30 h time duration, these systems intensified from deep depression to a cyclonic storm. Then each cyclone traveled for 1–5 days as a cyclonic storm and/or a severe cyclonic storm and/or a super cyclonic storm. Further, these TCs followed a northward or northeastward track moving along the coast of India. The life span of these cyclones was 5–11 days due to their northward track.
Although the genesis points of these TCs were not very close to Sri Lanka, except for Cyclone Roanu (Figure 2), they caused large-scale damage to life and properties in the country due to heavy rain and strong winds (Table 1). Therefore, the atmospheric conditions of each event were investigated. In the pre-monsoon season, Southern Hemispheric moisture-rich airflow over the EIO supports the development of LPSs. These supportive winds were extended from the Somali jet stream, the main moisture supplier for South Asian rainfall [4]. Figure 3a–h explain the low-level wind pattern of the above-mentioned (Table 2) cyclonic events. Southern Hemispheric wind and wind extending from the LPS converged at the EIO, south of Sri Lanka. Meanwhile, this wind convergence area was also supported by the WV flux from the SH which passed through the long distance over the ocean. Figure 3i–p show a continuous WV supply from the SH and the LPS connected with this WV flow. In the region south of Sri Lanka, there was a notable presence of high vertically integrated WV flux, exceeding 800 kg m−1s−1. In the pre-monsoon period, the high WV region spread along the EIO within 5° S–5° N with an amount of 600–1000 kg m−1s−1. In every extreme event, this region of high WV flux moved towards Sri Lanka from the southern direction with the exception of movement from the east when the location of the LPS was close to the east coast of Sri Lanka. The direction of WV movement and wind convergence indicate the precise locations where heavy rainfall occurs in the country. Figure 3q–x exhibit the rainfall distribution over the country in these extreme weather situations. In the pre-monsoon season, high rainfall occurred in the southwestern part of the country, including Western, Sabaragamuwa, Central, and Southern provinces.
On 15 May 2016, (Figure 3i) the high WV flux region (500–600 kg m−1s−1) existed in the southern sea area close to Sri Lanka. The continuous moisture supply to the western and southern parts of the country from the LPS connected with the main WV flow resulted in heavy rain over the Southern, Western, and Sabaragamuwa provinces. Furthermore, the high WV flux region (500–600 kg m−1s−1) also moved in the eastern direction from the LPS since it is also located near the east coast. Therefore, heavy rainfall was recorded in the eastern parts of the country. The recorded highest rainfall was 375.6 mm at a rainfall station in the Kegalle district (Figure 3q). One hundred twenty-five stations recorded more than 150 mm of rainfall. The strong westerly wind over EIO and the continuous moisture supply for the western and southern parts of the country from the LPS connected with the main WV flow resulted in heavy rain over the Southern, Western, and Sabaragamuwa provinces. The wind extending from the LPS, located very close to the east coast, caused heavy rainfall in the eastern coastal area.
On 18 May 2020 (Figure 3j), the high WV flux region (600–700 kg m−1s−1) was moved by the northwesterly wind towards Southern and Sabaragamuwa provinces, and the highest recorded rainfall was 193 mm at Ratnapura. The convergence of winds in the western region of the country and the high WV region moving over the southern part of Sri Lanka were identified as the primary causes of the intense precipitation resulting from this cyclone. On 17 May 2003, cyclone BOB01 caused extensive damage in the southwestern part of the country (Table 1), and sixteen rainfall stations reported daily rainfall over 200 mm. The main reason behind this extreme precipitation was the convergence of westerly wind at low levels and the winds extending from the LPS (Figure 3c). In addition, the high WV flux region (600–700 kg m−1s−1) moving westerly over the southern part of the country (Figure 3s) intensified the rainfall in this southern part of the country. On 29 April 2019, the high WV flux region (400–500 kg m−1s−1) moved toward Sri Lanka from the west along with the main WV flow (Figure 3l), and there was a localized LP area developed on the eastern side of the country (Figure 3d). The wind flow due to this LP area was the reason for this heavy rain in the Monaragala district. The highest rainfall recorded was 105 mm and 103 mm at a station in Monaragala district. Cyclone Taukatae was formed in the Arabian Sea, and on 13 May 2021, wind convergence can be seen in the EIO due to the LPS and the westerly wind flow (Figure 3g), and the cyclone was connected with the westerly wind flow and the equatorial main WV flow (Figure 3o). This convergence of wind flows resulted in rainfall over 150 mm in several stations in Southern and Western provinces.
Figure 3m,n,p confirm a similar condition with a westerly wind burst accompanied by high WV resulting in heavy rainfall in Western, Central, Southern, and Sabaragamuwa provinces (Figure 3u,v,x). This result has revealed that there are two primary factors contributing to the extreme precipitation during the pre-monsoon season caused by cyclones: firstly, the presence of strong westerly winds that extend from the Somali jet over the EIO; secondly, the movement of the high WV flux region towards Sri Lanka which is connected with the LPS. The results suggest that these factors play a crucial role in the occurrence of intense precipitation events and should be taken into account while predicting weather patterns in the region.

Effect of IOD on TC over the Pre-Monsoon Season

The phase of IOD significantly affects the occurrence of TCs in the NIO. If the NIO is in a negative (positive) IOD phase, the frequency of occurrence of TCs is high (low) [18]. In negative IOD years, the atmospheric conditions are favorable for the development of two cyclonic circulations on either side of the equator. Table 3 presents the IOD phase since 2000. Between 2000 and 2021, significant damage was reported in Sri Lanka as a result of five cyclones, namely Roanu, Amphan, Viyaru, Taukatae, and Yaas, which developed during negative IOD years. In contrast, two cyclones formed during positive IOD years, and one cyclone emerged during neutral IOD years. Consequently, the likelihood of substantial damage in Sri Lanka appears to be notably higher when cyclones form during negative IOD years.
Table 4 presents the maximum rainfall and the IOD index [30], and Figure 4 presents the reported maximum rainfall with the IOD index during these extreme events in the pre-monsoon season. The result shows there is a strong correlation between the maximum rainfall and the IOD index in the pre-monsoon season.
The years 2013, 2016, 2020, and 2021 were negative IOD years (Table 3). In this case study, it is observed that two cyclonic circulations formed at the time of cyclones Roanu, Amphan, Viyaru, and Taukatae. Figure 3a,b,f,g present sea level pressure and wind patterns and depict the location of the cyclones and the development of twin cyclonic circulations on either side of the equator. These cyclonic systems were directly connected with the main background WV flow. Further, there was a high WV flux (>1000 kg m−1s−1) over the EIO, the continuous moisture supplier to the system. Therefore, the systems intensified from deep depression to cyclone within 6–12 h (Figure 2) and intensified further very rapidly. Further, westerlies in EIO are supported by the wind direction during negative IOD. Hence Sri Lanka experienced a high amount of rainfall over the southwestern part of the country (Figure 3q,r,v,w), which shows a strong correlation between rainfall and the IOD index.
In Table 3, it can be seen that 2017 and 2019 were positive IOD years, and on 29 April 2019, Cyclone Fani caused considerable damage in Sri Lanka. According to Figure 3d,l, two cyclonic systems did not form simultaneously on both sides of the equator, and also it is observed that less WV flux flowed over the EIO (600–700 kg m−1s−1). The equatorial westerly wind is in opposition to the easterly flow pattern typical of positive IOD conditions. Although the system was connected with the background WV flow, it was not continuously supported by the wind flow. Thus, we can observe that the system intensified slowly (Figure 2) and persisted over IO for a significant amount of time. For these reasons, it is noticed that the rainfall amount received over the country was less compared with negative and neutral IOD years (Figure 3t).
As shown in Table 3, 2003 was a neutral IOD year, and on 17 May 2003, Cyclone BOB01 caused huge damage to the country. In these neutral IOD years, the atmospheric condition for forming two cyclonic circulations on either side of the equator simultaneously was not supported. Figure 3c,k depict the wind pattern and WV flow over the IO. The analysis reveals that the system is sustained by the background WV flow, and there is a significant WV flux concentration in the EIO region (>1000 kg m−1s−1). Due to that supportive high WV flow, Sri Lanka also received a significant amount of high rainfall from this system (Figure 3s).

3.2. TCs in the Post-Monsoon Period

TCs and LPSs occur during two peak periods in the BoB region. The second peak period is the post-monsoon/fall season from October to December [4]. During the post-monsoon period, the ITCZ passes through the NIO and moves towards the SH, causing northeasterly wind flow over Sri Lanka [31]. These eight cyclones were selected by considering the highest damage caused among all the cyclones that occurred in the post-monsoon period.
This section will explain the analysis of eight extreme events that occurred in the post-monsoon period. Those extreme events occurred as a result of the cyclones discussed in Table 2. In this section, the figures illustrate the tropical cyclone tracks, sea level pressure, low-level wind at 850 hPa, WV flux, and observed daily rainfall for each case. This analysis reveals some common characteristics of these events. Figure 5 shows the tracks of the cyclones that originated in the NIO in the post-monsoon period. It is observed that these cyclones mainly follow a westward or northwestward track. Therefore, there is a high possibility of these TCs crossing Sri Lanka.
As per Figure 5, the tracks of these cyclonic storms originated in the central BoB, very close to Sri Lanka. A few of them moved westward, made landfall on Trincomalee (Figure 1), and passed over the island. As a result, heavy rainfall was recorded in the North and Northcentral provinces of Sri Lanka.
Figure 6 below presents the sea level pressure and low-level wind patterns for eight cases. During the period observed, the winds from the NH were the primary contributors to the formation of these systems in the BoB, resulting in a westerly wind flow over the EIO. It is observed that the high WV content appeared in the area of LPS and around the equator in each case. Moisture-rich air flowed from the NH and converged in the EIO. Although westerly airflow had significant WV content, the LPS was not connected with this background WV flow. The system was isolated from the moisture flow.
On 26 December 2000, Cyclone BOB06 caused extensive damage in the northern and northcentral part of the country (Table 2) due to the high WV flux region (800–1000 kg m−1s−1) from LPS moving towards Sri Lanka in the northern direction (Figure 6i). A high amount of rainfall 285.0 mm and 276.9 mm were recorded in two stations in the Vavuniya district in the Northern province. Several stations reported over 150 mm daily rainfall on 26 December due to the continuous moisture supply from this high-WV region.
Due to Cyclone Nisha, on 25 November 2008, Jaffna’s main observation center reported 389.8 mm of rainfall (Figure 6s). During that day, the highest WV flux values occurred in the BoB, over the northern half of Sri Lanka, and around the center of LPS (Figure 6k). Further, several rainfall stations in Northern and Northcentral provinces received more than 200 mm of rainfall.
On 30 October 2012, due to Cyclone Nilam, 264.5 mm was the highest rainfall recorded in a rainfall station in the Galle district, and several places recorded more than 100 mm of rainfall on that day (Figure 6t). Due to the wind convergence on the west and south coasts of Sri Lanka, the highest WV flux values occurred on the south coast of Sri Lanka. WV flux flowed (500–600 kg m−1s−1) towards the island from the north and eastern direction due to the LPS and in the southwestward direction due to the convergence region (Figure 6l). As a result of this, the Northern, Eastern, Southern, and Sabaragamuwa provinces received heavy rainfall. The genesis points of cyclones Ockhi and Maha were to the south of Sri Lanka, and they moved along the Arabian Sea. On 28 October 2019, the wind flows toward the cyclone converged near the equator. Thus, the eastern side of the country received significant precipitation from the Northern Hemispheric wind flow accompanied by WV.
Hence, in this post-monsoon period, the region of high WV flux from the LPS moved toward Sri Lanka mainly from the northern direction. The main supportive winds towards the LPS extended from the NH and passed over a vast continental area. Consequently, the wind was accompanied by less moisture. However, the Northern, Eastern, and Northwestern provinces received heavy rainfall due to the winds from the LPS with continuous moisture supply from the cyclonic system. These findings were some of the reasons behind the extreme rainfall events that occurred in Sri Lanka during these extreme cases.

Effect of IOD on TC over the Post-Monsoon Season

The years 2013, 2016, and 2020 were negative IOD years (Table 3). In post-monsoon season, the supportive winds come from the NH, and the wind pattern tends to be northwesterly. Therefore, in the post-monsoon season, the formation of two cyclonic circulations on either side of the equator is not as significant as it is in the pre-monsoon season (Figure 6b,f,g).
Further, 2000 and 2008 were neutral IOD years, and 2012, 2017, and 2019 were positive IOD years, as can be seen in Table 3. It appears that there is no notable impact of positive or neutral IOD years on post-monsoon cyclonic systems which lead to heavy rainfall in Sri Lanka. The above result is strengthened by the following correlation analysis. Table 5 presents the maximum rainfall and the IOD index [30] during the extreme events, and Figure 7 presents the reported maximum rainfall with the IOD index during these extreme events in the post-monsoon season. The result shows there is a weak correlation between the maximum rainfall and the IOD index in the post-monsoon season.

4. Discussion

This research is focused on a detailed analysis of extreme weather events in Sri Lanka due to TCs in the NIO that occurred during the two peak periods, the pre-monsoon and post-monsoon periods. An increase in the intensity and occurrence of extreme rainfall events influences total annual precipitation in Sri Lanka and may lead to many natural disasters in the country [1]. Therefore, it is highly important to study extreme events to minimize the damage caused by them in the future. Bhardwaj et al. [15] explained that there is a wide variation in the genesis locations and tracks observed during these two peak seasons and that most of the TCs followed the northward track in the pre-monsoon season and made landfall over the Bangladesh and Myanmar coasts. TCs of the post-monsoon season affected the entire coast of the BoB. This study further identified the TCs in the post-monsoon season following the westward track as likely to make landfall and bring extreme rainfall over Sri Lanka. However, TCs of the pre-monsoon season with northward-moving tracks that are not close to Sri Lanka also caused extreme rainfall. This shows that the TC track is not a major reason for extreme precipitation. According to Uddin et al. [32], the maximum TC activity was in May, October, and November in the BoB region between 1998 and 2016. However, this study confirmed the highest damage occurred and maximum rainfall was reported in Sri Lanka due to TCs during the pre-monsoon period.
Koralegedara et al. [4] found some prominent features of the event that resulted in the unprecedented heavy rainfall in May 2016, such as the continuous low-level moisture supplies from the BoB, moisture-rich westerlies from the Indian Ocean and the Arabian Sea, the sustaining low-level convergence zone that resulted from the interaction of the LPS and the westerlies, the orographic effect from the Central Mountains of Sri Lanka, and the locally enhanced deep convection together with a strong vertical motion. This study’s results also indicated that strong westerly winds at sea level extending from the SH Somali jet wind were the continuous moisture supplier to the BoB region. As a result of that, the BoB area exhibited high water vapor content. Further, the selected cyclones formed in the pre-monsoon period exhibited these prominent features which led to heavy unexpected precipitation. Moreover, Yuan et al. [18] explained the strong twin cyclones formed in negative IOD years, which increase the cyclone genesis frequency in the NIO. This study’s results confirmed that there were two cyclonic circulations formed concurrently on both sides of the equator in negative IOD years in the pre-monsoon season. Furthermore, there is a strong correlation between the IOD index and maximum rainfall in the pre-monsoon season. Westerlies in EIO are supported by the wind direction during negative IOD. Hence the likelihood of substantial damage in Sri Lanka appears to be notably higher when cyclones form during negative IOD years. In contrast, there is a weak correlation between the IOD index and maximum rainfall during the post-monsoon season. The wind pattern and main WV flow are weakly supported by the wind form due to negative IOD in the post-monsoon season, indicating less likelihood of heavy rainfall. The positive IOD phase does not significantly impact cyclones formed in these seasons. Consequently, we found that the correlation between the IOD index and maximum rainfall is very different in the pre-monsoon and post-monsoon seasons due to the effective enhancement of moisture transport only in the negative IOD phase in the pre-monsoon period.

5. Conclusions

This study is the first trial of a detailed analysis of sixteen heavy rainfall events in Sri Lanka. It identifies the characteristics of the atmosphere flow pattern during extreme rainfall events by analyzing past extreme events through case studies, focusing on the TCs that occurred during the two peak rainfall periods, the pre-monsoon and post-monsoon periods. An understanding of the pattern of atmospheric flow over the country and the surrounding oceanic area is essential to efforts to mitigate the damage caused by extreme rainfall events. It is also heavily influential for the agriculture, fisheries, and tourism industries, as well as water resource management. A schematic overview summary of the results of the analysis is shown in Figure 8.
As per Figure 8, the following conclusions can be drawn regarding the selected cyclones formed in the pre-monsoon period and their prominent features:
  • Strong westerly winds at sea level extending from the Southern Hemispheric Somali jet wind (from the vast ocean area) were the continuous moisture supplier to the BoB region. As a result, the BoB area exhibited high WV content.
  • The airflow with high WV content came mainly from the SH, and this background WV flow connected with the LPS which contributed to the rapid development of the system. These cyclones followed a northward track with wind flowing across Sri Lanka in a southwesterly to southerly direction. As a result, heavy rainfall and extensive damage occurred in the southwestern part of the country.
  • In negative IOD years, cyclonic circulations form on either side of the equator and develop rapidly.
  • There is a strong correlation between the IOD index and maximum rainfall. In negative IOD years or neutral IOD years, high WV concentration in the EIO region supports the continuous moisture supply for the system, resulting in a significant amount of high rainfall over Sri Lanka.
Furthermore, the selected cyclones formed in the post-monsoon period exhibited the following prominent features:
  • Most TCs followed a westward track and were likely to make landfall in Sri Lanka.
  • Supportive winds and the WV for the LPS came from NH (from the continental area), and the LPS was isolated from the background WV flow. High damage was recorded in the Eastern, Northern, and Northcentral provinces during this period.
  • There is a weak correlation between the IOD phase and the maximum rainfall. The cyclone system is not significantly affected by the IOD phase that leads to heavy rain over Sri Lanka.
Although the genesis point and the track of the cyclones were not close to Sri Lanka in the pre-monsoon season, heavy rainfall was observed in south and central Sri Lanka and resulted in flooding, landslides, and flash floods. This wind flow helps to create a southwesterly wind flow over the country and the onset of the Southwest Monsoon. This information will be of use in early preparation for the Southwest Monsoon as it will signal heavy rainfall on the southwest side of the country at the onset of the monsoon.
The results of our analysis provide a foundation understanding of large-scale atmospheric flow patterns that cause disastrous rainfall in Sri Lanka in the pre-monsoon and post-monsoon seasons during the IOD phase. The accurate and location-specific information on heavy rainfall is very useful for meteorological organizations, disaster management authorities, agriculture, water resource management, and the local community in Sri Lanka as it plays a crucial role in mitigating risks, planning, and response activities in various sectors. Weather predictions of heavy rainfall play a significant role in decision-making across various sectors, thereby influencing the resilience of society and economic activities. This information is essential in ensuring preparedness and taking appropriate measures to mitigate the impact of such events. This study demonstrates how heavy rainfall systems develop as a result of an extraordinarily large WV supply in the presence of a TC in the NIO. The result will give weather forecasters early notice of pending dangerous conditions The position of the large WV flux may be critical for the climate in Sri Lanka. It is important to study the relationship between WV flux and heavy rainfall simulated by a numerical weather prediction model. Additionally, a study can explore how the dynamics of this relationship may evolve in the context of future climatic conditions after global warming. Large ensemble climate data like the “Japanese Database for Policy Decision-making for Future Climate Change (d4PDF)” with more than 5000 years of past and future climate conditions can be used for a robust result.

Author Contributions

Conceptualization, data curation, formal analysis, S.J.; methodology, S.J., T.U. and Y.K.; software, S.J. and T.U.; resources, T.U.; writing—original draft preparation, S.J.; writing—review and editing, T.U., M.R. and Y.K.; supervision, T.U. and M.R. All authors have read and agreed to the published version of the manuscript.

Funding

This research received no external funding.

Institutional Review Board Statement

Not applicable.

Informed Consent Statement

Not applicable.

Data Availability Statement

The observational best tracks are openly available on the JTWC website https://www.metoc.navy.mil/jtwc/jtwc.html?north-indian-ocean (accessed on 25 February 2024). Observed rainfall data will be made available on request. The JRA-55 data were collected and provided under the Data Integration and Analysis System (DIAS), which was developed and operated by a project supported by the Ministry of Education, Culture, Sports, Science, and Technology, available on the website http://search.diasjp.net/en/dataset/JRA55 [33] (accessed on 21 January 2023).

Acknowledgments

This work was supported by the Public Work Research Institute (PWRI), Tsukuba, Japan. The authors would like to thank the Department of Meteorology, Sri Lanka, for providing data. Also, we are thankful for the Project for Human Resource Development Scholarship (JDS) by Japanese Grant Aid (No. B0012020LKA001). We also acknowledge Lawrie Hunter (Center for Professional Communication, GRIPS) for academic writing and editing support.

Conflicts of Interest

The authors declare no conflicts of interest.

Abbreviations

The following abbreviations are used in this manuscript:
TCTropical cyclone
NIONorth Indian Ocean
IODIndian Ocean Diploe
WVWater vapor
EIOEquatorial Indian Ocean
IOIndian Ocean
LPSLow-pressure system
BoBBay of Bengal
NHNorthern Hemisphere
SHSouthern Hemisphere
JRA55Japanese 55-Year Reanalysis
JTWCJoint Typhoon Warning Center
IVTVertically integrated water vapor transport
UTCCoordinated Universal Time
ITCZInter-Tropical Convergence Zone

References

  1. Jayawardena, I.M.S.P.; Darshika, D.W.T.T.; Herath, H.M.R.C. Recent Trends in Climate Extreme Indices over Sri Lanka. Am. J. Clim. Chang. 2018, 7, 586–599. [Google Scholar] [CrossRef]
  2. Srisangeerthanan, S.; Lewangamage, C.; Wickramasuriya, S.S. Tropical Cyclone Damages in Sri Lanka. Wind Eng. JAWE 2015, 40, 294–302. [Google Scholar] [CrossRef]
  3. Crisis Report—Sri Lanka Flood Update 22 May 2003—Sri Lanka|ReliefWeb. Available online: https://reliefweb.int/report/sri-lanka/crisis-report-sri-lanka-flood-update-22-may-2003 (accessed on 5 February 2024).
  4. Koralegedara, S.B.; Lin, C.-Y.; Sheng, Y.-F. Numerical Analysis of the Mesoscale Dynamics of an Extreme Rainfall and Flood Event in Sri Lanka in May 2016. J. Meteorol. Soc. Jpn. Ser II 2019, 97, 821–839. [Google Scholar] [CrossRef]
  5. Mahala, B.K.; Nayak, B.K.; Mohanty, P.K. Impacts of ENSO and IOD on Tropical Cyclone Activity in the Bay of Bengal. Nat. Hazards 2015, 75, 1105–1125. [Google Scholar] [CrossRef]
  6. Camargo, S.J.; Wheeler, M.C.; Sobel, A.H. Diagnosis of the MJO Modulation of Tropical Cyclogenesis Using an Empirical Index. J. Atmos. Sci. 2009, 66, 3061–3074. [Google Scholar] [CrossRef]
  7. Yanase, W.; Satoh, M.; Taniguchi, H.; Fujinami, H. Seasonal and Intraseasonal Modulation of Tropical Cyclogenesis Environment over the Bay of Bengal during the Extended Summer Monsoon. J. Clim. 2012, 25, 2914–2930. [Google Scholar] [CrossRef]
  8. Li, Z.; Li, T.; Yu, W.; Li, K.; Liu, Y. What Controls the Interannual Variation of Tropical Cyclone Genesis Frequency over Bay of Bengal in the Post-monsoon Peak Season? Atmos. Sci. Lett. 2016, 17, 148–154. [Google Scholar] [CrossRef]
  9. Li, Y.; Qian, C.; Fan, X.; Liu, B.; Ye, W.; Lin, J. Impact of Tropical Cyclones over the North Indian Ocean on Weather in China and Related Forecasting Techniques: A Review of Progress. J. Meteorol. Res. 2023, 37, 192–207. [Google Scholar] [CrossRef]
  10. George, B.; Kutty, G. Sensitivity Analysis Applied to Two Extreme Rainfall Events over Kerala Using TIGGE Ensembles. Meteorol. Atmos. Phys. 2022, 134, 22. [Google Scholar] [CrossRef]
  11. Viswanadhapalli, Y.; Srinivas, C.V.; Basha, G.; Dasari, H.P.; Langodan, S.; Venkat Ratnam, M.; Hoteit, I. A Diagnostic Study of Extreme Precipitation over Kerala during August 2018. Atmos. Sci. Lett. 2019, 20, e941. [Google Scholar] [CrossRef]
  12. Vijaykumar, P.; Abhilash, S.; Sreenath, A.V.; Athira, U.N.; Mohanakumar, K.; Mapes, B.E.; Chakrapani, B.; Sahai, A.K.; Niyas, T.N.; Sreejith, O.P. Kerala Floods in Consecutive Years—Its Association with Mesoscale Cloudburst and Structural Changes in Monsoon Clouds over the West Coast of India. Weather Clim. Extrem. 2021, 33, 100339. [Google Scholar] [CrossRef]
  13. Mohandas, S.; Francis, T.; Singh, V.; Jayakumar, A.; George, J.P.; Sandeep, A.; Xavier, P.; Rajagopal, E.N. NWP Perspective of the Extreme Precipitation and Flood Event in Kerala (India) during August 2018. Dyn. Atmos. Oceans 2020, 91, 101158. [Google Scholar] [CrossRef]
  14. Xiao-ting, F.; Ying, L.; Ai-min, L.; Long-sheng, L. Statistical and Comparative Analysis of Tropical Cyclone Activity over the Arabian Sea and Bay of Bengal (1977–2018). J. Trop. Meteorol. 2020, 26, 441–452. [Google Scholar] [CrossRef]
  15. Bhardwaj, P.; Singh, O. Climatological Characteristics of Bay of Bengal Tropical Cyclones: 1972–2017. Theor. Appl. Climatol. 2020, 139, 615–629. [Google Scholar] [CrossRef]
  16. Saji, N.H.; Goswami, B.N.; Vinayachandran, P.N.; Yamagata, T. A Dipole Mode in the Tropical Indian Ocean. Nature 1999, 401, 360–363. [Google Scholar] [CrossRef] [PubMed]
  17. Ueda, H. Equatorial Monsoon System as Regulation for a Dipole Mode in the Indian Ocean. Pap. Meteorol. Geophys. 2001, 51, 147–154. [Google Scholar] [CrossRef]
  18. Yuan, J.; Cao, J. North Indian Ocean Tropical Cyclone Activities Influenced by the Indian Ocean Dipole Mode. Sci. China Earth Sci. 2013, 56, 855–865. [Google Scholar] [CrossRef]
  19. Behera, S.K.; Doi, T.; Ratnam, J.V. 5—Air–Sea Interactions in Tropical Indian Ocean: The Indian Ocean Dipole. In Tropical and Extratropical Air-Sea Interactions; Behera, S.K., Ed.; Elsevier: Amsterdam, The Netherlands, 2021; pp. 115–139. ISBN 978-0-12-818156-0. [Google Scholar]
  20. Congwen, Z.; Nakazawa, T.; Jianping, L. Modulation of Twin Tropical Cyclogenesis by the MJO Westerly Wind Burst during the Onset Period of 1997/98 ENSO. Adv. Atmos. Sci. 2003, 20, 882–898. [Google Scholar] [CrossRef]
  21. Situation Reports. Available online: https://www.dmc.gov.lk/index.php?option=com_dmcreports&view=reports&report_type_id=1&Itemid=273&lang=en (accessed on 5 February 2024).
  22. Kobayashi, S.; Ota, Y.; Harada, Y.; Ebita, A.; Moriya, M.; Onoda, H.; Onogi, K.; Kamahori, H.; Kobayashi, C.; Endo, H.; et al. The JRA-55 Reanalysis: General Specifications and Basic Characteristics. J. Meteorol. Soc. Jpn. Ser. II 2015, 93, 5–48. [Google Scholar] [CrossRef]
  23. JRA-55_handbok_TL319_en.Pdf. Available online: https://jra.kishou.go.jp/JRA-55/document/JRA-55_handbook_TL319_en.pdf (accessed on 25 February 2024).
  24. Japan Meteorological Agency/Japan JRA-55: Japanese 55-Year Reanalysis, Daily 3-Hourly and 6-Hourly Data 2013, 86.806 Tbytes. Available online: https://rda.ucar.edu/datasets/ds628.0/ (accessed on 25 February 2024).
  25. Chu, J.-H.; Sampson, C.R.; Levine, A.S.; Fukada, E. The Joint Typhoon Warning Center Tropical Cyclone Best-Tracks, 1945–2000. Ref NRLMR7540-02-16. Available online: http://www.usno.navy.mil/NOOC/nmfc-ph/RSS/jtwc/best_tracks/TC_bt_report.html (accessed on 12 December 2022).
  26. Joint Typhoon Warning Center (JTWC). Available online: https://www.metoc.navy.mil/jtwc/jtwc.html?north-indian-ocean (accessed on 25 February 2024).
  27. Miao, H.; Dong, D.; Huang, G.; Hu, K.; Tian, Q.; Gong, Y. Evaluation of Northern Hemisphere Surface Wind Speed and Wind Power Density in Multiple Reanalysis Datasets. Energy 2020, 200, 117382. [Google Scholar] [CrossRef]
  28. Das, A.; Baidya Roy, S. JRA55 Is the Best Reanalysis Representing Observed Near-Surface Wind Speeds over India. Atmos. Res. 2024, 297, 107111. [Google Scholar] [CrossRef]
  29. Historical ENSO Events. Available online: https://ds.data.jma.go.jp/tcc/tcc/products/elnino/iodevents.html (accessed on 10 April 2023).
  30. Indian Ocean Dipole (IOD) Index Vital Signs. Available online: https://sealevel.jpl.nasa.gov/data/vital-signs/indian-ocean-dipole (accessed on 25 February 2024).
  31. Ranasinghe, E.M.S. Meteorological Setting of Sri Lanka. Available online: http://archive.cmb.ac.lk:8080/research/bitstream/70130/3804/1/emsr.pdf (accessed on 5 September 2023).
  32. Uddin, M.J.; Li, Y.; Cheung, K.K.; Nasrin, Z.M.; Wang, H.; Wang, L.; Gao, Z. Rainfall Contribution of Tropical Cyclones in the Bay of Bengal between 1998 and 2016 Using TRMM Satellite Data. Atmosphere 2019, 10, 699. [Google Scholar] [CrossRef]
  33. DIAS Dataset Search and Discovery. Available online: https://search.diasjp.net/en (accessed on 25 February 2024).
Figure 1. Administrative provinces and district map of Sri Lanka.
Atmosphere 15 00390 g001
Figure 2. Track of the TCs (1. BOB01; 2. Viyaru; 3. Roanu; 4. Mora; 5. Fani; 6. Amphan; 7. Taukatae; 8. Yaas). Colored points indicate the six-hourly positions of the system, and the color of the point indicates the TC category. Grey circles denote depressions, green circles denote deep depressions, red circles denote cyclonic storms, blue circles denote severe cyclonic storms, and magenta circles denote super cyclonic storms.
Atmosphere 15 00390 g002
Figure 3. (ah) The sea level pressure (shading, hPa), low-level wind at 850 hPa level (vectors, m s−1). (ip) Vertically integrated WV flux (shading, kg m−1s−1). Arrows indicate IVT vector (kg m−1 s−1). (qx) Daily rainfall (mm). Point values indicate the rainfall station.
Atmosphere 15 00390 g003aAtmosphere 15 00390 g003b
Figure 4. The maximum rainfall with IOD index in each event in the pre-monsoon season.
Atmosphere 15 00390 g004
Figure 5. Track of the TCs (1. BOB06; 2. Nisha; 3. Nilam; 4. Nada; 5. Ockhi; 6. Maha; 7. Burevi; 8. Madi). Colored points indicate the six-hourly positions of the system, and the color of the point indicates the TC category. Grey circles denote depressions, green circles denote deep depressions, red circles denote cyclonic storms, blue circles denote severe cyclonic storms, and magenta circles denote super cyclonic storms.
Atmosphere 15 00390 g005
Figure 6. (ah) The sea level pressure (shading, hPa), low-level wind at 850 hPa level (vectors, m s−1). (ip) Vertically integrated WV flux (shading, kg m−1s−1). Arrows indicate IVT vector (kg m−1 s−1). (qx) Daily rainfall (mm). Point values indicate the rainfall station.
Atmosphere 15 00390 g006aAtmosphere 15 00390 g006b
Figure 7. The maximum rainfall with IOD index in each event in the post-monsoon season.
Atmosphere 15 00390 g007
Figure 8. Schematic presentation of an overview summary of the analysis results in (a) the pre-monsoon period and (b) the post-monsoon period. Shading and blue arrows denote the background WV flow and the WV transport. The arrows with broken lines indicate the TC tracks.
Atmosphere 15 00390 g008
Table 1. Details of the selected events that occurred in the pre-monsoon period [21].
TC NameYear and IOD PhaseDurationMinimum Sea
Level Pressure (hPa)
Maximum Wind
Speed (km/h)
Damage
BOB 01 2003
Neutral
10 May 2003–
20 May 2003
980 140254 deaths, 24,750 houses damaged, 800,000 people affected
Mora 2017
Positive
28 May 2017–
31 May 2017
978 110203 deaths, 96 missing; affected 588,082 in 153,303 families
Viyaru 2013
Negative
10 May 2013–
17 May 2013
990 85 16 deaths
Roanu 2016
Negative
15 May 2016–
22 May 2016
983 85 204 deaths
displaced over 134,000
Amphan 2020
Negative
16 May 2020–
21 May 2020
920 2405 deaths; it affected 2,000 people; over 500 houses were damaged
Tauktae 2021
Negative
14 May 2021–
19 May 2021
950 1855 deaths; 48,300 people (12,177 families) affected
Yaas 2021
Negative
23 May 2021–
28 May 2021
974120 4 deaths; it affected 42,000 people; over 200 houses were damaged
Fani 2019
Positive
26 April 2019–
4 May 2019
932 2153 deaths; affected 5885 people in 1515 families; over 1137 houses were damaged
Table 2. Details of the selected events that occurred in the post-monsoon period [21].
TC NameYear
and
IOD Phase
DurationMinimum Sea
Level Pressure (hPa)
Maximum
Wind Speed (km/h)
Damage
BOB 06 2000
Neutral
23 December 2000–28 December 20009701659 deaths; 500,000 people were affected; damaged 480 houses and wrecked 95 fishing boats
Ockhi 2017
Positive
28 November 2017–5 December 201797615513 deaths; displaced 200,000
Nada 2016
Negative
29 November 2016–2 December 201610007512 deaths
Burevi2020
Negative
29 November 2020–5 December 2020996856 deaths; 3586 houses were damaged and a total of 95,734 persons were affected
Madi 2013
Negative
5 December 2013–12 December 20139861205 deaths
Nisha 2008
Neutral
24 November 2008–29 November 20089968515 deaths; displaced about 90,000 people
Nilam 2012
Positive
27 October 2012–11 November 20129878510 deaths; 4627 people were displaced
Maha 2019
Positive
28 October 2019–11 November 20199561851 death; 771 houses were damaged and 20,976 people were affected in 5427 families
Table 3. Historical IOD events observed since 2000 [29].
Positive IOD years2006, 2007, 2012, 2015, 2017, 2018, 2019
Negative IOD years2005, 2010,2013, 2016, 2020, 2021, 2022
Neutral IOD years2000, 2001, 2002, 2003, 2004, 2008, 2009, 2011, 2014
Table 4. IOD index and the maximum rainfall during events in the pre-monsoon.
DateIOD IndexMax. Rainfall
17 May 2003−1.05521
13 May 2013−1.20409.1
15 May 2016−0.30375.6
24 May 2021-0.60332.2
13 May 2021−0.30222
18 May 20200.24193.3
29 May 2017−0.70289.5
29 April 20190.18105.5
Correlation Coefficient−0.84
Table 5. IOD index and the maximum rainfall during events the post-monsoon.
DateIOD IndexMax. Rainfall
02 December 2020−0.87392
25 November 2008−0.94389.8
12 December 2013−0.47108.8
29 November 2017−0.95289.5
26 December 2000−1285
30 October 2012−0.03264.5
28 October 20192.74137.2
01 December 2016−1.7674.9
Correlation Coefficient−0.24
Disclaimer/Publisher’s Note: The statements, opinions and data contained in all publications are solely those of the individual author(s) and contributor(s) and not of MDPI and/or the editor(s). MDPI and/or the editor(s) disclaim responsibility for any injury to people or property resulting from any ideas, methods, instructions or products referred to in the content.

